Research: NIH peer review percentile scores are poorly predictive of grant productivity
- University of Washington School of Medicine, United States
- Albert Einstein College of Medicine, United States
- Johns Hopkins Bloomberg School of Public Health, United States
Figures
Figure 1 with 1 supplement
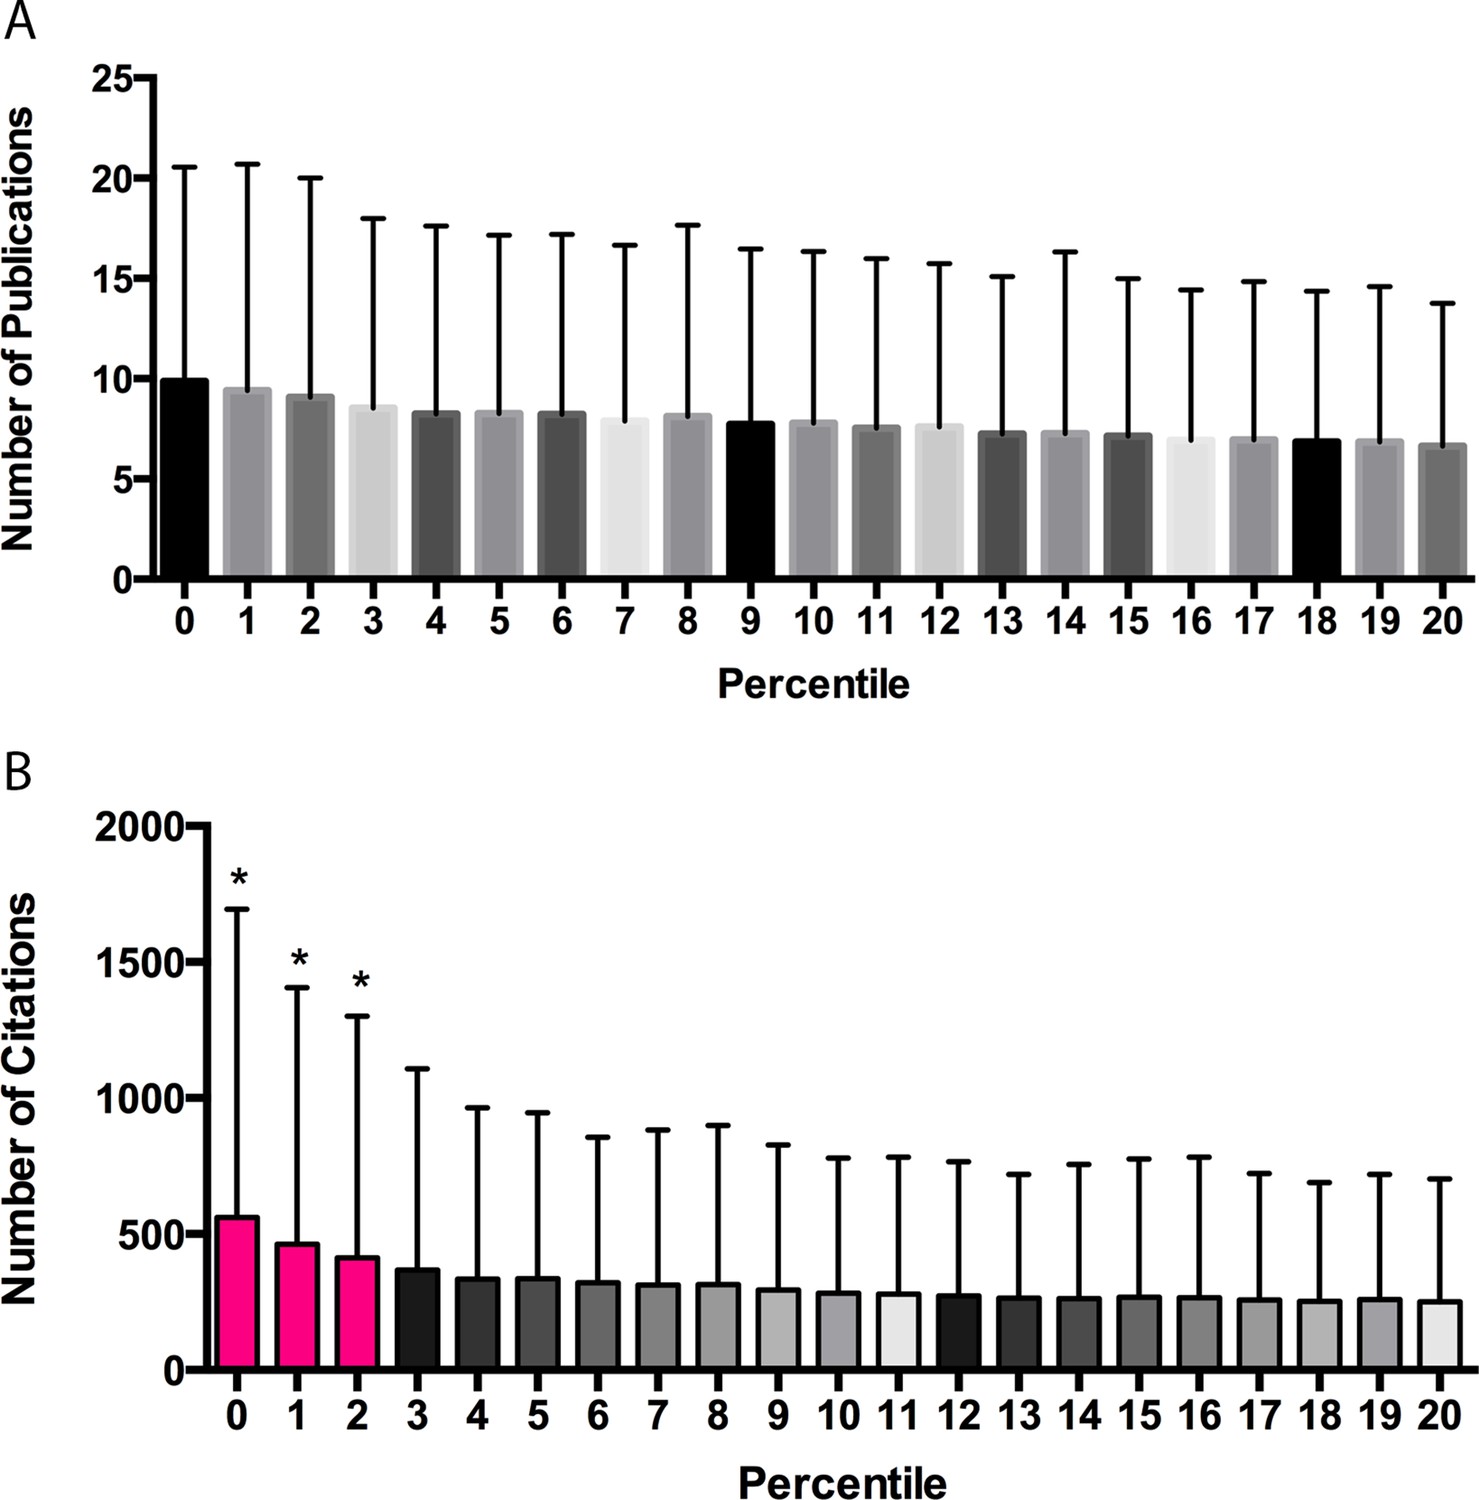
Publication and citation productivity in relation to percentile score.
(A) The number of publications acknowledging support from grants within five years of grant approval (from PubMed) versus the percentile score: the bar shows the mean number of publications for all grants with that percentile score. (B) The number of citations that the papers in (A) received until the end of 2013 (data from Web of Science) versus the percentile score: the bar shows the mean number of citations for all grants with that percentile score. The lowest percentile scores are the most favorable. n = 102,740. Error bars = SDM. *Pink bars indicate significantly different from all cohorts of grants receiving poorer scores by one-way ANOVA. Black and gray bars do not differ significantly from their neighbors and are shown in different shades to allow easier visualization.
Figure 1—figure supplement 1
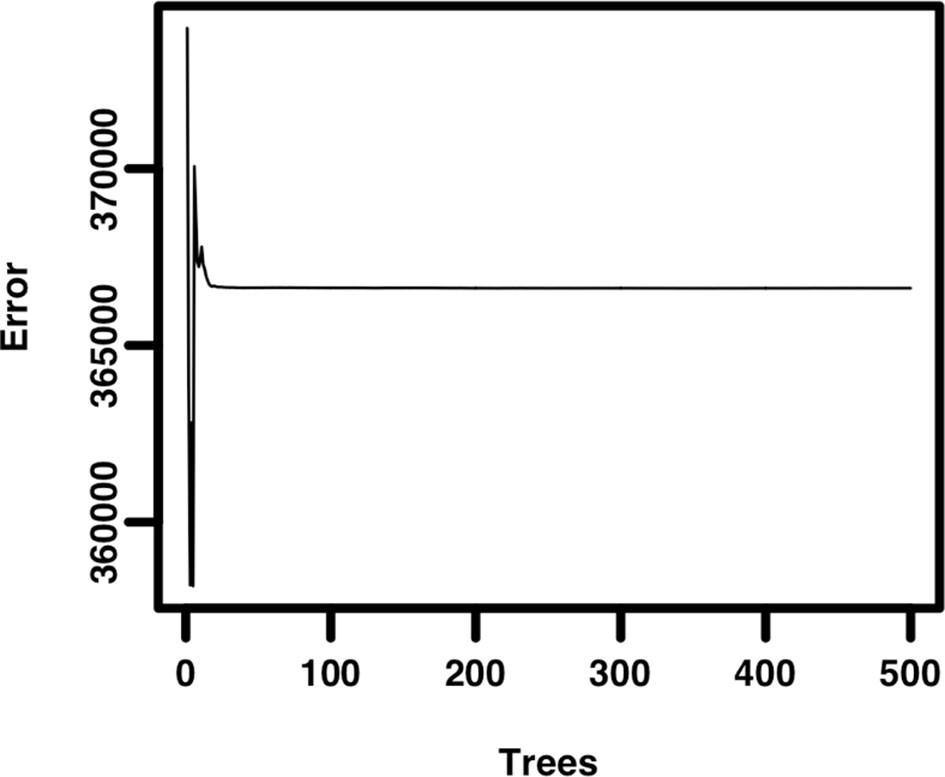
Random forest model of grant percentile score as a predictor of citation productivity.
A non-parametric model was constructed with 500 trees to measure grant percentile score as a predictor of citation productivity. The results indicate that 0.98% of variance in productivity can be accounted for by percentile score. The mean of squared residuals converges to 366,620.
Figure 2
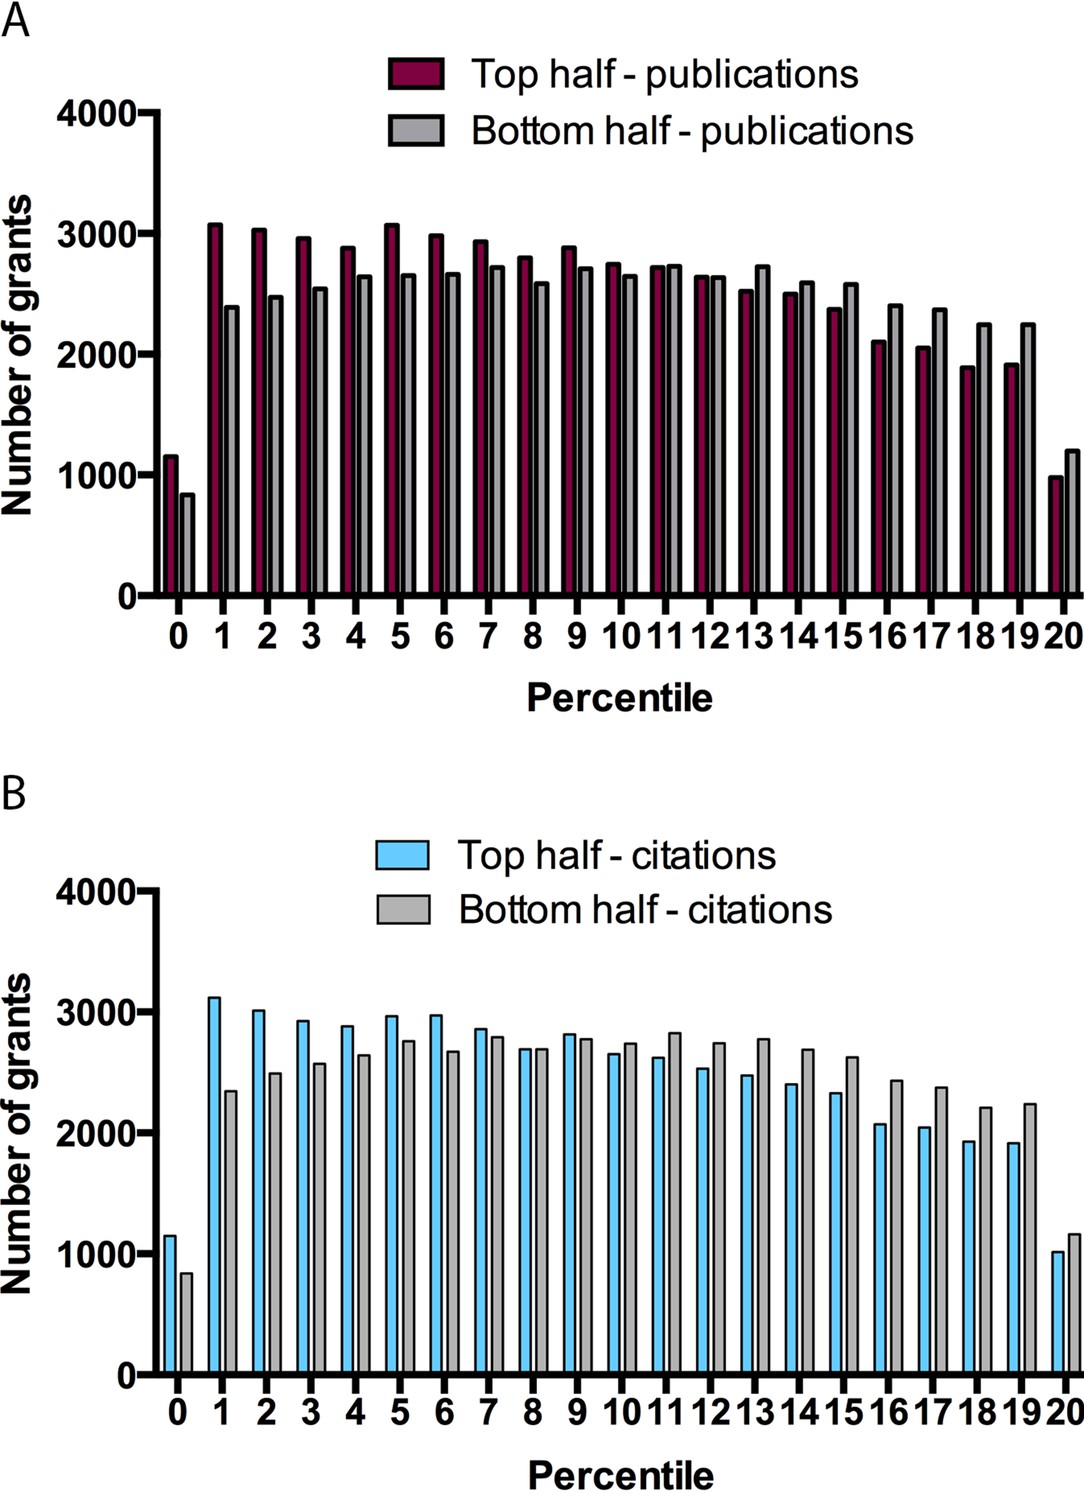
Grants stratified on the basis of publication and citation productivity for different percentile scores.
Graphs showing, for percentile scores of 20 or better, the number of grants in the top half (left bar) and bottom half (right right) of grants on the basis of publications (A) and citations (B). Grants in the top half on the basis of publication productivity (A) had ≥ 6 publications: mean percentile score of top half 9.244 ± 5.583, median 9; mean percentile score of bottom half 9.947 ± 5.612, median 10. Grants in the top half on the basis of citation productivity (B) had ≥ 128 citations: mean percentile score of top half 9.242 ± 5.625, median 9; mean percentile score of bottom half 9.939 ± 5.571, median 10. Fewer grants received a percentile score of zero as a result of rounding to the nearest whole number, as well as a change in the NIH percentiling algorithm since 2009.
Figure 3
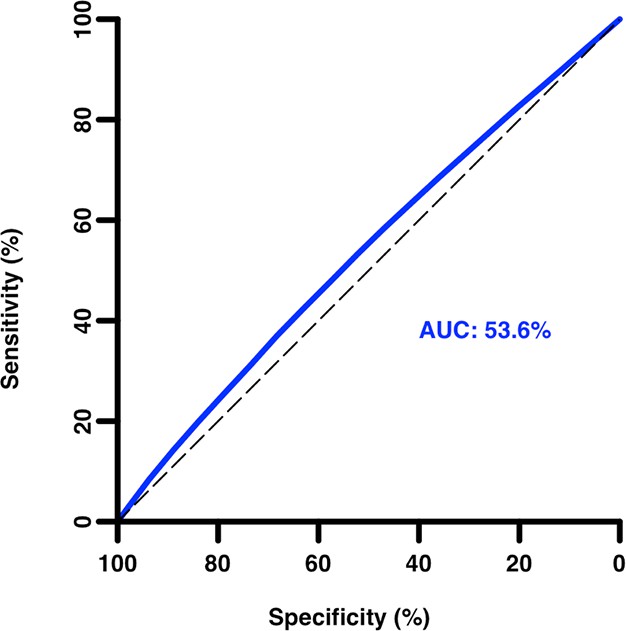
Receiver operating characteristic curve of grant percentile score as a predictor of citation productivity (low/high).
Area under the curve (AUC) = 0.54 (95% confidence interval: 0.53–0.54) for citation productivity greater than the median. An AUC of 1.0 corresponds to a perfect test; an AUC of 0.5 indicates performance equivalent to random chance alone.
Download links
A two-part list of links to download the article, or parts of the article, in various formats.
Downloads (link to download the article as PDF)
Open citations (links to open the citations from this article in various online reference manager services)
Cite this article (links to download the citations from this article in formats compatible with various reference manager tools)
Research: NIH peer review percentile scores are poorly predictive of grant productivity
eLife 5:e13323.
https://doi.org/10.7554/eLife.13323


