Meta-Research: The growth of acronyms in the scientific literature
- School of Public Health and Social Work, Queensland University of Technology, Australia
- Future Industries Institute, University of South Australia, Australia
Figures
Figure 1 with 3 supplements
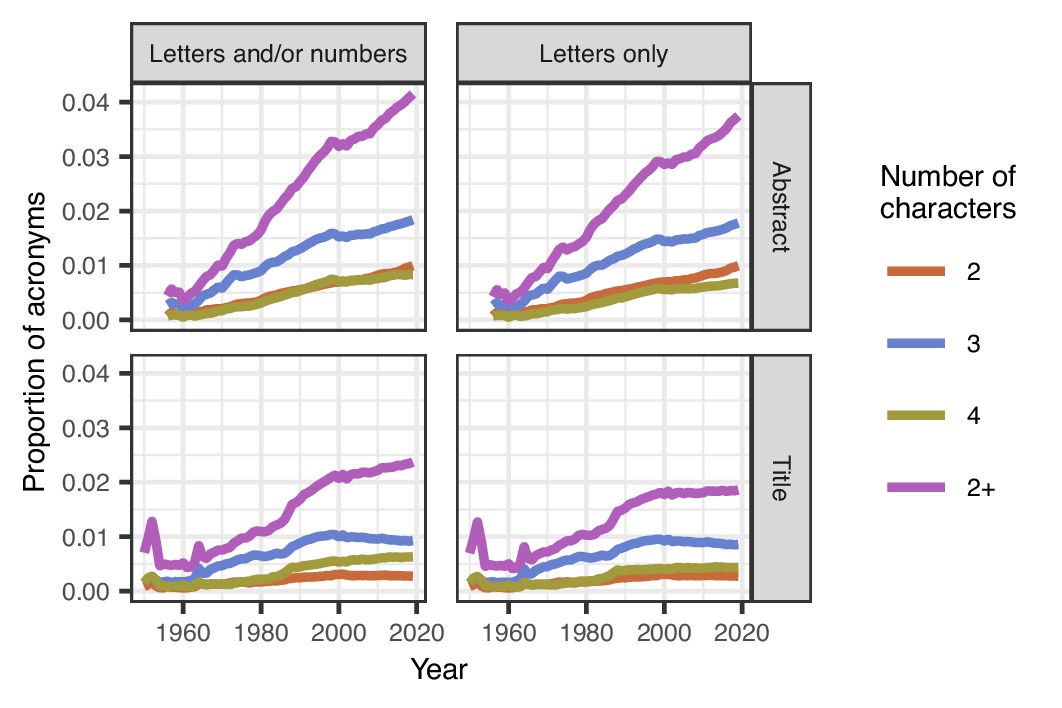
Mean proportions of acronyms in titles and abstracts over time.
The proportion of acronyms (purple line) has risen steadily over time in abstracts both for acronyms that are letters and/or numbers (top left) or just letters (top right). Acronyms are generally less common in titles than abstracts, and the proportion in titles has been relatively stable since 2000, but there was an increase from 1960 to 2000 (bottom left and right). Three-character acronyms (blue lines) are more common than two-character acronyms (brown-orange lines) and four-character acronyms (olive green lines) in both titles and abstracts. A sufficient number of abstracts only became available from 1956. The spikes in titles for acronyms of length 2+ in 1952 and 1964 are because of the relatively small number of papers in those years, with over 78,000 papers being excluded in 1964 because the title was in capitals.
Figure 1—figure supplement 1
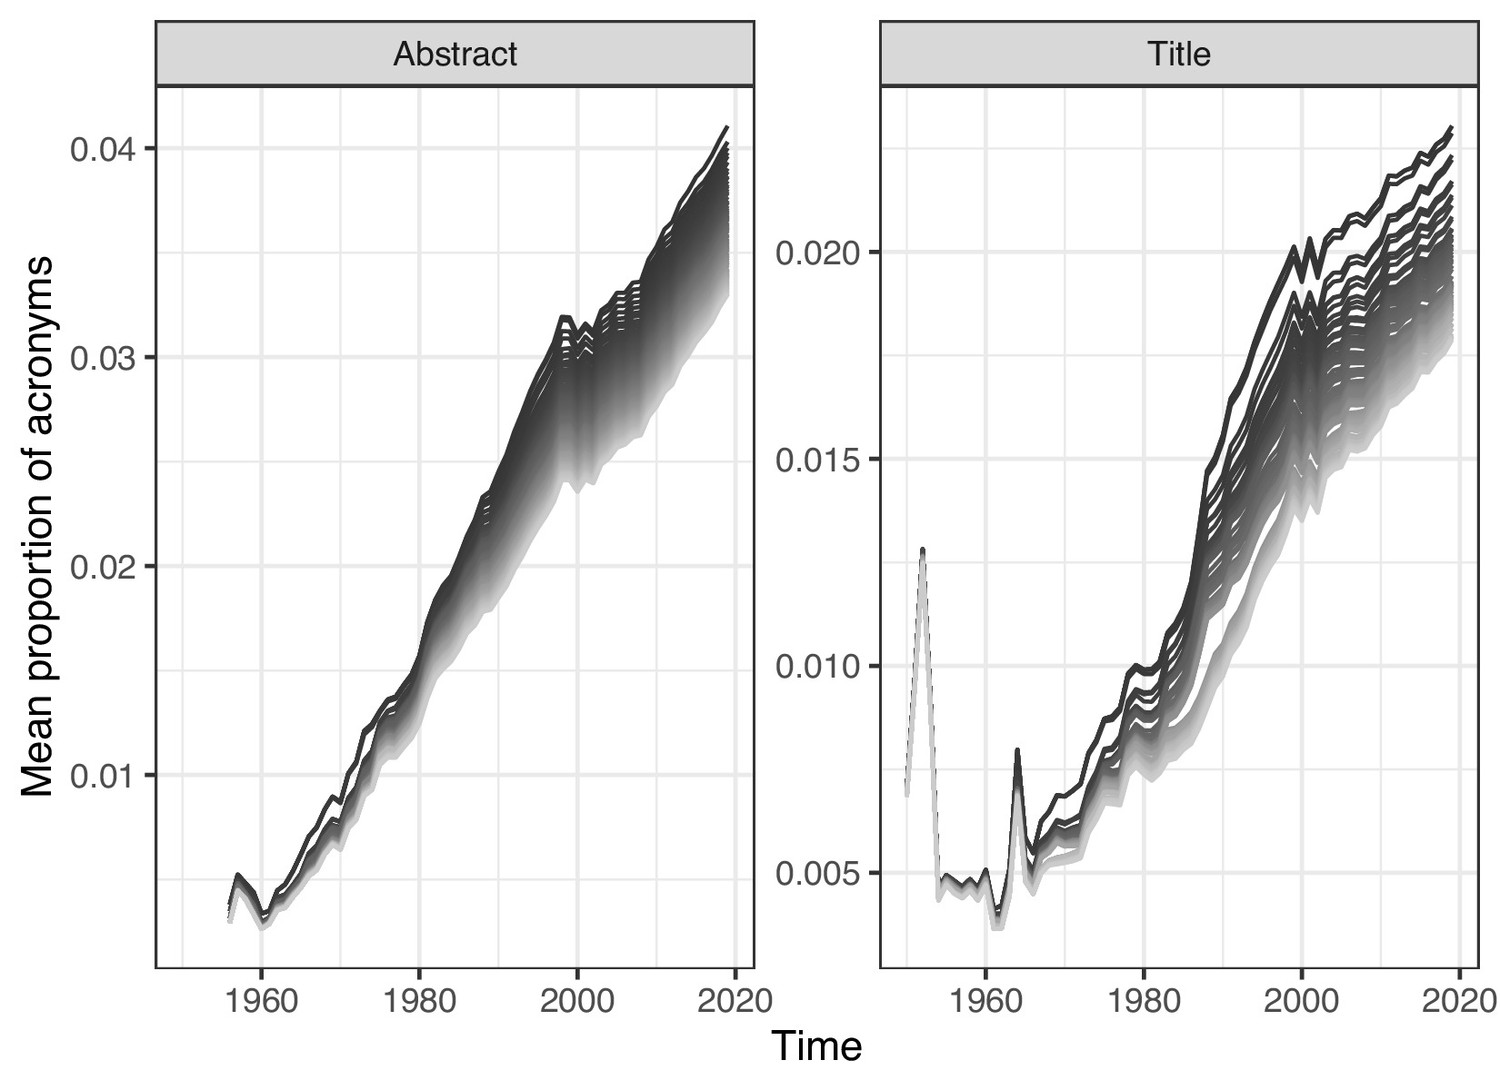
Mean proportions of acronyms in titles and abstracts over time, with the 100 most popular acronyms excluded.
Each line shows the trend after excluding up to the n most popular acronyms (n = 1, ..., 100). The darkest line is for n = 1, and the lightest line is for n = 100. The number of titles and journals in the early 1950s is much smaller, hence the more erratic trend for titles in that decade.
Figure 1—figure supplement 2
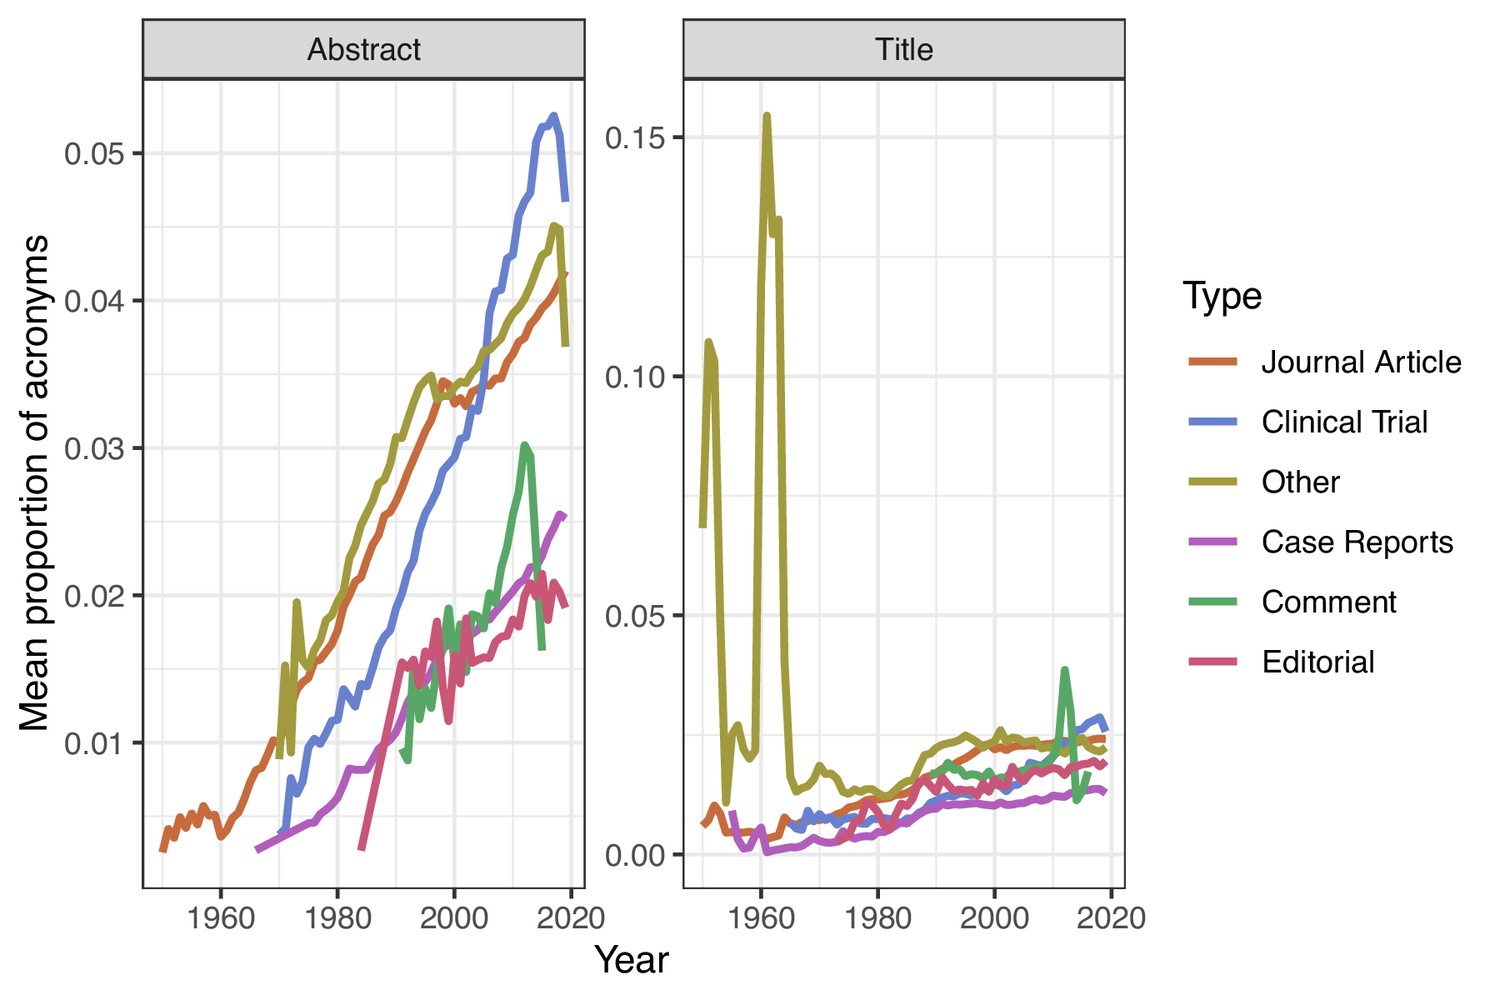
Mean proportions of acronyms in titles and abstracts over time by article type.
Data for six article types (journal article, clinical trial, case report, comment, editorial, and other). The high proportion of acronyms in the 1950s and 1960s for ‘other’ is driven by a relatively large number of obituaries that include qualifications, such as FRCP (Fellow of the Royal College of Physicians) or DSO (Distinguished Service Order). The drop in the proportion of acronyms in 2019 for ‘clinical trials’ and ‘other’ may be due to a delay in papers from some journals appearing in PubMed.
Figure 1—figure supplement 3
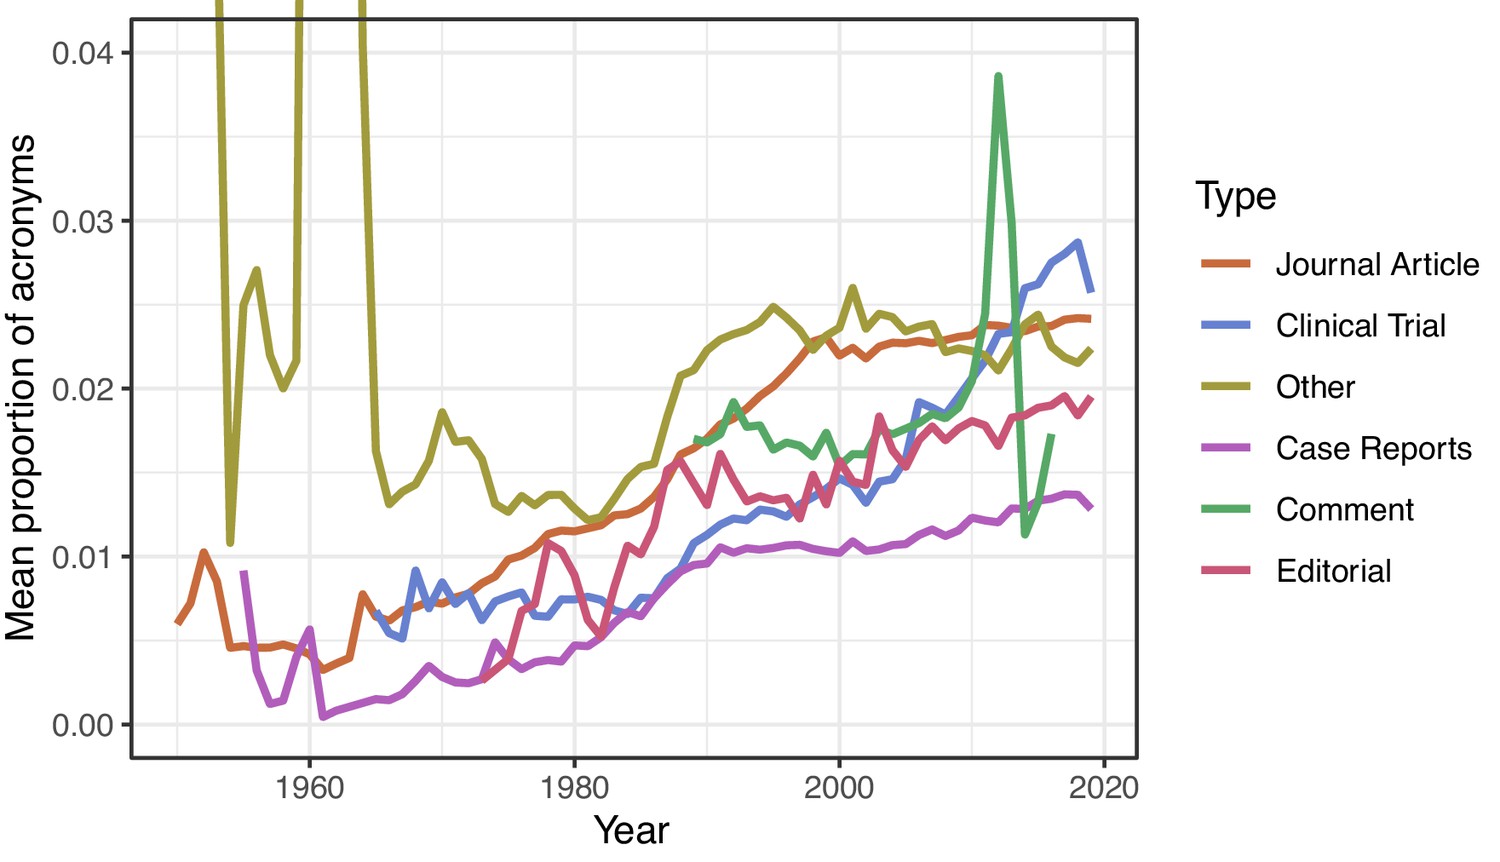
Mean proportions of acronyms in titles over time by article type with a truncated y−axis.
Using a truncated y−axis more clearly shows the upward trend in the use of acronyms in titles for all article types over time (by reducing the influence of ‘other’ in the 1950s and 1960s; see Figure 1—figure supplement 2).
Figure 2
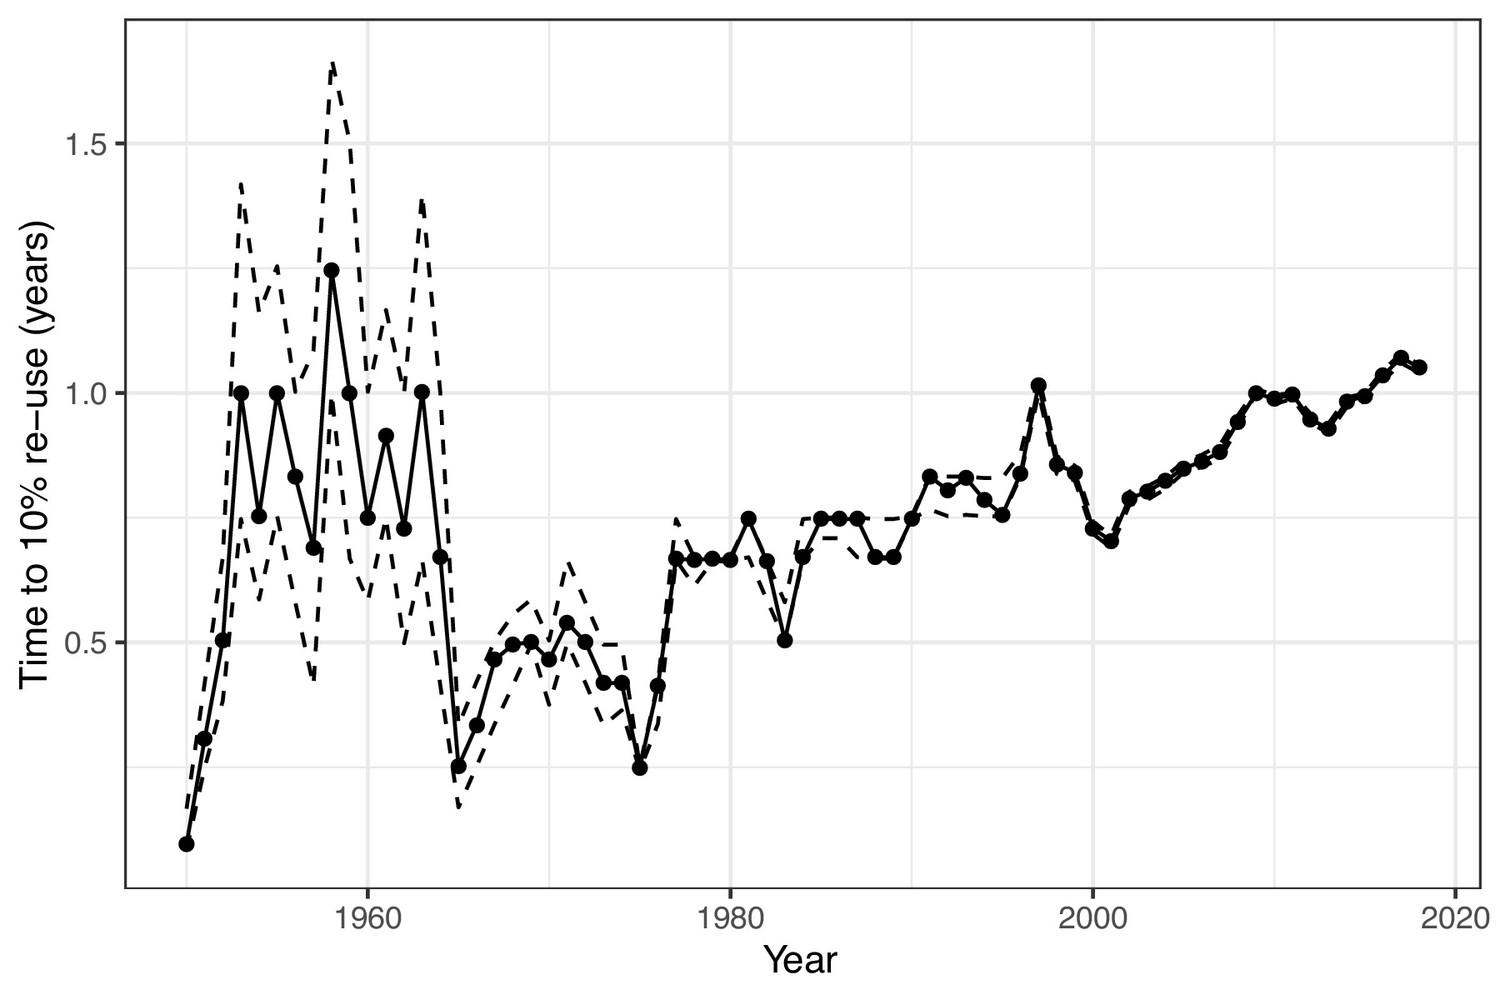
Estimated time to re-use of acronyms over time.
The solid line is the estimated time in years for 10% of newly coined acronyms to be re-used in the same journal. 10% was chosen based on the overall percentage of acronyms being re-used within a year. Newly coined acronyms are grouped by year. The dotted lines show the 95% confidence interval for the time to re-use, which narrows over time as the sample size increases. The general trend is of an increasing time to re-use from 1965 onwards, which indicates that acronyms are being re-used less often. The relatively slow times to re-use in the 1950s and early 1960s are likely due to the very different mix of journals in that time.
Figure 3

Average number of words in abstracts and titles over time.
The average title length has increased linearly between 1950 and 2019 (left). The average length of abstracts has also increased since 1960, except for a brief reduction in the late 1970s and a short period of no change after 2000 (right). A sufficient number of abstracts only became available from 1956. Note that the y-axes in the two panels are different, and that neither starts at zero, because we are interested in the relative trend.
Videos
Video 1
The top ten acronyms in titles for every year from 1950 to 2019.
Video 2
The top ten acronyms in abstracts for every year from 1950 to 2019.
Tables
Table 1
Top 20 acronyms found in over 24 million titles and over 18 million abstracts.
How many do you recognise?
| Rank | Acronym | Common meaning(s) | Count |
|---|---|---|---|
| 1 | DNA | Deoxyribonucleic acid | 2,443,760 |
| 2 | CI | Confidence interval | 1,807,878 |
| 3 | IL | Interleukin/Independent living | 1,418,402 |
| 4 | HIV | Human immunodeficiency virus | 1,172,516 |
| 5 | mRNA | Messenger ribonucleic acid | 1,107,547 |
| 6 | RNA | Ribonucleic acid | 1,060,355 |
| 7 | OR | Odds ratio/Operating room | 788,522 |
| 8 | PCR | Polymerase chain reaction | 745,522 |
| 9 | CT | Computed tomography | 743,794 |
| 10 | ATP | Adenosine triphosphate | 582,838 |
| 11 | MS | Multiple sclerosis/Mass spectrometry | 567,523 |
| 12 | MRI | Magnetic resonance imaging | 504,823 |
| 13 | TNF | Tumour necrosis factor | 454,486 |
| 14 | US | United States/Ultrasound/Urinary system | 436,328 |
| 15 | SD | Standard deviation | 411,997 |
| 16 | NO | Nitric oxide | 394,777 |
| 17 | PD | Parkinson's disease/Peritoneal dialysis | 389,566 |
| 18 | HR | Heart rate/Hazard ratio | 383,027 |
| 19 | IFN | Interferon | 383,011 |
| 20 | CD4 | Cluster of differentiation antigen 4 | 363,502 |
Table 2
Errors made by the algorithm in random samples of titles and abstracts, the number of times that error was made, the average error percentage, and the estimated upper limit.
| Error | Count | Average error (%) | Upper limit on error (%) |
|---|---|---|---|
| Wrongly excluded whole title | 1 | 0.3 | 1.6 |
| Missed valid acronym from title | 7 | 1.2 | 2.2 |
| Wrongly included acronym from title | 5 | 0.8 | 1.7 |
| Missed valid acronym from abstract | 19 | 6.3 | 9.1 |
| Wrongly included acronym from abstract | 2 | 0.7 | 2.1 |
Table 3
Reasons for excluding titles and abstracts, along with the numbers excluded for each reason.
| Reason | Titles | Abstract |
|---|---|---|
| No abstract | n/a | 7,253,053 |
| Non-English | 4,783,569 | 4,783,569 |
| Pre-1950 | 384,436 | 7,973 |
| Title/abstract largely in capitals | 298,284 | 112,369 |
| One word title/abstract | 76,303 | 201 |
| Empty title/abstract | 149 | 9,887 |
| Missing PubMed date | 1,510 | 1,510 |
| Duplicate PubMed ID | 1,344 | 1,328 |
| No article type | 109 | 0 |
| Total excluded | 5,545,704 | 12,169,890 |
| Total included | 24,873,372 | 18,249,091 |
Additional files
Download links
A two-part list of links to download the article, or parts of the article, in various formats.
Downloads (link to download the article as PDF)
Open citations (links to open the citations from this article in various online reference manager services)
Cite this article (links to download the citations from this article in formats compatible with various reference manager tools)
Meta-Research: The growth of acronyms in the scientific literature
eLife 9:e60080.
https://doi.org/10.7554/eLife.60080


