A toolbox for ablating excitatory and inhibitory synapses
- Department of Biology, Division of Molecular and Computational Biology, University of Southern California, United States
- Neuroscience Graduate Program, University of Southern California, United States
- Department of Chemistry, School of Arts and Sciences, University of Pennsylvania, United States
- Department of Molecular and Cell Biology, University of California, United States
- Department of Chemistry, Faculty of Science, University of Alberta, United States
- Department of Chemistry, Graduate School of Science, The University of Tokyo, Bunkyo-ku, Japan
- Department of Biomedical Engineering, Viterbi School of Engineering, University of Southern California, United States
Figures
Figure 1 with 1 supplement
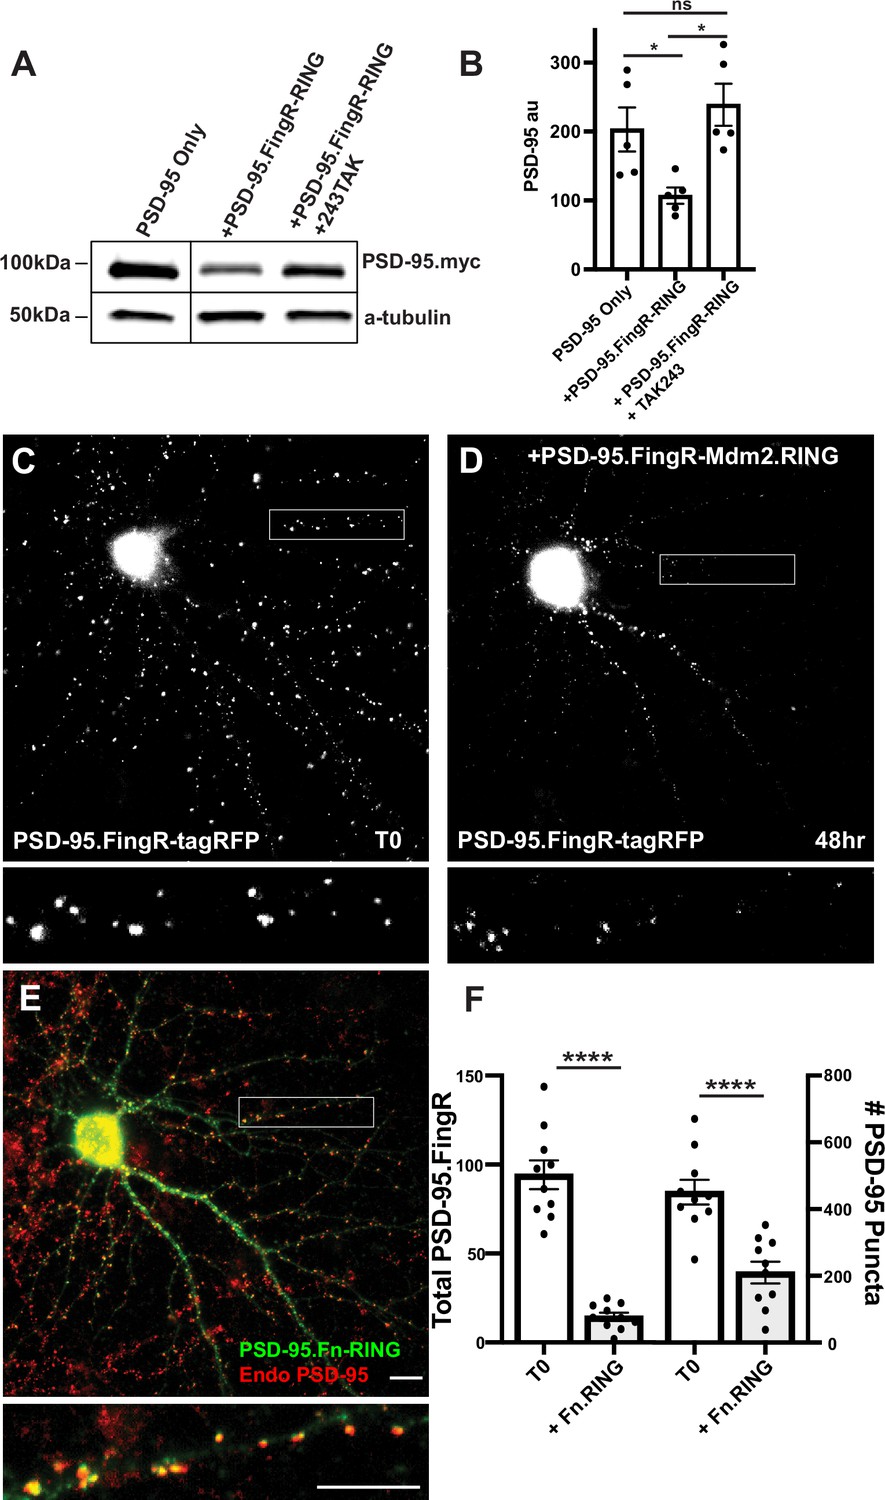
Mdm2.RING ubiquitinates PSD-95.
(A) Comparison of cell lysate from COS7 cells transfected with PSD-95-myc alone, PSD-95-myc + Dox-induced TRE-PSD-95.FingR-RINGMDM2, and PSD-95-myc + TRE-PSD-95.FingR-RING MDM2 + TAK243, a ubiquitination inhibitor. Cells expressing TRE-PSD-95.FingR-RINGMDM2 were treated with 1 μg/ml doxycycline for 4 hr to induce expression of PSD-95.FingR-RING and showed a reduction in PSD-95-myc. Cells treated with 20 μM TAK243 showed no apparent reduction in PSD-95-myc. (B) Quantitation showed a significant reduction in PSD-95 expression when co-expressed with PSD-95.FingR-RINGMDM2 in COS7 cells, but not when PSD-95 is expressed alone or when PSD-95 and PSD-95.Fn-RING MDM2 are co-expressed with 20 μM TAK243. *p < 0.05, ANOVA with multiple comparisons. ns, p > 0.05. (C) Cultured cortical neuron expressing transcriptionally regulated PSD-95.FingR-tagRFP before induction of PSD-95.FingR-HA-RINGMdm2 expression with Dox. (D) Same neuron as in (C) after induction of PSD-95.FingR-HA-RINGMDM2 expression with Dox shows a reduction in PSD-95.FingR-tagRFP labeling. (E) Immunostaining of the neuron in (D) for PSD-95.FingR-HA-RINGMDM2 (green) and endogenous PSD-95 (red). (F) Quantification of the number of the total amount of PSD-95 labeled by PSD-95.FingR-tagRFP before and after expression of PSD-95.FingR-HA-RINGMDM2 (left side). The # of puncta labeled with PSD-95.FingR-tagRFP at T0 was compared to the number of puncta immunostained for endogenous PSD-95 following expression of PSD-95.FingR-HA-RINGMDM2 (right side). ****p < 0.0001, Mann–Whitney. Error bars represent ± SEM. Scale bars: 5 µm.
-
Figure 1—source data 1
Source data for Figure 1A.
Annotated western blots for PSD-95 and tubulin.
- https://cdn.elifesciences.org/articles/103757/elife-103757-fig1-data1-v1.pdf
-
Figure 1—source data 2
Source data for Figure 1A.
Original western blots for PSD-95 and tubulin.
- https://cdn.elifesciences.org/articles/103757/elife-103757-fig1-data2-v1.zip
-
Figure 1—source data 3
Numerical source data for graphs in Figure 1B, F.
- https://cdn.elifesciences.org/articles/103757/elife-103757-fig1-data3-v1.xlsx
Figure 1—figure supplement 1

TAK243 blocks ubiquitination and degradation of PSD-95 by Mdm2.RING.
Western blot of lysate from COS7 cells transfected with HA-ubiquitin treated with TAK243 for 4 hr. Addition of TAK243 blocks high molecular weight bands indicating ubiquitination of proteins.
-
Figure 1—figure supplement 1—source data 1
Annotated western blots for ubiquitin and tubulin.
- https://cdn.elifesciences.org/articles/103757/elife-103757-fig1-figsupp1-data1-v1.pdf
-
Figure 1—figure supplement 1—source data 2
Original western blots for ubiquitin and tubulin.
- https://cdn.elifesciences.org/articles/103757/elife-103757-fig1-figsupp1-data2-v1.zip
Figure 2 with 1 supplement
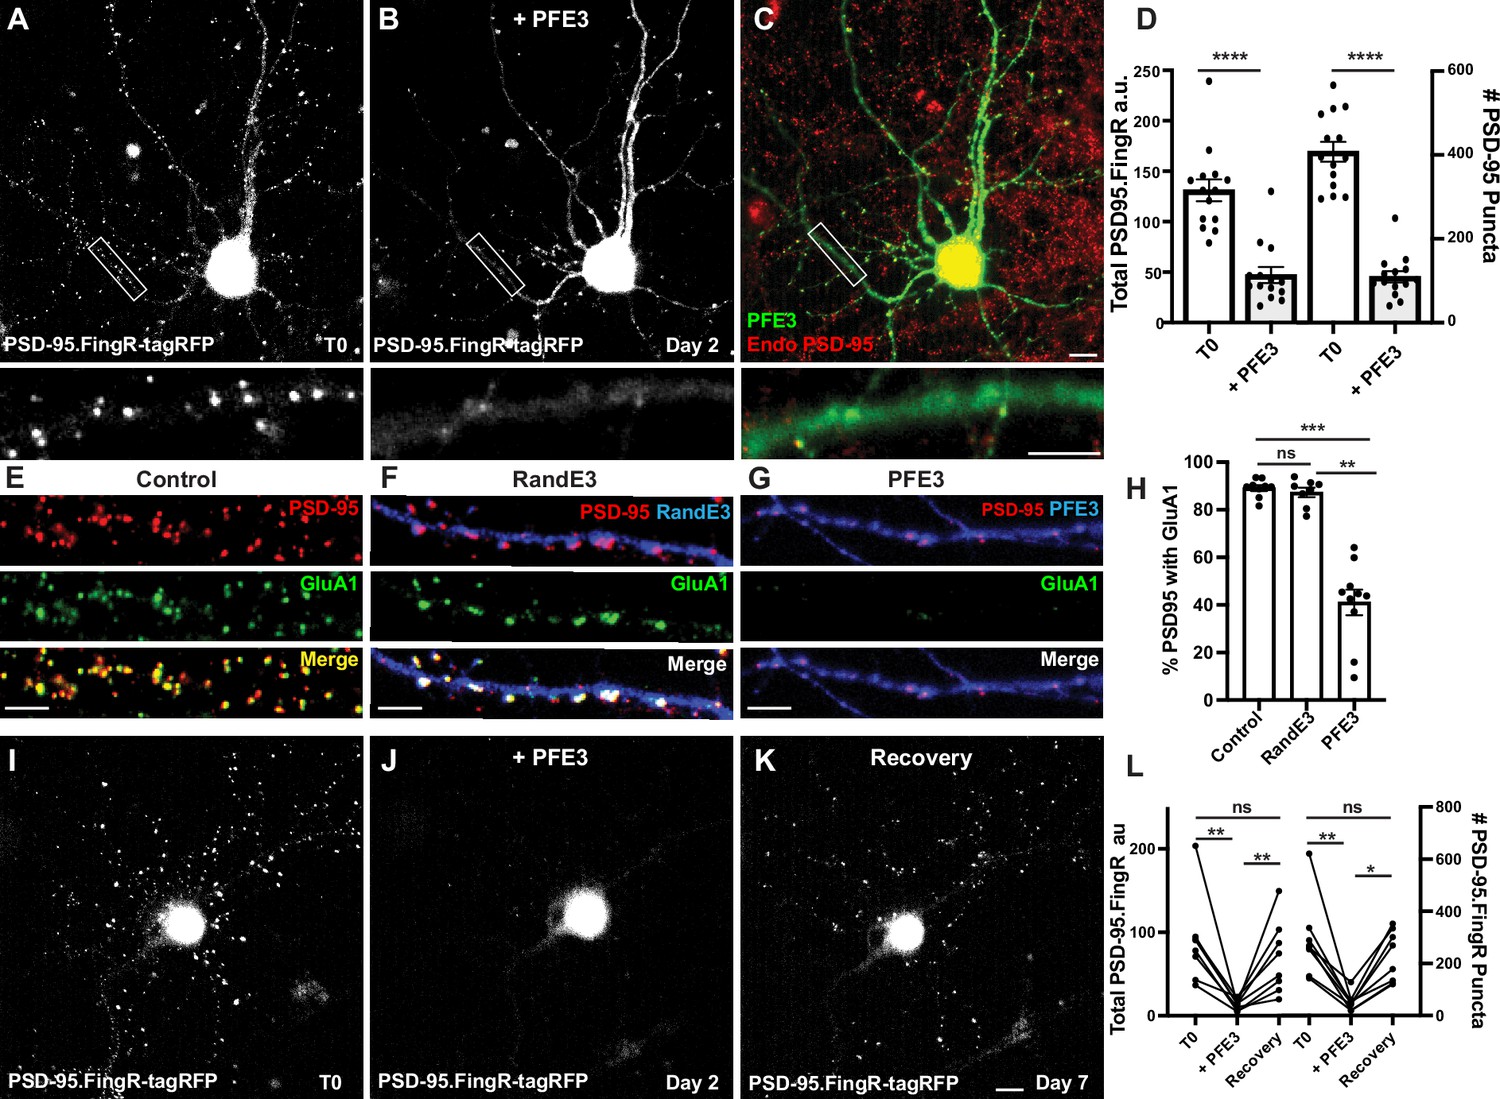
PFE3 reversibly ablates PSD-95 in neurons.
(A) Cultured cortical neuron expressing PSD-95.FingR-tagRFP before induction of PFE3. Closeup of the boxed area shown below. (B) Same neuron as in (A) after expression of PFE3 for 48 hr shows a dramatic reduction in PSD-95.FingR labeling. Closeup of the boxed area shown below confirms the lack of punctate labeling by PSD-95.FingR-tagRFP. (C) Neuron in B immunostained for PFE3 (green) and endogenous PSD-95 (red) confirms the lack of punctate labeling by PSD-95.FingR. Closeup of the boxed area shown below. (D) Quantifications of the total amount of PSD-95.FingR labeling and the # of PSD-95 puncta (T0, # of puncta labeled with PSD95.FingR; +PFE3, # of puncta labeled with immunocytochemistry) show significant reductions following expression of PFE3. ****p < 0.0001, Mann–Whitney. (E–G) Cultured cortical neurons immunostained for endogenous PSD-95 in red and GluA1 in green. (E) Untransfected. (F) Following RandE3 (blue) expression for 48 hr, GluA1 and PSD-95 staining is intact. (G) Following PFE3 expression (blue) for 48 hr, GluA1 and PSD-95 expression is markedly diminished. (H) Quantification of the percentage of PSD-95 puncta positive for GluA1 staining. ns p > 0.05, ***p < 0.001, **p < 0.01, Kruskal–Wallis multiple comparisons. (I) Cultured neuron expressing PSD-95.FingR-tagRFP. (J) Same neuron as in (I) 48 hr after induction of PFE3 expression shows a dramatic reduction in labeling with PSD-95.FingR-tagRFP. (K) Same neuron as in (I), (J) showing recovery of synapses 5 days after removal of PFE3. (L) Quantification of the total amount of PSD-95.FingR-tagRFP labeling and the # of PSD-95.FingR-tagRFP-labeled puncta. **p < 0.01, *p < 0.05, ns p > 0.05, Kruskal–Wallis multiple comparisons. Scale bars: 5 µm.
-
Figure 2—source data 1
Numerical source data for graphs in Figure 2D, H, L.
- https://cdn.elifesciences.org/articles/103757/elife-103757-fig2-data1-v1.xlsx
Figure 2—figure supplement 1
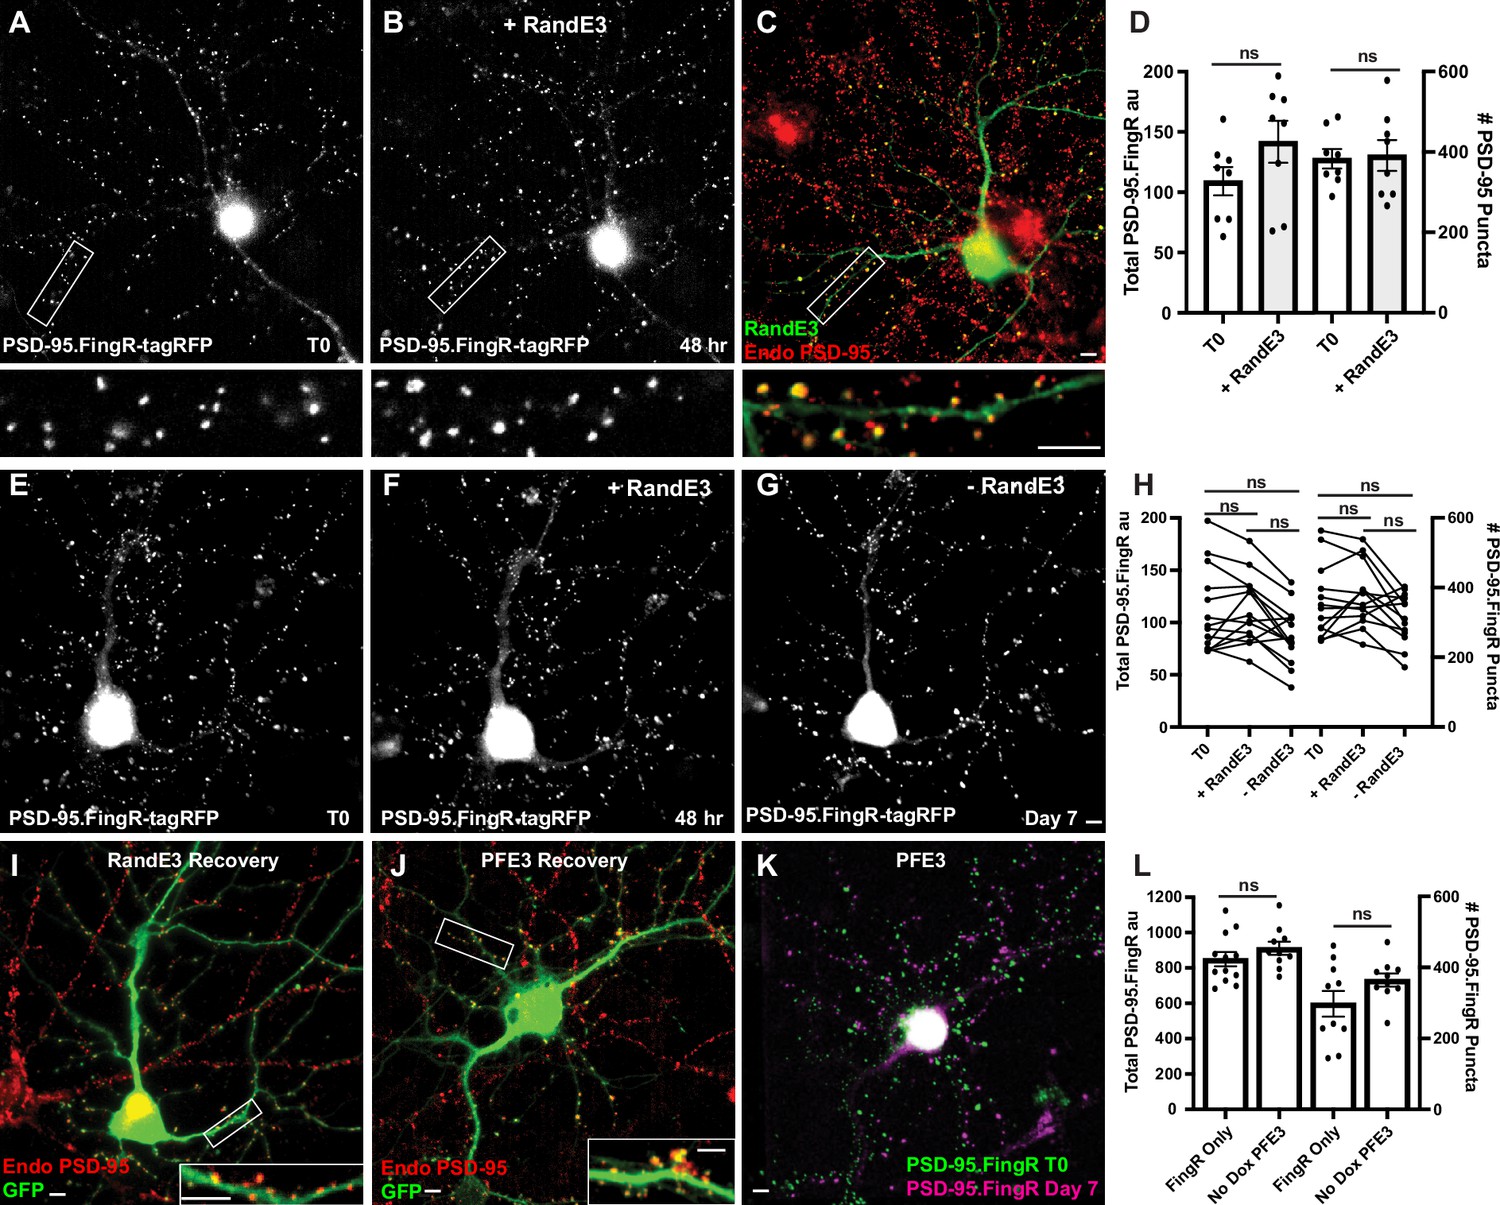
Expression of RandE3 does not significantly affect PSD-95 expression.
(A) Cultured cortical neuron expressing PSD-95-FingR-tagRFP. Closeup of the boxed area below. (B) Same neuron as in (A) after induction of RandE3 showing no apparent reduction in PSD-95-FingR-tagFRP labeling. Closeup of the boxed area below. (C) Neuron in B immunostained for RandE3 in green and endogenous PSD-95 in red. Closeup of the boxed area below shows the persistence of PSD-95 labeling. (D) Quantifications of the total amount of PSD-95.FingR-tagRFP labeling and the # of PSD-95.FingR puncta before and after expressing RandE3 show no significant changes in either measure. ns, p > 0.05, Mann–Whitney. (E) Cultured cortical neuron expressing PSD-95-FingR-tagRFP. (F) Same neuron as in (E) 48 hr after expressing RandE3 shows no apparent reduction in PSD-95-FingR-tagFRP labeling. (G) Same neuron as in (E), (F) 5 days after removal of Dox shows no apparent reduction in PSD-95-FingR-tagFRP labeling. (H) Quantifications of the total amount of PSD-95.FingR labeling and the # of PSD-95.FingR puncta indicate no significant changes with the addition and removal of Dox. ns p > 0.05, Friedman multiple comparison. (I) Immunocytochemistry of neuron in G subjected to expression and removal of RandE3-P2A-GFP. GFP (green), endogenous PSD-95 (red). (J) Immunostaining for neuron in Figure 2K subjected to expression and removal of PFE3-P2A-GFP showing GFP (green) and endogenous PSD-95 (red) as in (I). PSD-95 is present on the tips of dendritic spines. (K) Overlay of PSD-95.Fing-tagRFP labeling at T0 before expressing PFE3 (green) and after recovery of synapses at 7 days (purple) for the neuron shown in (J) confirms the two labeling distributions are similar. (L) Total PSD-95.FingR labeling and number of puncta labeled with PSD-95.FingR in cultures expressing PSD-95.FingR alone vs. those expressing PFE3 without Dox are not significantly different (p > 0.2, Mann–Whitney for total labeling; p > 0.4, Mann–Whitney for # of puncta). Scale bars represent 5 µm.
-
Figure 2—figure supplement 1—source data 1
Numerical source data for graphs in Figure 2—figure supplement 1D, H, L.
- https://cdn.elifesciences.org/articles/103757/elife-103757-fig2-figsupp1-data1-v1.xlsx
Figure 3
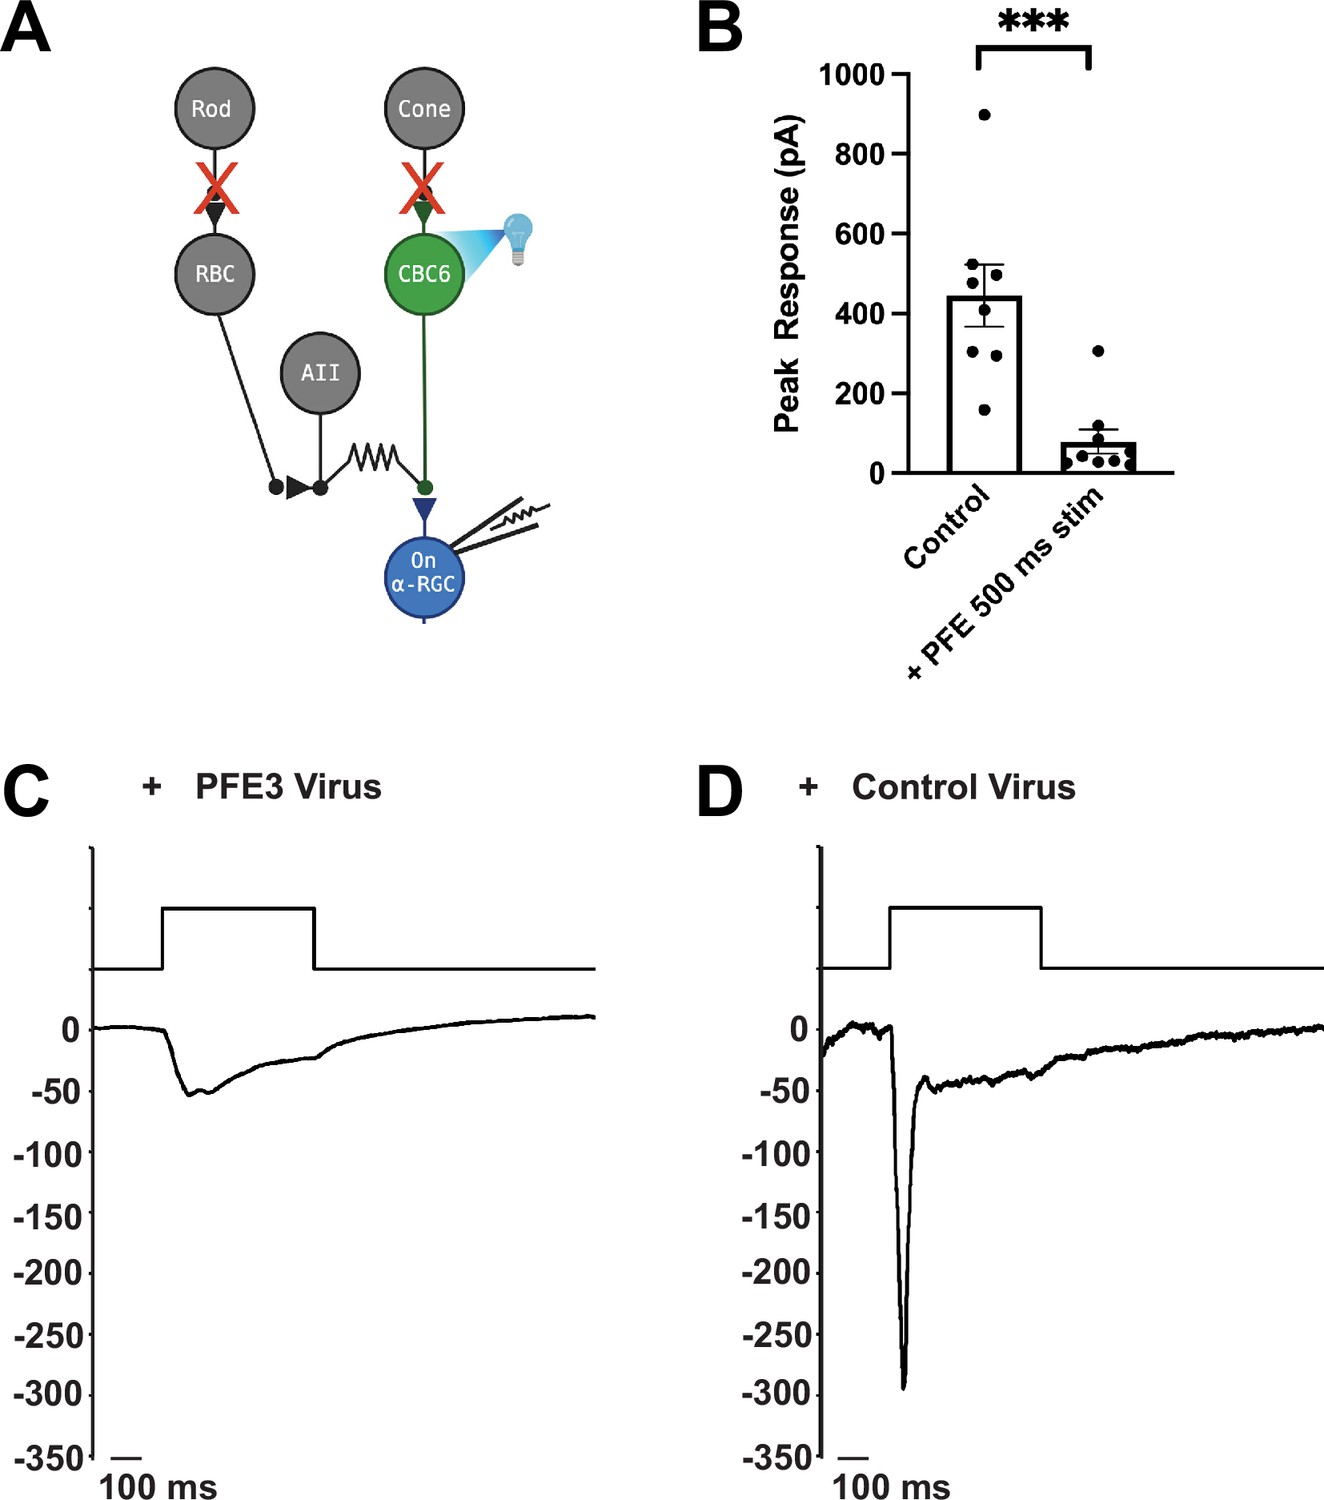
Expression of PFE3 reduces synaptic transmission in vivo.
(A) Schematic depiction of the retinal circuit used to assess AMPA receptor function. Channelrhodopsin-2 is expressed in type 6 cone bipolar cells (CBC6), presynaptic to the On α-retinal ganglion cell (α-RGC). The synaptic output of photoreceptors is pharmacologically blocked. (B) Population data comparing peak EPSC amplitude for retinas from mice infected with PFE3 and control viruses. Responses were generated with a 495-nm, 500-ms flash of light. Symbols are values for individual cells. ***p < 0.001, Mann–Whitney. Error bars represent ± SEM. Sample whole cell patch clamp recording from an On α-RGC infected with the PFE3 virus (C) or a RandE3 control virus (D).
-
Figure 3—source data 1
Numerical source data for plots and graphs in Figure 3B–D.
- https://cdn.elifesciences.org/articles/103757/elife-103757-fig3-data1-v1.xlsx
Figure 4 with 1 supplement
Testing of PhLIC, a photoactivatable dimer.
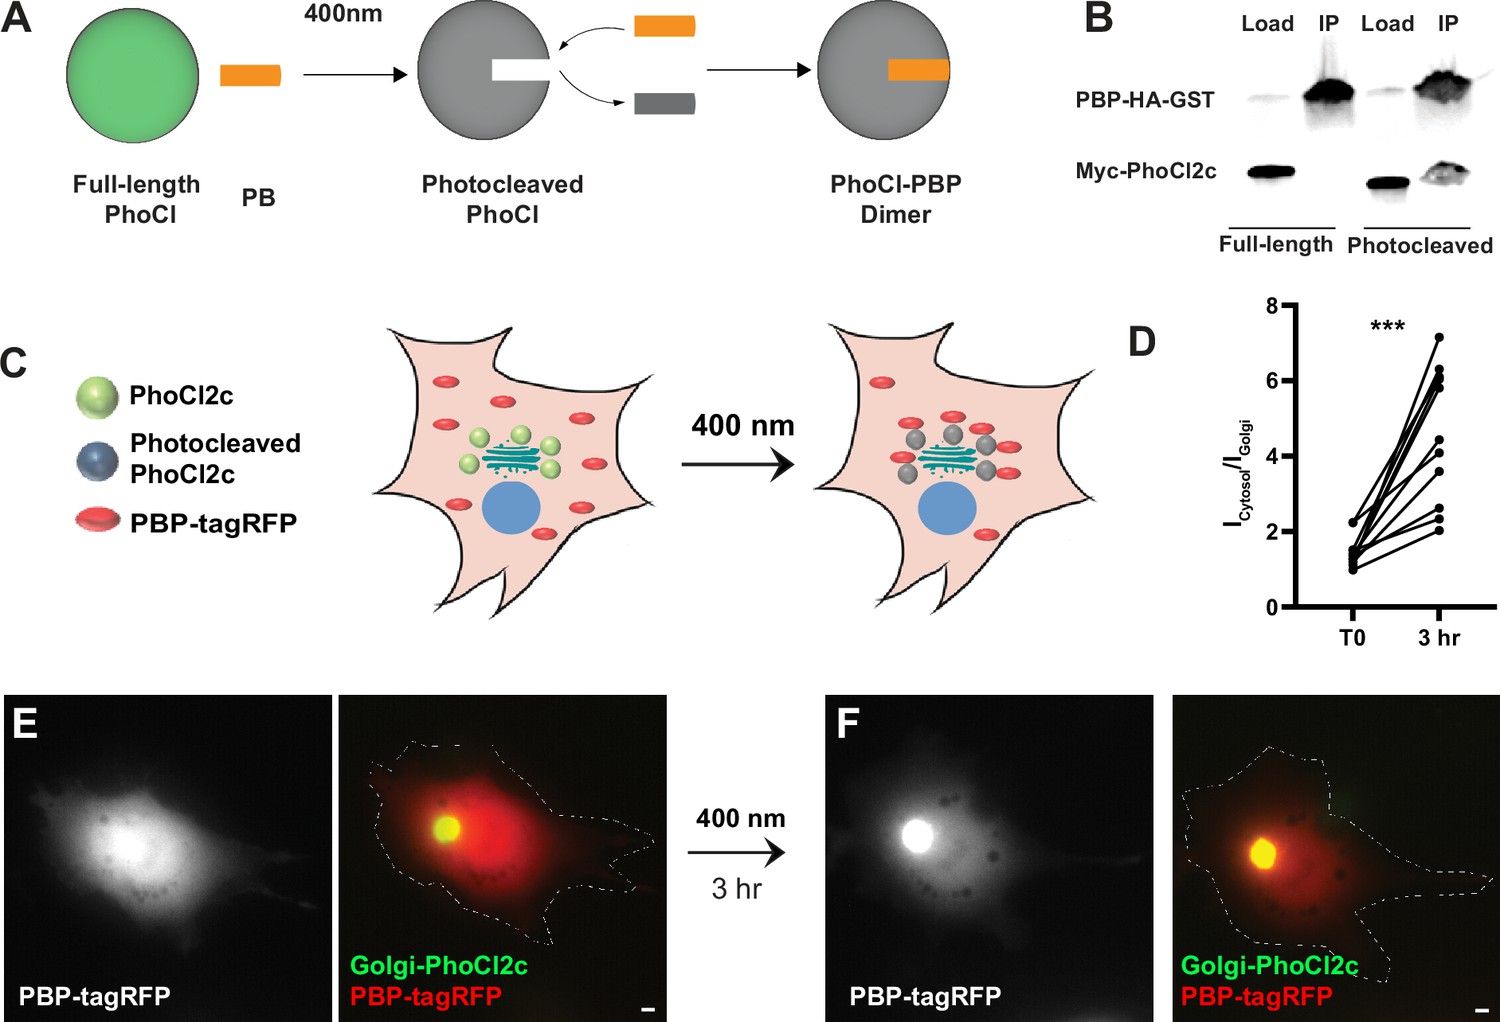
(A) Schematic of PhLIC (PhoCl-based Light-Inducible Complex). Full-length PhoCl is photocleaved with 400 nm light, exposing an epitope recognized by the PhoCl-binding peptide (PBP), leading to dimerization of photocleaved PhoCl and PBP. (B) COS7 lysate expressing PBP-HA-GST was incubated with purified full-length or photocleaved Myc-PhoCl2c. PBP-HA-GST pulls down photocleaved but not full-length PhoCl2c. (C) Schematic of Golgi-targeting assay. COS7 cell expressing Golgi-targeted PhoCl2c in green and PBP-tagRFP in red before (left) and 3 hr after illumination with 400 nm light for 10 s every 30 s for 3 min (right). (D) Quantification of the ratio of the total fluorescence associated with PBP-tagRFP localized in the cytosol (Icytosol) vs. at the Golgi (IGolgi) before and 3 hr after photocleaving PhoCl2c. ***p < 0.001, Wilcoxon. (E) COS7 cell before photoactivation showing PBP-tagRFP (left) and a merge (right) of PBP-tagRFP (red) and PhoCl2c-GTS (green). (F) Same COS7 cell as in (E) following photoactivation with 400 nm light for 1 min showing PBP-tagRFP (left) and a merge (right) of PBP-tagRFP (red) and PhoCl2c (green). Scale bar represents 5 µm.
-
Figure 4—source data 1
Source data for Figure 4B.
Annotated western blots for PBP-HA-GST and Myc-PhoCl2c.
- https://cdn.elifesciences.org/articles/103757/elife-103757-fig4-data1-v1.pdf
-
Figure 4—source data 2
Source data for Figure 4b.
Original western blots for PBP-HA-GST and Myc-PhoCl2c.
- https://cdn.elifesciences.org/articles/103757/elife-103757-fig4-data2-v1.zip
-
Figure 4—source data 3
Numerical source data for graph in Figure 4D.
- https://cdn.elifesciences.org/articles/103757/elife-103757-fig4-data3-v1.xlsx
Figure 4—figure supplement 1
PhLIC does not activate with ambient light.
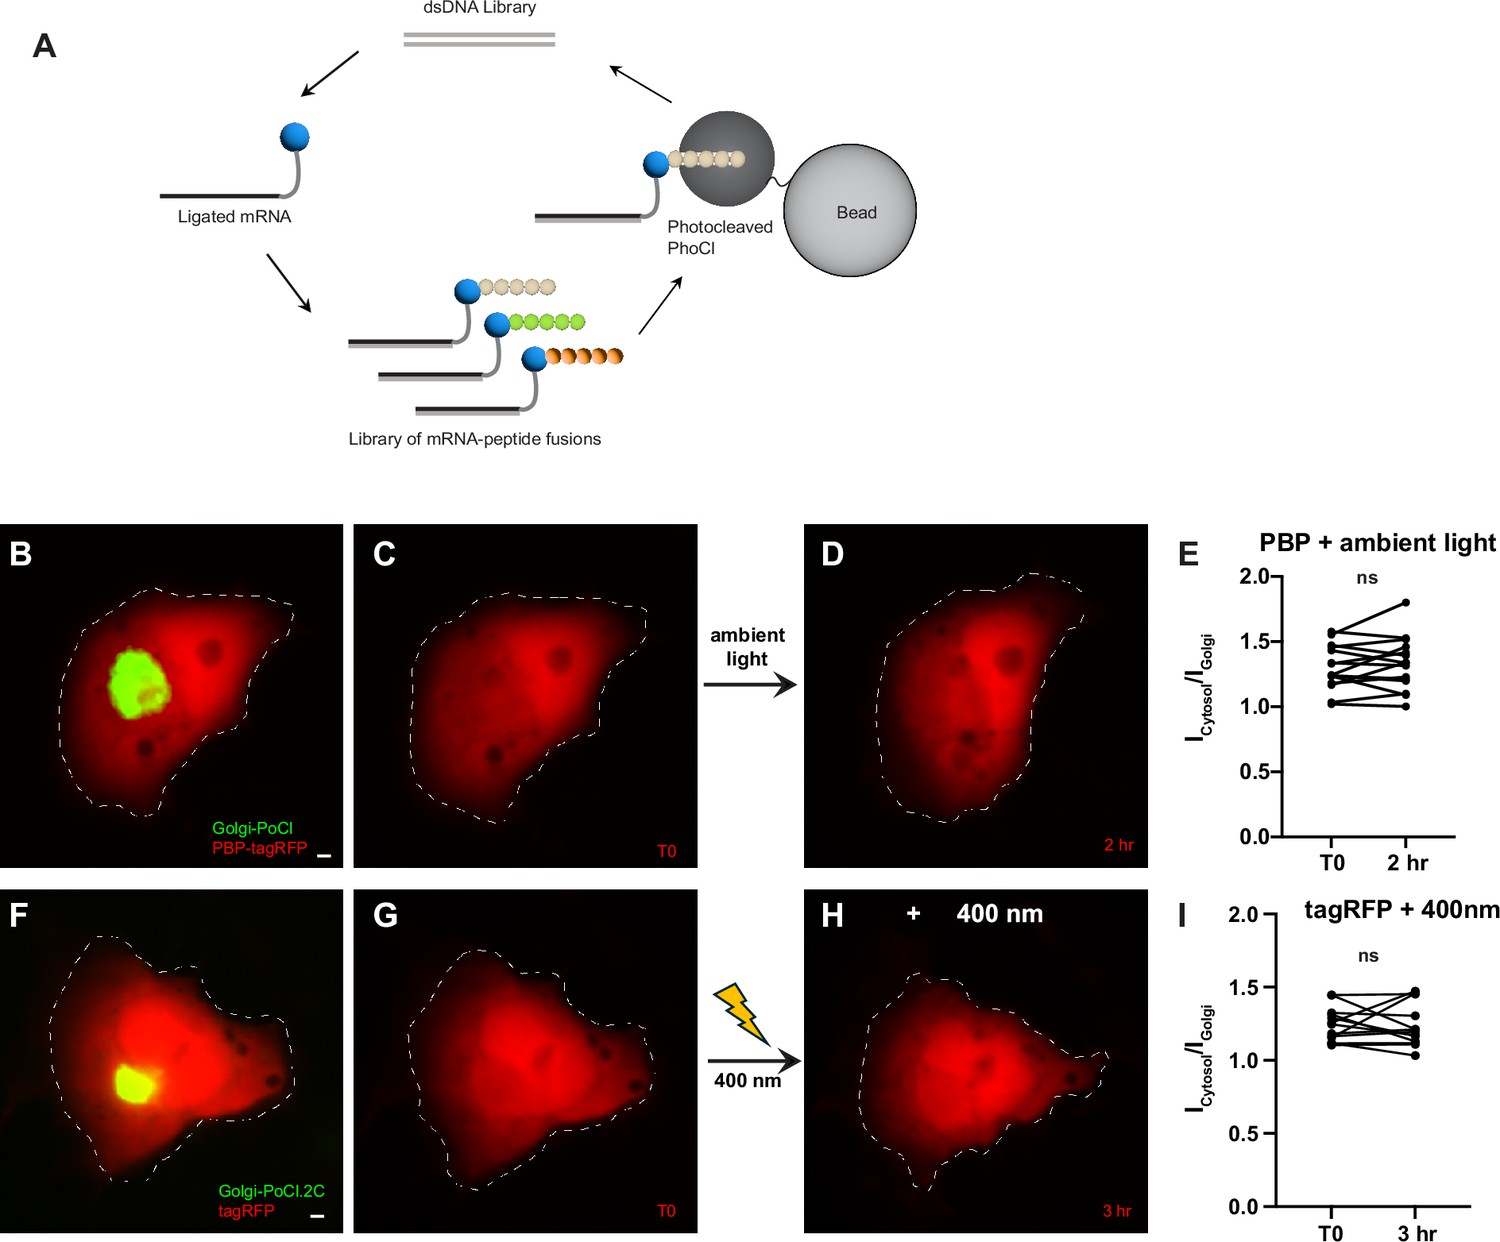
(A) mRNA display: The library of mRNA–protein fusions is incubated with cleaved PhoCl immobilized on beads. Peptides that bind cleaved PhoCl are pulled down, and the genetic material is amplified with PCR. The PCR product is transcribed, translated, and used to form mRNA–protein fusions, which are used for the subsequent round of selection. (B, C) COS7 cell expressing Golgi-targeted Phocl (PhoCl-GTS) and PBP-tagRFP before exposure to ambient light. (D) Same cell as in (B), (C) 2 hr after exposure to ambient light. There is no apparent targeting of PBP-tagRFP to the Golgi. (E) Icytosol/IGolgi for PBP-tagRFP is not significantly different before vs. after exposure of cells to ambient light (+2 ± 2%, p > 0.5, Wilcoxon, n = 15 cells, 2 experiments). (F, G) COS7 cell expressing Golgi-targeted PhoCl2c-GTS and tagRFP. There is no apparent targeting of tagRFP to the Golgi. (H) Same cell as in (F), (G) 3 hr after illumination with 400 nm. There is no apparent targeting of PBP-tagRFP to the Golgi. (I) Icytosol/IGolgi for tagRFP before and after illumination with 400 nm light does not differ (0 ± 3%, p > 0.7, Wilcoxon, n = 13). Scale bars represent 5 µm.
-
Figure 4—figure supplement 1—source data 1
Numerical source data for graphs in Figure 4—figure supplement 1E, I.
- https://cdn.elifesciences.org/articles/103757/elife-103757-fig4-figsupp1-data1-v1.xlsx
Figure 5 with 1 supplement
Reversible optogenetic ablation of inhibitory synapses with pa-GFE3.
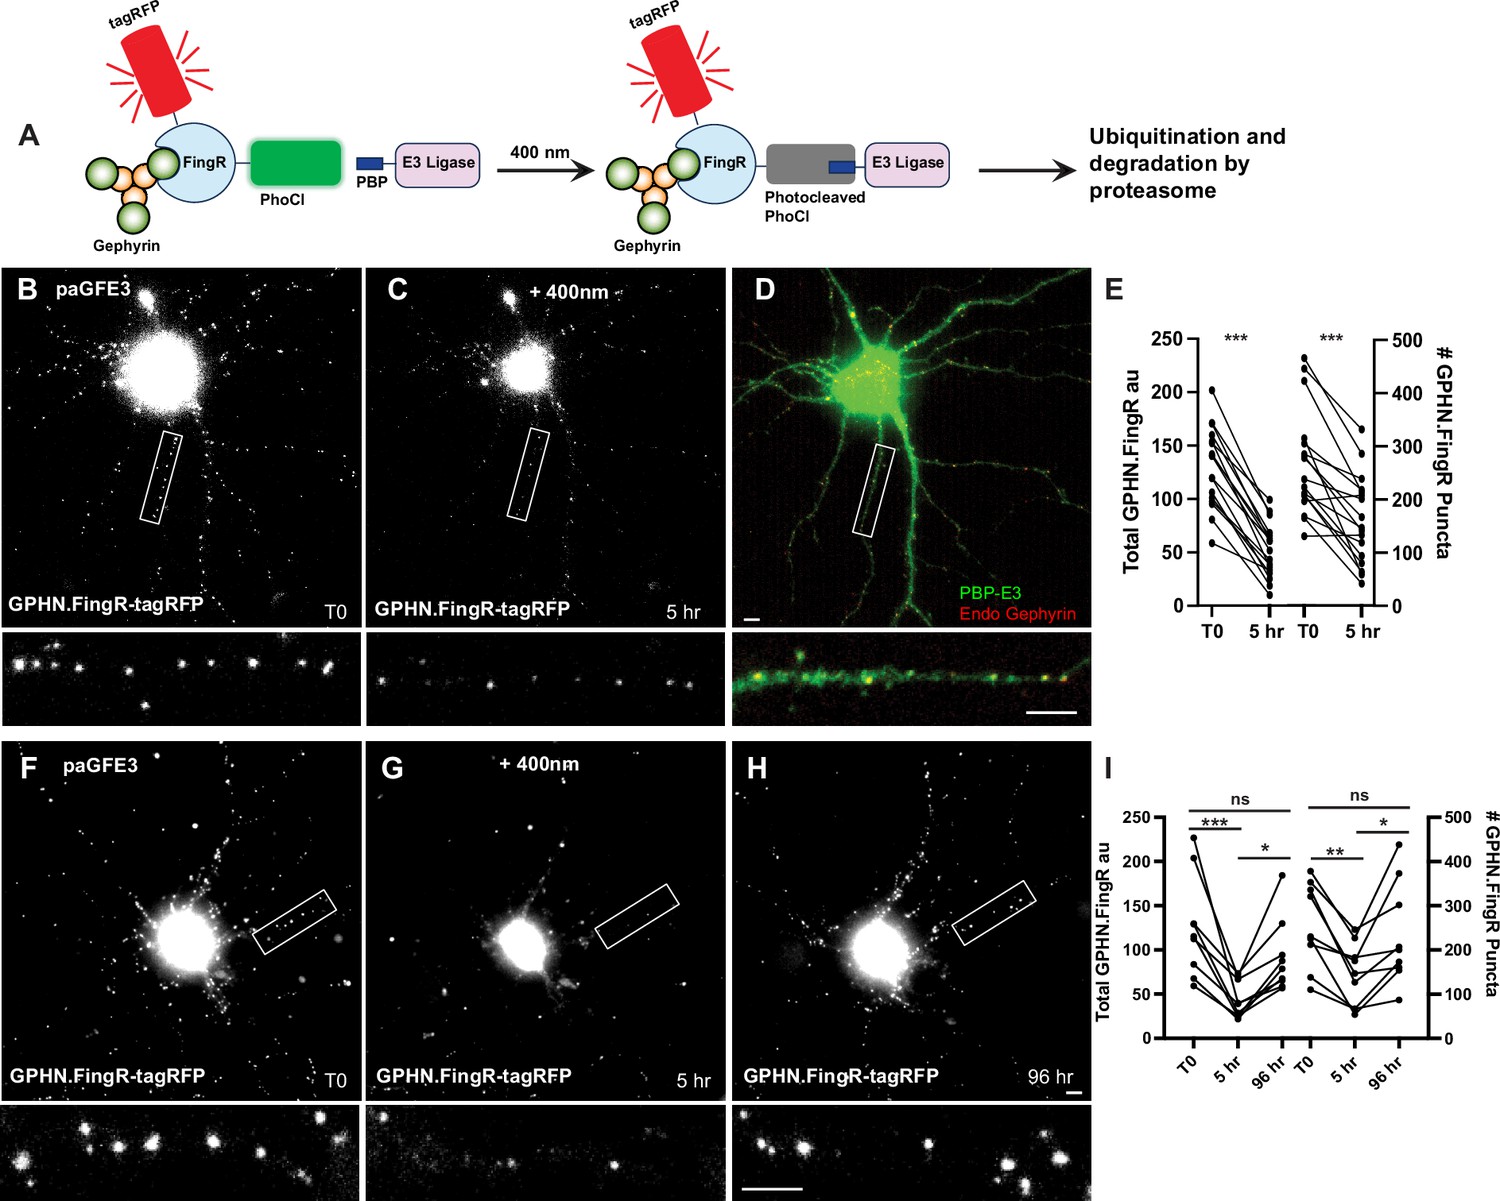
(A) Schematic of paGFE3. Initially, tagRFP-GPHN.FingR-PhoCl2c binds to Gephyrin and PBP-HA-E3 is unbound. After photocleavage with 400 nm light, PBP binds photocleaved PhoCl, recruiting the E3 ligase domain, which ubiquitinates Gephyrin and targets it for degradation by the proteasome. (B) Cultured cortical neuron expressing tagRFP-GPHN.FingR-PhoCl2c + PBP-HA-E3 (pa-GFE3) for 5 days. Closeup of the boxed area shown below. (C) Same neuron as in (B) 5 hr after illumination with 400 nm light for 1 min showing reduced labeling with tagRFP-GPHN.FingR-PhoCl2c. Closeup of the boxed area shown below. (D) Neuron in C immunostained for PBP-HA-E3 (green) and endogenous Gephyrin (red), showing sparse labeling for endogenous Gephyrin. Closeup of the boxed area shown below. (E) Quantification of the total amount of GPHN.FingR and number of GPHN.FingR puncta before and 5 hr after illumination with 400 nm light. ***p < 0.001, Wilcoxon. (F) Cultured cortical neuron expressing pa-GFE3. Closeup of the boxed area shown below. (G) Same neuron as in (F) 5 hr after illumination with 400 nm light for 1 min showing reduced labeling with tagRFP-GPHN.FingR-PhoCl2c. Closeup of the boxed area shown below. (H) Same neuron as in (F), (G) 4 days after illumination showing a recovery of tagRFP-GPHN.FingR-PhoCl2c labeling of synapses. Closeup of the boxed area shown below. (I) Quantification of the total amount of tagRFP-GPHN.FingR-PhoCl2c labeling and number of GPHN.FingR puncta showing recovery of synapses. ***p < 0.001, **p < 0.01, *p < 0.05, ns p > 0.1, Friedman multiple comparison test. Scale bars represent 5 µm.
-
Figure 5—source data 1
Numerical source data for graphs in Figure 5E, I.
- https://cdn.elifesciences.org/articles/103757/elife-103757-fig5-data1-v1.xlsx
Figure 5—figure supplement 1
pa-GFE3 has no background activity.
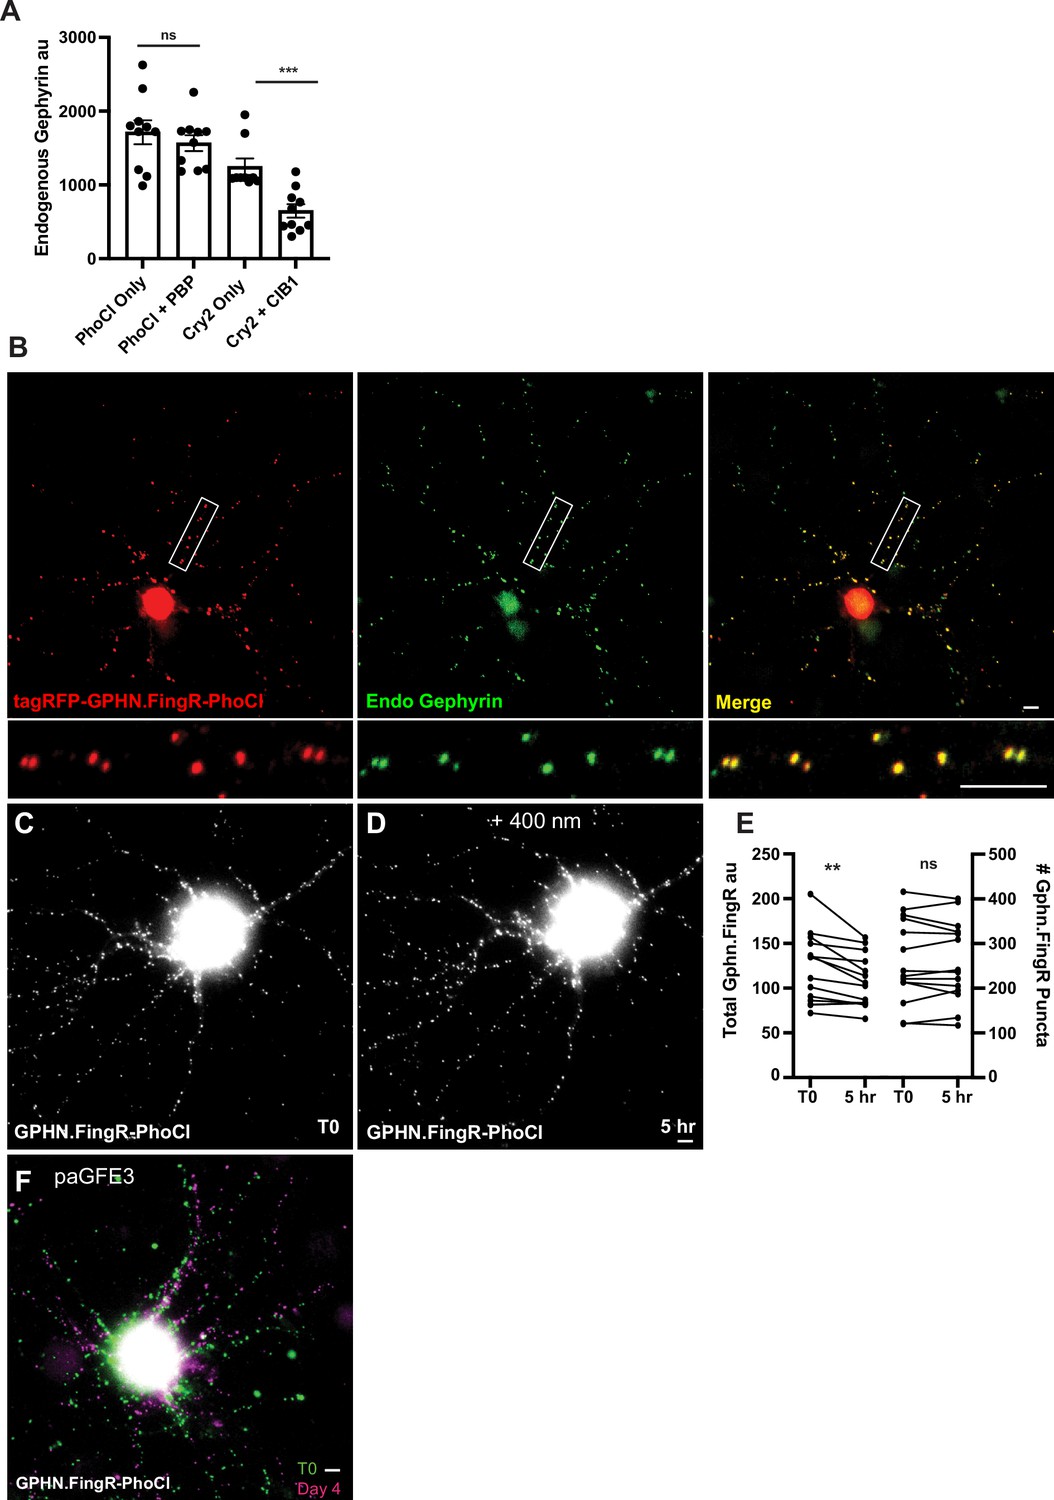
(A) Background activity for the Cryptochrome (Cry2) photoactivation system and PhLIC 5 days after transfection. Cultured neurons transfected with GPHN.FingR-PhoCl+PBP-E3 did not show a significant difference in the intensity of staining with GPHN.FingR-tagRFP compared with those transfected with GPHN.FingR-PhoCl2c only. However, there was a significant reduction in endogenous Gephyrin between cultured neurons transfected with Gephyrin.FingR-Cry2 alone vs. with CIB1-E3. ***p < 0.001, Mann–Whitney; ns, p > 0.05, Mann–Whitney. (B) Cultured neuron expressing transcriptionally regulated tagRFP-Gephyrin.FingR-PhoCl immunostained for tagRFP (red) and endogenous Gephyrin (green). Merge shows colocalization of tagRFP-Gephyrin.FingR-PhoCl with endogenous Gephyrin in yellow. (C) Neuron expressing GPHN.FingR-PhoCl2c alone before exposure to 400 nm light. (D) Same neuron as in (C) after exposure to 400 nm light. There is no apparent loss of labeling. (E) Quantitation of labeling by tagRFP-GPHN.FingR-PhoCl2c in cells transfected with GPHN.FingR-tagRFP alone and then exposed to 400 nm for 1 s and incubated for 5 hr. Staining with GPHN.FingR-tagRFP was compared before and after light exposure. **p < 0.01, ns p > 0.05. (F) Same neuron as in Figure 5F–H showing a comparison of tagRFP-GPHN.FingR-labeled puncta before (green) vs. after (magenta) exposure to 400 nm light.
-
Figure 5—figure supplement 1—source data 1
Numerical source data for graphs in Figure 5—figure supplement 1A, E.
- https://cdn.elifesciences.org/articles/103757/elife-103757-fig5-figsupp1-data1-v1.xlsx
Figure 6 with 1 supplement
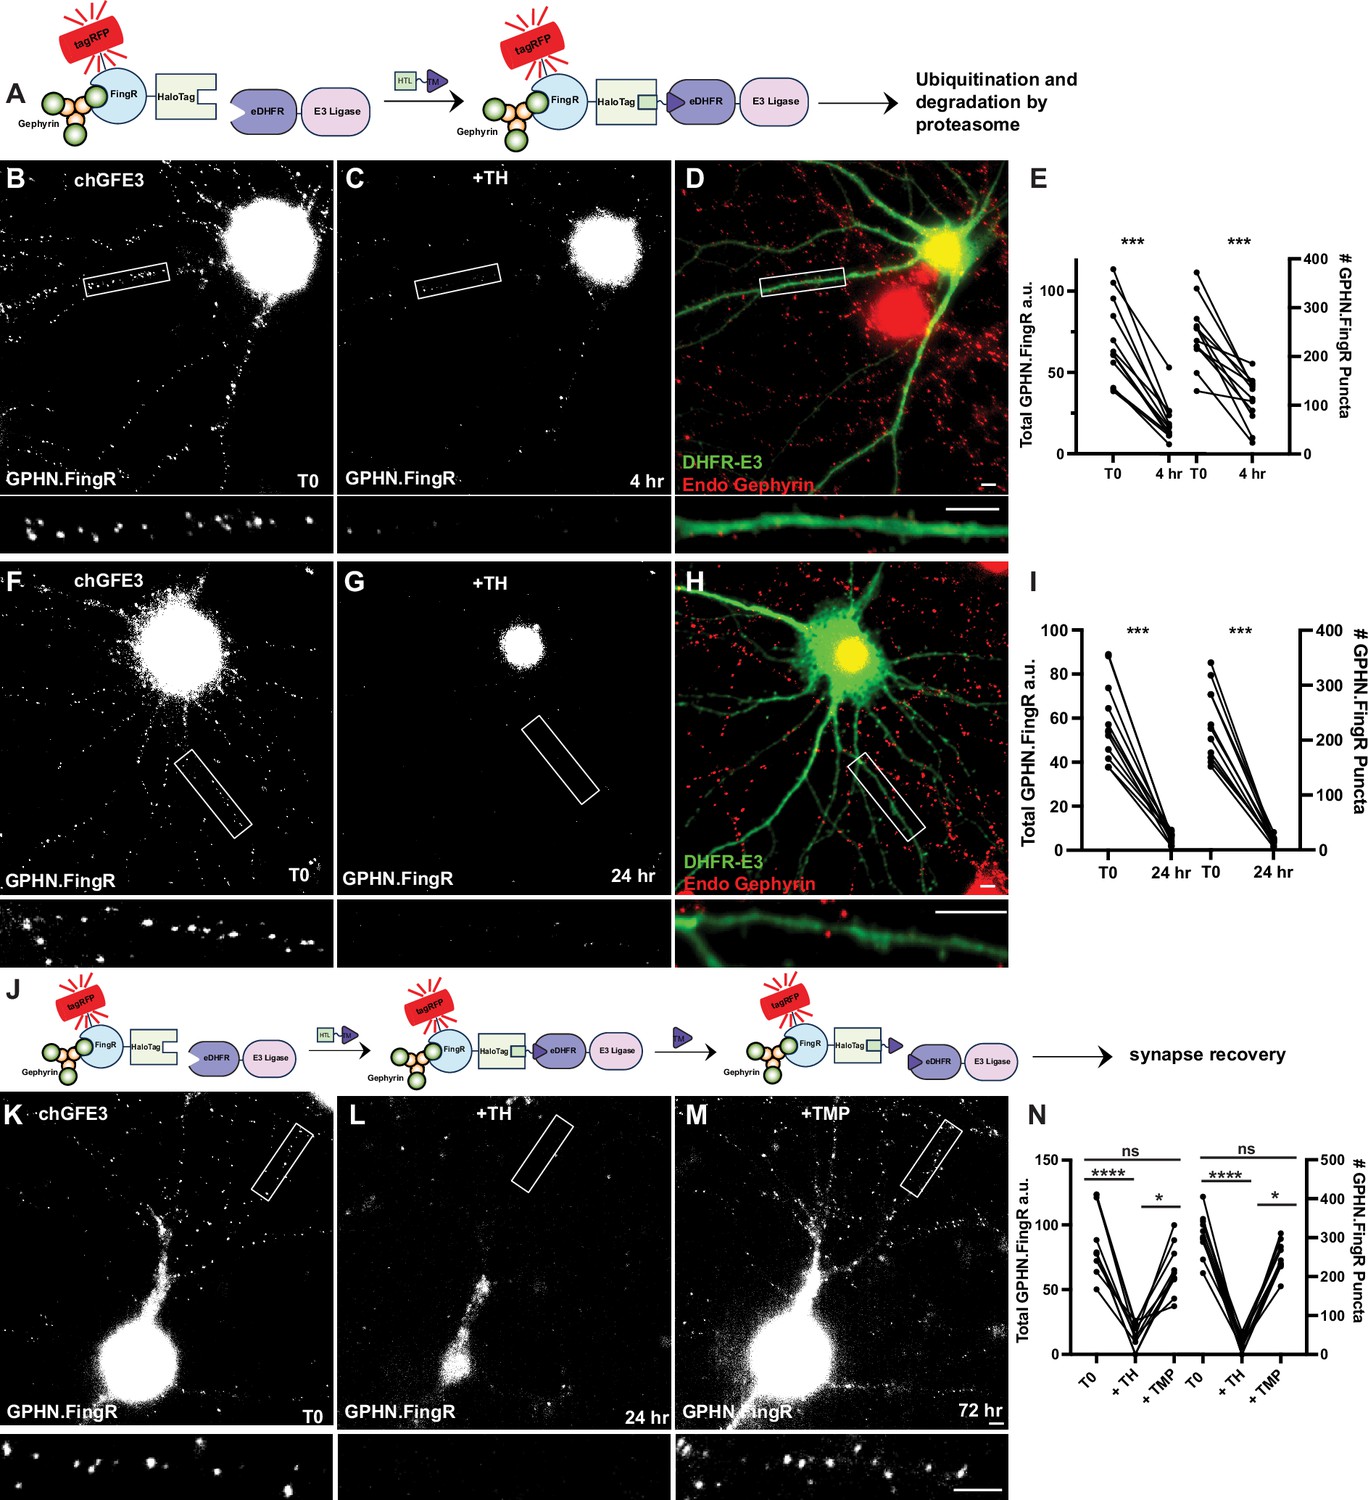
chGFE3 reversibly ablates Gephyrin.
(A) Schematic of chGFE3. The addition of TMP-HaloTag ligand (TH) dimerizes HaloTag and eDHFR, leading to the recruitment of the E3 ligase to Gephyrin, which ubiquitinates and degrades it. (B) Cultured cortical neuron expressing GPHN.FingR-HaloTag and eDHFR-RINGXIAP (chGFE3) for 4 days. Closeup of the boxed area shown below. (C) Same neuron as in (B) 4 hr after addition of 100 nM TH. Closeup of the boxed area shown below. (D) Immunocytochemistry of the neuron in (C) for endogenous Gephyrin (red) and eDHFR-E3XIAP (green). Note the lack of red puncta on dendrites labeled green. Closeup of the boxed area shown below. (E) Quantification of total Gephyrin labeled by GPHN.FingR-tagRFP and number of GPHN.FingR puncta after 4 hr of incubation with 100 nM TH. ***p < 0.001, Wilcoxon. (F) Cultured cortical neuron expressing GPHN.FingR-HaloTag and eDHFR-RING for 4 days. Closeup of the boxed area shown below. (G) Same neuron as in (F) after 24 hr incubation with 100 nm TH showing loss of Gephyrin. Closeup of the boxed area shown below. (H) Neuron in (G) immunostained for endogenous Gephyrin (red) and DHFR-E3 (green). Closeup of the boxed area shown below. (I) Quantification of the total amount of Gephyrin labeling by the GPHN.FingR after the addition of TH. ***p < 0.0001, Friedman multiple comparison test. (J) Schematic illustrating dissociation of chGFE3 with the addition of TMP. (K) Cultured cortical neuron expressing GPHN.FingR-HaloTag and eDHFR-RINGXIAP for 4 days. Closeup of the boxed area shown below. (L) Same neuron as in (K) after 24 hr incubation with 100 nm TH showing loss of Gephyrin. Closeup of the boxed area shown below. (M) Same neuron as in (L) after 48 hr incubation with 100 µM TMP showing recovery of Gephyrin puncta. Closeup of the boxed area shown below. (N) Quantification of the total amount of Gephyrin labeling by the GPHN.FingR after the addition of TH and then TMP. ****p < 0.0001, *p < 0.05, ns p > 0.2 Friedman multiple comparison test. Scale bar represents 5 μm.
-
Figure 6—source data 1
Numerical source data for graphs in Figure 6E, I, N.
- https://cdn.elifesciences.org/articles/103757/elife-103757-fig6-data1-v1.xlsx
Figure 6—figure supplement 1
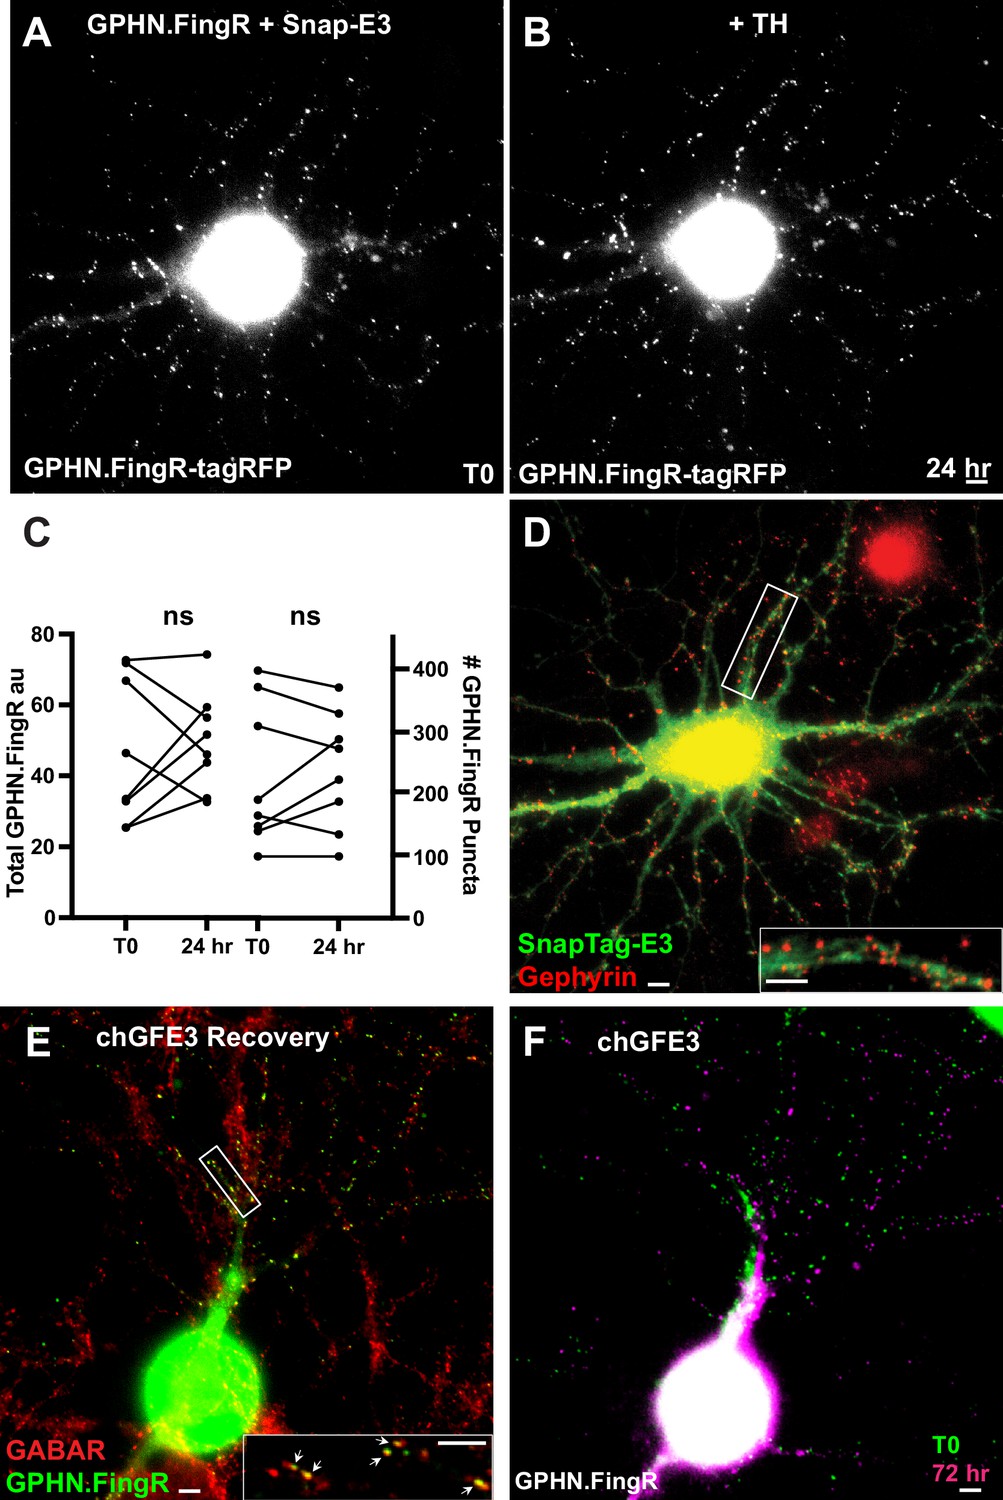
Chemogenetic ablation of inhibitory synapses with chGFE3.
(A) Cultured cortical neuron expressing tagRFP-Gephyrin.FingR-HaloTag and Snap-E3 for 4 days. (B) Same neuron as in (A) 24 hr after addition of 100 nm TH. (C) Quantification of total Gephyrin and number of Gephryin puncta labeled by the GPHN.FingR-HaloTag. Incubation of the neurons co-expressing tagRFP-Gephyrin.FingR-HaloTag and Snap-E3 with TH did not affect Gephyrin (ns, p > 0.05, Wilcoxon). (D) Immunocytochemistry of the neuron in B for endogenous Gephyrin (red) and Snap-E3 (green). Inset shows closeup of boxed area. (E) Immunocytochemistry of the neuron in Figure 6M for GABAA receptors in red and GPHN.FingR in green. Closeup of the boxed area shows colocalization of the GPHN.FingR and GABAA receptor (arrows). (F) Overlay of the GPHN.FingR at T0 before the addition of TH (Figure 6K) and after the addition of TMP to recover synapses at 72 hr (Figure 6M). Scale bars represent 5 µm.
-
Figure 6—figure supplement 1—source data 1
Numerical source data for graphs in Figure 6—figure supplement 1C.
- https://cdn.elifesciences.org/articles/103757/elife-103757-fig6-figsupp1-data1-v1.xlsx
Tables
Key resources table
| Reagent type (species) or resource | Designation | Source or reference | Identifiers | Additional information |
|---|---|---|---|---|
| Recombinant DNA reagent | AAV-CAG-PFE3-P2A-GFP (plasmid) | This paper | RRID:Addgene_236178 | AAV version of constitutive PFE3 |
| Recombinant DNA reagent | AAV-TRE-PFE3-P2A-GFP (plasmid) | This paper | RRID:Addgene_236180 | AAV version of Tet-inducible PFE3 |
| Recombinant DNA reagent | AAV-CAG-RandE3-P2A-GFP | This paper | RRID:Addgene_236181 | AAV version of constitutive control plasmid |
| Recombinant DNA reagent | AAV-TRE-RandE3-P2A-GFP | This paper | RRID:Addgene_236179 | AAV version of inducible control plasmid |
| Recombinant DNA reagent | tagRFP-GPHN.FingR-PhoCl (plasmid) | This paper | RRID:Addgene_236183 | Half of photoactivatable GFE3 (paGFE3) |
| Recombinant DNA reagent | PBP-E3 (plasmid) | This paper | RRID:Addgene_236182 | Other half of paGFE3 |
| Recombinant DNA reagent | TRE-PFE3-HA | This paper | RRID:Addgene_236114 | Tet-inducible-PFE3-HA |
| Recombinant DNA reagent | tagRFP-GPHN.FingR-HaloTag (plasmid) | This paper | RRID:Addgene_236112 | Half of chemically inducible GFE3 (chGFE3) |
| Recombinant DNA reagent | eDHFR-E3 | This paper | RRID:Addgene_236113 | Other half of chGFE3 |
| Antibody | Anti-PSD-95 (mouse monoclonal) | Commercially available. | Novus Biologicals cat. # NB300-556 | 1:3000 |
| Antibody | Anti-GluA1 (rabbit polyclonal) | Commercially available. | Millipore Sigma cat. # ABN241 | 1:1000 |
| Antibody | Anti-GFP (chicken polyclonal) | Commercially available. | Fisher Scientific cat. # NC9510598 | 1:10,000 |
| Antibody | Anti-HA (rabbit polyclonal) | Commercially available. | Cell Signaling cat. # 3724 | 1:1000 |
| Antibody | Anti-MYC (chicken polyclonal) | Commercially available. | Novus Biologicals cat. #NB600-334 | 1:1000 |
| Genetic reagent (M. musculus) | CCK-Cre | Commercially available. | Jackson Laboratories Ccktm1.1(cre)Zjh/J | Strain 012706 |
| Genetic reagent (M. musculus) | Ai27(RCL-hChR2(H134R)/tdT)-D | Commercially available. | Jackson Laboratories B6.Cg-Gt(ROSA)26Sortm27.1(CAG-COP4*H134R/tdTomato)Hze/J | Strain 012567 |
Additional files
Download links
A two-part list of links to download the article, or parts of the article, in various formats.
Downloads (link to download the article as PDF)
Open citations (links to open the citations from this article in various online reference manager services)
Cite this article (links to download the citations from this article in formats compatible with various reference manager tools)
A toolbox for ablating excitatory and inhibitory synapses
eLife 13:RP103757.
https://doi.org/10.7554/eLife.103757.3


