Whole brain comparative anatomy using connectivity blueprints
- John Radcliffe Hospital, University of Oxford, United Kingdom
- Radboud University Nijmegen, Netherlands
- University of Nottingham, United Kingdom
- University of Oxford, United Kingdom
Figures
Figure 1
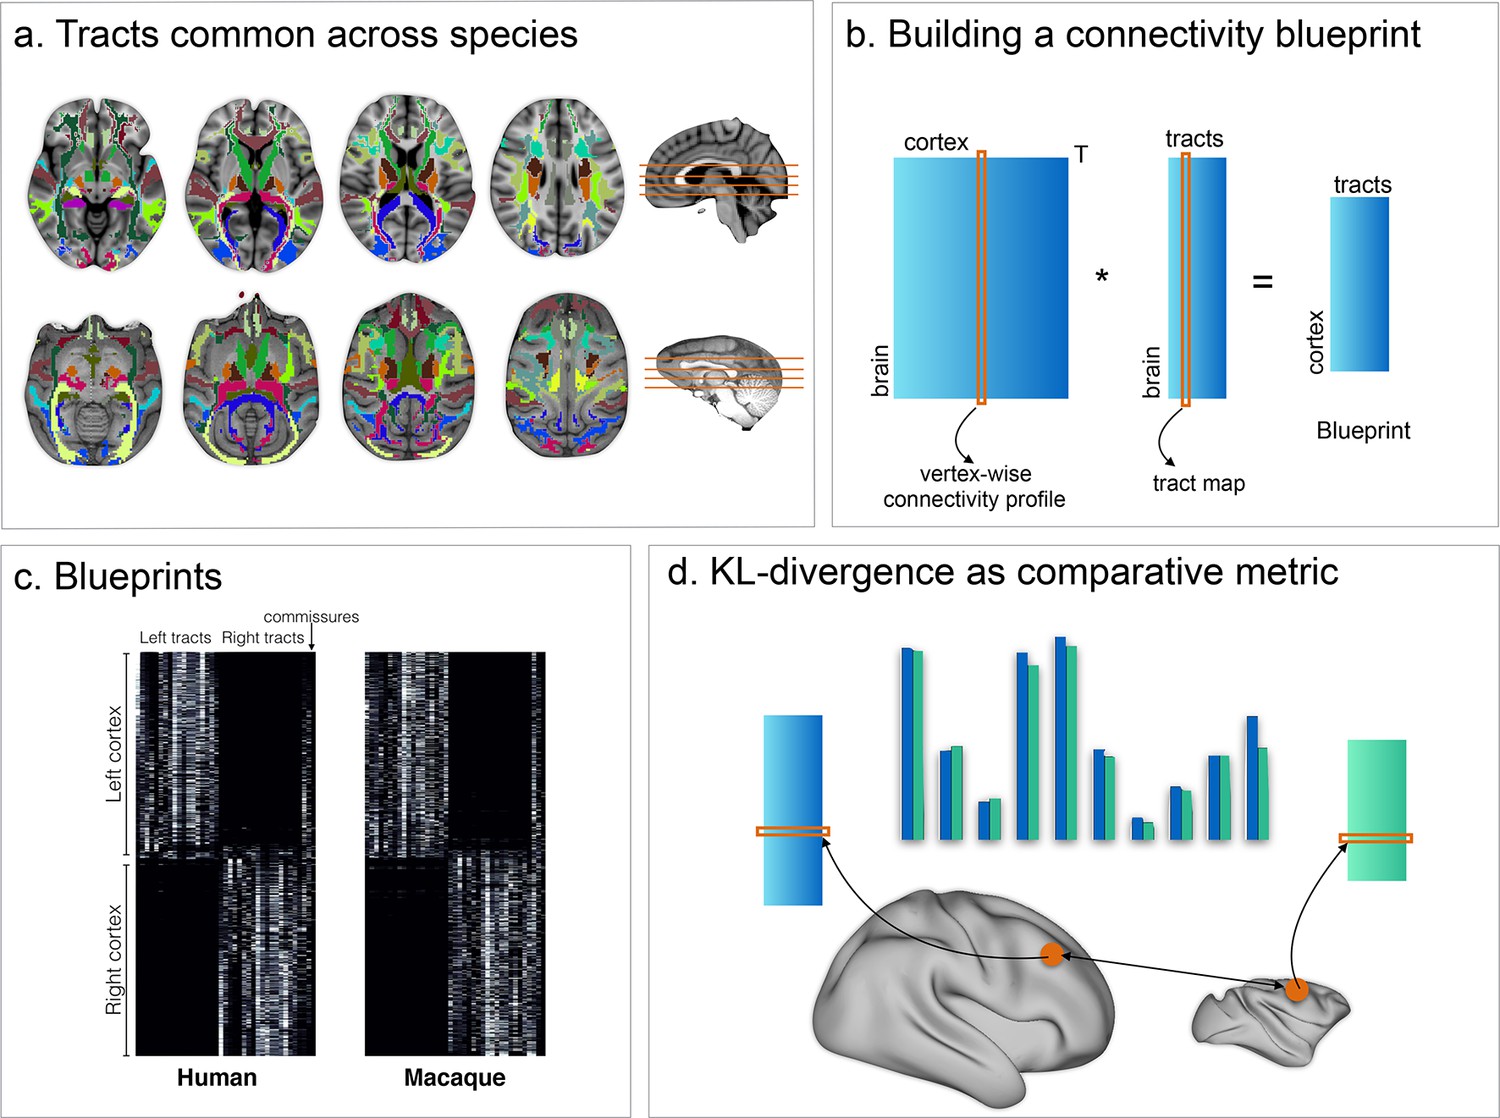
Methods overview.
(a) 39 tracts common across both species were defined and reconstructed using probabilistic tractography. (b) The resulting connectivity matrices were then multiplied by connectivity matrices defining the connectivity of each vertex of the grey matter to the rest of the brain, creating a full connectivity blueprint (c) describing how each vertex is connected to each tract. (d) These blueprints can then be compared using the KL divergence as a comparative metric indicating how each vertex' connectivity fingerprint in one brain differs from that of each vertex in an other brain.
Figure 2
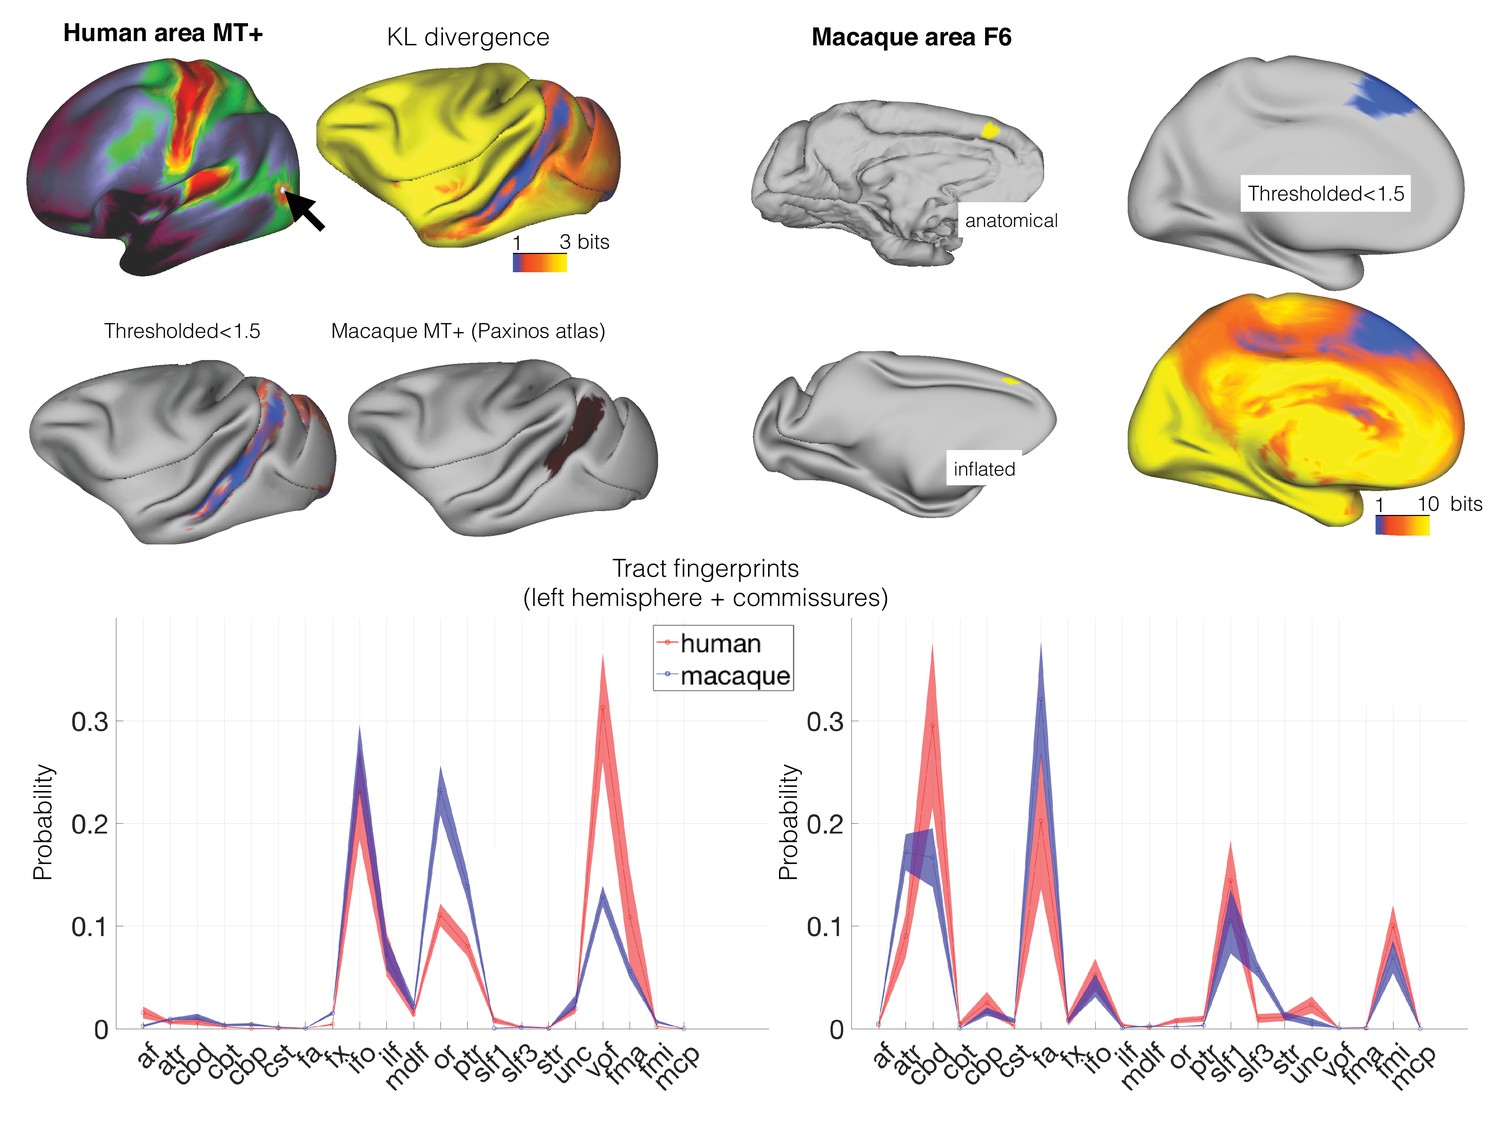
Identifying areas across species.
(left panel) MT+ complex. Human MT+ can be defined as an area of high cortical myelin in the ventral occipitotemporal cortex (top left). Its connectivity fingerprint (shading indicates standard error) indicates strong projections from visual tracts such as the optic radiation (OR), vertical occipital fascicle (VOF), inferior fronto-occipital fascicle (IFO), and inferior longitudinal fascicle (ILF) (bottom row). According to previous work, macaque MT+ is located in the ventral bank of the superior temporal sulcus (middle right). Calculating the KL divergence of the connectivity fingerprint of human MT+ and the connectivity fingerprint of each macaque vertex (top right) shows the lowest divergence in the STS, with a thresholded image identifying the area predicted by previous work (middle left). (right panel) Area F6. Macaque area F6 (left) receives projections from, among others, the frontal aslant (FA) and the superior longitudinal fascicle (SLF) (bottom row). Calculating the KL divergence of the connectivity fingerprint of macaque F6 and the connectivity fingerprint of each human vertex shows the lowest divergence on the medial wall, with a thresholded image identifying human pre-SMA (right).
Figure 3
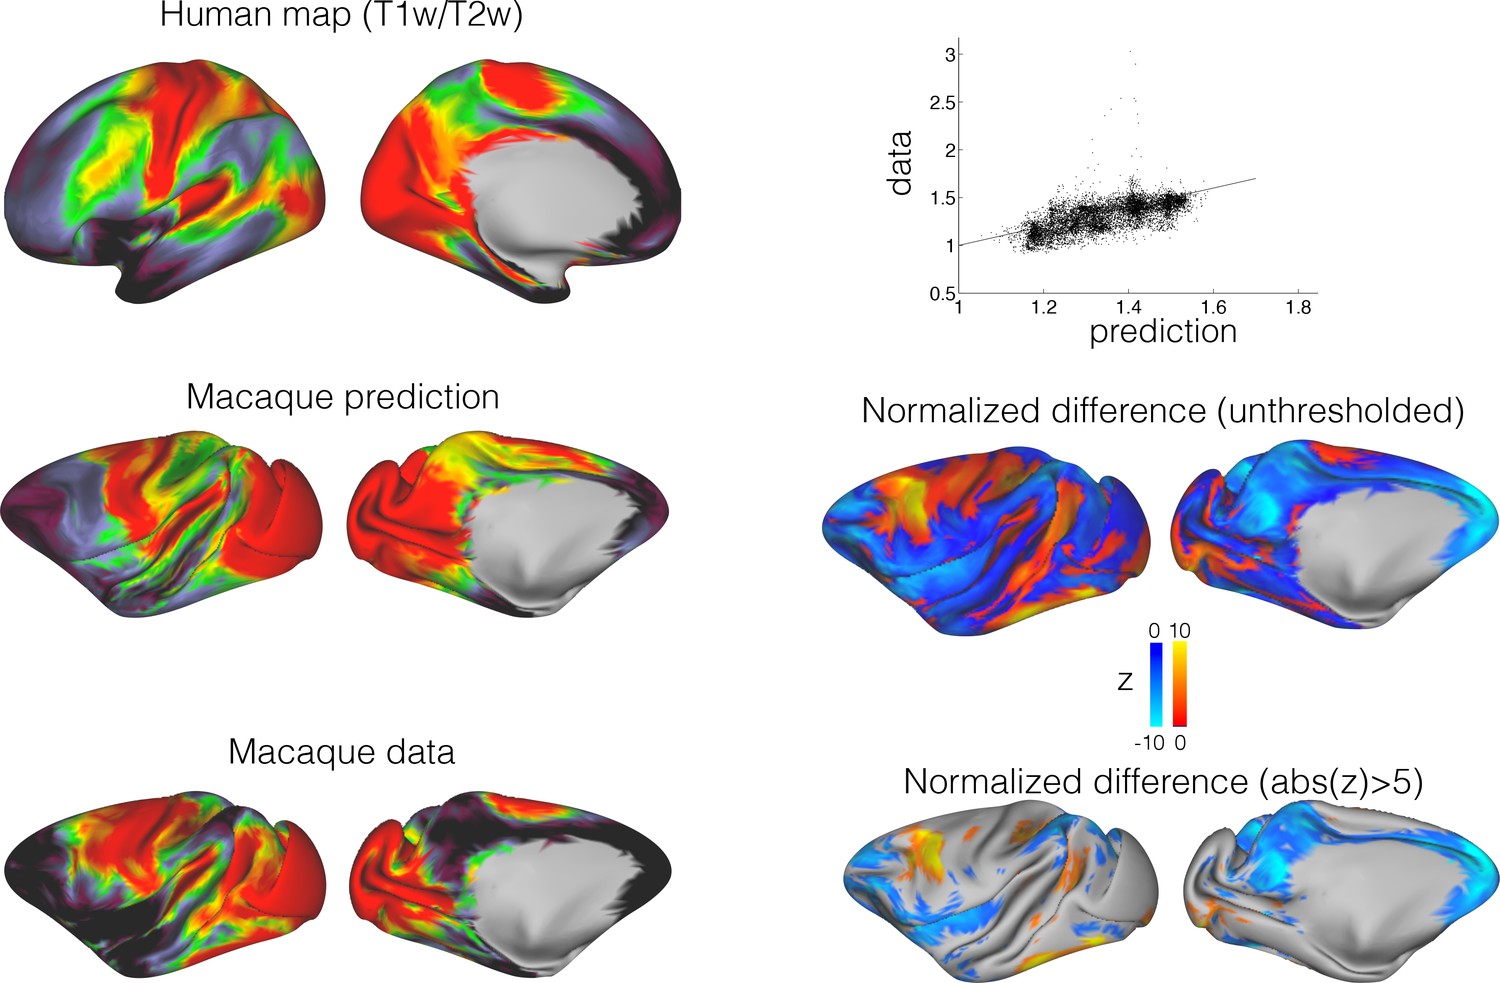
Predicting macaque T1/T2-weighted map from the human map.
The connectivity blueprint can be applied to use the human T1/T2-weighted map (top left) and predict the same map in the macaque (middle left). The predicted macaque map shows strong similarity to an actual macaque map based on 19 macaques from the Yerkes dataset (Donahue et al., 2018). The scatter plot on the top right shows how well the predicted map follows the data (straight line is y = x). To assess the variability in the predicted map, we calculated a distribution based on individual variability (using all pairs of human/macaque datasets to build separate blueprints to drive the predictions). The resulting distribution was compared to the measured map (Z=(mean-data)/std) (middle right and bottom right). These assessments demonstrate that the predicted map shows striking similarities to the actual map, but important differences are noticeable in part of the association cortex.
Figure 4
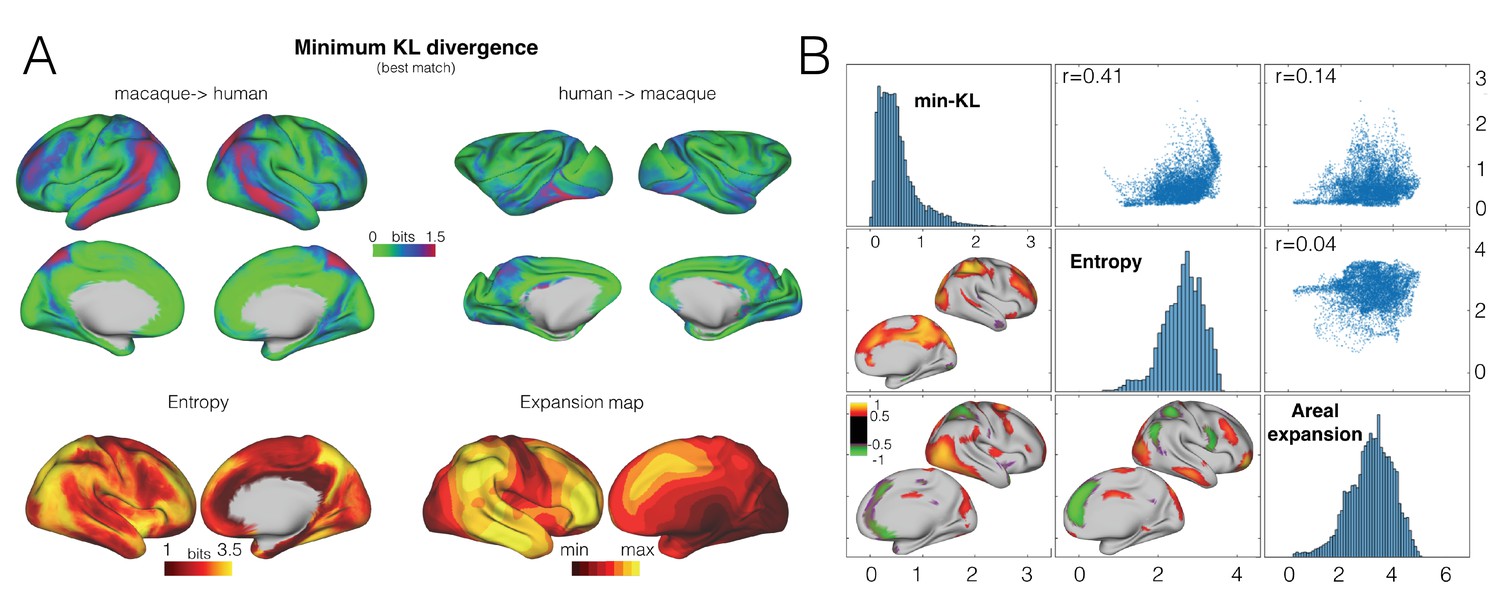
Divergence map.
(A) A map of the minimum KL divergence of each vertex with all vertices in the other species brain indicates which areas are least similar across the two brain (top panels). This map can be compared with an entropy map showing the diversity of tracts reaching each vertex (bottom left) and a landmark-based cortical expansion map (figure generated from data available from the SUMSDB archive (http://brainvis.wustl.edu/sumsdb/archive_index.html) (Van Essen and Dierker, 2007) (bottom right). (B) We compared the KL divergence map to the entropy and expansion maps. Diagonal shows the distribution of values of each map, upper right scatter plots show relationship between all vertices of the pairs of maps; bottom left maps show the local correlations between two maps.
Figure 5

Connectivity fingerprint of an area with high divergence.
The highlighted vertex on the human cortical surface has a connectivity fingerprint dissimilar to any found in the macaque. The vertex's connectivity fingerprint shows a much stronger influence of the arcuate fascicle (AF) even when compared to the most similar vertices in the macaque (the blue line is the average of the top 1% most similar macaque vertices). Shading indicates standard errors.
Figure 6
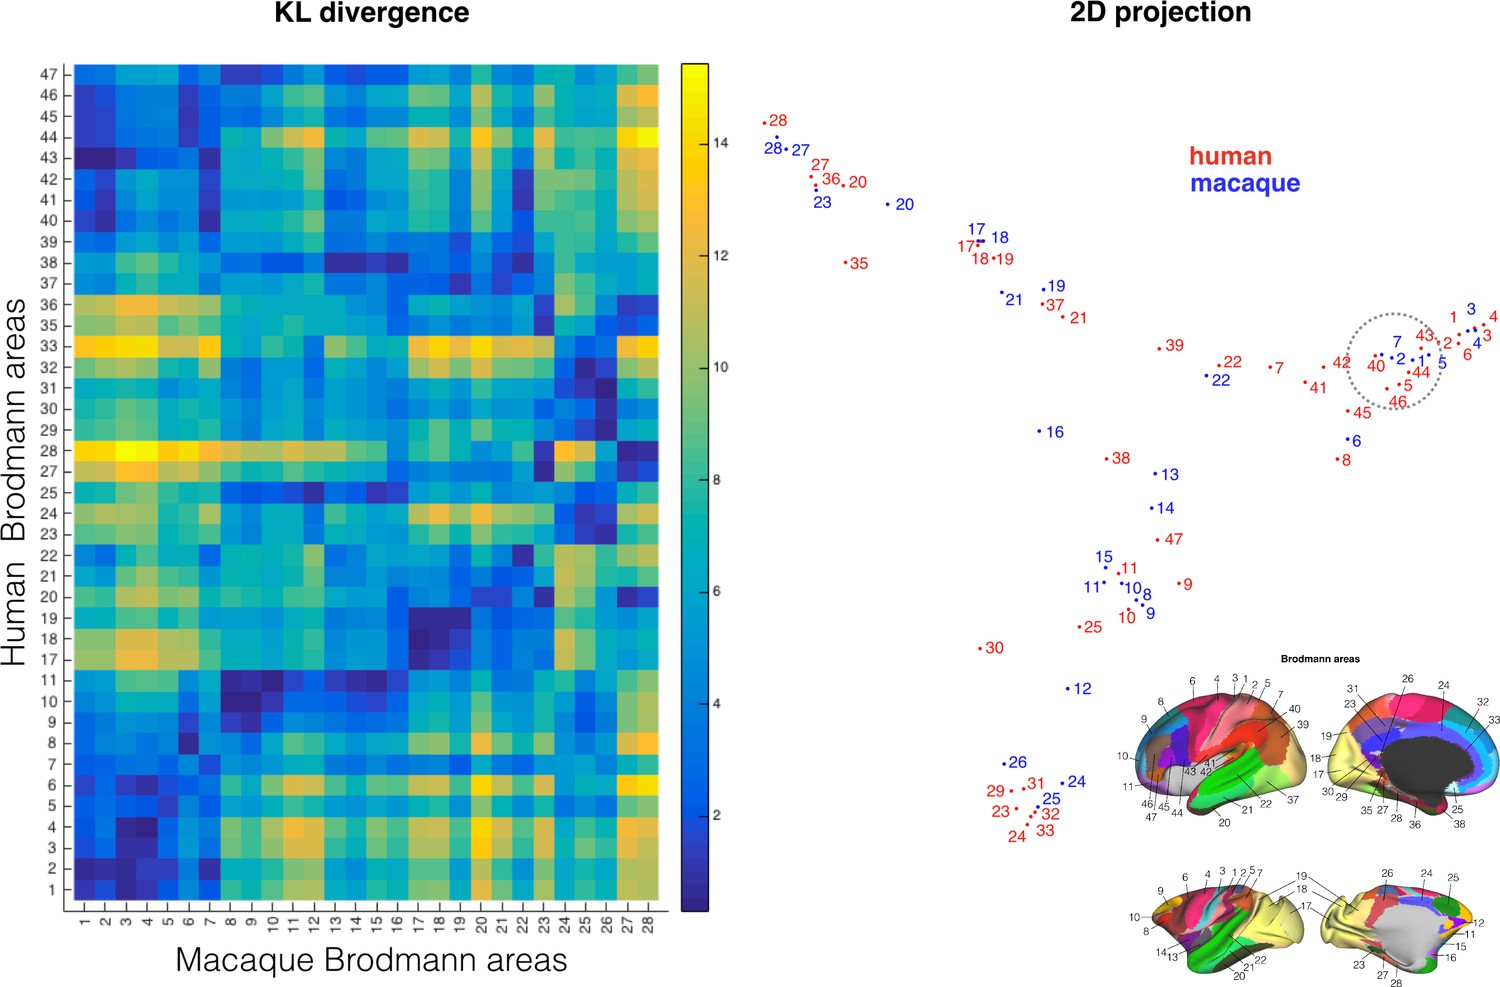
Comparing cortical atlases across species.
The connectivity blueprints can be used to compare the connectivity fingerprint of cortical atlases of different species as illustrated here using Brodmann's maps of the human and monkey (left). Using spectral clustering, the divergence of the maps can be illustrated in a 2D representation, clustering together regions with the most similar connectivity fingerprint (left). Inset on the bottom right shows the atlas areas.
Additional files
-
Transparent reporting form
- https://doi.org/10.7554/eLife.35237.008
Download links
A two-part list of links to download the article, or parts of the article, in various formats.
Downloads (link to download the article as PDF)
Open citations (links to open the citations from this article in various online reference manager services)
Cite this article (links to download the citations from this article in formats compatible with various reference manager tools)
Whole brain comparative anatomy using connectivity blueprints
eLife 7:e35237.
https://doi.org/10.7554/eLife.35237


