Meta-Research: Gender inequalities among authors who contributed equally
- University of Connecticut, United States
- Johns Hopkins School of Public Health, United States
Figures
Figure 1 with 1 supplement
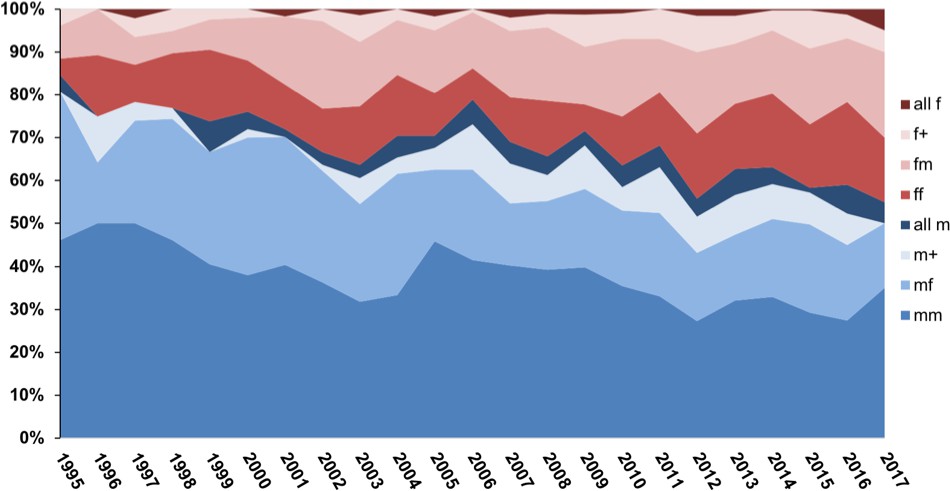
Proportion of various gender combinations among joint first authors in scientific papers published between 1995 and 2017.
We studied papers in which two or more authors shared the first author position: ‘fm’, ‘ff’, ‘mf’ and ‘mm’ represent papers in which two authors shared the first author position, with the actual order of the authors being female-male, female-female, male-female and male-male. For papers in which more than two authors shared the first author position, ‘all f’ means that all these authors were female, ‘all m’ means they were all male, and ‘f+’ or 'm+' means that the first author listed in a mixed-gender combination was female or male respectively. The plot shows that the proportion of combinations in which a male author is listed first (various shades of blue) is decreasing over time.
-
Figure 1—source data 1
Raw data for Figure 1.
Excel database of the papers examined in this study. Grey shaded rows indicate the papers excluded from analysis when gender identification was not able to be determined.
- https://doi.org/10.7554/eLife.36399.007
Figure 1—figure supplement 1
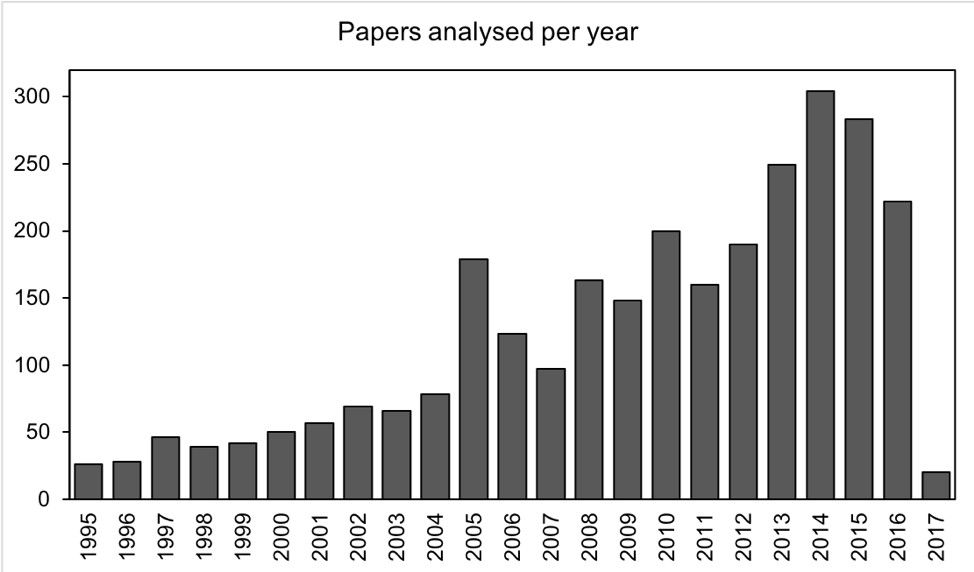
Distribution of papers analyzed per year in this study.
https://doi.org/10.7554/eLife.36399.005-
Figure 1—figure supplement 1—source data 1
Raw data for Figure 1—figure supplement 1.
- https://doi.org/10.7554/eLife.36399.006
Figure 2
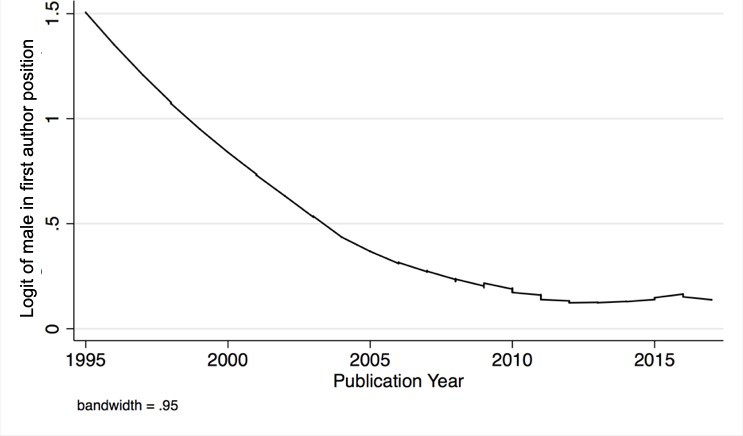
Gender bias in the first author position over time.
Temporal trend in gender bias among two equally contributing authors of different gender: the y-axis is log (p/(1 p)) where p is the probability of bias; the x-axis is publication year. In the absence of bias, log (p/(1 p)) would be zero.
-
Figure 2—source data 1
Data analysis tables used for Figure 2.
- https://doi.org/10.7554/eLife.36399.009
-
Figure 2—source data 2
Data analysis log.
- https://doi.org/10.7554/eLife.36399.010
-
Figure 2—source data 3
Data management file for data analysis.
- https://doi.org/10.7554/eLife.36399.011
Figure 3

Percentage of papers with two or more authors contributing equally as a function of time.
Points denote the percentage of papers with where more than two authors claimed equal contribution. Trendline R2 value as 0.4857.
-
Figure 3—source data 1
Raw data for Figure 3.
- https://doi.org/10.7554/eLife.36399.013
-
Figure 3—source data 2
Data analysis log.
- https://doi.org/10.7554/eLife.36399.014
-
Figure 3—source data 3
Data management file for data analysis.
- https://doi.org/10.7554/eLife.36399.015
Figure 4
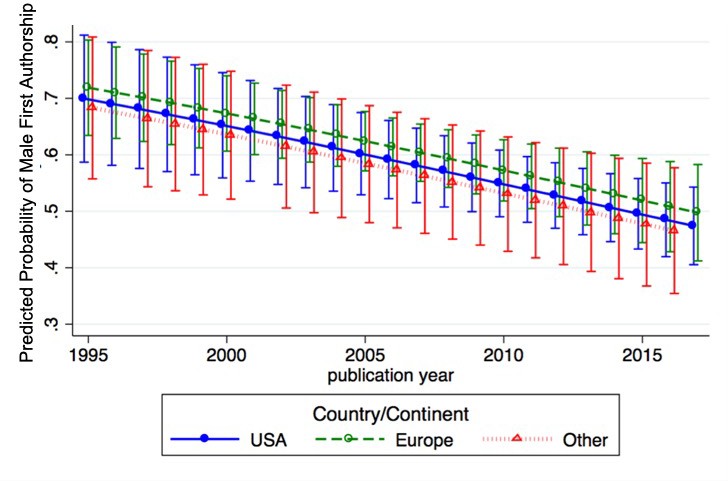
Gender bias in first authorship by year and geography.
Predicted probabilities of male first authorship by year for three geographical regions (USA: blue; Europe: green; Other: red) among papers with two equally contributing authors of different gender (N = 972).
-
Figure 4—source data 1
Data analysis tables used for Figure 4.
- https://doi.org/10.7554/eLife.36399.017
-
Figure 4—source data 2
Data analysis log.
- https://doi.org/10.7554/eLife.36399.018
-
Figure 4—source data 3
Data management file for data analysis.
- https://doi.org/10.7554/eLife.36399.019
Tables
Table 1
Summary of data on authors listed a contributing equally.
https://doi.org/10.7554/eLife.36399.002| Article statistics | Contributed equally = 2 | Contributed equally > 2 | |||||||||
|---|---|---|---|---|---|---|---|---|---|---|---|
| Journal title | Total | Unknown | Usable | mm | mf | ff | fm | m first | f first | all M | all f |
| Biophysical J | 101 | 2 | 99 | 60 | 17 | 5 | 9 | 5 | 0 | 3 | 0 |
| Cell Reports | 105 | 1 | 104 | 41 | 12 | 11 | 15 | 12 | 9 | 3 | 1 |
| Curr Biol | 103 | 4 | 99 | 41 | 23 | 14 | 12 | 2 | 4 | 2 | 1 |
| eLife | 90 | 2 | 88 | 25 | 18 | 15 | 11 | 5 | 6 | 8 | 0 |
| J Biol Chem | 300 | 28 | 272 | 99 | 52 | 35 | 48 | 15 | 11 | 6 | 6 |
| J Cell Bio | 101 | 3 | 98 | 22 | 35 | 14 | 17 | 4 | 4 | 2 | 0 |
| J Clin Invest | 121 | 6 | 115 | 42 | 19 | 11 | 19 | 12 | 6 | 6 | 0 |
| J Exp Med | 210 | 13 | 197 | 65 | 40 | 26 | 30 | 10 | 8 | 11 | 7 |
| J Immunol | 308 | 10 | 298 | 89 | 76 | 59 | 48 | 16 | 3 | 5 | 2 |
| mBio | 100 | 2 | 98 | 27 | 26 | 12 | 14 | 8 | 7 | 3 | 1 |
| Nature | 104 | 6 | 98 | 44 | 12 | 7 | 8 | 14 | 3 | 10 | 0 |
| PLOS Bio | 110 | 9 | 101 | 39 | 18 | 13 | 17 | 6 | 5 | 3 | 0 |
| PLOS Comp Bio | 95 | 2 | 93 | 45 | 14 | 6 | 11 | 3 | 4 | 10 | 0 |
| PLOS Genet | 186 | 8 | 178 | 52 | 26 | 16 | 23 | 20 | 35 | 6 | 0 |
| PLOS Negl Trop Dis | 105 | 6 | 99 | 32 | 13 | 21 | 19 | 8 | 4 | 2 | 0 |
| PLOS Pathogen | 179 | 7 | 172 | 35 | 39 | 33 | 25 | 20 | 9 | 7 | 4 |
| PNAS | 411 | 14 | 397 | 151 | 66 | 44 | 61 | 30 | 19 | 22 | 4 |
| Science | 128 | 11 | 117 | 34 | 15 | 21 | 25 | 7 | 9 | 6 | 0 |
| Initial search* | 57 | 0 | 57 | 0 | 35 | 0 | 22 | 0 | 0 | 0 | 0 |
| Misc† | 120 | 2 | 118 | 57 | 27 | 14 | 12 | 4 | 2 | 1 | 1 |
| 3034 | 136 | 2898 | 1000 | 583 | 377 | 446 | 201 | 148 | 116 | 27 | |
-
*These papers are from the early searches used to identify the variables in this study and only mf and fm numbers were recorded. These 57 papers were removed from subsequent analysis.
†Miscellaneous includes the following journals; the number of articles in which two or more authors made equal contributions is shown in parenthesis for each journal. American Journal of Pathology (1); Angewandte Chemie (17); Biochemical and Biophysical Research Communications (2); Blood (1); BMC Bioinformatics (1); BMC Proceedings (1); BMC Systems Biology (1); Brain Pathology (1); Cancer Research (2); Cell (6); EMBO Journal (4); European Journal of Immunology (1); FEBS Letters (27); Genes and Development (5); Genome Research (1); Hepatology (1); International Journal of Cancer (2); Journal of Bone and Mineral Research (2); Journal of Cell Science (2); Journal of Molecular Biology (1); Journal of Physiology (2); Memórias do Instituto Oswaldo Cruz (15); Nature Biotechnology (1); Nature Cell Biology (1); Nature Genetics (15); Nature Materials (1); Nature Medicine (4); PLOS One (1); Protein Science (1).
-
Table 1—source data 1
All data organized by journal, author/gender category, and year.
- https://doi.org/10.7554/eLife.36399.003
Additional files
-
Supplementary file 1
Characteristics of journals chosen for this study.
- https://doi.org/10.7554/eLife.36399.020
-
Transparent reporting form
- https://doi.org/10.7554/eLife.36399.021
Download links
A two-part list of links to download the article, or parts of the article, in various formats.
Downloads (link to download the article as PDF)
Open citations (links to open the citations from this article in various online reference manager services)
Cite this article (links to download the citations from this article in formats compatible with various reference manager tools)
Meta-Research: Gender inequalities among authors who contributed equally
eLife 8:e36399.
https://doi.org/10.7554/eLife.36399


