Temporally specific engagement of distinct neuronal circuits regulating olfactory habituation in Drosophila
- Biomedical Sciences Research Centre “Alexander Fleming”, Greece
- University of Crete, Greece
Figures
Figure 1 with 1 supplement

An experience-dependent odor-specific decrement in osmotaxis.
Mean Performance Indices calculated as detailed in Material and methods are shown ±SEM. Positive values indicate aversion of the odorant and movement towards the air-bearing arm. Negative values indicate attraction to the odorants. Stars indicate significant differences. (A) Pre-exposure of the two control strains (w1118 and w*) to the aversive odorant 3-Octanol (1X OCT) for 3 or 4 min results in significant avoidance attenuation (p<0.0001, n ≥ 6 for all groups), compared to flies that did not experience the odor except during testing (naive). (B) In contrast to naïve animals, pre-exposure to the aversive odor Benzaldehyde (1X BNZ) for 4 min resulted in significantly attenuated response in both strains (p<0.0001, n ≥ 6 for all groups). (C) Pre-exposure of w1118 and w* flies to the attractant Ethyl Acetate (1X ETA) for 3 or 4 min precipitated a significant reduction in its attraction (p<0.0001, n ≥ 7 for all groups). (D) Exposure of both control strains to the attractive 2,3-Butanedione (1X BUT) for 4 min decreased significantly its attraction (p<0.0001, n ≥ 7 for all groups). Detailed statistics are found on Supplementary file 1 and all data are presented in Figure 1—source data 1.
-
Figure 1—source data 1
An experience-dependent odor.
- https://doi.org/10.7554/eLife.39569.005
Figure 1—figure supplement 1

Continuous and pulsed OCT stimulation has the same effect on subsequent osmotaxis.
Mean Performance Indices ± SEM are shown. Stars indicate significant differences from the naive response unless specified otherwise. (A) Repetitive 1X OCT stimulation (2 × 30 s) does not yield habituation, similar to the response after continuous odor exposure (ANOVA p=0.7125, n ≥ 14 for all groups). (B) Four 1 min 1X OCT pulses resulted in habituation (grey bar, p=0.0001), similar to the response after continuous odor exposure (black bar, p=0.0003). (n = 14 for all groups). Detailed statistics are found on Supplementary File 1 and all data are presented in Figure 1—figure supplement 1—source data 1.
-
Figure 1—figure supplement 1—source data 1
Continuous and pulsed OCT stimulation has the same effect on subsequent osmotaxis.
- https://doi.org/10.7554/eLife.39569.004
Figure 2 with 1 supplement
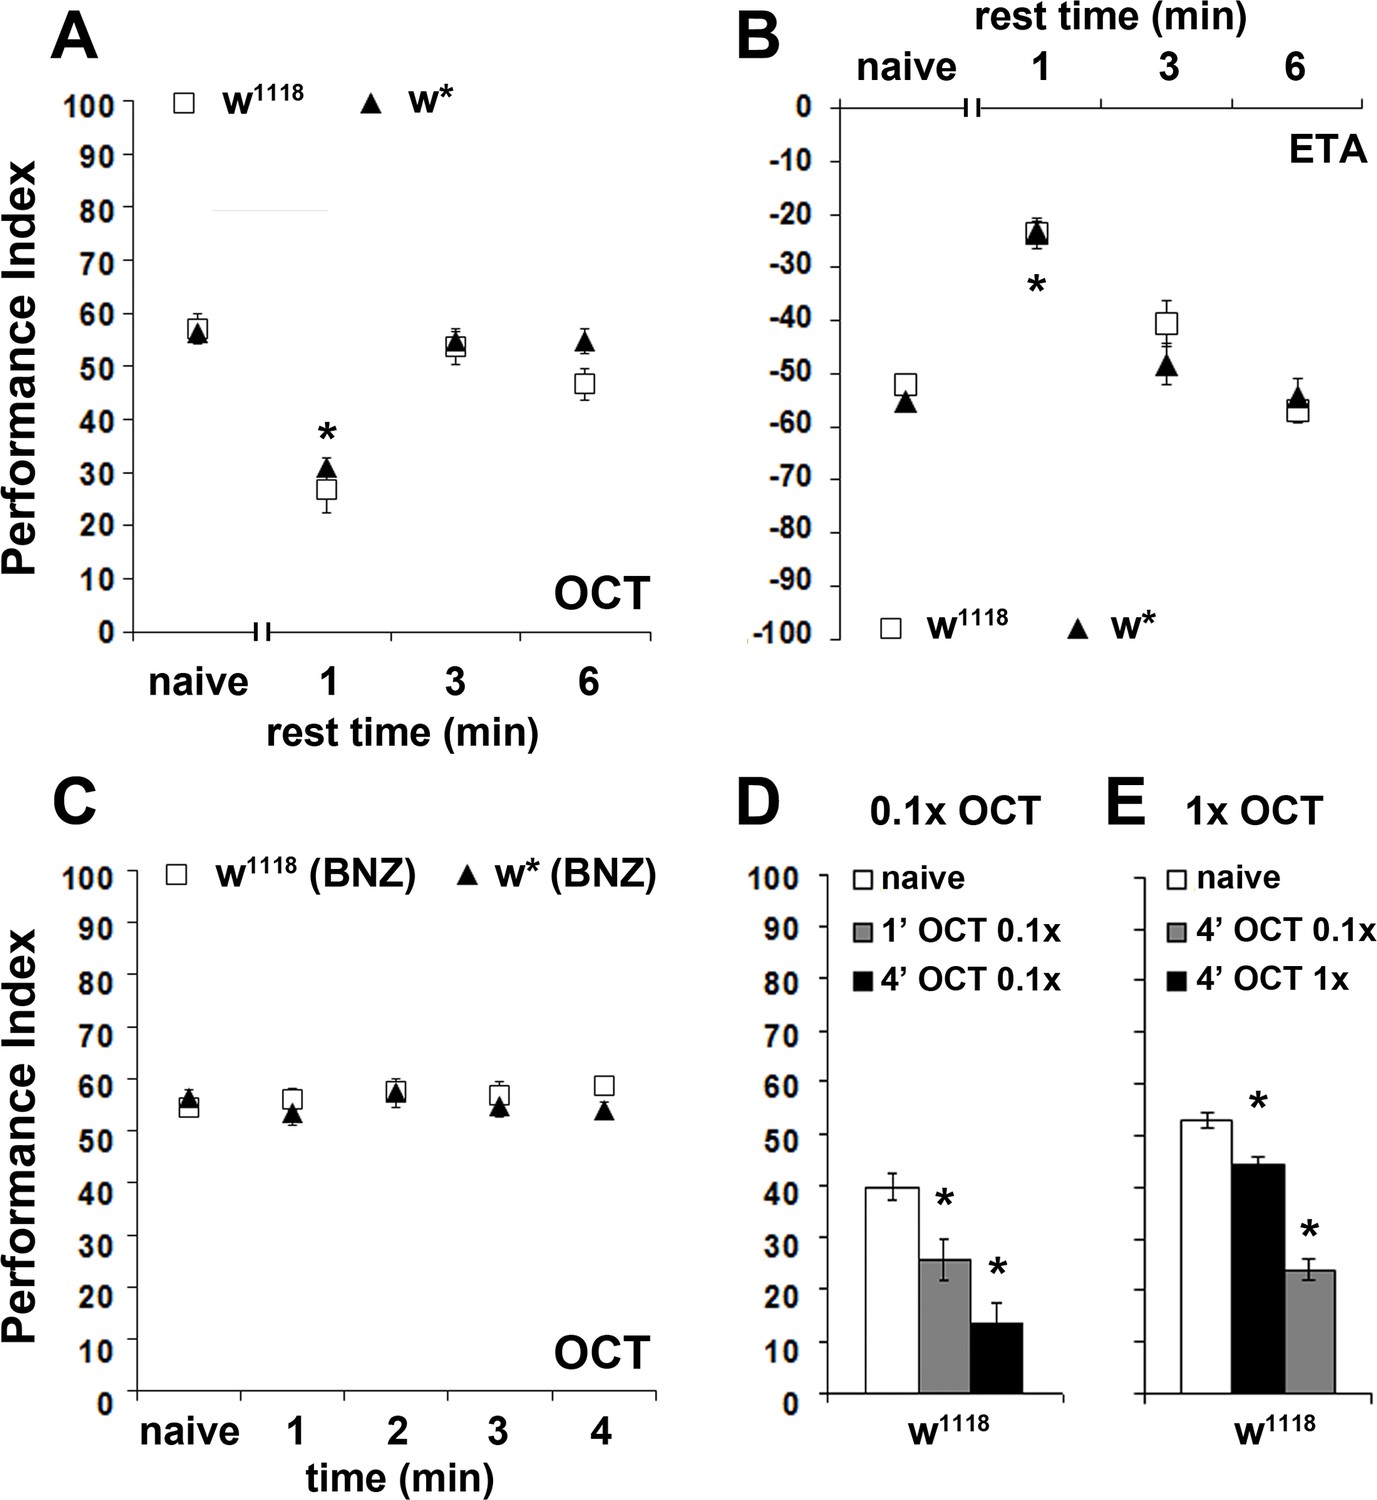
The osmotactic response attenuation conforms to habituation parameters.
Mean Performance Indices ± SEM are shown in all figures. Positive values indicate aversion, while negative values indicate attraction. Stars indicate significant differences from the naïve response unless specified otherwise. (A) A 3 or 6 min rest after a 4-min exposure results in spontaneous recovery of 1X OCT avoidance. Spontaneous recovery was not observed after 1 min of rest (p<0.0001, n ≥ 9 for all groups). (B) A 3 or 6 min rest following a 4-min exposure resulted in spontaneous recovery of attraction to 1X ETA, whereas 1 min of rest did not (p<0.0001, n ≥ 7 for all groups). (C) Pre-exposure to 1X BNZ for 1–4 min did not result in significant osmotactic decrement in subsequent 1X OCT avoidance (ANOVA p=0.7192, n ≥ 7 for all groups). (D) Pre-exposure and testing with 0.1X OCT results a significant decrease in response both after 4 min (black bar, p<0.0001), and after only 1 min of exposure (p=0.0086). (n ≥ 13 for all groups) (E) 4 min of exposure to 0.1X OCT followed by testing with 1X OCT (black bar) precipitated significant osmotactic attenuation (p=0.0096), but 4 min of pre-exposure to 1X OCT yielded deeper attenuation (p<0.0001) that was significant different to that of 0.1X OCT (p<0.0001). (n ≥ 8 for all groups) Detailed statistics are found on Supplementary file 1 and all data are presented in Figure 2—source data 1.
-
Figure 2—source data 1
The osmotactic response attenuation conforms to habituation parameters.
- https://doi.org/10.7554/eLife.39569.009
Figure 2—figure supplement 1
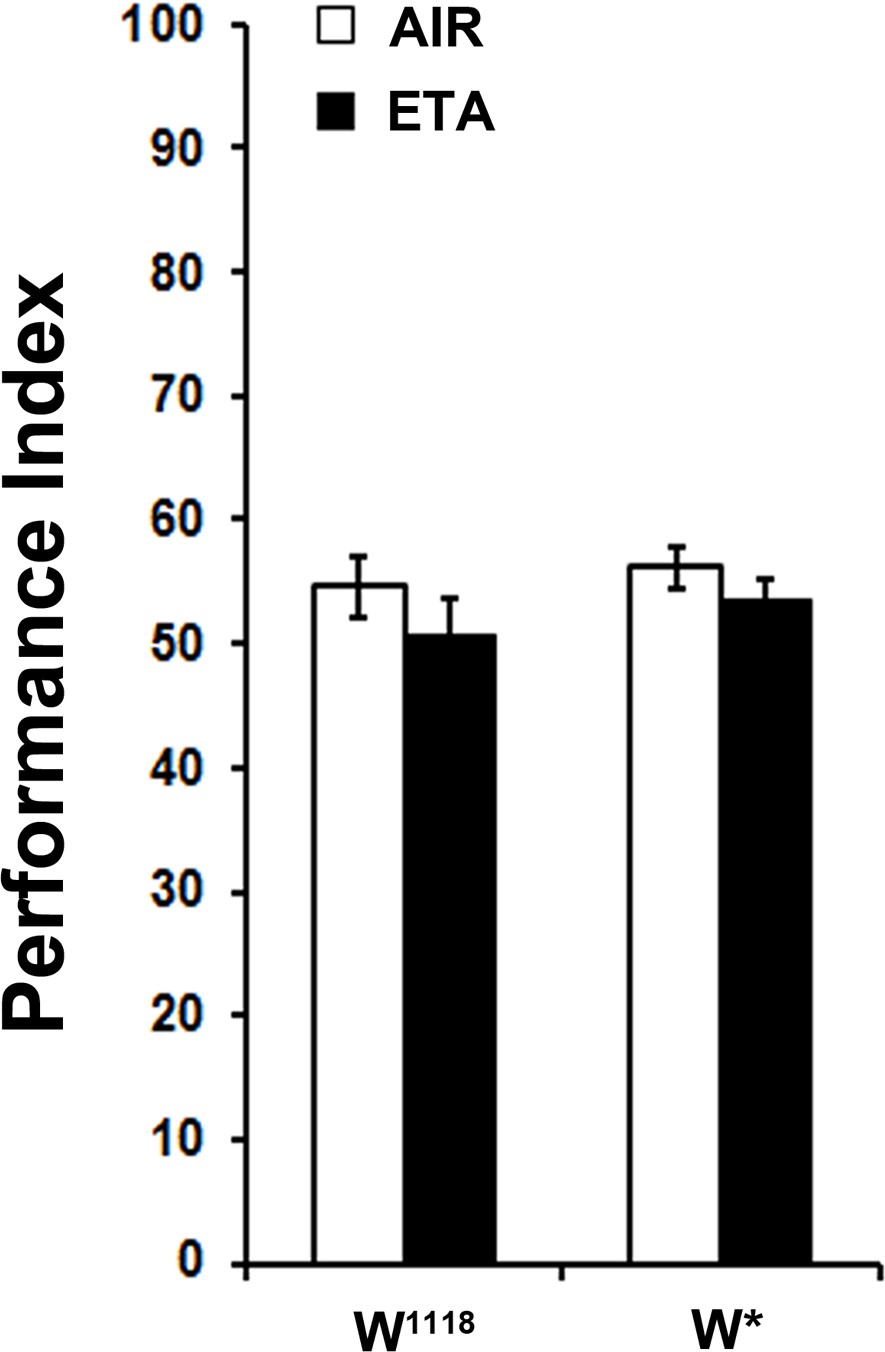
Exposure to the attractive odor ETA does affect subsequent OCT avoidance.
Mean Performance Indices ± SEM are shown in all figures. Stars indicate significant differences from the naive response unless specified otherwise. Pre-exposure to the attractive Ethyl Acetate (1X ETA) for 4 min did not result in diminished subsequent avoidance of OCT for both control strains (ANOVA p=0.1332 for w1118 and ANOVA p=0.2597 for w*, n = 8 for all groups). Detailed statistics are found on Supplementary file 1 and all data are presented in Figure 2—figure supplement 1—source data 1.
-
Figure 2—figure supplement 1—source data 1
Exposure to the attractive odor ETA does affect subsequent OCT avoidance.
- https://doi.org/10.7554/eLife.39569.008
Figure 3
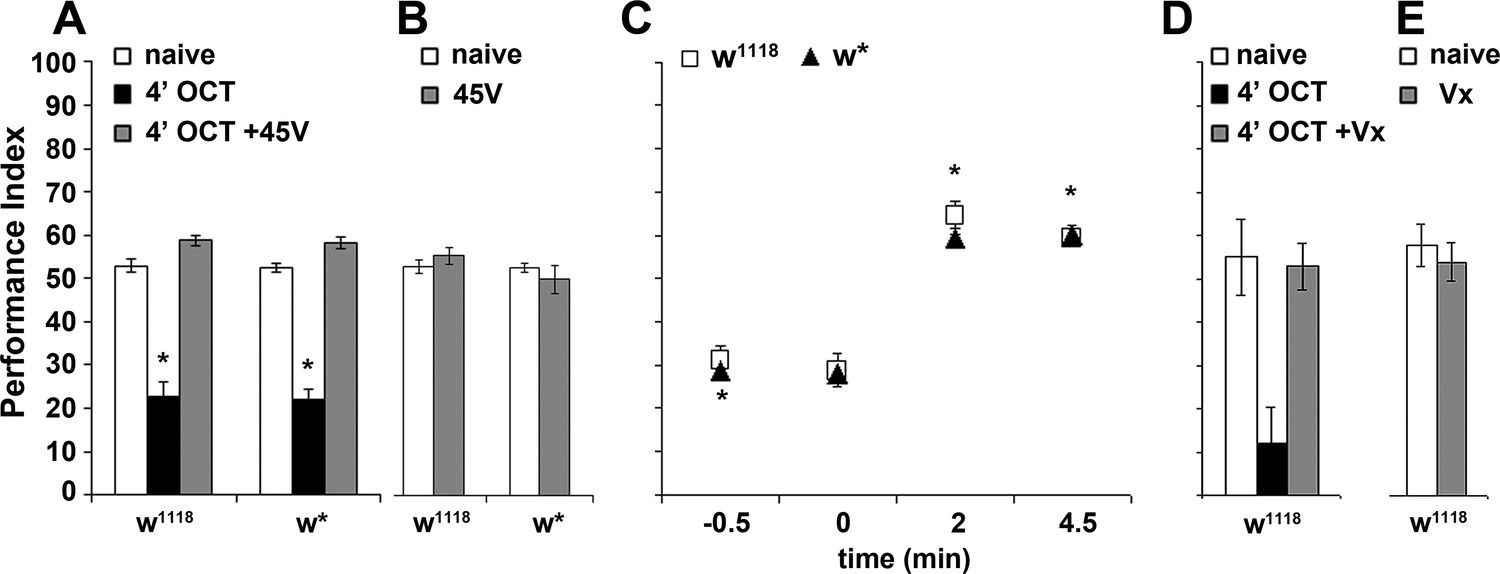
Dishabituation with mechanosensory stimuli results in recovery of the naive response.
Mean Performance Indices ± SEM are shown in all figures. Stars indicate significant differences from the naive response unless specified otherwise. (A) Application of a 45V electric footshock after the 4 min odor exposure (grey bar) leads to reversal of the habituated response (black bar) in both w1118 and w* control strains (p=0.1412 and 0.0873, n ≥ 8 for all groups). (B) Application of a 45V electric footshock to naïve animals does not affect their response to the odorant (ANOVA p=0.3461, n ≥ 8 for all groups). (C) A 45V electric footshock was applied 30 s before (−0.5), concurrent with the onset of odor exposure (0), 2 min into the odor exposure (2), or 30 s post-exposure prior to testing. Dishabituation was evident only when the shock was delivered during or just after 1X OCT exposure (p<0.0001 for 2 and 4.5 min compared to −0.5, n ≥ 7 for all groups). (D) Application of a 3 s vortex at maximum speed (grey bar) after the habituating 4-min odor exposure (black bar, p=0.0010) led to recovery (p=0.9729) of the naïve response (open bar). (n = 10 for all groups) (E) Application of a 3 s vortex to naive animals did not affect their response to the odorant (ANOVA p=0.5460, n = 18 for all groups). Detailed statistics are found on Supplementary file 1 and all data are presented in Figure 3—source data 1.
-
Figure 3—source data 1
Dishabituation with mechanosensory stimuli results in recovery of the naive response.
- https://doi.org/10.7554/eLife.39569.011
Figure 4 with 2 supplements
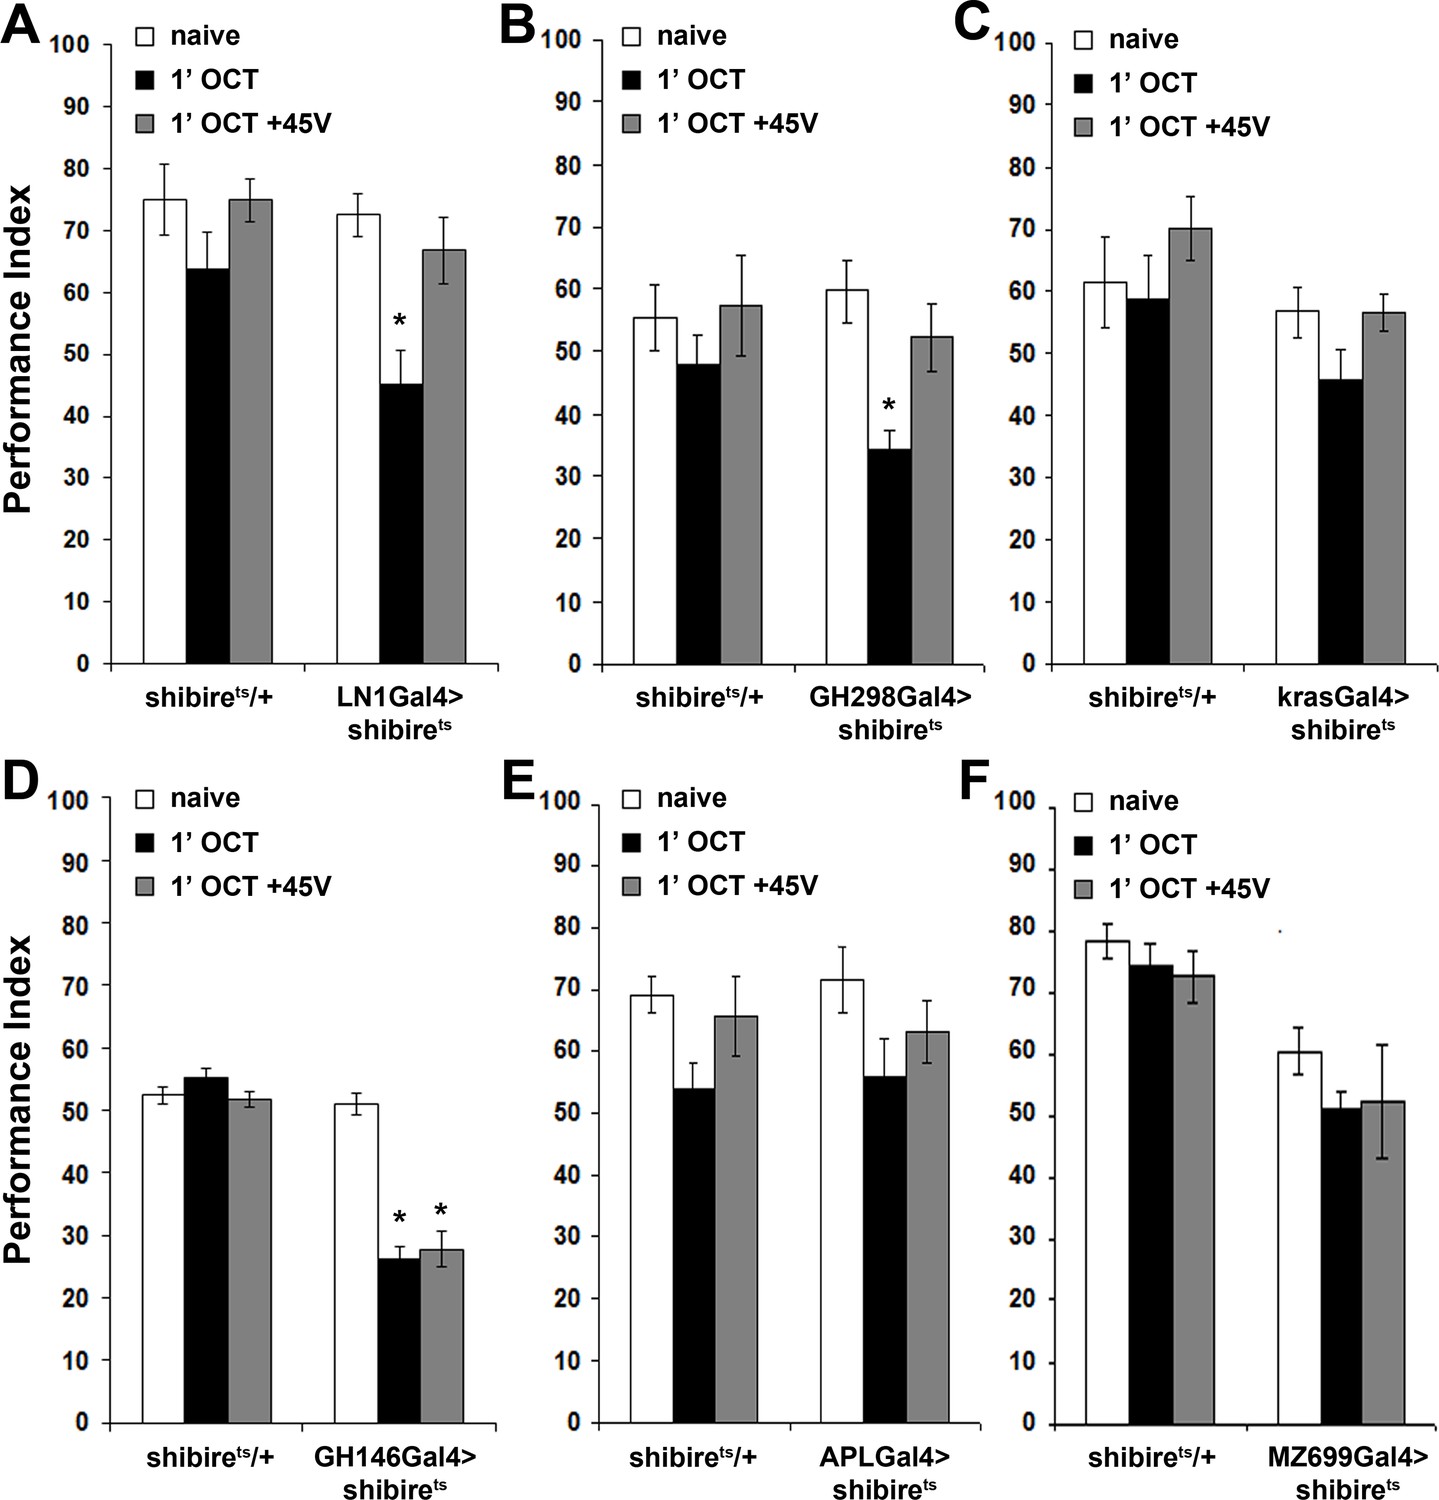
Inhibitory local interneurons and excitatory projection neurons are necessary for habituation latency.
Mean Performance Indices ± SEM are shown in all figures. Stars indicate significant differences from the naive response unless specified otherwise. (A) Functional silencing of iLNs with UAS-shibirets under LN1GAL4 resulted in premature/facilitated habituation after only 1 min of 1X OCT exposure (black bar, p=0.0012), which recovers to naive levels after a single 45V electric footshock (grey bar, p=0.6268). In contrast, UAS-shibirets/+controls did not present significant differences among treatment groups. (n ≥ 9 for all groups) (B) Functional silencing of the GH298GAL4-marked iLNs with UAS-shibirets facilitates habituation, apparent after 1 min of odor exposure (black bar, p<0.0001), which recovered to naïve levels by a 45V electric footshock (grey bar, p=0.4332). In contrast, UAS-shibirets/+controls did not present significant differences among treatment groups. (n ≥ 10 for all groups) (C) Functional silencing of the krasGAL4-marked eLNs driving UAS-shibirets did not affect responsiveness to 1X OCT after 1 min of exposure. Controls were similarly unaffected (black bar, ANOVA p=0.1171, n ≥ 10 for all groups). (D) Functional silencing of the GH146Gal4-marked excitatory projection neurons with UAS-shibirets resulted in facilitated habituation after 1 min of exposure (black bar, p<0.0001) and blocked footshock dishabituation (grey bar, p<0.0001). Control UAS-shibirets/+flies did not present significant response differences irrespective of treatment. (n ≥ 8 for all groups) (E) Blocked neurotransmission from APL neurons did not affect the response to 1X OCT following 1 min of exposure, similar to the responses of control groups (black bar, ANOVA p=0.1573, n ≥ 11 for all groups). (F) Expression of UAS-shibirets in MZ699GAL4 neurons to functionally silence the iPNs did not precipitate differences from the naive response, or from control flies (black bar, ANOVA p=0.4033, n ≥ 10 for all groups). Detailed statistics on Supplementary File 1 and all data are presented in Figure 4—source data 1.
-
Figure 4—source data 1
Inhibitory local interneuronsand excitatoryprojection neuronsare necessary for habituation latency.
- https://doi.org/10.7554/eLife.39569.017
Figure 4—figure supplement 1
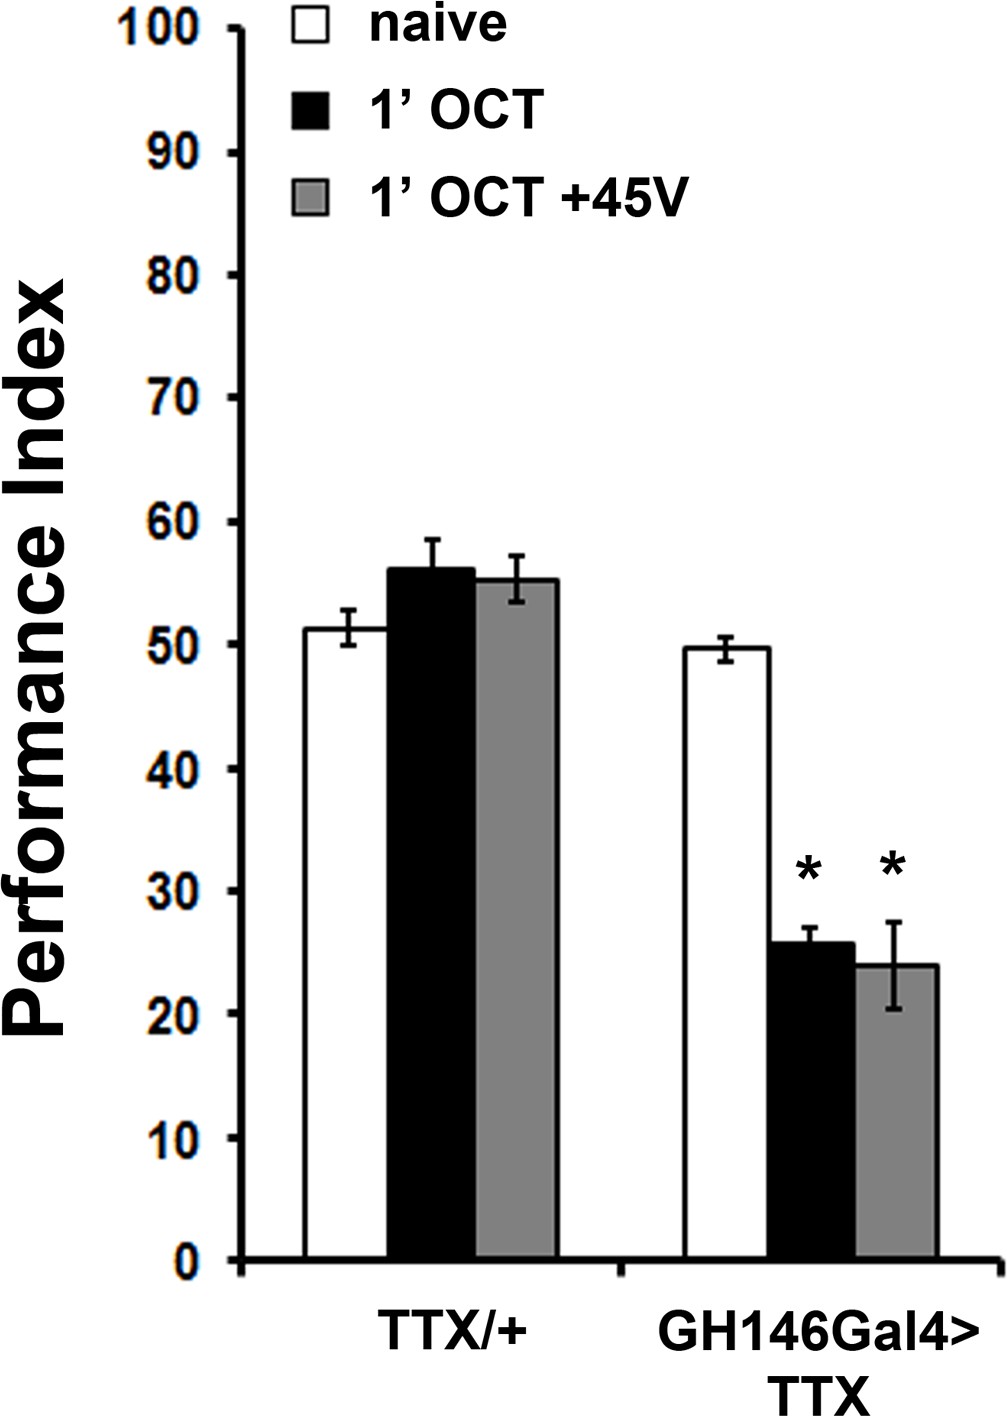
Expression of Tetanus Toxin Light Chain (TTX) under GH146Gal4 results in premature habituation
Mean Performance Indices ± SEM are shown in all figures. Stars indicate significant differences from the naive response unless specified otherwise. Expression of Tetanus Toxin Light Chain (TTX) in the projection neurons under GH146Gal4 blocks neurotransmission and results in premature habituation after only 1 min of 1X OCT exposure (black bar, p<0.0001) and inability to dishabituate (grey bar, p<0.0001). (n ≥ 6 for all groups). Detailed statistics are found on Supplementary file 1 and all data are presented in Figure 4—figure supplement 1—source data 1.
-
Figure 4—figure supplement 1—source data 1
Expression ofTetanus Toxin Light Chain(TTX) under GH146Gal4 results in premature habituation.
- https://doi.org/10.7554/eLife.39569.015
Figure 4—figure supplement 2
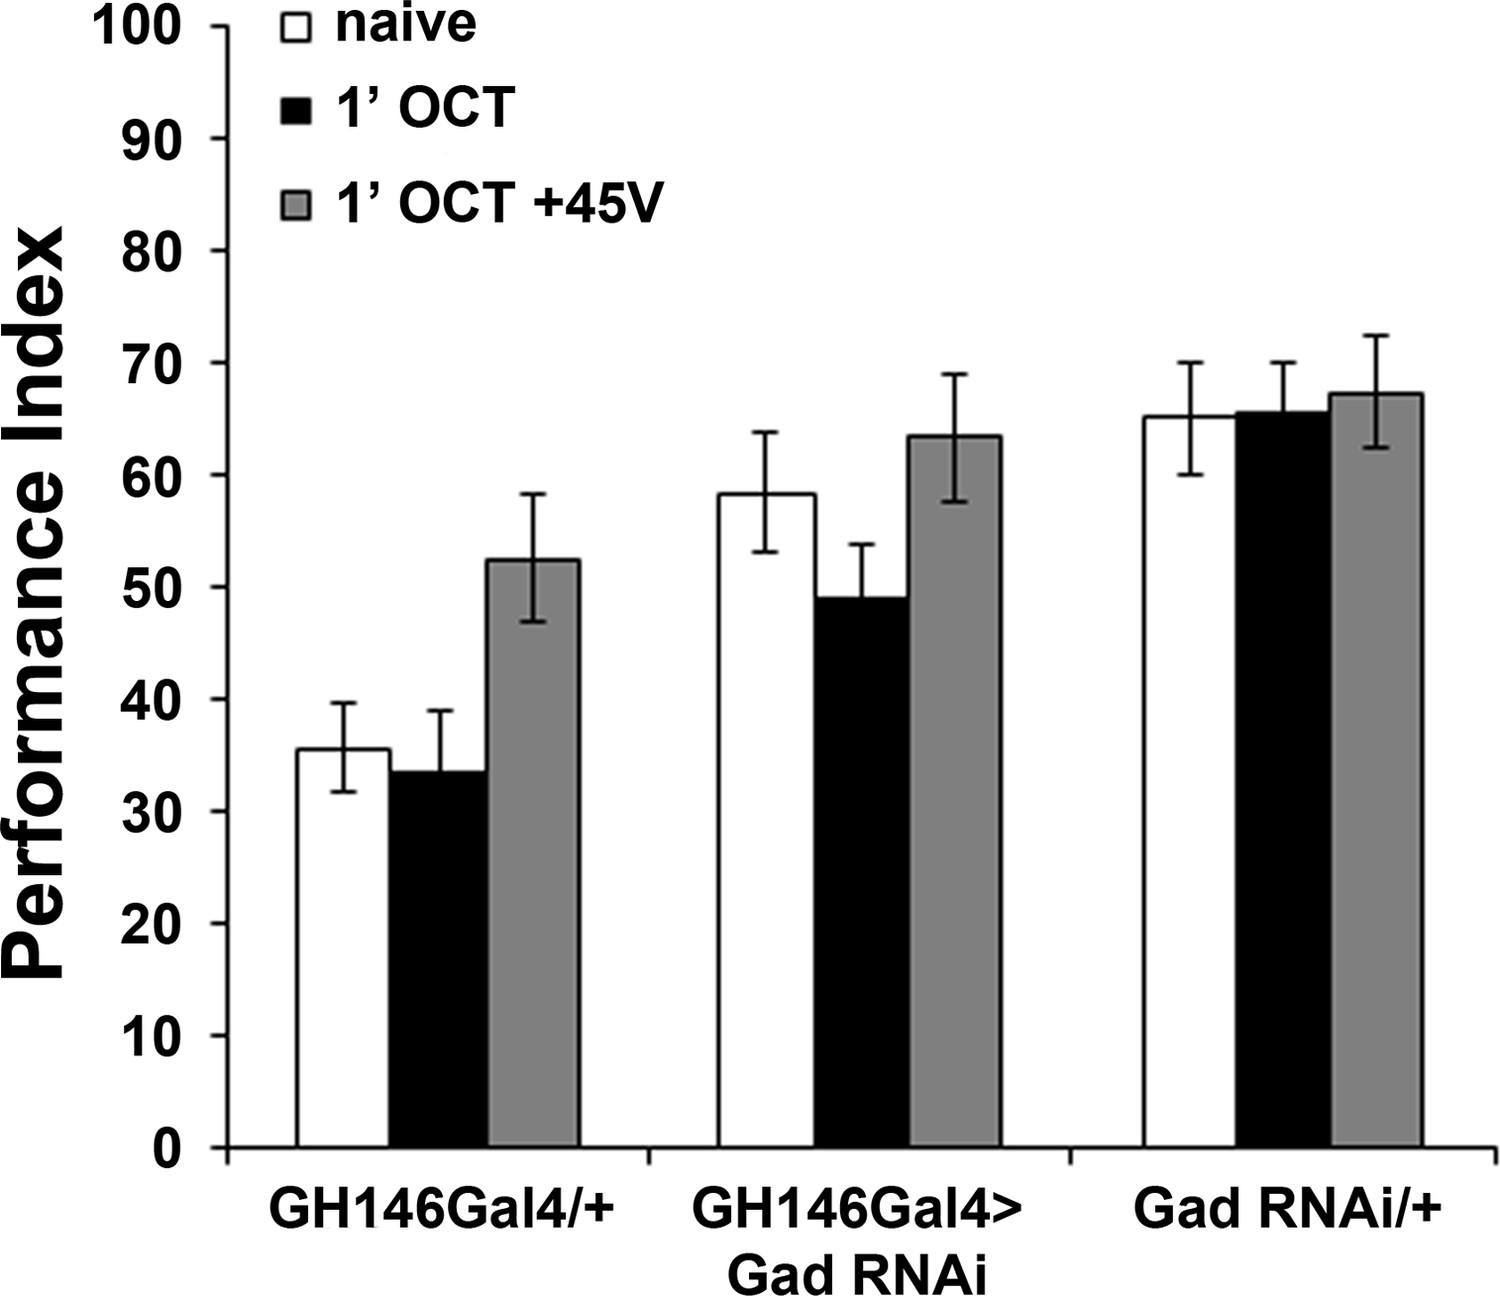
GABA attenuation in GH146-marked neurons does not affect habituation latency.
Mean Performance Indices ± SEM are shown in all figures. Stars indicate significant differences from the naive response unless specified otherwise. Attenuation of GABA production by RNAi-mediated abrogation of Glutamic Acid Decarboxylase (Gad) within GH146Gal4 neurons did not precipitate premature habituation to OCT (black bar, ANOVA p=0.1832, n ≥ 9 for all groups). Detailed statistics are found on Supplementary file 1 and all data are presented in Figure 4—figure supplement 2—source data 1.
-
Figure 4—figure supplement 2—source data 1
GABA attenuation in GH146-marked neurons does not affect habituation latency.
- https://doi.org/10.7554/eLife.39569.016
Figure 5 with 2 supplements
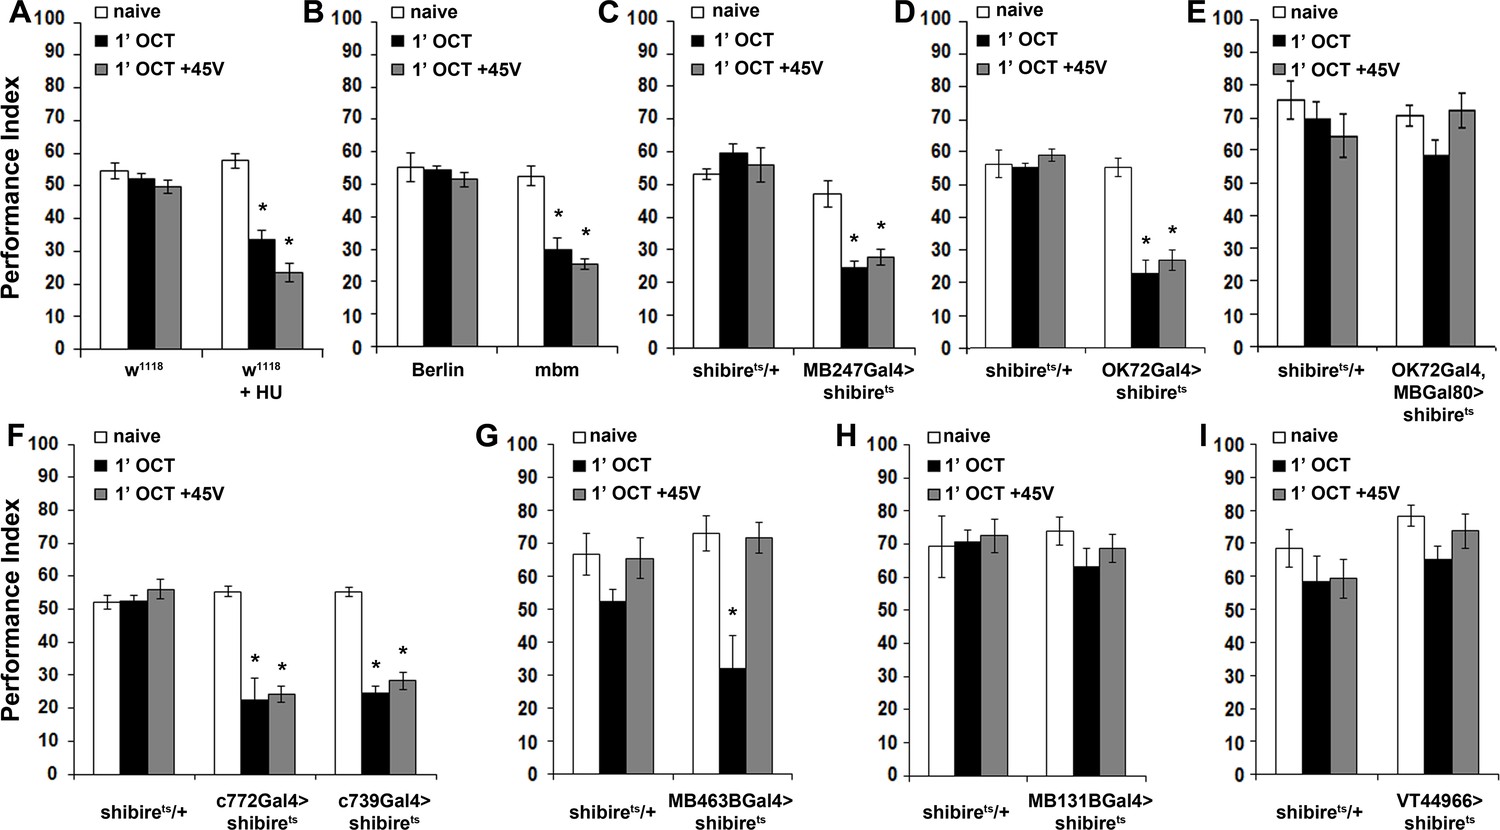
The mushroom bodies are essential for habituation latency and normal dishabituation.
Mean Performance Indices ± SEM are shown in all figures. Stars indicate significant differences from the naïve response unless specified otherwise. (A) Flies with HU-ablated mushroom bodies (MBs) exhibit premature habituation after a 1-min exposure to 1X OCT (black bar, p<0.0001) and inability to dishabituate (grey bar, p<0.0001), while the response of the control groups was not affected. (n ≥ 8 for all groups) (B) mbm1 mutants also presented facilitated habituation after a 1-min exposure to this odorant (black bar, p<0.0001) and inability to dishabituate (grey bar, p<0.0001). (n ≥ 6 for all groups) (C) Silenced neurotransmission from the MBs with MB247Gal4 driving UAS-shibirets resulted in premature habituation following a 1 min 1X OCT exposure (black bar, p<0.0001) and inability to dishabituate (grey bar, p<0.0001). (n ≥ 8 for all groups) (D) Blocked neurotransmission in OK72Gal4-expressing neurοns also facilitated habituation after a 1-min odor exposure (black bar, p<0.0001), and inability to dishabituate (grey bar, p<0.0001). (n ≥ 6 for all groups) (E) Functional silencing of all OK72Gal4-marked neurons apart from the MBs under OK72Gal4;MBGal80 does not affect odor habituation after 1 min of exposure (black bar, ANOVA p=0.0752, n ≥ 10 for all groups). (F) Functional silencing of the αβ MB neurons under c772Gal4 and c739Gal4 facilitated habituation after only 1 min of 1X OCT exposure (black bars, p=0.0002 for c772Gal4 and p<0.0001 for c739Gal4) and resulted in inability to dishabituate (grey bars, p=0.0005 for c772Gal4 and p<0.0001 for c739Gal4) in contrast to controls (UAS-shibirets/+) that did not alter their response. (n ≥ 6 for all groups) (G) Functional silencing of the α’β’ MB neurons under MB463BGal4 facilitated habituation after 1 min of 1X OCT exposure (black bar, p=0.0011) in contrast to controls that did not alter their response, and showed normal dishabituation (grey bar, p=0.9842). (n ≥ 8 for all groups) (H-I) Blocked neurotransmission from the γ MB neurons results in normal OCT responsiveness after 1 min of exposure under both MB131BGal4 (black bar, ANOVA p=0.3026, n ≥ 8 for all groups) and VT44966 (black bar, ANOVA p=0.0651, n ≥ 8 for all groups). Detailed statistics on Supplementary file 1 and all data are presented in Figure 5—source data 1.
-
Figure 5—source data 1
Themushroom bodiesare essential for habituation latency and normal dishabituation.
- https://doi.org/10.7554/eLife.39569.023
Figure 5—figure supplement 1
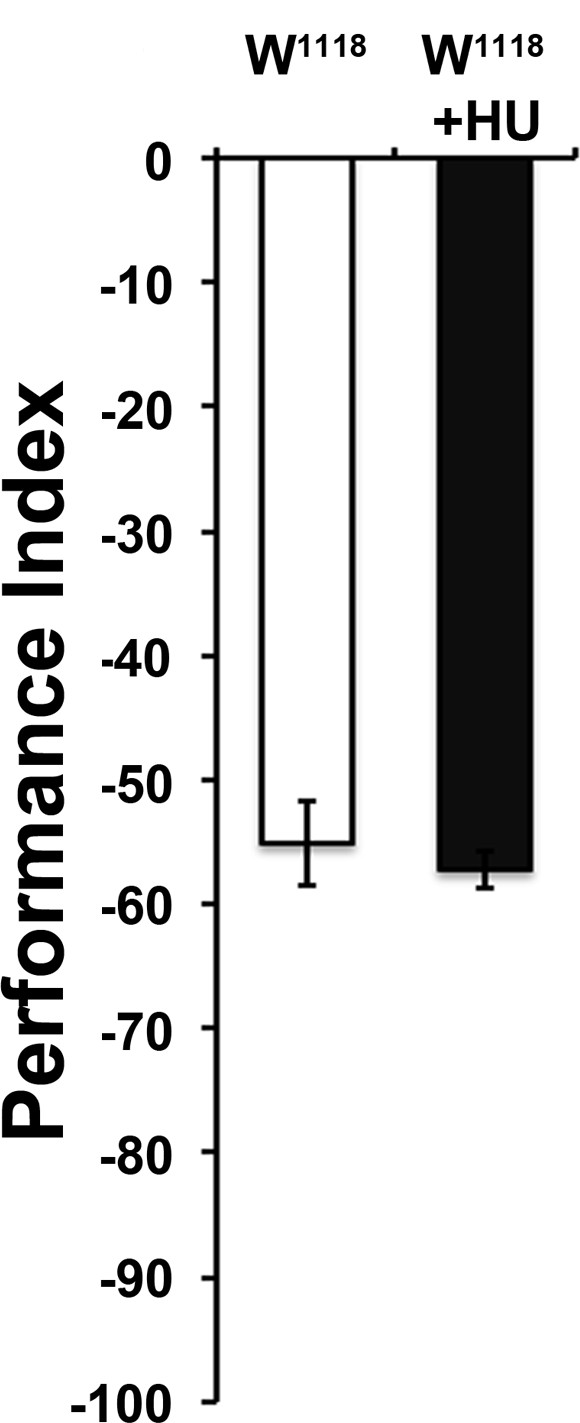
Attraction to 1X ETA was not altered by Hydroxyurea (HU)-dependent ablation of the MBs.
Mean Performance Indices ± SEM are shown in all figures. Stars indicate significant differences from the naive response unless specified otherwise. ANOVA p=0.5251, n > 7 for all groups. Detailed statistics are found on Supplementary file 1 and all data are presented in Figure 5—figure supplement 1—source data 1.
-
Figure 5—figure supplement 1—source data 1
Attraction to 1X ETA was not altered by Hydroxyurea (HU)-dependent ablation of the MBs.
- https://doi.org/10.7554/eLife.39569.021
Figure 5—figure supplement 2

Expression of Tetanus Toxin Light Chain (TTX) in the MBs results in premature habituation.
Mean Performance Indices ± SEM are shown in all figures. Stars indicate significant differences from the naive response unless specified otherwise. Expression of Tetanus Toxin Light Chain (TTX) in the MBs under MB247Gal4 blocks neurotransmission and results in premature habituation to 1X OCT (black bar, p<0.0001) and inability to dishabituate (grey bar, p<0.0001). (n ≥ 8 for all groups). Statistical details on Supplementary file 1 and all data are presented in Figure 5—figure supplement 2—source data 1.
-
Figure 5—figure supplement 2—source data 1
Expression ofTetanus Toxin Light Chain(TTX) in the MBs results in premature habituation.
- https://doi.org/10.7554/eLife.39569.022
Figure 6 with 1 supplement
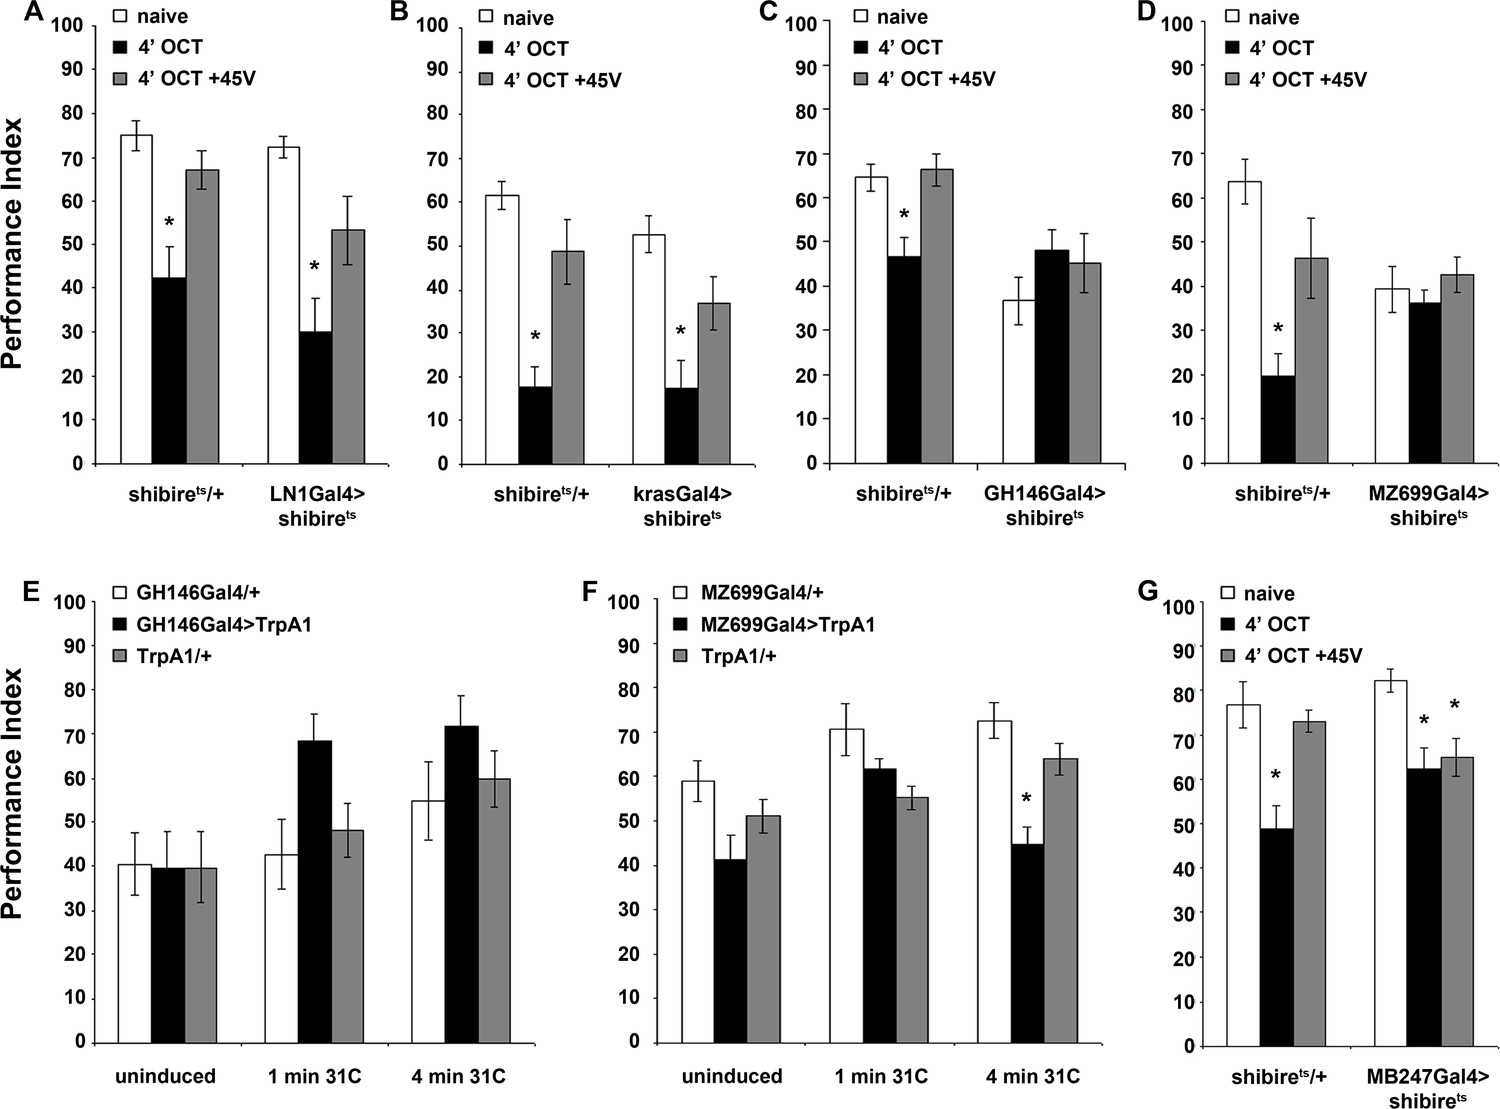
Distinct neuronal subsets are required for olfactory habituation.
Mean Performance Indices ± SEM are shown in all figures. Stars indicate significant differences from the naive response unless specified otherwise. (A) Blocked neurotransmission from iLNs results in normal habituation after 4 min of OCT exposure (black bar, p<0.0001) and normal dishabituation (grey bar, p=0.0867), similar to controls. (n ≥ 10 for all groups) (B) Blocked neurotransmission from the eLNs yielded normal habituation to 4 min 1X OCT exposure (black bar, p<0.0001) and normal dishabituation (grey bar, p=0.0977), similar to controls. (n ≥ 12 for all groups) (C) Blocked neurotransmission from the GH146Gal4-marked ePNs resulted in abrogated habituation, with the response to OCT remaining at naïve levels even after 4 min of exposure (black bar, ANOVA p=0.3640), while controls habituated (black bar, p=0.0026) and dishabituated normally (grey bar, p=0.9159). (n ≥ 11 for all groups) (D) Blocked neurotransmission from iPNs under MZ699Gal4 resulted in abrogated habituation, with the response to 1X OCT remaining at naïve levels after 4 min of exposure (black bar, ANOVA p=0.6121), while controls habituated (black bar, p=0.0002) and dishabituated normally (grey bar, p=0.1491). (n ≥ 10 for all groups) (E) Activation of the GH146Gal4-marked PNs with UAS-TRPA1 but without odor exposure did not alter significantly the response to 1X OCT after 1 min (black bar, ANOVA p=0.03) or 4 min of activation (black bar, ANOVA p=0.2707). (n ≥ 10 for all groups) (F) Activation of the iPNs under MZ699Gal4 to drive UAS-TRPA1 did not alter significantly the response to 1X OCT after 1 min (black bar, ANOVA p=0.0190), but 4 min of activation sufficed to produce significant habituation (black bar, p<0.0001 when compared to MZ699Gal4/+). (n ≥ 13 for all groups) (G) Blocked neurotransmission from the MBs under MB247Gal4 resulted in normal habituation to 4 min of 1X OCT exposure (black bar, p=0.0033) and inability to dishabituate (grey bar, p=0.0075) while control flies habituate (black bar, p=0.0003) and dishabituate normally (grey bar, p=0.8229). (n ≥ 10 for all groups) Statistical details on Supplementary file 1 and all data are presented in Figure 6—source data 1.
-
Figure 6—source data 1
Distinct neuronal subsets are required for olfactory habituation.
- https://doi.org/10.7554/eLife.39569.027
Figure 6—figure supplement 1
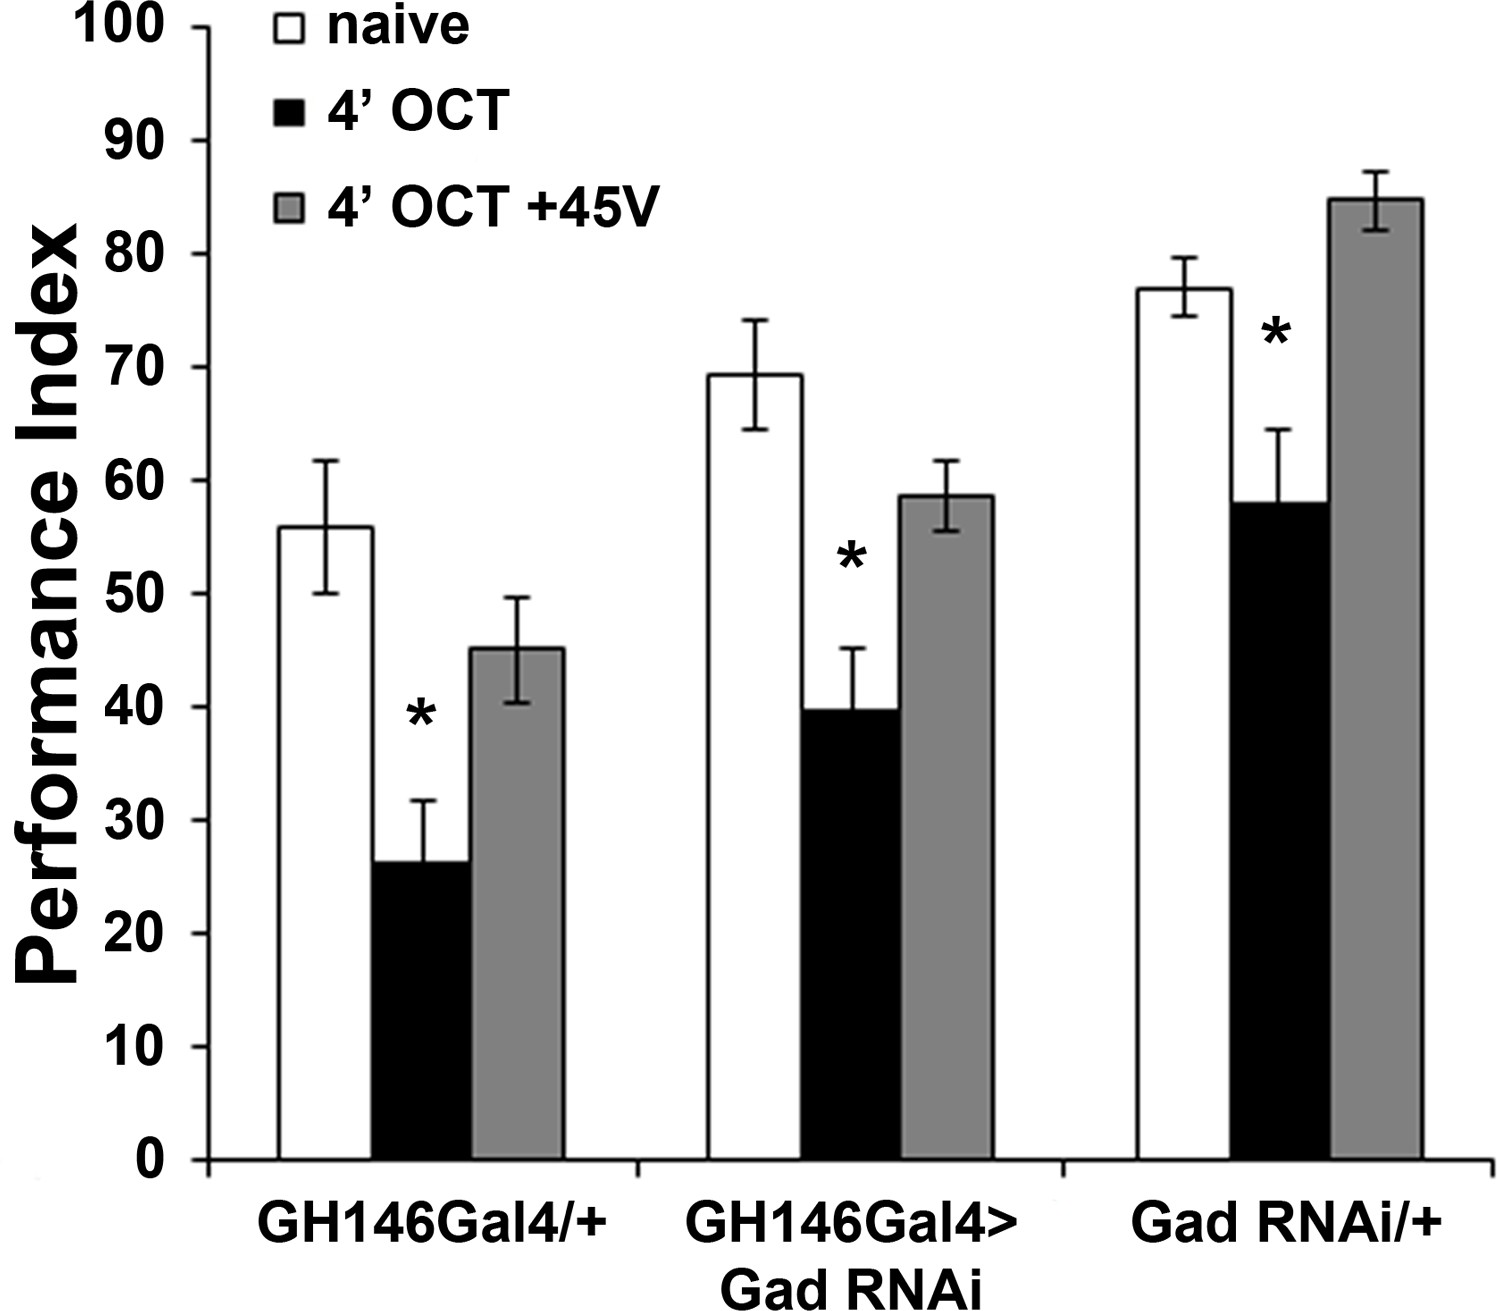
GABA attenuation in GH146-marked neurons does not affect habituation.
Mean Performance Indices ± SEM are shown in all figures. Stars indicate significant differences from the naive response unless specified otherwise. Attenuation of GABA production by RNAi-mediated Gad abrogation within GH146Gal4 neurons did not alter habituation to 1X OCT after 4 min of exposure (black bar, p<0.0001) or dishabituation (grey bar, p=0.2233). (n ≥ 11 for all groups). Statistical details on Supplementary file 1 and all data are presented in Figure 6—figure supplement 1—source data 1.
-
Figure 6—figure supplement 1—source data 1
GABA attenuation in GH146-marked neurons does not affect habituation.
- https://doi.org/10.7554/eLife.39569.026
Figure 7 with 1 supplement
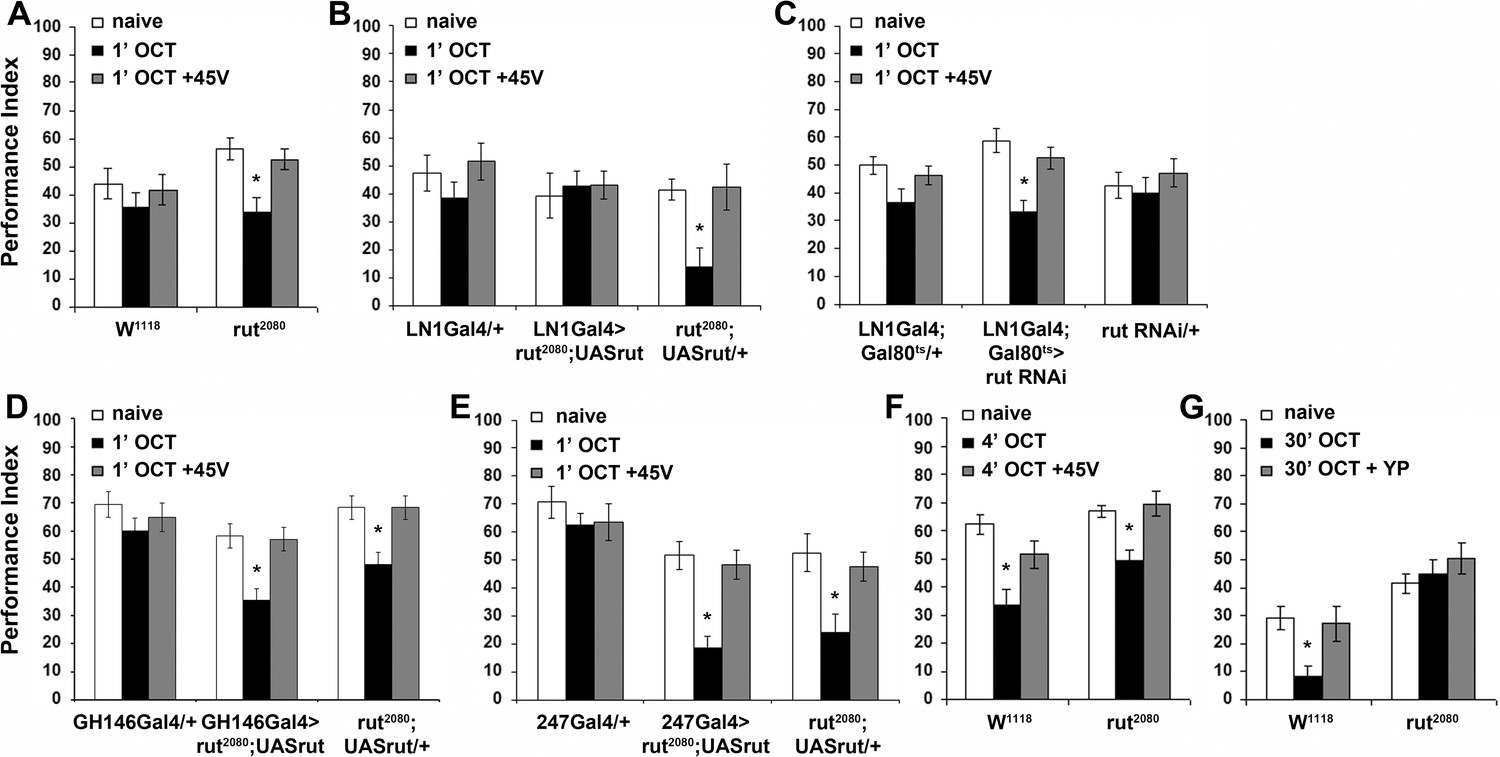
The Rutabaga Adenylyl Cyclase is required for olfactory habituation.
Mean Performance Indices ± SEM are shown in all figures. Stars indicate significant differences from the naive response unless specified otherwise. (A) Rut2080 mutants presented facilitated habituation to 1X OCT after only 1 min of exposure (black bar, p=0.0011) and normal dishabituation (grey bar, p=0.7873). Controls responded indistinguishably from naive animals to 1 min of 1X OCT (black bar, ANOVA p=0.5346). (n ≥ 14 for all groups) (B) Targeted Rut re-expression in rut2080 mutants specifically in iLNs rescued their premature habituation (black bar, ANOVA p=0.8976), while rut2080; UASrut/+animals habituated prematurely (black bar, p=0.0079). (n ≥ 10 for all groups) (C) Rut abrogation via RNAi-mediating transgene expression in iLNs mimics the facilitated habituation of rut2080 (black bar, p<0.0001), while both controls did not (LN1Gal4;Gal80ts ANOVA p=0.0606; rutabaga RNAi/+ANOVA p=0.5997). (n ≥ 18 for all groups) (D) Targeted Rut re-expression in rut2080 mutants specifically in ePNs under GH146Gal4 did not rescue their premature habituation (black bar, p=0.0024), which is similar to that presented by rut2080 mutants (black bar, p=0.0041). However, dishabituation was normal in both cases. (n ≥ 10 for all groups) (E) Targeted Rut re-expression in rut2080 MBs under MB247Gal4 did not rescue the premature habituation (black bar, p<0.0001) in accord to the performance of rut2080 mutants (black bar, p=0.0060). Dishabituation was normal in both cases. (n ≥ 10 for all groups) (F) rut2080 habituated normally to 1X OCT after 4 min of exposure (black bar, p=0.0039) and dishabituated normally (grey bar, p=0.8037). (n ≥ 15 for all groups) (G) Rutabaga mutants did not habituate after 30 min 1X OCT exposure (black bar, ANOVA p=0.4287), in contrast to control flies that habituated normally (black bar, p=0.0067) and dishabituated with a yeast puff (grey bar, p=0.9279). (n ≥ 12 for all groups) Statistical details on Supplementary file 1 and all data are presented in Figure 7—source data 1.
-
Figure 7—source data 1
The Rutabaga Adenylyl Cyclase is required for olfactory habituation.
- https://doi.org/10.7554/eLife.39569.031
Figure 7—figure supplement 1
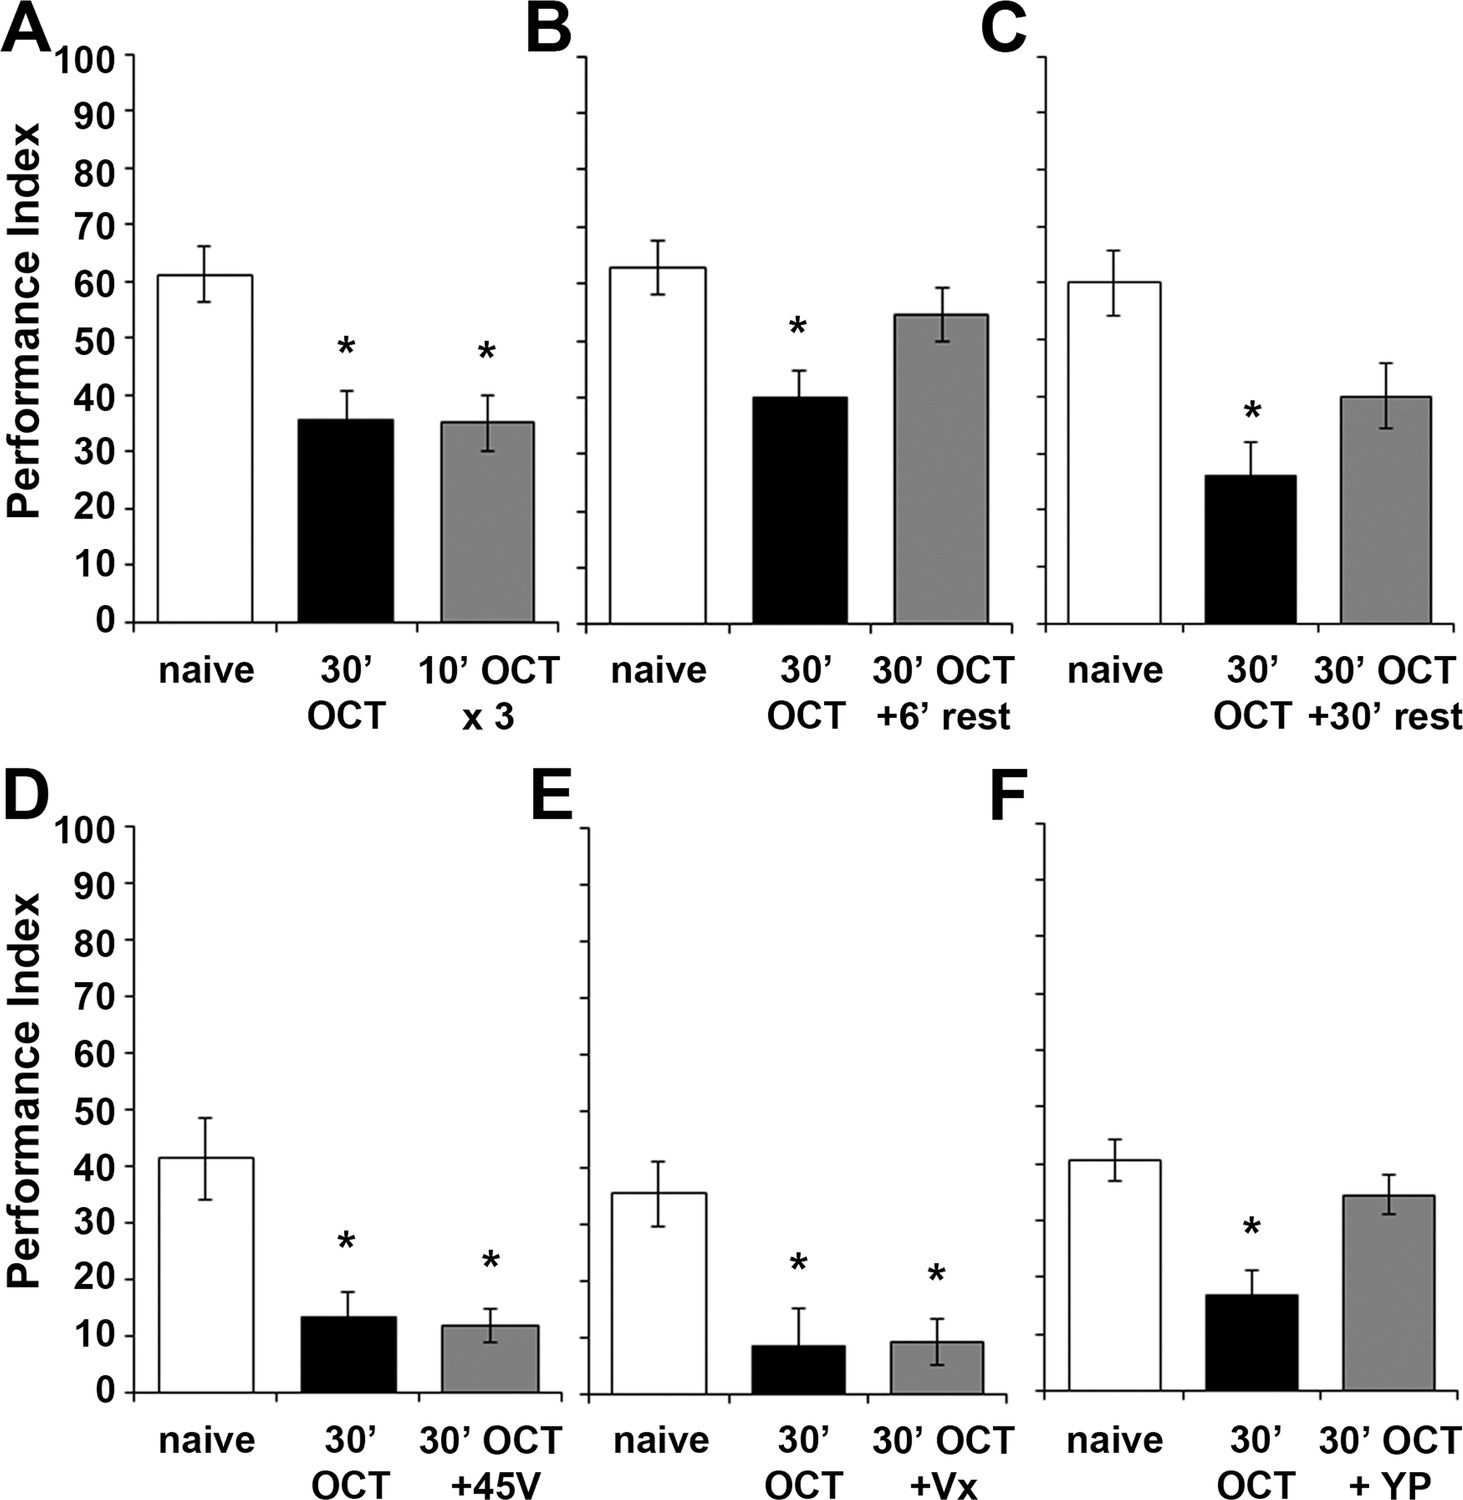
Habituation parameters after continuous exposure to OCT for 30 min.
Mean Performance Indices ± SEM are shown in all figures. Stars indicate significant differences from the naïve response unless specified otherwise. Three 10-min 1X OCT pulses elicited habituation to this odor (grey bar, p=0.0009), mimicking the effect of continuous 30-min exposure to the odor (black bar, p=0.0010). (n ≥ 15 for all groups) (B) A 6-min rest interval following 30 min of 1X OCT was adequate for spontaneous recovery of the naive response (grey bar, p=0.3282, n = 10 for all groups). (C) A 30 min rest after 30 min 1X OCT exposure also resulted in spontaneous recovery of the naive response (grey bar, p=0.0122, n = 10 for all groups). (D) Exposure to OCT for 30 min elicited habituation (black bar, p=0.0012) and inability to dishabituate by a 45V electric footshock (grey bar, p=0.0007). (n = 11 for all groups) (E) Exposure to OCT for 30 min resulted in habituation (black bar, p=0.0039) and inability to dishabituate by a 3 s vortex (grey bar, p=0.0061). (n ≥ 9 for all groups) (F) 30 min of 1X OCT exposure resulted in habituation to that odor (black bar, p=0.0003), but a 3 s yeast puff sufficed to dishabituate the response (grey bar, p=0.4588). (n ≥ 11 for all groups). Statistical details on Supplementary file 1 and all data are presented in Figure 7—figure supplement 1—source data 1.
-
Figure 7—figure supplement 1—source data 1
Habituation parameters after continuous exposure to OCT for30min.
- https://doi.org/10.7554/eLife.39569.030
Figure 8
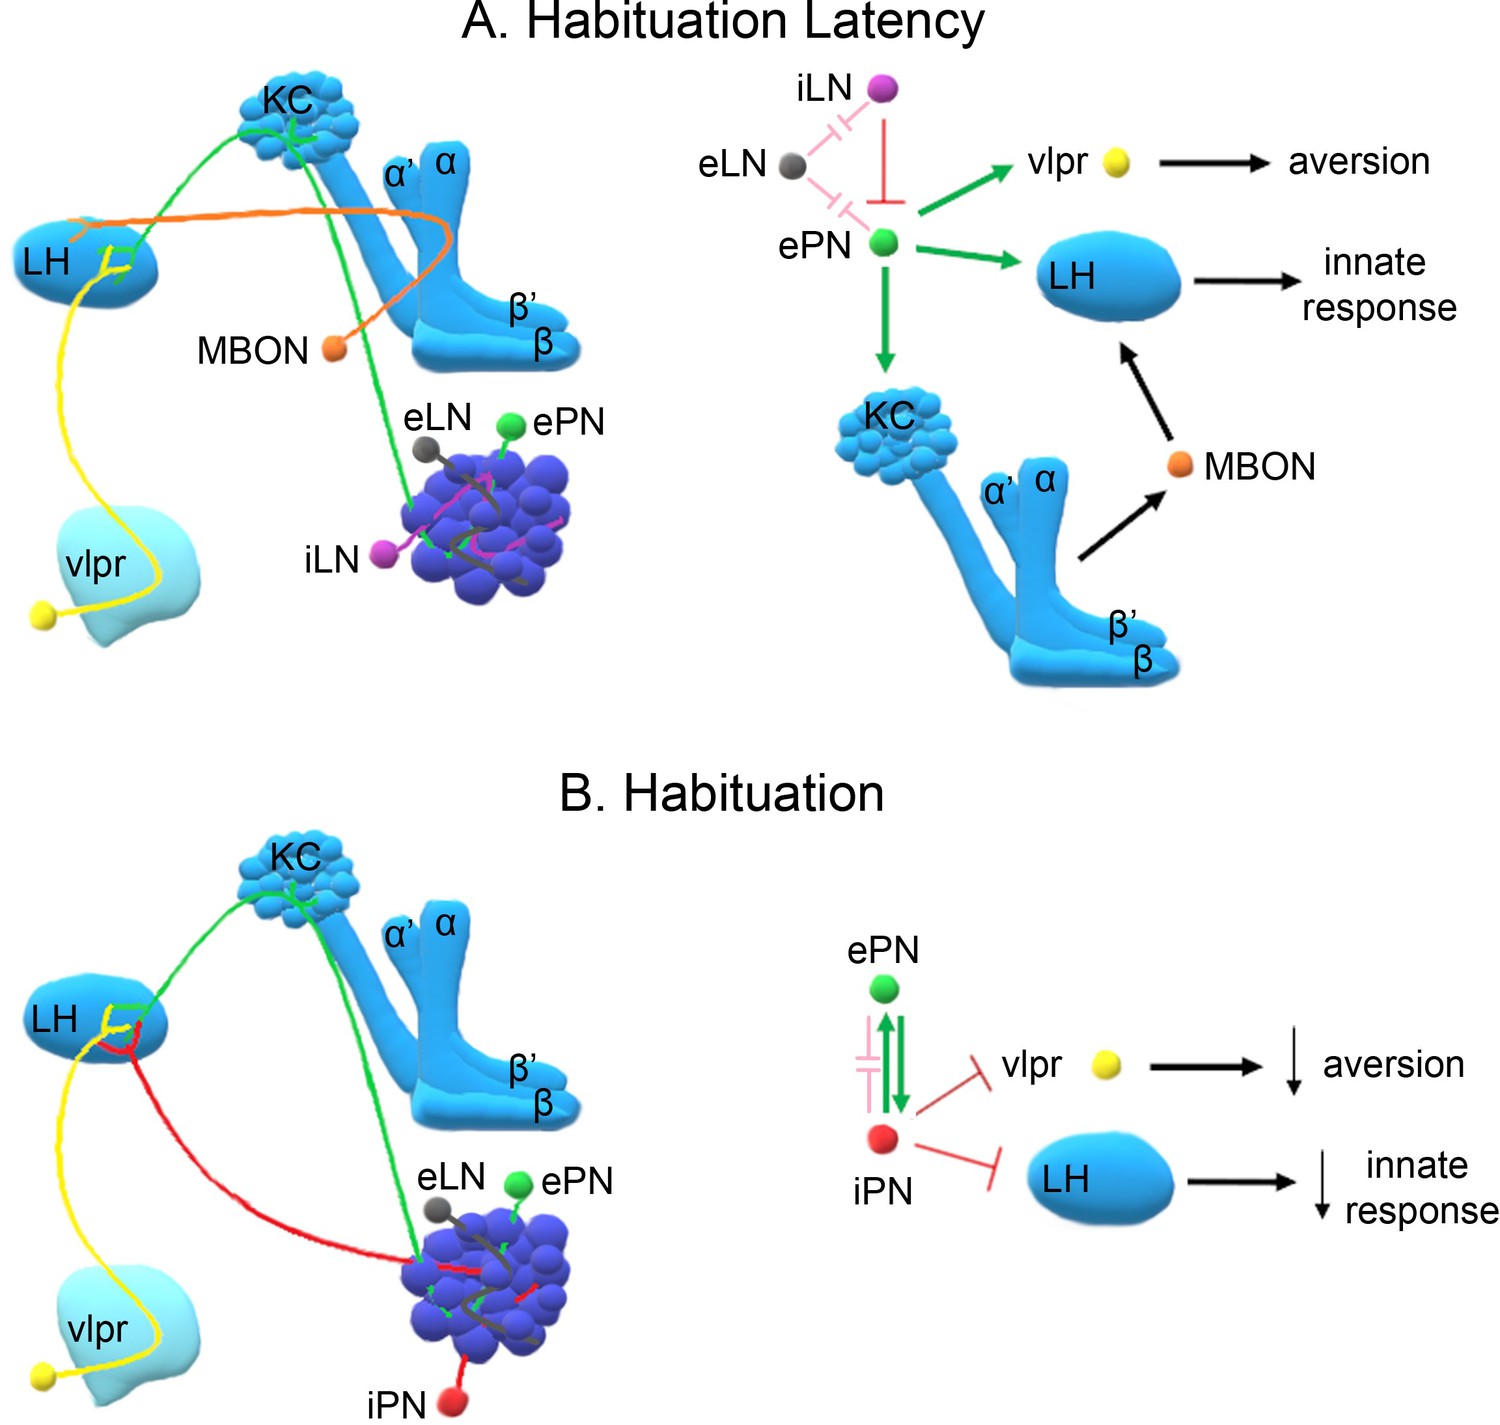
A model of the neuronal subsets underlying (A) Habituation Latency and (B) Habituation, after exposure to aversive stimuli.
The antennal lobe, the mushroom bodies, the lateral horn (LH) and the ventrolateral protocerebrum (vlpr) are depicted with shades of blue, lighter blue showing higher order neurons. Distinct neuronal subsets are marked with different colors; iACT excitatory projection neurons (ePN-green), inhibitory local interneurons (iLN-purple), excitatory local interneurons (eLNs-grey), Mushroom Body Output Neurons (MBONs-orange), ventrolateral protocerebrum neurons (vlpr-yellow), mACT inhibitory projection neurons (iPNs-red). Green arrows indicate activation while red blunt arrows indicate inhibition. Pink blunt arrows indicate electrical synapses.
Additional files
-
Source data1
performance of driver heterozygotes upon 1 min odor exposure.
- https://doi.org/10.7554/eLife.39569.033
-
Source data 2
Performance of driver heterozygotes upon 4 min odor exposure.
- https://doi.org/10.7554/eLife.39569.034
-
Supplementary file 1
Collective statistical analyses and results for all data in the paper.
- https://doi.org/10.7554/eLife.39569.035
-
Supplementary file 2
Responses of control animals, heterozygous for the Gal4 drivers when naive, after 1 min pre-exposure and after 1 min pre-exposure followed by one 45V electric footshock application.
Data are represented as mean ± SEM and all data are presented in Source data 1. subsequent Dunnett’s test: p=0.0016 for 1 min OCT and p=0.9918 for 1 min OCT +45V two subsequent Dunnett’s test: p=0.0003 for 1 min OCT and p=0.1084 for 1 min OCT +45V
- https://doi.org/10.7554/eLife.39569.036
-
Supplementary file 3
Responses of control animals, heterozygous for the Gal4 drivers when naïve, after 4 min pre-exposure and after 4 min pre-exposure followed by one 45V electric footshock application.
Data are represented as mean ± SEM and all data are presented in Source data 2. subsequent Dunnett’s test: p<0.0001 for 4-min OCT and p=0.9061 for 4-min OCT +45V two subsequent Dunnett’s test: p<0.0001 for 4 min OCT and p=0.1594 for 4-min OCT +45V three subsequent Dunnett’s test: p<0.0001 for 4-min OCT and p=0.6941 for 4-min OCT +45V four subsequent Dunnett’s test: p=0.0007 for 4-min OCT and p=0.7259 for 4-min OCT +45V five subsequent Dunnett’s test: p<0.0001 for 4-min OCT and p=0.1046 for 4-min OCT +45V
- https://doi.org/10.7554/eLife.39569.037
-
Transparent reporting form
- https://doi.org/10.7554/eLife.39569.038
Download links
A two-part list of links to download the article, or parts of the article, in various formats.
Downloads (link to download the article as PDF)
Open citations (links to open the citations from this article in various online reference manager services)
Cite this article (links to download the citations from this article in formats compatible with various reference manager tools)
Temporally specific engagement of distinct neuronal circuits regulating olfactory habituation in Drosophila
eLife 7:e39569.
https://doi.org/10.7554/eLife.39569


