Quorums enable optimal pooling of independent judgements in biological systems
- University of Sheffield, United Kingdom
- Max Planck Institute for Human Development, Germany
- Leibniz-Institute of Freshwater Ecology and Inland Fisheries, Germany
Figures
Figure 1
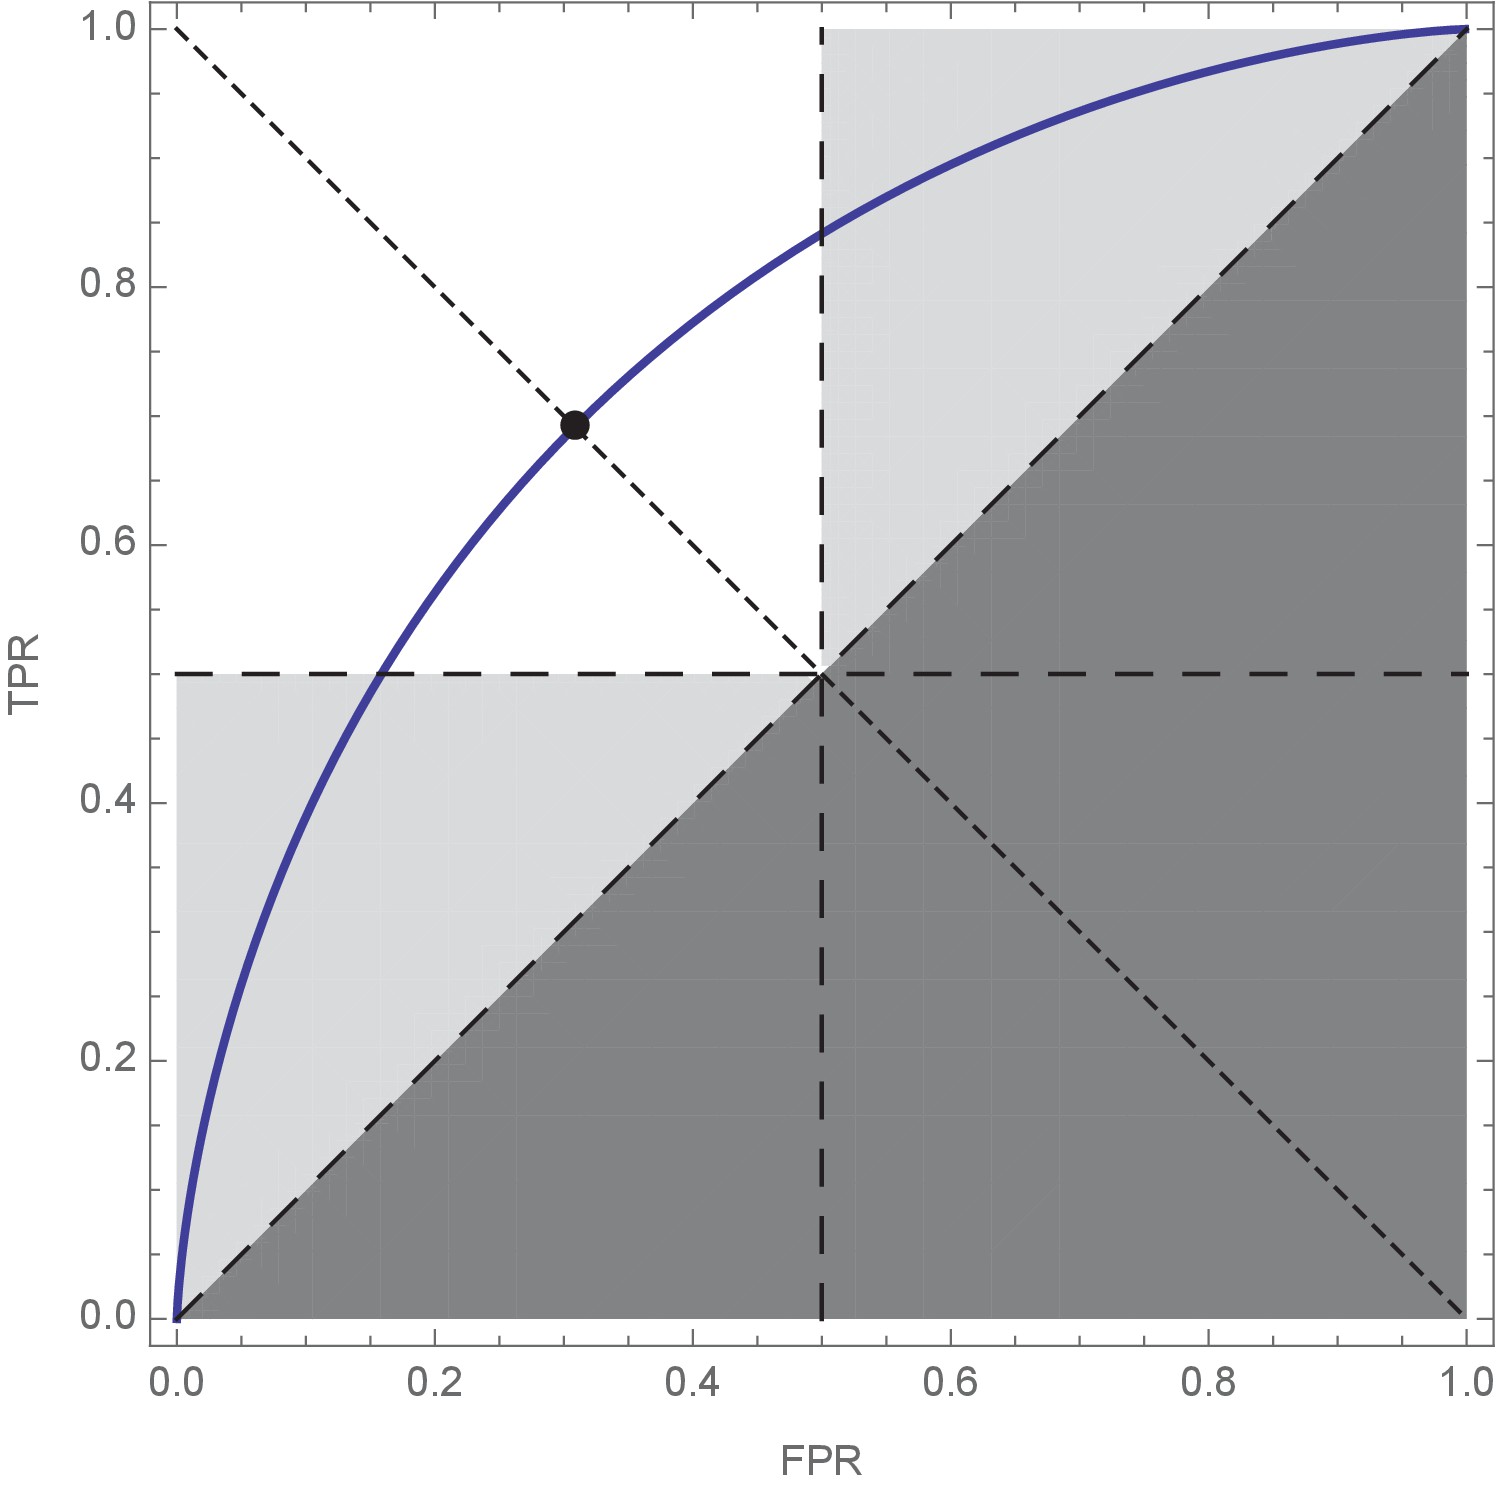
Receiver Operating Characteristic (ROC) curve plot showing the optimal compromise between true positive rate (TPR = a+) and false positive rate (FPR = 1 – a–).
The shape of the ROC curve is determined by the difficulty of the decision problem (e.g. Shettleworth, 2010), with hard decision curves lying close to the dashed diagonal, and easy decision curves approaching the left and top edge of the plot. According to prior probability of states, and relative cost of errors, an optimal decision-maker then selects a point on the ROC curve that gives the best possible expected decision performance; points that do not prioritise accuracy in either state of the world (a+=a– ⇔ TPR = 1 – FPR; dotted diagonal, and filled circle) are implicitly assumed by the Condorcet Jury Theorem, as discussed in the main text and Figure 2. The white square represents the region of ROC space in which simple majority decisions are best, and Condorcet predictions are fulfilled (note the equal accuracy dotted line described above always occupies this region). Light grey triangles represent regions of ROC-space which, if selected by optimal individual decision-makers, lead to sub-optimal collective decisions when combined by simple majority decision rules; in this region Condorcet predictions are systematically incorrect. The dark grey lower-right triangle represents combinations of TPR and FPR that should not be observed, since in these decision-makers are systematically wrong and could simultaneously improve both their TPR and FPR by simply inverting their predictions to move above the dashed diagonal. ROC parameters: μ– = 0, μ+ = 1, σ = 1, prior = ½, ratio = 1.
Figure 2
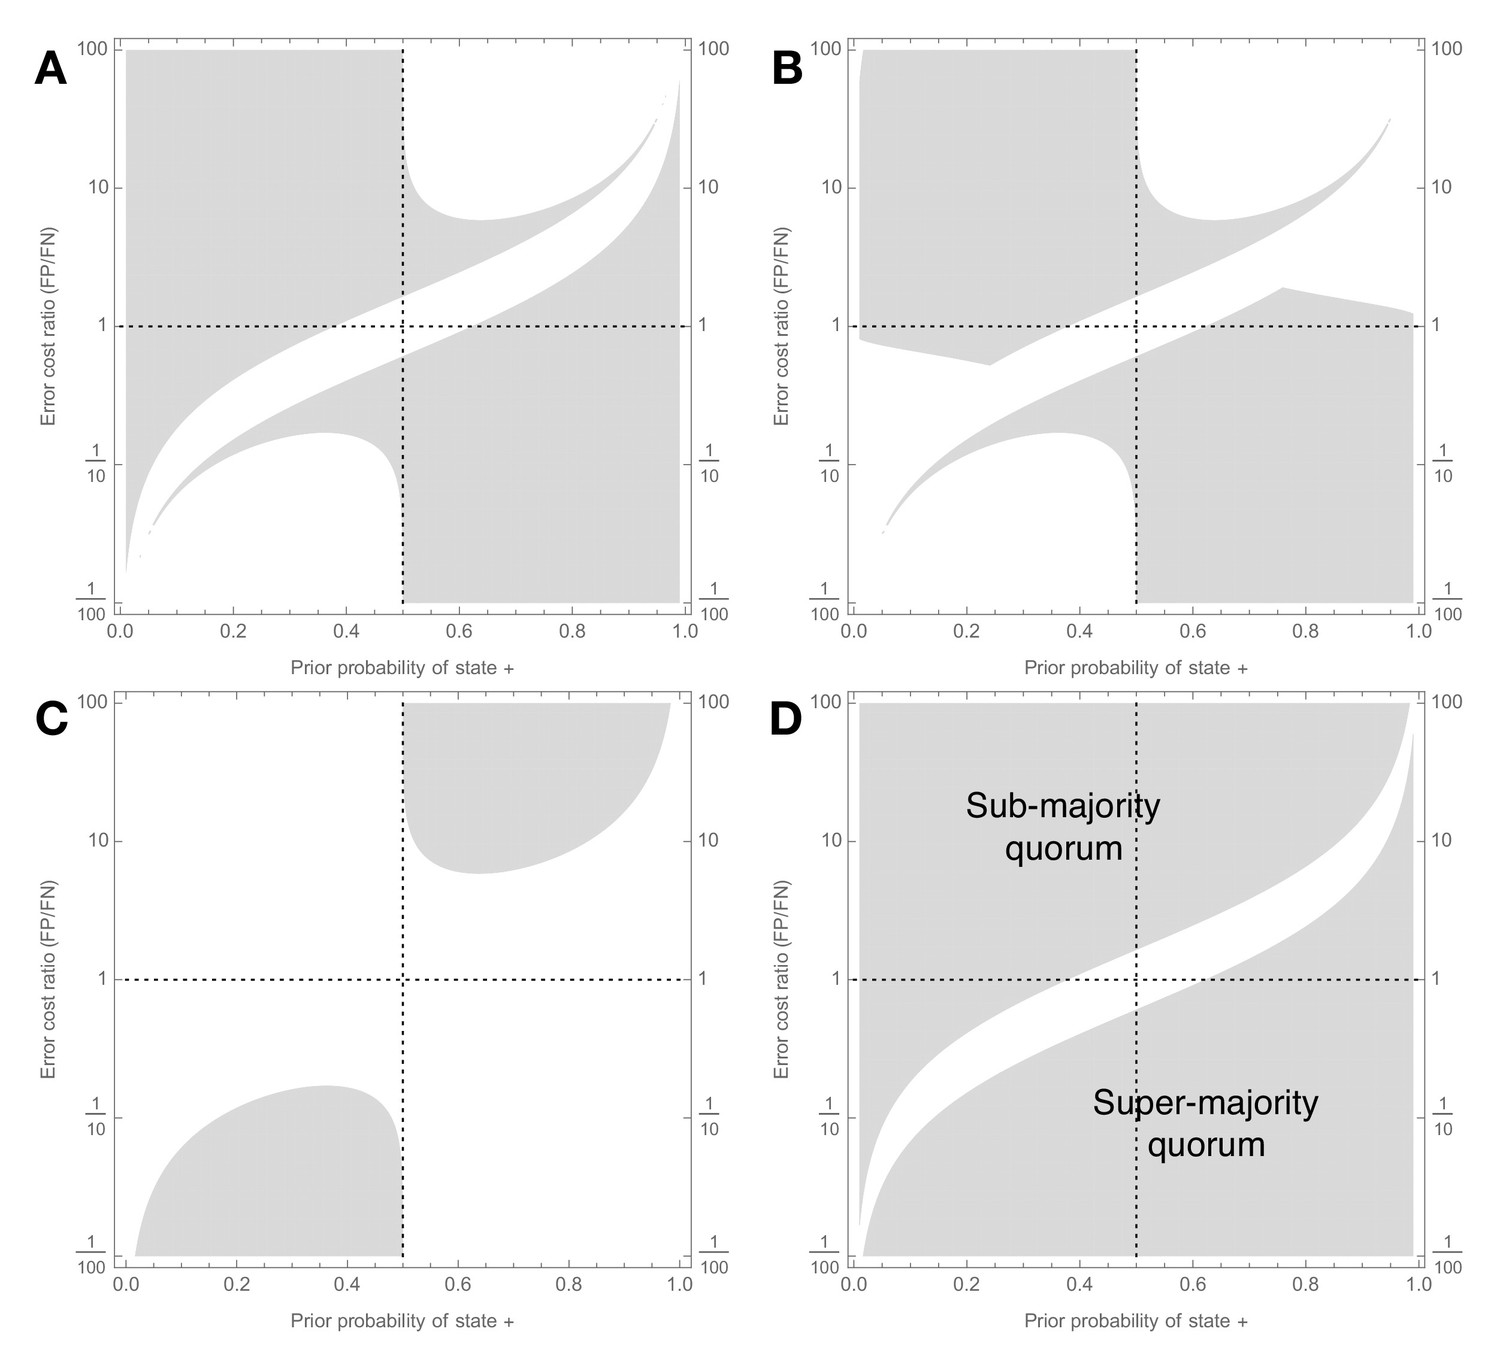
Signal detection theory shows when majority-based reasoning is incorrect.
Decision scenarios in which Condorcet will make different kinds of inaccurate predictions about groups of individually-optimal (see Figure 1) decision-makers (a–c), and in which majority voting is sub-optimal (d); prior probability of state + is on x-axis, ratio of cost of false positive to cost of false negative is on y-axis, so values larger than one indicate classifying – as + is relatively worse than classifying + as –, and vice versa. Grey regions show decision scenarios in which Condorcet leads to at least one predictive error: (a) As group size increases Condorcet incorrectly predicts that majority group accuracy will asymptotically increase towards 1, whereas it actually does not (Error Ia, main text); (b) As group size increases Condorcet incorrectly predicts that majority group accuracy will asymptotically increase towards 1, whereas groups actually make worse decisions than individuals (Error Ib, main text); (c) As group size increases Condorcet incorrectly predicts that majority group accuracy will decrease towards zero, whereas it actually converges to a positive level (Error II, main text); (d) Condorcet makes at least one of the errors just described; this plot also corresponds to decision scenarios in which majority decision-making is suboptimal, and should be replaced by a sub- (upper-left area) or super- (lower-right area) majority quorum rule as described in Results. Signal detection analysis for individual decision-makers is described in the Appendix; parameters for the analysis are .
Figure 3
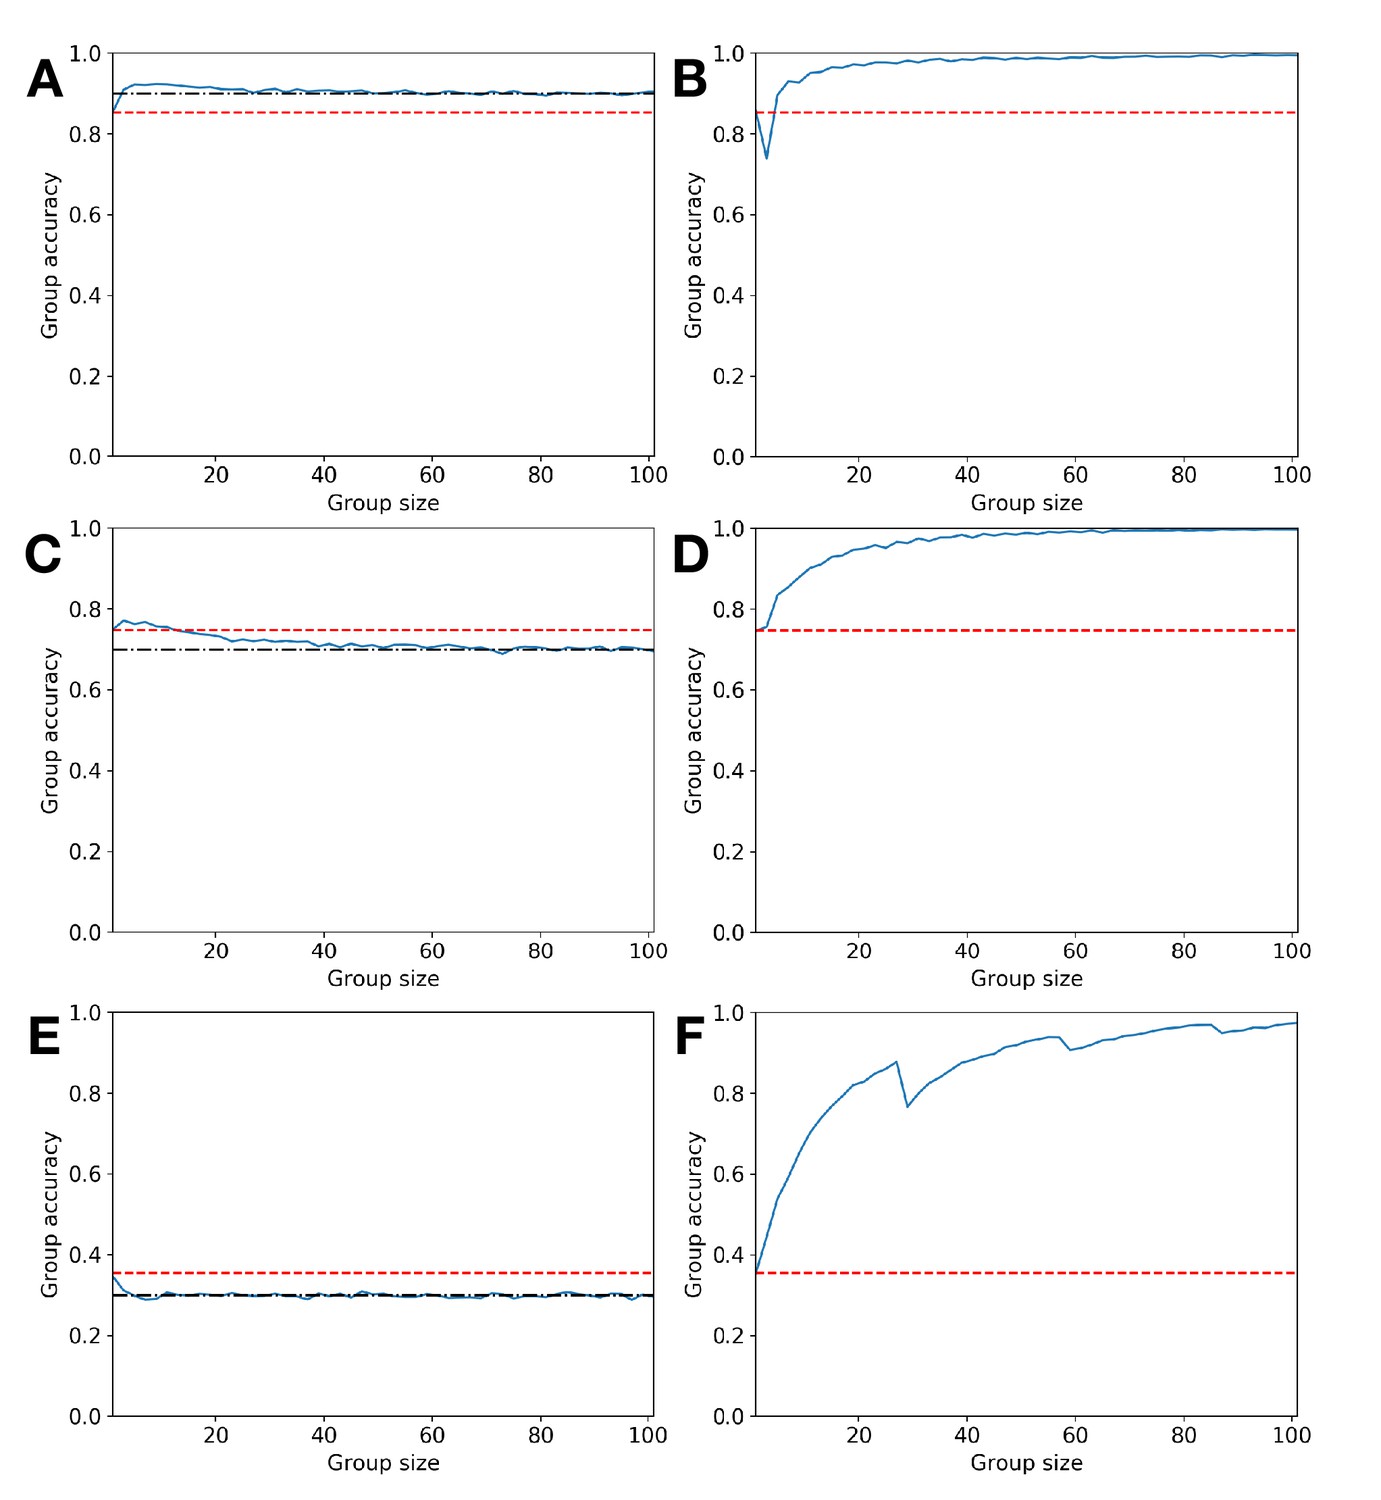
How majority voting can be optimally replaced by quorum decisions.
Illustrative failures of simple majority voting and Condorcet predictions (left column) and their remediation through appropriate use of sub- or super-majority decision quorums (right column); group size increases on x-axis, while group accuracy increases on y-axis; red-dashed line indicates individual decision accuracy, black dot-dash line represents prior probability of state + (panels a and c) or of state – (panel e), solid blue line represents group accuracy. (a) Error Ia: Condorcet predicts that increasing group size will result in group accuracy converging to 1, but it converges to p which is above the individual accuracy level. (b) Choosing a super-majority quorum leads group accuracy to converge to 1 with increasing group size. (c) Error Ib: Condorcet predicts that increasing group size will result in group accuracy converging to 1, but it converges to p which is below the individual accuracy level, hence groups perform worse than individuals. (d) Choosing a super-majority quorum leads group accuracy to converge to 1 with increasing group size. (e) Error II: Condorcet predicts that increasing group size will result in group accuracy converging to 0, but it converges to 1 – p which is below the individual accuracy level. (f) Choosing a sub-majority quorum leads group accuracy to converge to 1 with increasing group size. Simulations comprise 10,000 replicates with individual accuracies derived from signal detection analysis with parameters and: (a) , (b) , (c) , (d) , (e) , (f) .
Additional files
-
Transparent reporting form
- https://doi.org/10.7554/eLife.40368.005
-
Source code 1
Source code for results presented in Figure 1.
- https://doi.org/10.7554/eLife.40368.007
-
Source code 2
Source code for results presented in Figure 2.
- https://doi.org/10.7554/eLife.40368.008
-
Source code 3
Source code for results presented in Figure 3.
- https://doi.org/10.7554/eLife.40368.009
Download links
A two-part list of links to download the article, or parts of the article, in various formats.
Downloads (link to download the article as PDF)
Open citations (links to open the citations from this article in various online reference manager services)
Cite this article (links to download the citations from this article in formats compatible with various reference manager tools)
Quorums enable optimal pooling of independent judgements in biological systems
eLife 8:e40368.
https://doi.org/10.7554/eLife.40368


