Meta-Research: Gender variations in citation distributions in medicine are very small and due to self-citation and journal prestige
- Aarhus University, Denmark
- University of Michigan, United States
Figures
Figure 1
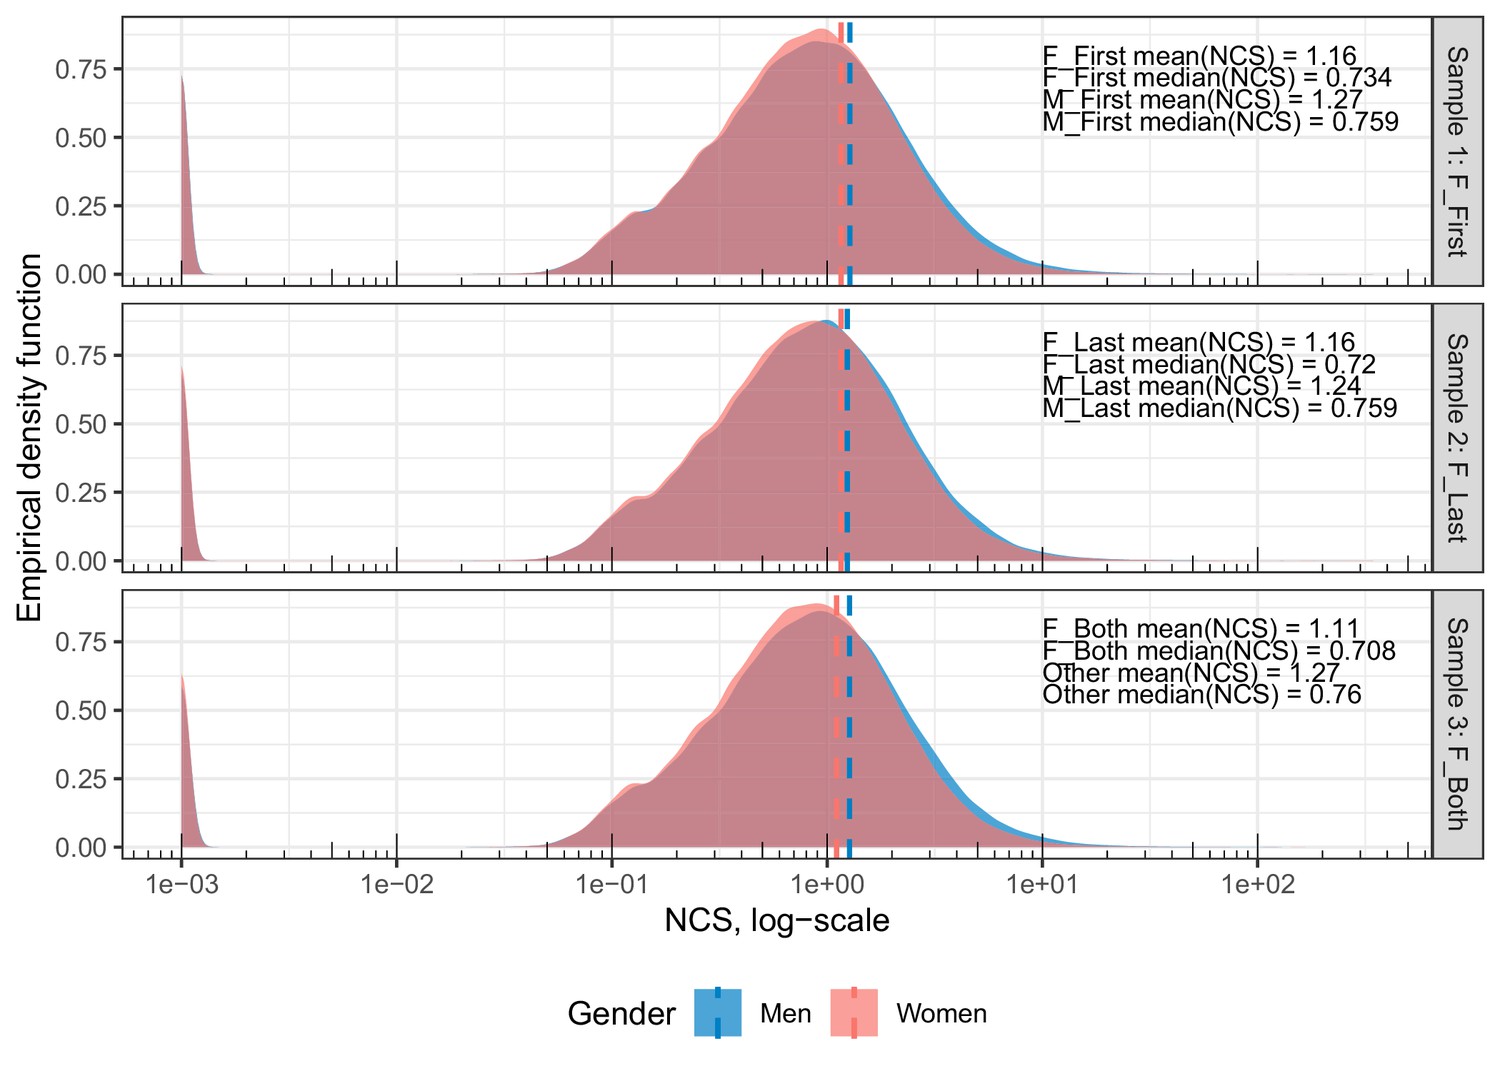
Density distributions of the log-transformed, per-paper NCS for the matched set of male and female first authors (Sample 1), female and male last authors (Sample 2), and female first and last authors vs. other author combinations (Sample 3).
Dashed lines indicate the mean NCS for each sample. The y-axis indicates the proportion of papers found in that area of the NCS, equivalent to a smoothed histogram. The x-axis gives the per-paper NCS on a log-transformed scale. For all distributions, between-group overlap is extensive (93.1% to 95.6%). The difference between men and women is most clearly seen in the exceptionally highly cited studies, of which there are relatively few. Please note that. 001 (=1e-03) has been added to NCS in order to include uncited papers. The left-most peak in each sample represents uncited papers. The proportion of uncited papers per sample is 5.7%, 6.1%, and 5.9% for the case papers and 5.9%, 5.9%, and 5.8% for the control papers.
Figure 2

Standardized, exponentiated coefficients for the predictors included in the Tweedie regressions.
Error bars represent 95% confidence intervals (see Figure 2—source data 1 for estimate specifications and dispersion parameters). All regressions are based on matched samples. Sample 1 compares papers with female first authors to those with male first authors. Sample 2 compares papers with female last authors to those with male last authors. Sample 3 compares papers with female first and last authors to those with other author combinations. Values are on a logarithmic scale. The figure indicates very small residual effects of gender on NCS (case variables: F_First, F_Last and F_Both).
-
Figure 2—source data 1
Tweedie regression results.
- https://doi.org/10.7554/eLife.45374.005
-
Figure 2—source data 2
Regression results for Tweedie regressions on the full, unmatched sample, using NCS as outcome.
- https://doi.org/10.7554/eLife.45374.006
-
Figure 2—source data 3
Regression results for the three negative binomial regressions with times cited (CS) as outcome.
- https://doi.org/10.7554/eLife.45374.007
-
Figure 2—source data 4
Tweedie regression of standardized parameters, using MNCS Journal quantiles rather than measurements.
- https://doi.org/10.7554/eLife.45374.008
Figure 3
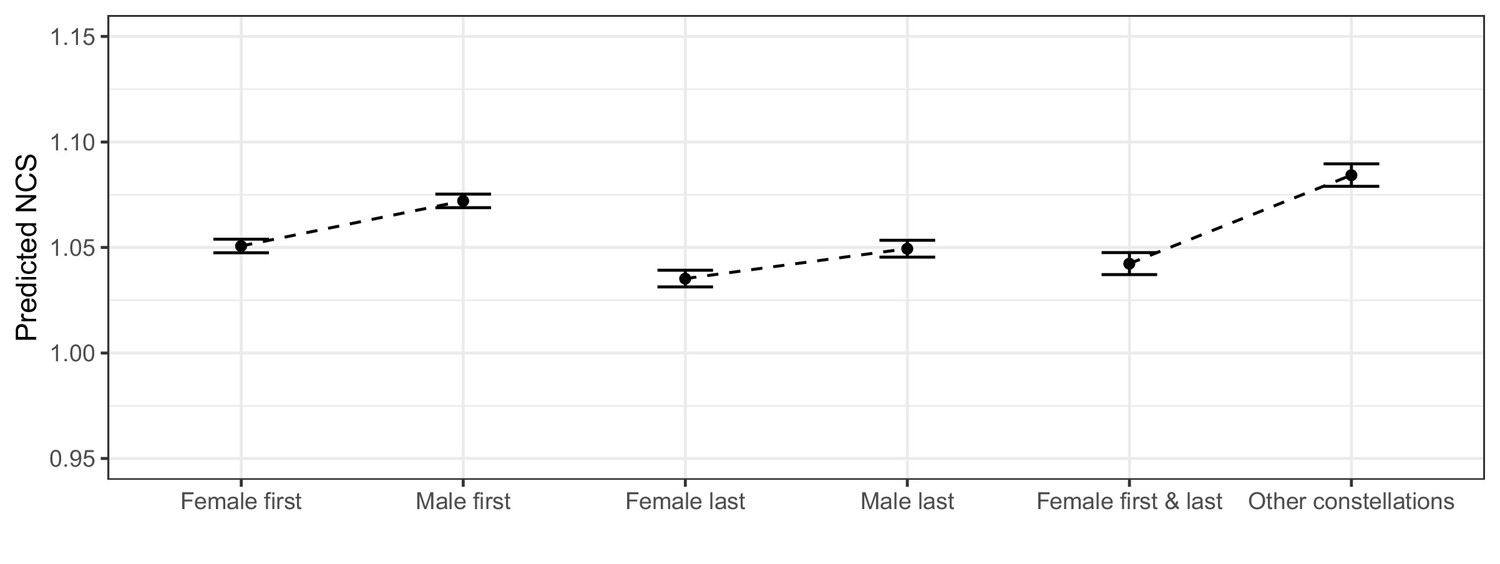
Plot of estimated marginal means for the case and control groups in Samples 1, 2 and 3.
The error bars display 95% confidence intervals. The figure visualizes the predicted, average, differences in per-paper citation scores for the case and control groups after adjusting for self-citations, number of authors, MNCS journal, and international collaboration. Sample 1 compares papers with female first authors to those with male first authors. Sample 2 compares papers with female last authors to those with male last authors. Sample 3 compares papers with female first and last authors to those with other author combinations. Note that the y-axis has a restricted span from. 95 to 1.15. The comparisons indicate trivial, average gender differences.
Figure 4
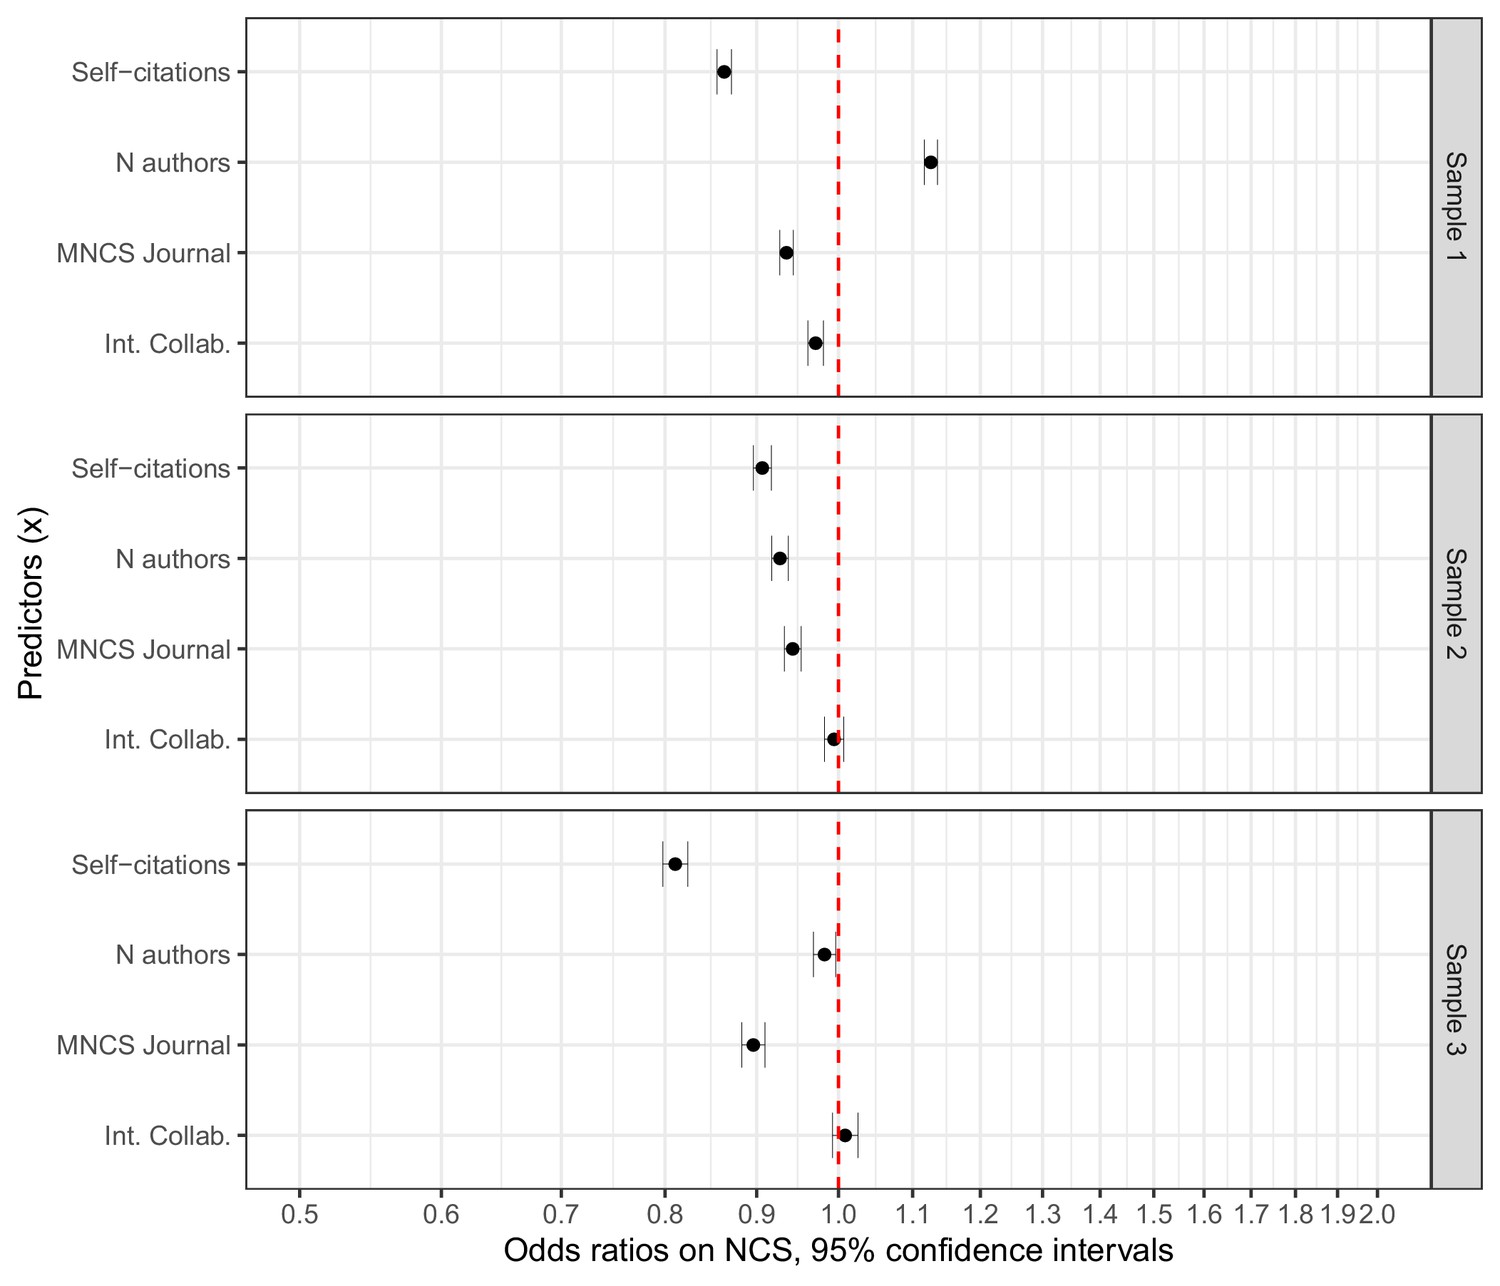
Odds ratios for the standardized predictors included in the logistic regressions.
Error bars represent 95% confidence intervals (see Figure 4—source data 1 for information on estimates and dispersion parameters). All regressions are based on matched samples. Sample 1 compares papers with female first authors to those with male first authors. Sample 2 compares papers with female last authors to those with male last authors. Sample 3 compares papers with female first and last authors to those with other author combinations. The figure indicates that self-citations is the variable that varies the most along gender lines in all three samples, albeit the effects can be considered small.
-
Figure 4—source data 1
Logistic regression results.
- https://doi.org/10.7554/eLife.45374.011
Figure 5

The upper panel shows the distribution of self-citations by five-percentile bins of NCS for each sample.
The average proportions of self-citations are given on the y-axis, the five-percentile bins of NCS on the x-axis. The lower panel displays the distribution of the upper bounds of NCS across the five-percentile bins of NCS. The upper bounds of NCS are given on the y-axis, and the five-percentile bins on the y-axis.
Figure 6

The upper panel shows the proportions of papers with female first authors in Sample 1, female last authors in Sample 2, combinations of female first and last authors in Sample 3, by five-percentile bins of MNCS.
The proportions of case papers are given on the y-axis, and the five-percentile bins of MNCS journal on the y-axis. The lower-left panel displays the upper bounds of MNCS journal by five-percentile bins of MNCS journal for each sample, while the lower-right panel shows the mean NCS by five-percentile bins of MNCS journal for each sample. The upper bounds of MNCS journal (left) and Mean NCS (right) are given on the y-axes, and the five-percentile bins of MNCS journal on the x-axes.
Figure 7 with 3 supplements
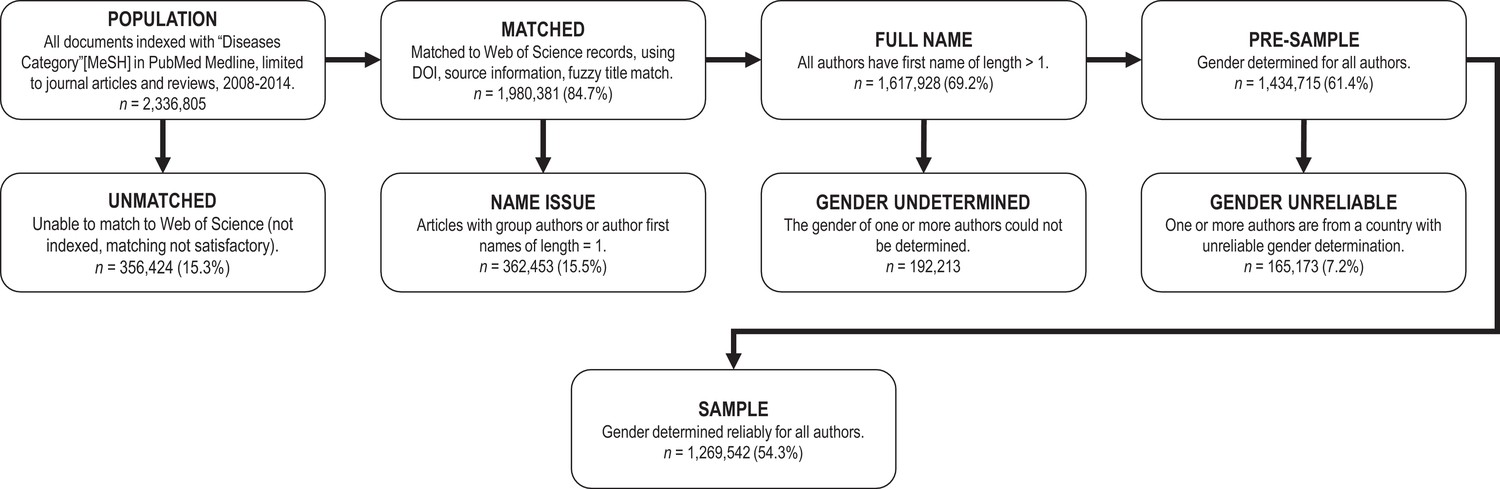
Flowchart of data collection, inclusion and exclusion.
https://doi.org/10.7554/eLife.45374.015-
Figure 7—source data 1
Excluded countries due to unreliable gender assignments from first name.
- https://doi.org/10.7554/eLife.45374.019
-
Figure 7—source data 2
List of specialty and main specialty designation, and number of papers per specialty for the full sample.
- https://doi.org/10.7554/eLife.45374.020
-
Figure 7—source data 3
Groupings of countries by geographical region.
- https://doi.org/10.7554/eLife.45374.021
Figure 7—figure supplement 1
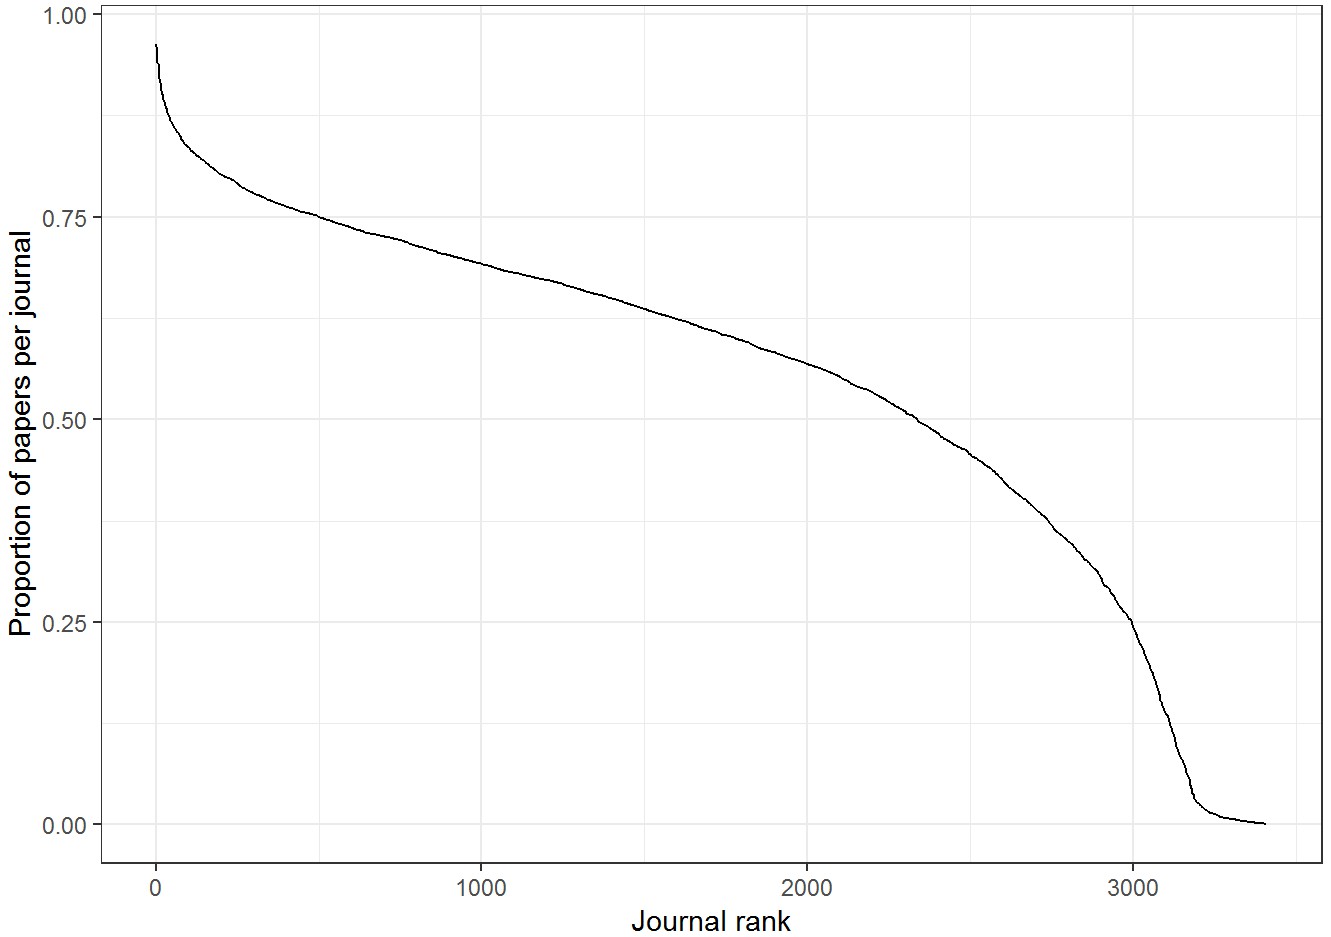
Percentage of papers per journal included in the analysis.
The excluded papers are a combination of missing document types in Web of Science and missing name information. Journals publishing document types which are included in PubMed Medline but not Web of Science (e.g. comments, notes) can account for a large exclusion percentage for many journals. For other journals, first name information is consistently missing for some or all years. Here showing journals with >50 papers only.
Figure 7—figure supplement 2

Reliability of gender assignment per country, shown as the rank of countries.
Gender determination: The online tool Gender-API was used to estimate the gender of all first-name and country pairings. This pairing is important as the gender connotations for some first names vary by language and culture. As an example, the name Kim is typically male in Danish, female in English-speaking countries, and unisex in Korean. Gender-API uses co-occurrences of names and countries on social media to provide a precision score for each assignment, which we use to calculate a probability of an author being female, f. We exclude all authors from this analysis who only have initials registered in Web of Science, or who are from a country with unreliable gender prediction. Country sampling and bias: We calculated a reliability score for each country, by determining the precision score of the Gender-API name assignment for all authors per country. Names with precision scores >= 0.8 are considered reliable, and the reliability for the country is the average reliability hereof. We use the reliability distribution in Figure 7—figure supplement 2 to heuristically set a cut-off at .9 reliability for inclusion in the analysis. The excluded countries are listed in Figure 7—source data 1. For some of the East-Asian countries, the explanation for the low reliability lies in the unisex-naming culture of these countries. For other countries, the probable explanation is the absence of comprehensive social media data from these countries.
Figure 7—figure supplement 3
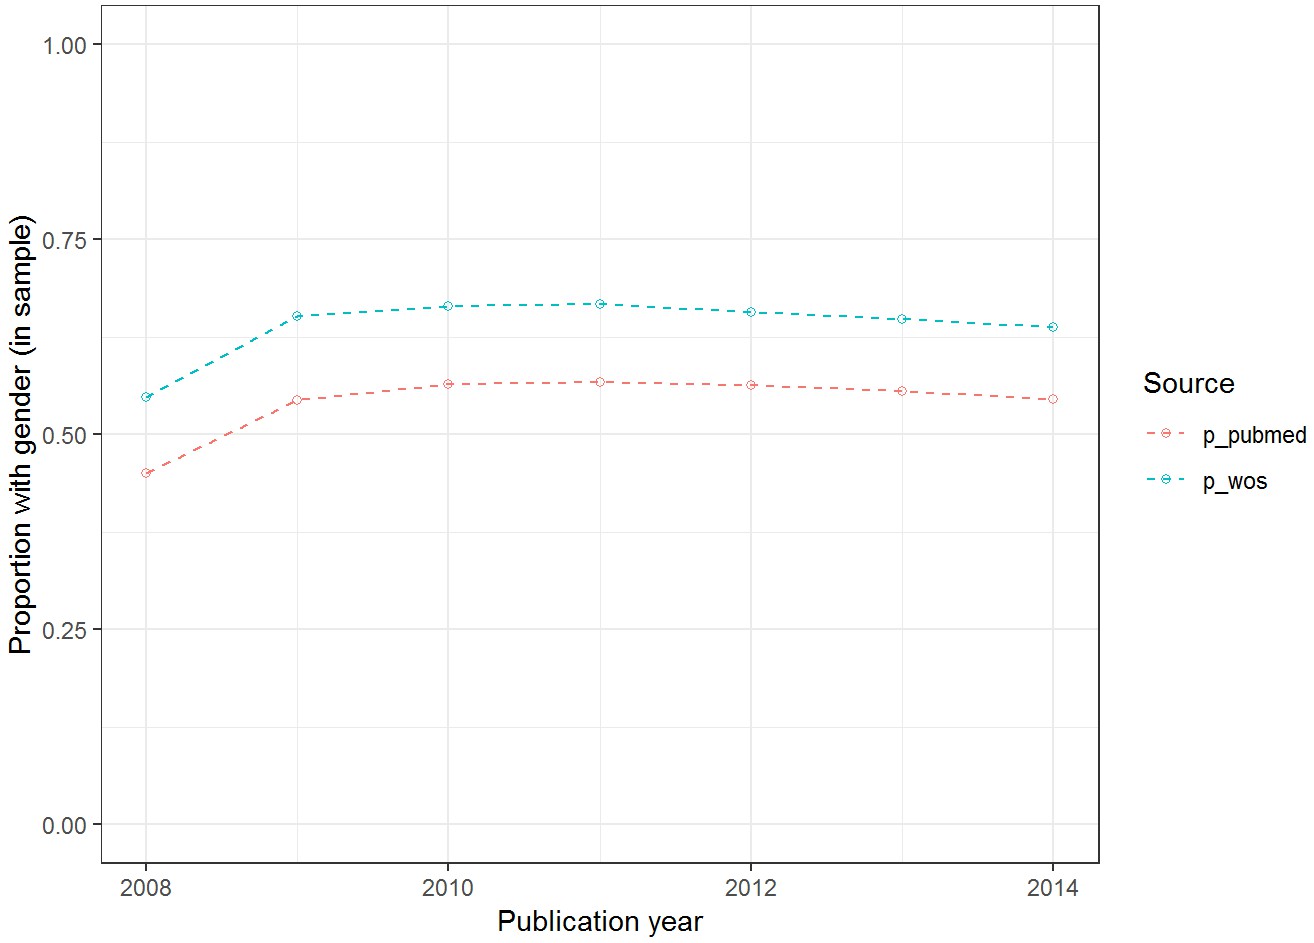
Proportion of papers with gender assignment for all authors.
Reported as function of all sampled papers (p_pubmed) and proportion of all papers matched to Web of Science (p_wos).
Tables
Table 1
Women’s share of authorships overall, across five main specialties, institutional prestige, and geocultural area.
f_w is the weighted proportion of women per paper, f_first the proportion of female first authorships, f_last the proportion of female last authorships, f_both the proportion of papers where women are both first and last authors.
| Overall | f_w | f_first | f_last | f_both |
|---|---|---|---|---|
| 0.35 | 0.40 | 0.26 | 0.15 | |
| Main specialty | f_w | f_first | f_last | f_both |
| Basic science | 0.39 | 0.46 | 0.30 | 0.18 |
| Hospital based | 0.37 | 0.43 | 0.28 | 0.16 |
| Medical | 0.33 | 0.38 | 0.24 | 0.13 |
| Pediatric | 0.46 | 0.52 | 0.37 | 0.24 |
| Surgical/procedural | 0.29 | 0.32 | 0.21 | 0.11 |
| Institutional prestige | f_w | f_first | f_last | f_both |
| Top-100 University | 0.36 | 0.42 | 0.27 | 0.16 |
| Other university | 0.35 | 0.39 | 0.25 | 0.14 |
| Geographic location | f_w | f_first | f_last | f_both |
| Arab countries | 0.33 | 0.34 | 0.27 | 0.16 |
| Commonwealth of Independent States | 0.40 | 0.45 | 0.30 | 0.17 |
| East Asia | 0.19 | 0.19 | 0.09 | 0.04 |
| Latin America | 0.46 | 0.52 | 0.39 | 0.25 |
| North America | 0.36 | 0.40 | 0.27 | 0.15 |
| Oceania | 0.40 | 0.48 | 0.31 | 0.20 |
| South and Central Europe | 0.40 | 0.44 | 0.31 | 0.18 |
| Sub-Saharan Africa | 0.36 | 0.39 | 0.31 | 0.20 |
| South-West Asia | 0.29 | 0.31 | 0.24 | 0.10 |
| Western Europe | 0.35 | 0.42 | 0.24 | 0.14 |
Table 2
Means, standard deviations, medians, Cohen’s d, and Weitzman’s ∆ for case-control comparisons of self-citations and MNCS journal in Samples 1, 2 and 3.
Cohen’s d and Weitzman’s ∆ are calculated with two and one decimal respectively. Weitzman’s ∆ is not calculated for self-citations, as it is a discrete count variables. For sample 1, female first authors is the case and male first authors is the control. For Sample 2, female last authors is the case and male last authors is the control. For Sample 3, female first and last authors is the case and other combinations are the control.
| case (σ) | control (σ) | case | control | d | ∆ | ||
|---|---|---|---|---|---|---|---|
| Sample 1 | Self-citations | 1.91 (3.18) | 2.16 (3.93) | 1 | 1 | -0.07 | |
| MNCS journal | 1.16 (.90) | 1.21 (1.04) | .99 | 1.00 | -0.05 | 96.4% | |
| Sample 2 | Self-citations | 1.84 (3.22) | 2.08 (3.77) | 1 | 1 | -0.07 | |
| MNCS journal | 1.14 (.98) | 1.20 (.99) | .98 | 1.00 | -0.06 | 95.6% | |
| Sample 3 | Self-citations | 1.74 (2.84) | 2.13 (3.91) | 1 | 1 | -0.11 | |
| MNCS journal | 1.12 (.97) | 1.20 (1.02) | .97 | 1.0 | -0.08 | 93.4% |
Additional files
-
Supplementary file 1
Literature review.
- https://doi.org/10.7554/eLife.45374.022
-
Transparent reporting form
- https://doi.org/10.7554/eLife.45374.023
Download links
A two-part list of links to download the article, or parts of the article, in various formats.
Downloads (link to download the article as PDF)
Open citations (links to open the citations from this article in various online reference manager services)
Cite this article (links to download the citations from this article in formats compatible with various reference manager tools)
Meta-Research: Gender variations in citation distributions in medicine are very small and due to self-citation and journal prestige
eLife 8:e45374.
https://doi.org/10.7554/eLife.45374


