Enhanced functional detection of synaptic calcium-permeable AMPA receptors using intracellular NASPM
- Department of Neuroscience, Physiology and Pharmacology, University College London, United Kingdom
Figures
Figure 1
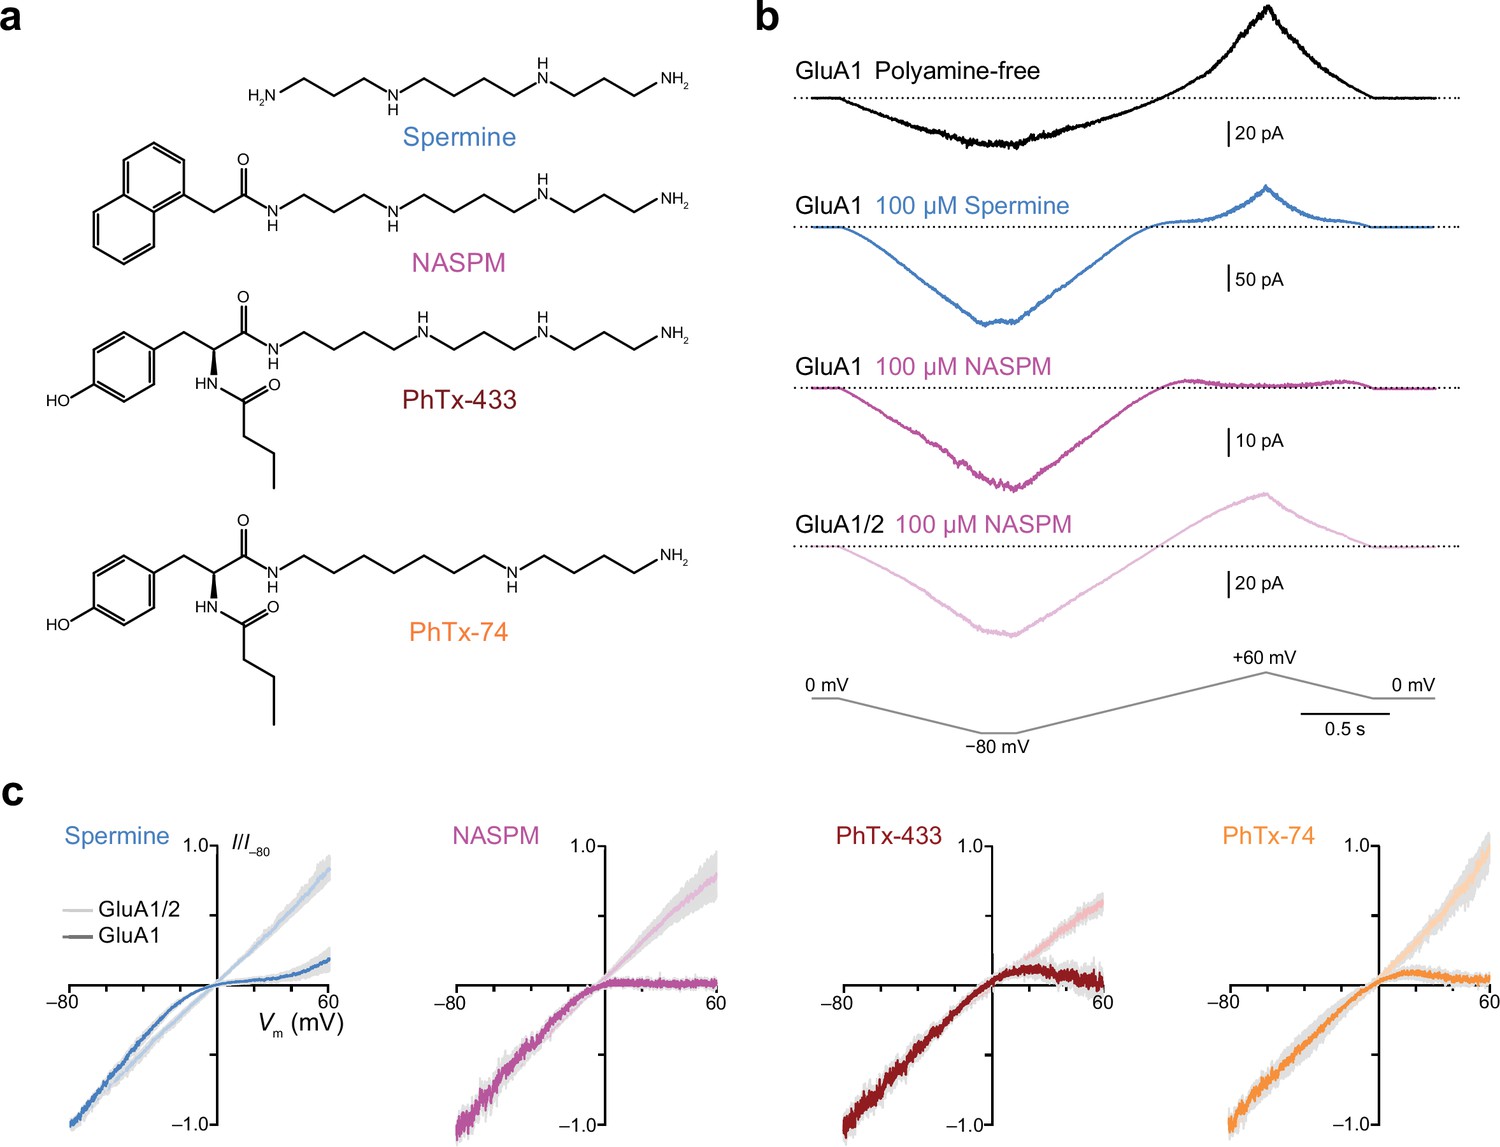
Intracellular 1-naphthylacetyl spermine (NASPM) and polyamine toxins specifically block GluA2-lacking calcium-permeable AMPA-type glutamate receptors (CP-AMPARs) in a voltage-dependent manner.
(a) The blockers used in this study. (b) Representative responses activated by 300 µM glutamate and 50 µM cyclothiazide from outside-out patches excised from HEK293 cells expressing either GluA1 or GluA1/2. The voltage was ramped linearly from −80 to +60 mV (100 mV/s). GluA1 displayed outward rectification with a polyamine-free pipette solution. In the presence of 100 μM spermine GluA1 displayed a doubly rectifying relationship, and with 100 μM NASPM GluA1 displayed full inward rectification. GluA1/2 did not rectify in the presence of NASPM. (c) Normalized and pooled current-voltage (I-V) relationships for GluA1 and GluA1/2 in the presence of 100 μM intracellular polyamines (n=3–8). Colored traces denote the mean and gray shading ± standard error of the mean. For all blockers the RI+60/−60 value with GluA1 was less than that with GluA1/2; the unpaired mean differences and 95% confidence intervals were −0.85 [−1.09,–0.63] with spermine (n=4 GluA1/2 patches and 5 GluA1 patches), −1.07 [−1.7,–0.79] with NASPM (n=8 and 4),–0.82 [−0.96,–0.60] with PhTx-433 (n=3 and 4), and −0.78 [−0.91,–0.70] with PhTx-74 (n=3 and 4).
-
Figure 1—source data 1
RI+60/−60 values from GluA1 and GluA1/γ2 ramp current-voltage (I-V) relationships (300 µM glutamate) were recorded with intracellular spermine, NASPM, PhTx-433, or PhTx-74 (each 100 µM).
- https://cdn.elifesciences.org/articles/66765/elife-66765-fig1-data1-v2.zip
Figure 2
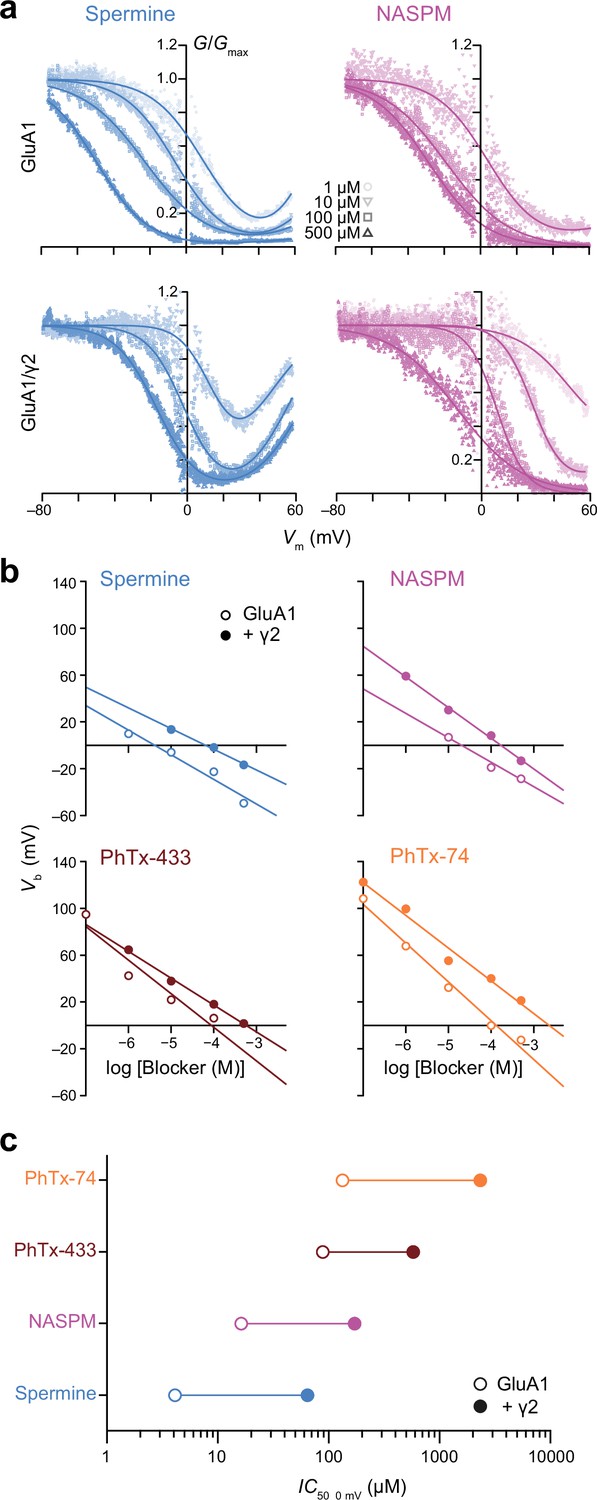
Spermine, 1-naphthylacetyl spermine (NASPM), and polyamine toxins display different potencies of GluA1 block that are all decreased by transmembrane AMPAR regulatory proteins (TARP) γ2.
(a) Pooled, normalized conductance-voltage (G-V) relationships (from voltage ramps as in Figure 1) for GluA1 and GluA1/γ2 in the presence of spermine (left) or NASPM (right) (n=4–8). Conductance was corrected for the outwardly rectifying response seen in polyamine-free conditions and fitted with single or double Boltzmann relationships (solid lines). (b) Vb values from fitted G-V relationships of GluA1 and GluA1/γ2 in the presence of varying concentrations of blockers. When Vb was plotted against log [blocker] a linear relationship could be fitted in all cases, the x-intercept of which gave IC50, 0 mV. (c) The IC50, 0 mV values for each polyamine demonstrate relative potency in the order spermine >NASPM >PhTx-433 >PhTx-74, with γ2 co-expression reducing the potency of the blockers by 7–18-fold.
-
Figure 2—source data 1
Vb values for GluA1 and GluA1/γ2 obtained with intracellular spermine, NASPM, PhTx-433, or PhTx-74.
- https://cdn.elifesciences.org/articles/66765/elife-66765-fig2-data1-v2.zip
-
Figure 2—source data 2
IC50 0 mV values for GluA1 and GluA1/γ2 obtained with intracellular spermine, NASPM, PhTx-433, or PhTx-74.
- https://cdn.elifesciences.org/articles/66765/elife-66765-fig2-data2-v2.zip
Figure 3
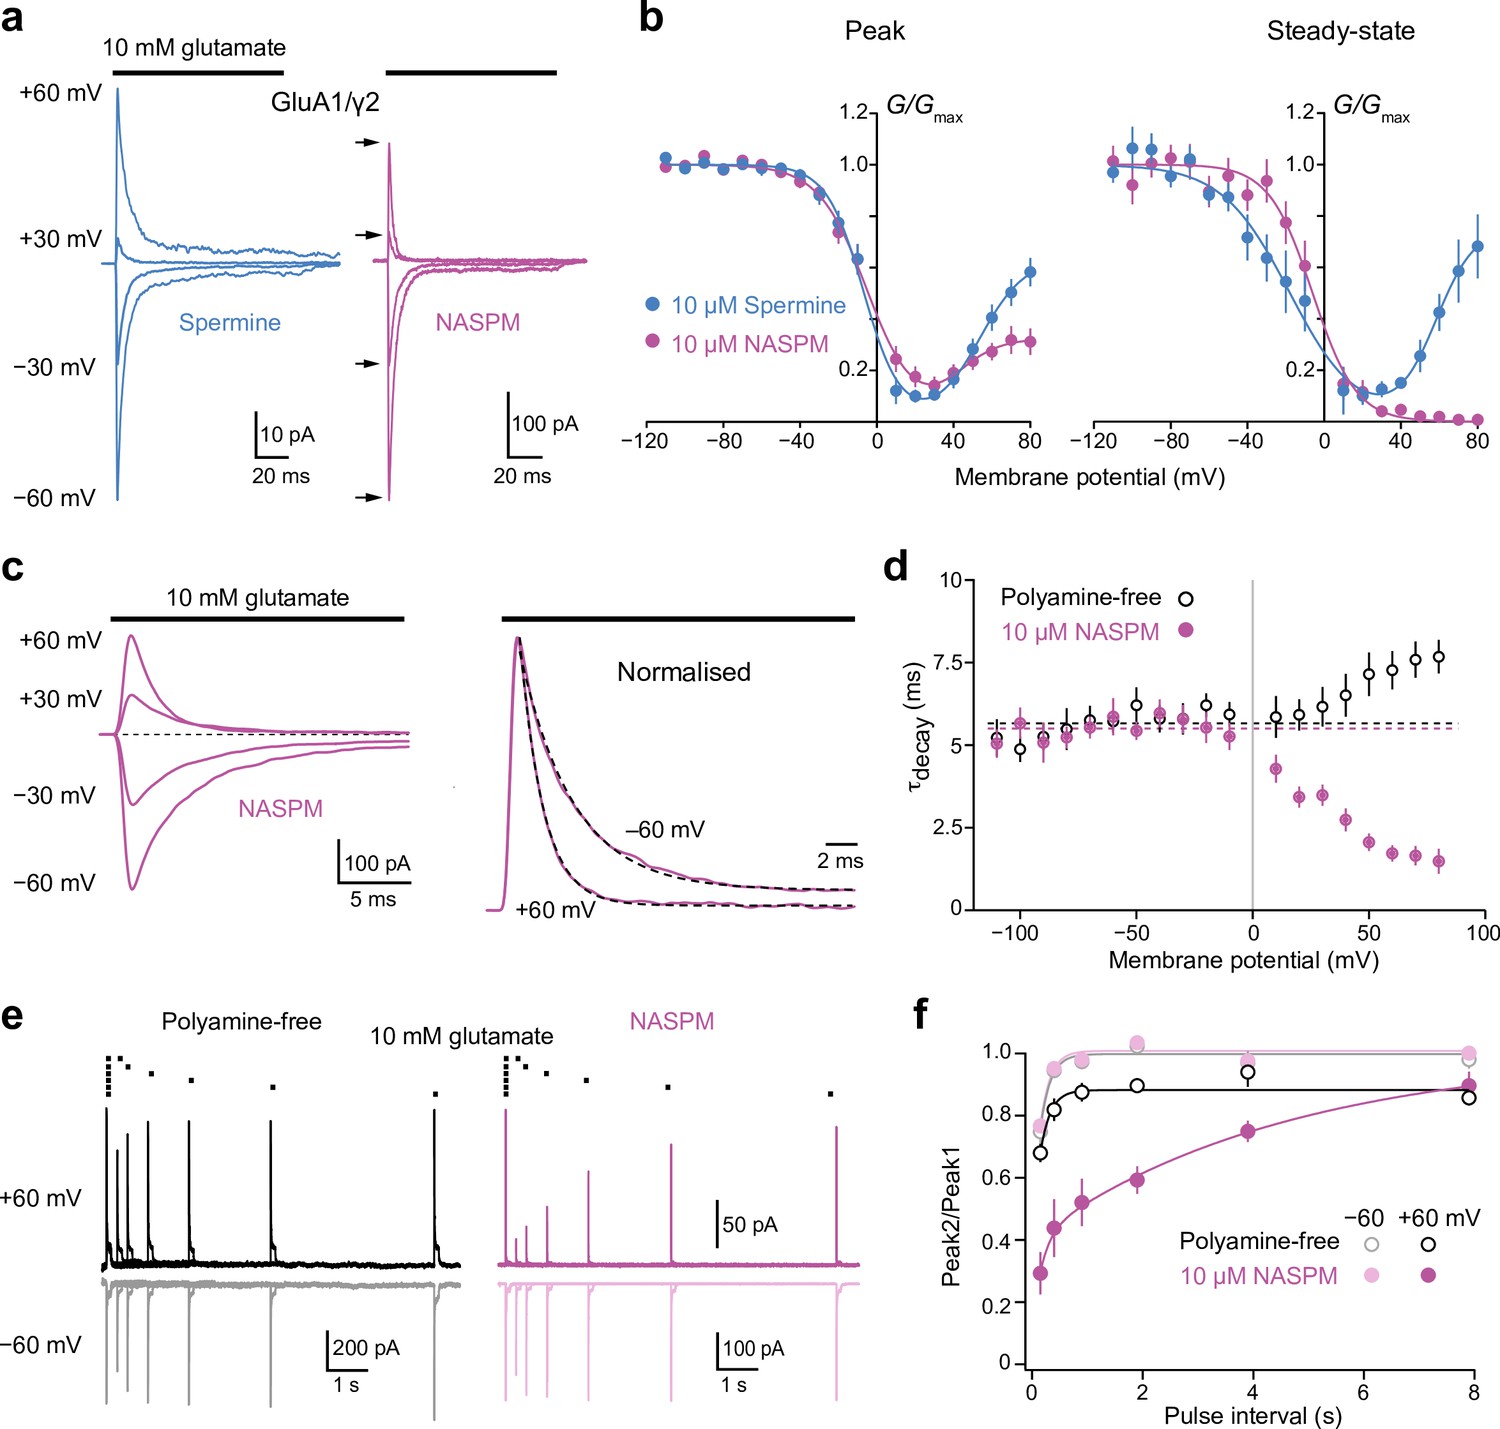
Block of GluA1/γ2 by 10 µM intracellular 1-naphthylacetyl spermine (NASPM) shows use-dependence and slow recovery.
(a) Representative GluA1/γ2 currents in the presence of 10 μM intracellular spermine or NASPM activated by fast applications of glutamate (10 mM, 100 ms) at positive and negative potentials. In the presence of NASPM, relative peak outward currents are smaller than those seen with spermine, while steady-state currents are negligible. (b) Pooled, averaged conductance-voltage (G-V) relationships for peak and steady-state currents obtained with spermine (n=9 and 6, respectively) and NASPM (n=11 and 8, respectively). Symbols and error bars indicate the mean ± standard error of the mean. Note the stronger inhibition by NASPM of the steady-state compared with peak currents. (c) Representative GluA1/γ2 currents with 10 μM intracellular NASPM at the indicated voltages (left) and normalized currents from the same patch at +60 and −60 mV (right). Applications of glutamate at each voltage were preceded by an application at −60 mV to relieve the NASPM block. The dashed lines are single exponential fits. (d) Pooled data showing weighted time constants of decay with polyamine-free (open symbols, n=8) and 10 μM NASPM (n=8) intracellular solutions measured between −110 mV and +80 mV. Symbols and error bars indicate the mean ± standard error of the mean. The kinetics of the negative limb (−110 mV to −10 mV) were voltage and NASPM independent (fitted lines indicate τdecay values of 5.7 ms for polyamine free and 5.4 ms for NASPM). The kinetics of the positive limb (+10 to +80 mV) was markedly accelerated in the presence of intracellular NASPM. (e) Superimposed GluA1/γ2 currents in the presence or absence of 10 μM NASPM elicited by pairs of glutamate applications at 4, 2, 1, 0.5, 0.25, and 0.125 Hz (10 mM, 100 ms,+/−60 mV). The first responses with NASPM were scaled to those in the polyamine-free condition. With NASPM at −60 mV and in the absence of polyamine at both voltages, the second currents broadly recovered to the initial levels. With NASPM at +60 mV, however, peak currents recovered much more slowly. (f) Pooled recovery data recorded in the polyamine-free condition (open symbols, n=9) and with added 10 μM NASPM (filled symbols, n=9). Symbols and error bars indicate the mean ± standard error of the mean.
-
Figure 3—source data 1
Normalized G-V data for peak and steady-state currents evoked by 10 mM glutamate from GluA1/γ2 receptors with intracellular spermine (10 μM) or NASPM (10 μM).
- https://cdn.elifesciences.org/articles/66765/elife-66765-fig3-data1-v2.zip
-
Figure 3—source data 2
τdecay values for currents evoked by 10 mM glutamate from GluA1/γ2 receptors with intracellular NASPM (10 μM) or with the polyamine-free intracellular solution at different membrane voltages.
- https://cdn.elifesciences.org/articles/66765/elife-66765-fig3-data2-v2.zip
-
Figure 3—source data 3
Recovery data (Peak 2/Peak 1) for currents evoked by 10 mM glutamate from GluA1/γ2 receptors with intracellular NASPM (10 μM) or with the polyamine-free intracellular solution at +60 and −60 mV.
- https://cdn.elifesciences.org/articles/66765/elife-66765-fig3-data3-v2.zip
Figure 4
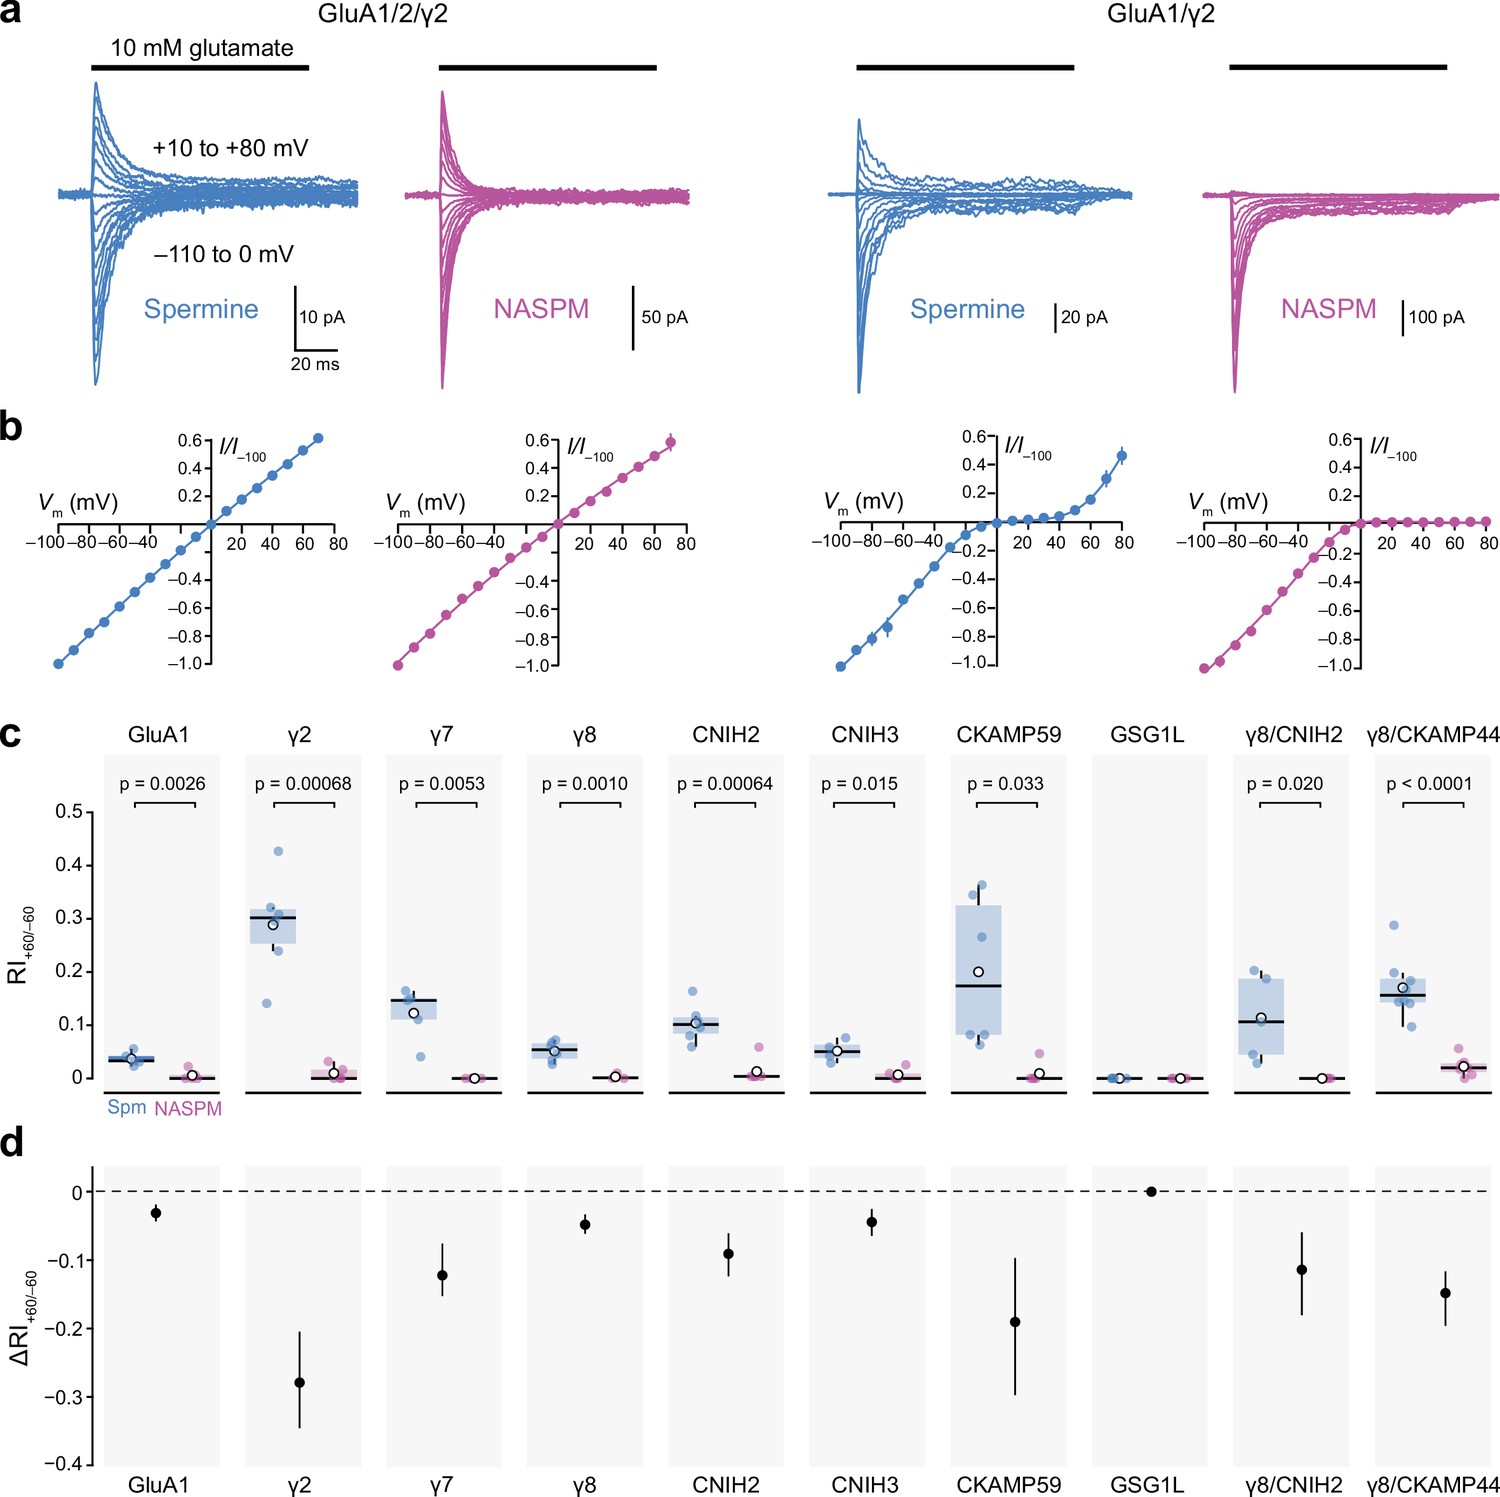
Calcium-permeable AMPA-type glutamate receptor (CP-AMPAR) rectification in the presence of 100 µM intracellular 1-naphthylacetyl spermine (NASPM) is unaffected by auxiliary proteins.
(a) Representative currents activated by fast applications of glutamate to outside-out patches excised from HEK293 cells transfected with GluA1/GluA2/γ2 (left) or GluA1/γ2 (right) (10 mM, 100 ms, −110 to +80 mV). The intracellular solution was supplemented with 100 µM spermine (blue) or NASPM (purple). (b) Mean normalized peak current-voltage (I-V) relationships for GluA1/GluA2/γ2 and GluA1/γ2 with 100 μM spermine (blue) or NASPM (purple). Symbols and error bars indicate the mean ± standard error of the mean. (c) Pooled rectification data (RI+60/−60) for GluA1 and GluA1/auxiliary subunit combinations with 100 μM spermine (Spm) or NASPM. Box-and-whisker plots indicate the median (black line), the first and third quartiles (Q1 and Q3; 25–75th percentiles) (box), and the range min(x[x>Q1+1.5 * inter-quartile range]) to max(x[x<Q3+1.5 * inter-quartile range]) (whiskers). Indicated p-values are from two-sided Welch two-sample t-tests (note that for GSG1L all RI values were 0). (d) Difference plots showing the shift in rectification index (Δ RI+60/−60) in the presence of NASPM compared with spermine. Symbols show mean unpaired differences, and the error bars indicate the bootstrapped 95% confidence intervals.
-
Figure 4—source data 1
Normalized current-voltage (I-V) data for peak currents evoked by 10 mM glutamate from GluA1/2/γ2, and GluA1/γ2 receptors with intracellular spermine (100 μM) or NASPM (100 μM).
- https://cdn.elifesciences.org/articles/66765/elife-66765-fig4-data1-v2.zip
-
Figure 4—source data 2
RI+60/−60 values for peak currents evoked by 10 mM glutamate from GluA1, GluA1/γ2, GluA1/γ7, GluA1/γ8, GluA1/CNIH2, GluA1/CNIH3, GluA1/CKAMP59, GluA1/GSG1L, GluA1/γ8/CNIH2, and GluA1/γ8/CKAMP44 receptors with intracellular spermine (100 μM) or NASPM (100 μM).
- https://cdn.elifesciences.org/articles/66765/elife-66765-fig4-data2-v2.zip
Figure 5
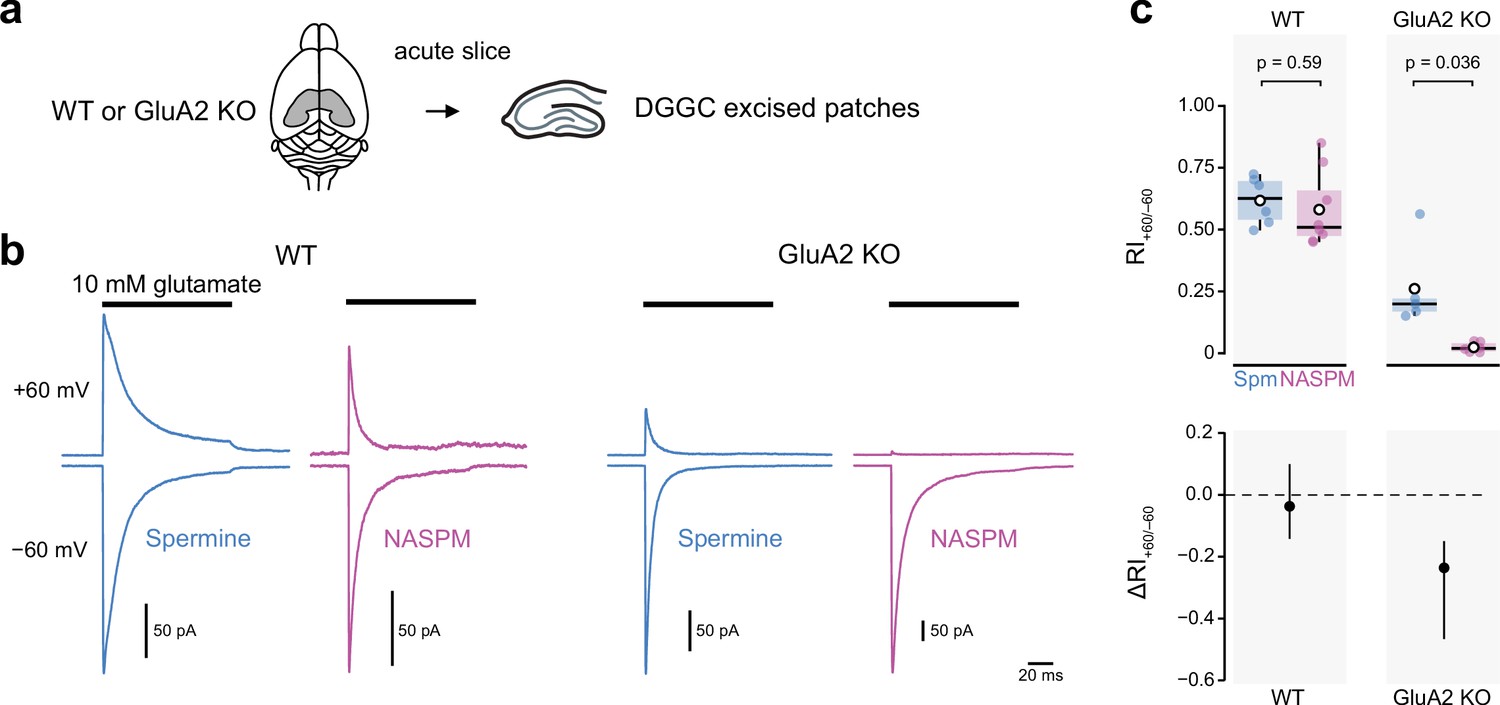
Intracellular 1-naphthylacetyl spermine (NASPM) (100 μM) produces full rectification of currents carried by extrasynaptic calcium-permeable AMPA-type glutamate receptors (CP-AMPARs) from dentate gyrus granule cells.
(a) Diagrammatic representation of the preparation. (b) Representative average glutamate-evoked currents from four outside-out patches excised from somata of wild-type (WT) and GluA2 KO dentate gyrus granule cells held at −60 and +60 mV with 100 μM intracellular spermine (blue) or 100 μM intracellular NASPM (purple). (c) Pooled rectification data (RI+60/−60) for WT and GluA2 KO patches with 100 μM spermine (Spm) or NASPM. Box-and-whisker plots (top) and difference plots showing the shift in rectification index (Δ RI+60/−60) in the presence of NASPM compared with spermine (bottom) as in Figure 4c and d. Indicated p-values are from two-sided Welch two-sample t-tests.
-
Figure 5—source data 1
RI+60/−60 values for peak currents evoked by 10 mM glutamate from wild-type (WT) and GluA2 KO DGGCs with intracellular spermine (100 μM) or NASPM (100 μM).
- https://cdn.elifesciences.org/articles/66765/elife-66765-fig5-data1-v2.zip
Figure 6
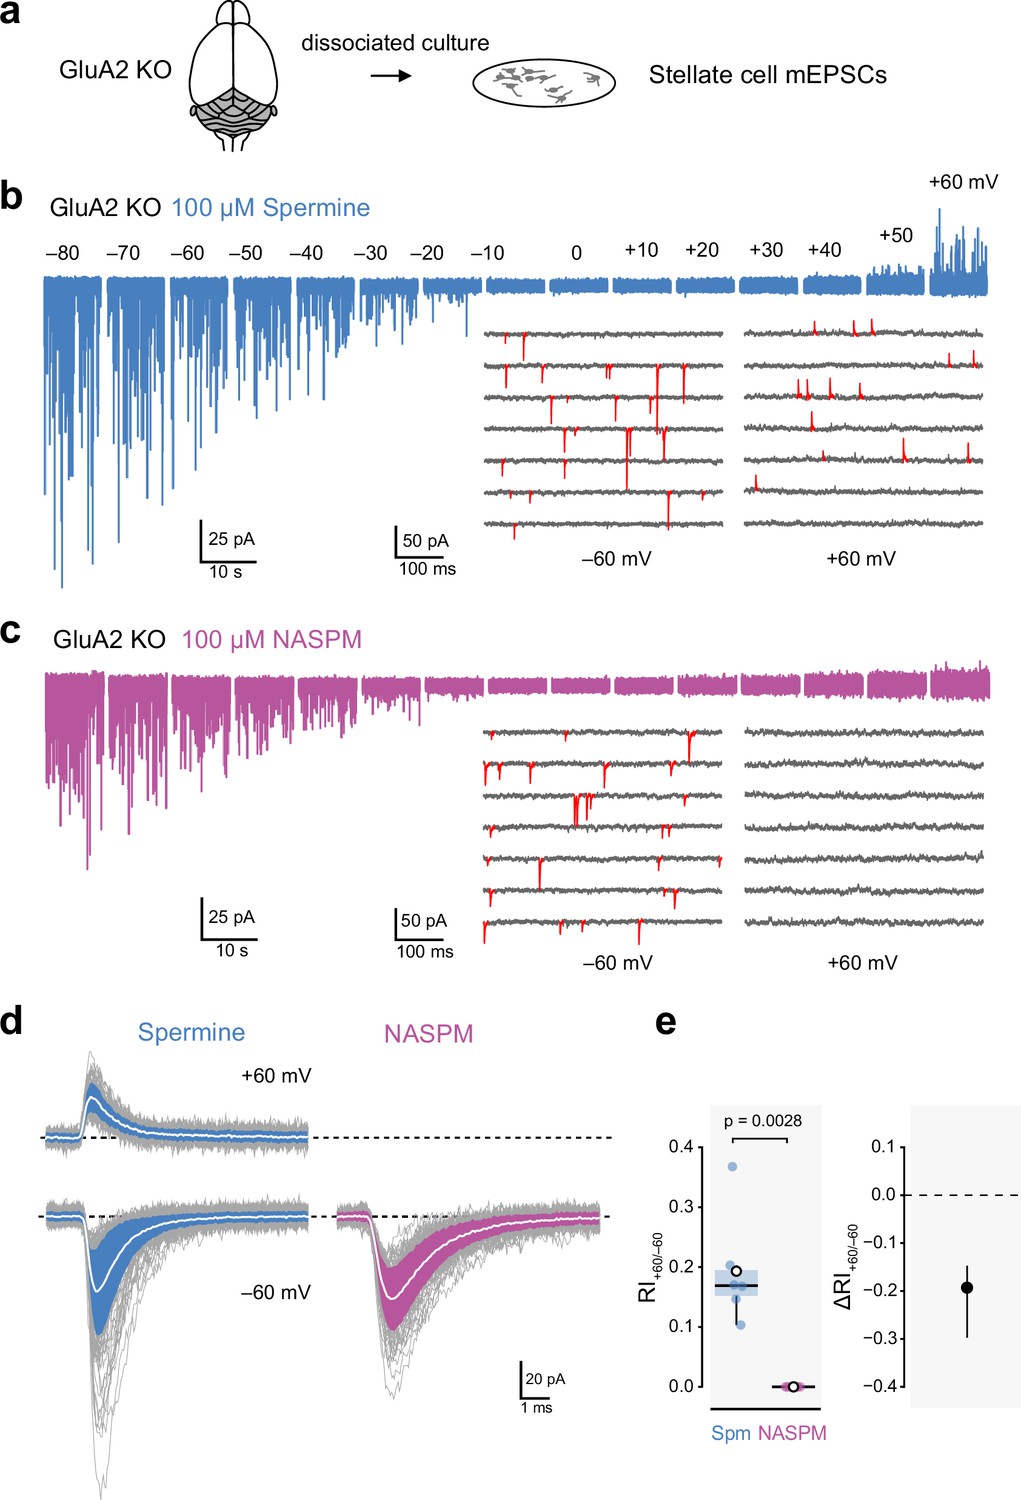
Intracellular 1-naphthylacetyl spermine (NASPM) (100 μM) produces full rectification of calcium-permeable AMPA-type glutamate receptor (CP-AMPAR)-mediated mEPSCs.
(a) Diagrammatic representation of the preparation. (b) Representative whole-cell recording from a cultured GluA2-knockout (GluA2 KO) cerebellar stellate cell held at voltages between −80 and +60 mV with 100 μM intracellular spermine. The inset shows expanded sweeps at −60 and +60 mV, with mEPSCs indicated in red. Note the presence of mEPSCs at both voltages. (c) Same as a, but for a cell with 100 μM intracellular NASPM. The inset shows that mEPSCs (red) were present at −60 mV but not at +60 mV. (d) Representative averaged mEPSCs from a cell recorded with intracellular spermine (left) and from a cell recorded with intracellular NASPM (right). Individual mEPSCs are shown in gray, the averaged mEPSCs are shown in white, superimposed on filled areas indicating the standard deviation of each recording. (e) Box-and-whisker plot and corresponding difference plot as described in Figure 4c and d of pooled RI+60/−60 data. Indicated p-value is from a two-sided Welch two-sample t-test.
-
Figure 6—source data 1
RI+60/−60 values for cerebellar stellate cell mEPSCs were recorded with intracellular spermine (100 μM) or NASPM (100 μM).
- https://cdn.elifesciences.org/articles/66765/elife-66765-fig6-data1-v2.zip
Figure 7
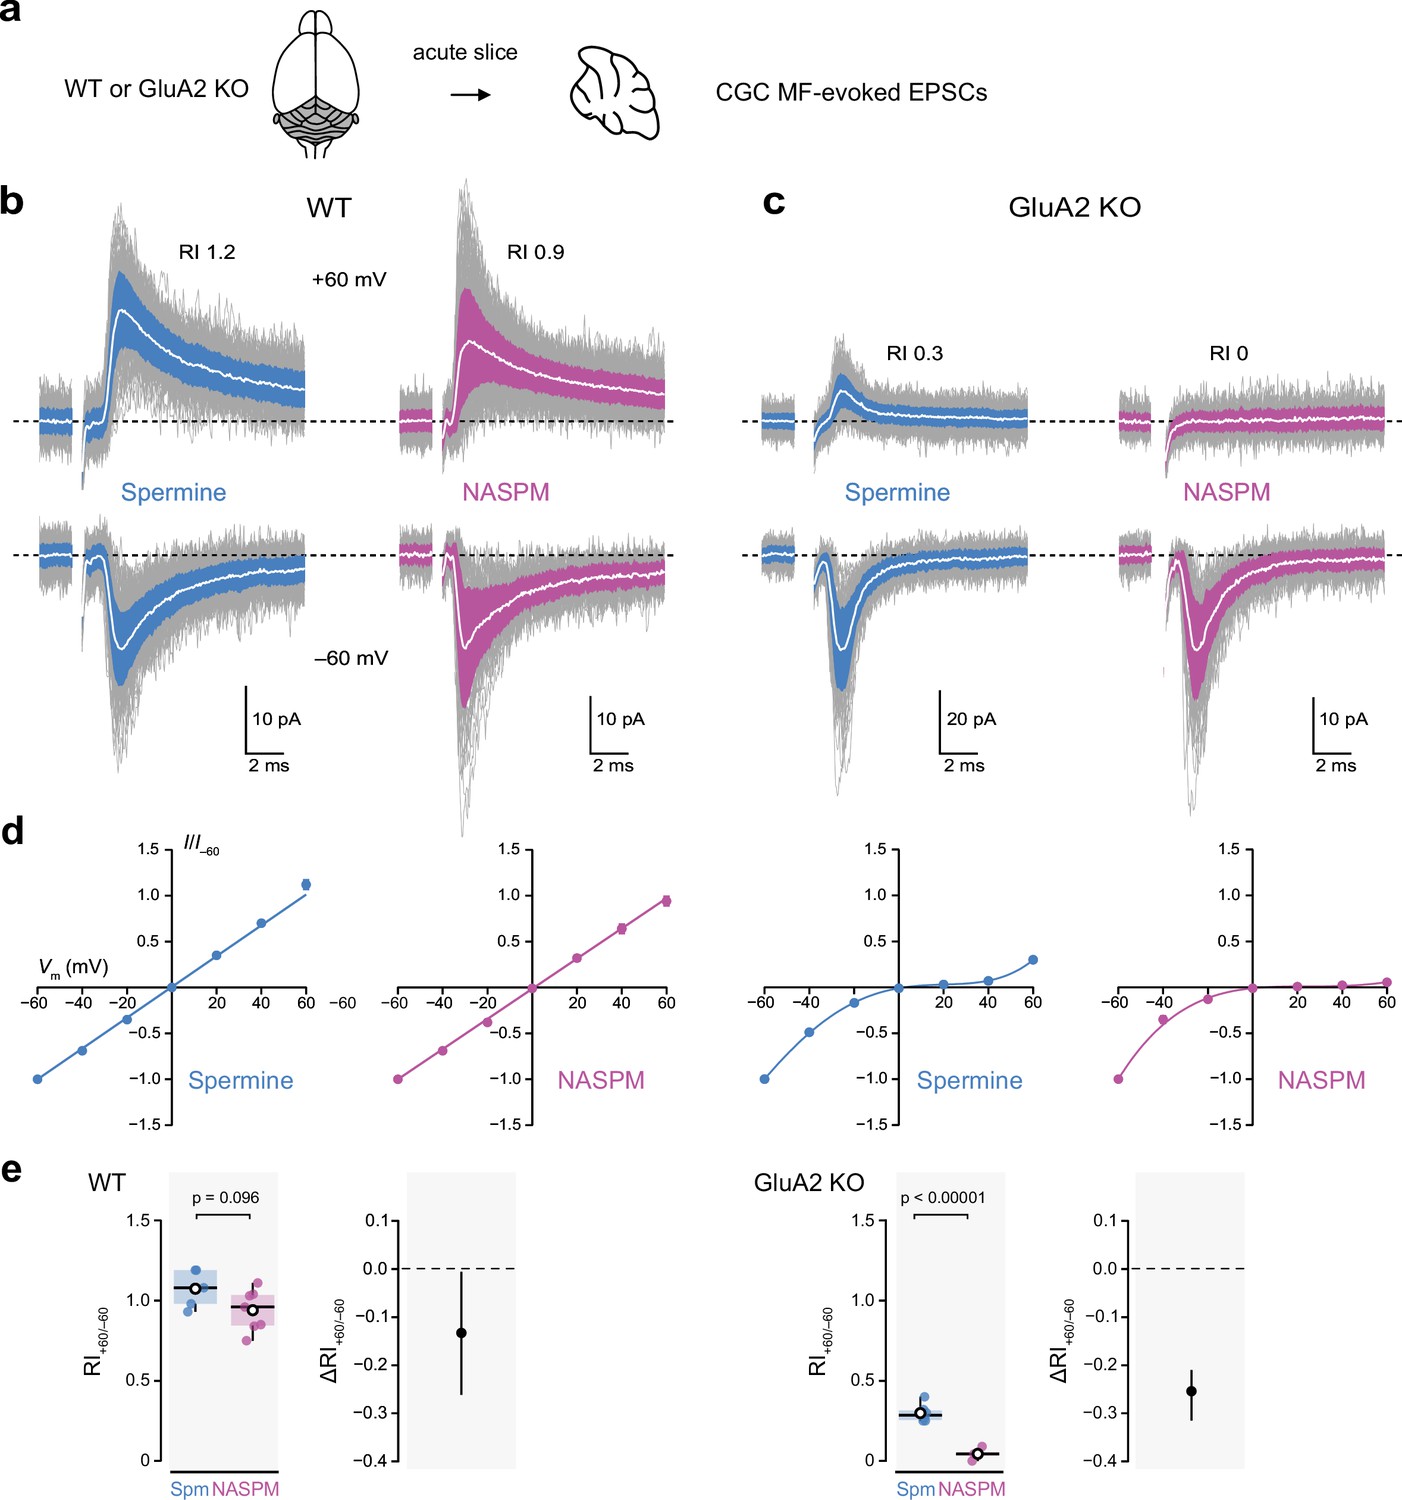
Intracellular 1-naphthylacetyl spermine (NASPM) (100 μM) produces full rectification of calcium-permeable AMPA-type glutamate receptor (CP-AMPAR)-mediated MF-eEPSCs.
(a) Diagrammatic representation of the preparation. (b) Representative whole-cell recordings of mossy fiber-evoked EPSCs from wild-type (WT) cerebellar granule cells (CGCs) held at −60 and +60 mV with 100 μM intracellular spermine (blue) or 100 μM intracellular NASPM (purple). Individual mEPSCs are shown in gray, the averaged mEPSCs are shown in white, superimposed on filled areas indicating the standard deviation of each recording. The RI values are of the illustrated records (peak averaged current at +60/peak averaged current at −60 mV). (c) Same as a, but for two cells in slices from GluA2-knockout (GluA2 KO) mice. (d) Normalized current-voltage (I-V) plots for eEPSCs recorded from cells in slices from WT and GluA2 KO mice with 100 μM intracellular spermine (blue) or 100 μM intracellular NASPM (purple). Symbols denote mean values and error bars denote the standard error of the mean (WT; n=5 spermine and 7 NASPM. GluA2 KO; n=6 spermine and 4 NASPM). Fits are straight lines (WT) or fifth-order polynomials (GluA2 KO). (e) Box-and-whisker and difference plots as described in Figure 4c and d for rectification values (RI+60/−60) obtained with spermine (Spm) and NASPM from WT and GluA2 KO cells. Indicated p-values are from two-sided Welch two-sample t-tests.
-
Figure 7—source data 1
MF-eEPSC peak amplitudes, 20–80% rise times and w,decay values from wild-type (WT) and GluA2-knockout (GluA2 KO) CGCs recorded with intracellular spermine (100 μM) or NASPM (100 μM).
- https://cdn.elifesciences.org/articles/66765/elife-66765-fig7-data1-v2.zip
-
Figure 7—source data 2
Normalized current-voltage (I-V) data for peak MF-eEPSCs from wild-type (WT) and GluA2-knockout (GluA2 KO) CGCs recorded with intracellular spermine (100 μM) or NASPM (100 μM).
- https://cdn.elifesciences.org/articles/66765/elife-66765-fig7-data2-v2.zip
-
Figure 7—source data 3
RI+60/−60 values for peak MF-eEPSCs from wild-type (WT) and GluA2-knockout (GluA2 KO) CGCs were recorded with intracellular spermine (100 μM) or NASPM (100 μM).
- https://cdn.elifesciences.org/articles/66765/elife-66765-fig7-data3-v2.zip
Tables
Key resources table
| Reagent type (species) or resource | Designation | Source or reference | Identifiers | Additional information |
|---|---|---|---|---|
| Strain, strain background (Mus musculus) | Gria2tm1Rod/J, 129 /CD1 | other | Gift from Ingo Greger, MRC LMB, Cambridge, UK | |
| Genetic reagent (Mus musculus) | oIMR6780 (Gria2) | JAX | JAX:oIMR6780 | wild-type Forward primer GGT TGG TCA CTC ACC TGC TT |
| Genetic reagent (Mus musculus) | oIMR6781 (Gria2) | JAX | JAX:oIMR6781 | Common primer TCG CCC ATT TTC CCA TAT AC |
| Genetic reagent (Mus musculus) | oIMR8444 (Gria2) | JAX | JAX:oIMR8444 | Mutant primer GCC TGA AGA ACG AGA TCA GC |
| Cell line (Homo sapiens) | HEK293 | ATCC | ATTC:CRL-1573 | |
| Transfected construct (Rattus norvegicus) | pIRES-eGFP-GluA1 | doi:10.1126/science.2166337; doi:10.1038/nn.2266 | Gria1; Flip form. Gift from Peter Seeburg (subcloned into pIRES-eGFP) | |
| Transfected construct (Rattus norvegicus) | pIRES-eGFP-GluA2 | doi:10.1126/science.2166337; doi:10.1523/JNEUROSCI.17-01-00058.1997 | Gria2; Q/R and R/G edited flip form. Gift from Peter Seeburg (subcloned into pIRES-eGFP) | |
| Transfected construct (Rattus norvegicus) | pIRES-eGFP-γ2 | doi:10.1038/1228; doi:10.1038/nn.2266 | Cacng2; Gift from Roger Nicoll, UCSF, USA | |
| Transfected construct (Homo sapiens) | pIRES-eGFP-γ7 | doi:10.1038/nn.2266 | CACNG7; OriGene Technologies pCMV6-XL4-γ7 (subcloned into pIRES-eGFP) | |
| Transfected construct (Rattus norvegicus) | pIRES-eGFP-γ8 | doi:10.1083/jcb.200212116; doi:10.1038/nn.2266 | Cacng8; gift from Roger Nicoll, UCSF, USA | |
| Transfected construct (Rattus norvegicus) | pIRES-eGFP-CNIH2 | doi:10.1126/science.1167852; doi:10.1523/JNEUROSCI.0345–12.2012 | Cnih2; gift from Bernd Fakler, University of Freiburg, Germany (subcloned into pIRES-eGFP) | |
| Transfected construct (Rattus norvegicus) | pIRES-eGFP-CNIH3 | doi:10.1016/j.neuron.2012.03.034; doi:10.1523/JNEUROSCI.0345–12.2012 | Cnih3; Gift from Bernd Fakler, University of Freiburg, Germany (subcloned into pIRES-eGFP) | |
| Transfected construct (Mus musculus) | pRK5-CKAMP44a | doi:10.1126/science.1184245 | Ckamp44; Gift from Jakob von Engelhardt, Johannes Gutenberg University, Mainz, Germany | |
| Transfected construct (Mus musculus) | pRK5-CKAMP59-short | doi:10.7554/eLife.09693.001 | Ckamp59; Gift from Jakob von Engelhardt, Johannes Gutenberg University, Mainz, Germany | |
| Transfected construct (Rattus norvegicus) | pcDNA3.1-GSG1L | doi:10.1016/j.neuron.2012.03.034; doi:10.1523/JNEUROSCI.2152–15.2015 | Gsg1l; Gift from Bernd Fakler, University of Freiburg, Germany | |
| Transfected construct (Rattus norvegicus) | pcDNA3-Homer1c-tdDsRed | doi:10.1016/j.neuron.2007.01.030 | Gift from Daniel Choquet, University of Bordeaux, France | |
| Chemical compound, drug | PhTx-433; Spermine tetrahydrochloride | Sigma-Aldrich, Merck Life Science UK Limited, Gillingham, UK | Sigma-Adrich:P207; Sigma-Adrich:85610 | |
| Chemical compound, drug | PhTx-74 | Tocris Bioscience, Bio-Techne Ltd, Abingdon, UK | Tocris:2770 | |
| Chemical compound, drug | NASPM | HelloBio, Bristol, UK | HelloBio:HB0441 | |
| Software, algorithm | IGOR Pro | Wavemetrics, Lake Oswego, Oregon, USA | RRID:SCR_000325 | version 6.35 |
| Software, algorithm | pClamp | Molecular Devices | RRID:SCR_011323 | version 10 |
| Software, algorithm | WinWCP | Strathclyde Electrophysiology Software | RRID:SCR_014713 | version 5.2.7 |
| Software, algorithm | NeuroMatic | http://www.neuromatic.thinkrandom.com | RRID:SCR_004186 | version 2.8 |
| Software, algorithm | R | R Foundation for Statistical Computing | RRID:SCR_001905 | version 4.1.0 |
| Software, algorithm | RStudio Desktop | Posit Software | RRID:SCR_000432 | version 2022.12.0 |
Author response table 1
| NASPM 100 μM: | Mean −153 pA | Range −20 to −401 pA |
|---|---|---|
| Spermine 100 μM: | Mean −54 pA | Range −19 to −97 pA |
| NASPM 10 μM: | Mean −118 pA | Range −12 to −458 pA |
| Spermine 10 μM: | Mean −105 pA | Range −16 to −690 pA |
Additional files
Download links
A two-part list of links to download the article, or parts of the article, in various formats.
Downloads (link to download the article as PDF)
Open citations (links to open the citations from this article in various online reference manager services)
Cite this article (links to download the citations from this article in formats compatible with various reference manager tools)
Enhanced functional detection of synaptic calcium-permeable AMPA receptors using intracellular NASPM
eLife 12:e66765.
https://doi.org/10.7554/eLife.66765


