A DARPin-based molecular toolset to probe gephyrin and inhibitory synapse biology
- Institute of Pharmacology and Toxicology, University of Zurich, Switzerland
- Functional Genomics Centre, University of Zurich, Switzerland
- Department of Biochemistry, University of Zurich, Switzerland
Figures
Figure 1 with 2 supplements
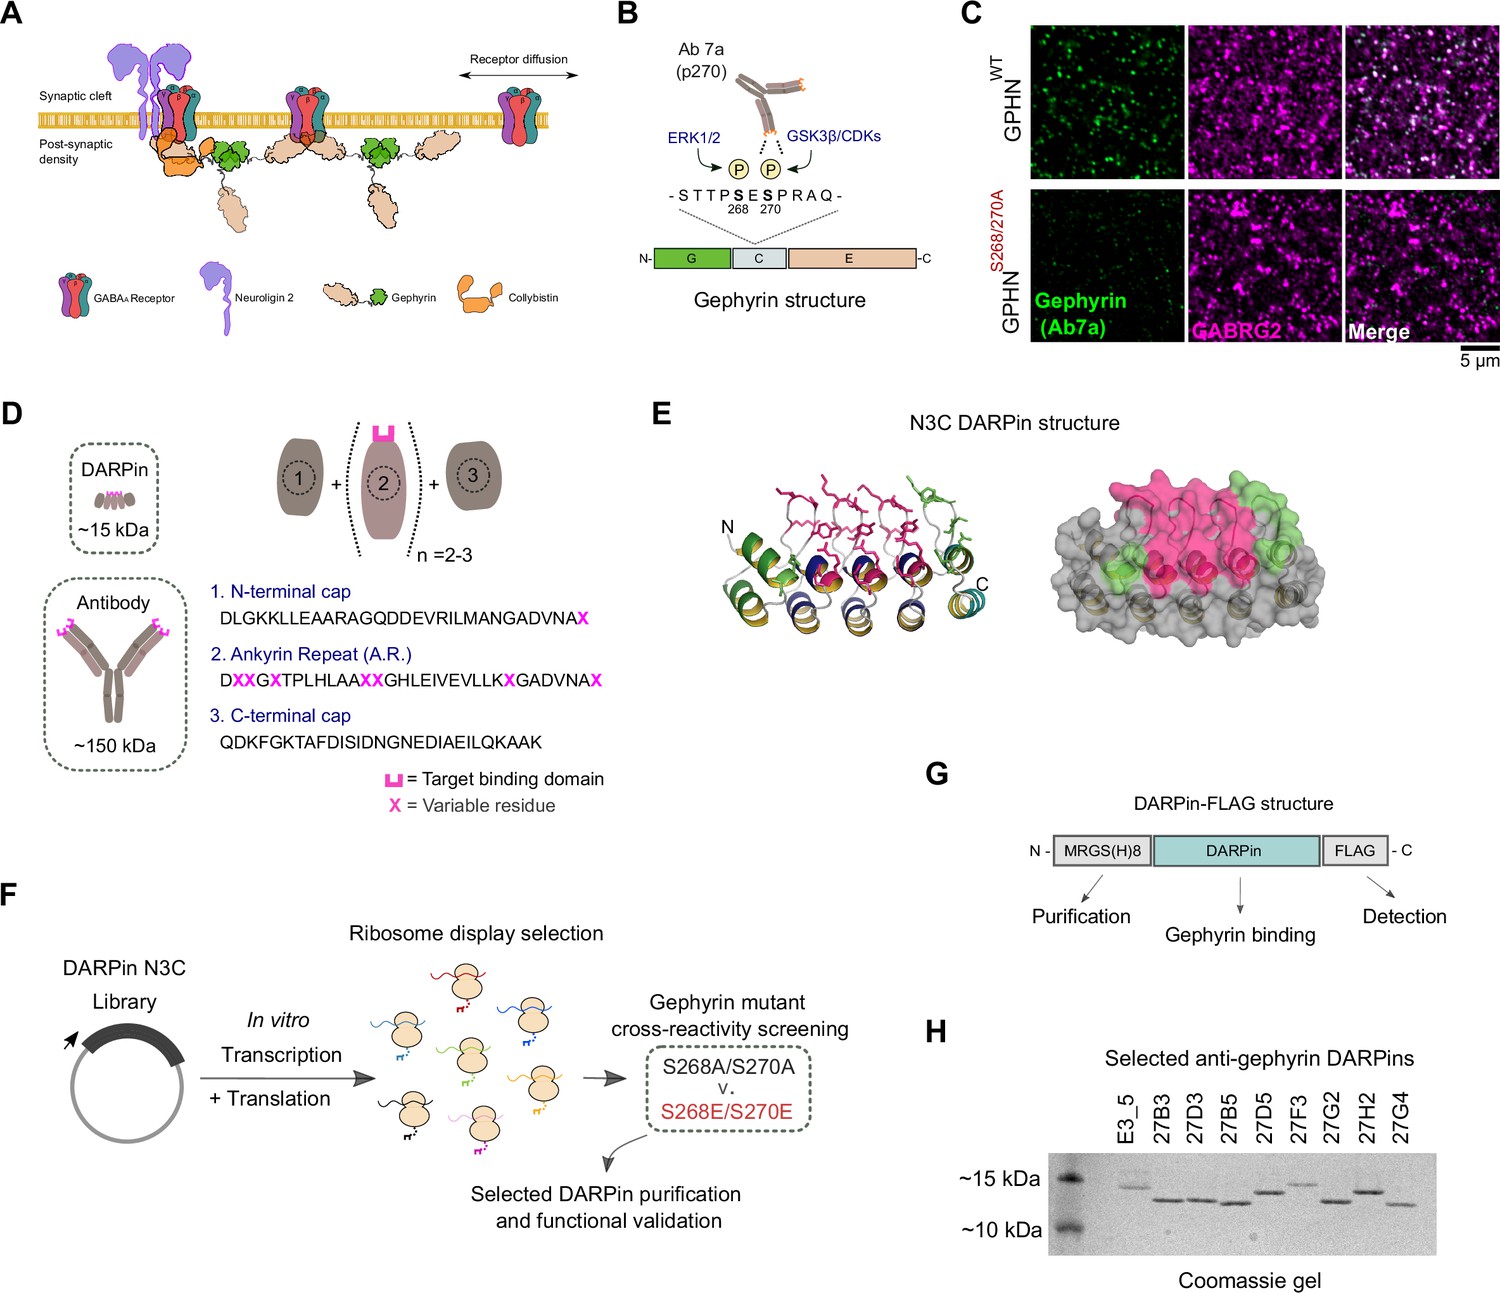
In vitro selection and generation of anti-gephyrin DARPins.
(A) Diagram of gephyrin function at the inhibitory postsynapse via its scaffolding role. (B) Gephyrin domain structure and location of key phosphoserine residues S268 and S270, the commonly used antibody clone for detection of gephyrin (Ab7a) is phospho-S270-specific. (C) The antibody Ab7a does not detect gephyrin clusters colocalized with the γ2 GABAA receptor subunit (GABRG2) in a phospho-null mouse model where S268 and S270 are mutated to alanines. (D) DARPins are an order of magnitude smaller than conventional antibodies and achieve target binding specificity by varying the sequence of ankyrin repeats (A.R.) with variable residues (magenta). (E) DARPin library design, with residues in magenta randomized in the original design and additional residues randomized in the caps (green). An N3C structure is shown with the N-terminal cap as a green ribbon and the C-terminal cap as a cyan ribbon with green side chains. (F) Schematic of anti-gephyrin DARPin selection and screening. (G) Structure of DARPin-FLAG clones used for initial validation experiments contain an N-terminal His8 tag and C-terminal FLAG tag for purification and detection, respectively. (H) Coomassie-stained gel of the nonbinding control (E3_5) and eight anti-gephyrin DARPin binders.
-
Figure 1—source data 1
Raw image and annotated uncropped Coomassie gel from Figure 1H.
- https://cdn.elifesciences.org/articles/80895/elife-80895-fig1-data1-v3.pdf
Figure 1—figure supplement 1
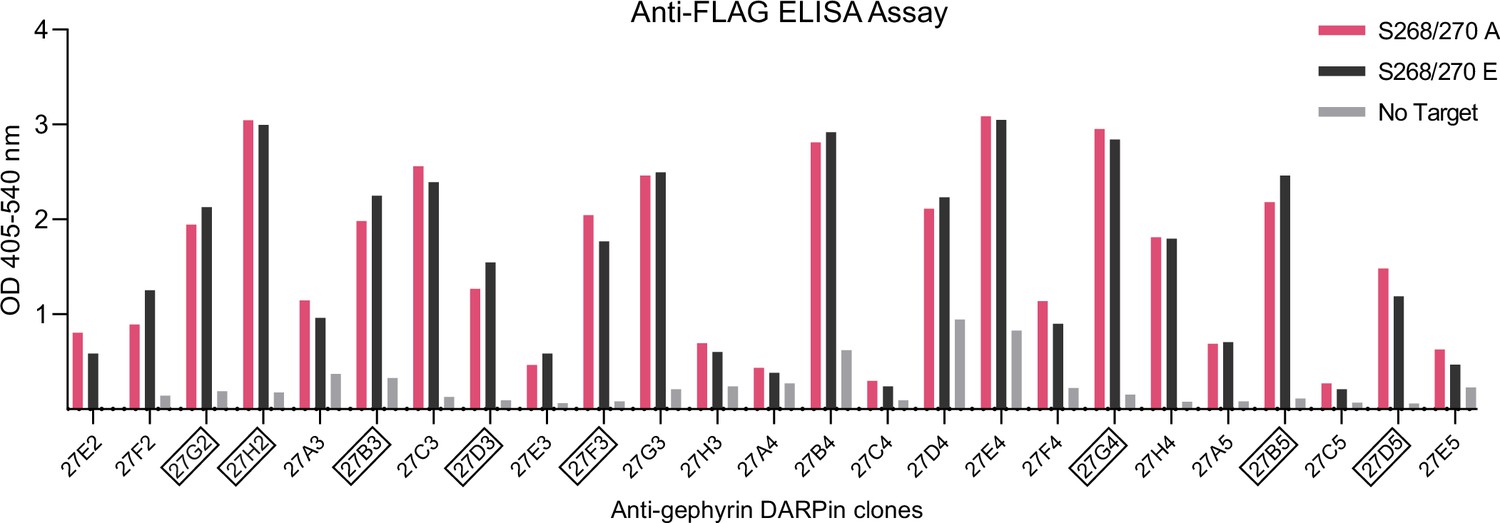
ELISA binding evaluation of anti-gephyrin DARPins.
Anti-FLAG ELISA binding assay results indicating DARPin binding to phospho-null and phospho-mimetic gephyrin for 25 sequenced clones from a ribosome display-based DARPin binder selection. DARPin clones characterized further in this study are indicated in boxes.
Figure 1—figure supplement 2
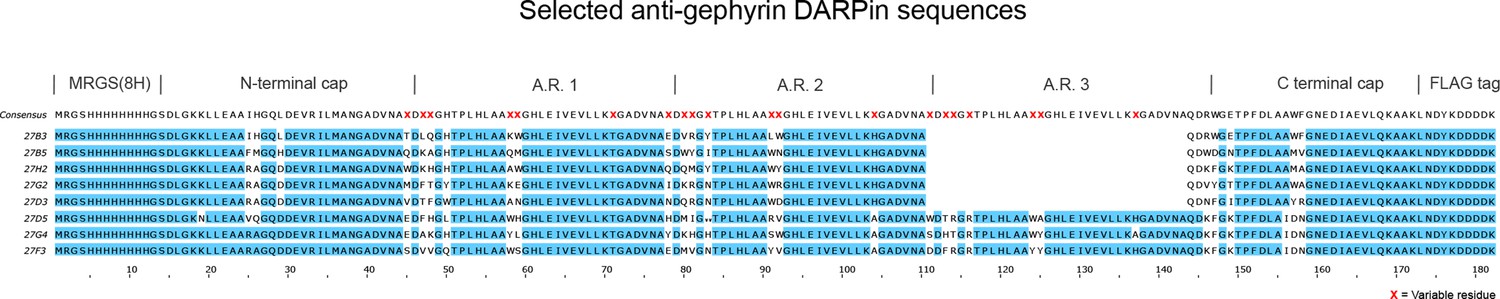
Sequence alignment of characterized anti-gephyrin DARPins.
Aligned sequences of anti-gephyrin DARPins characterized in detail in this study, containing two or three randomized ankyrin repeats (A.R.). The consensus DARPin sequence is indicated above with randomized residues indicated by a red X. See Supplementary file 1 for both DNA and protein sequences.
Figure 2 with 1 supplement
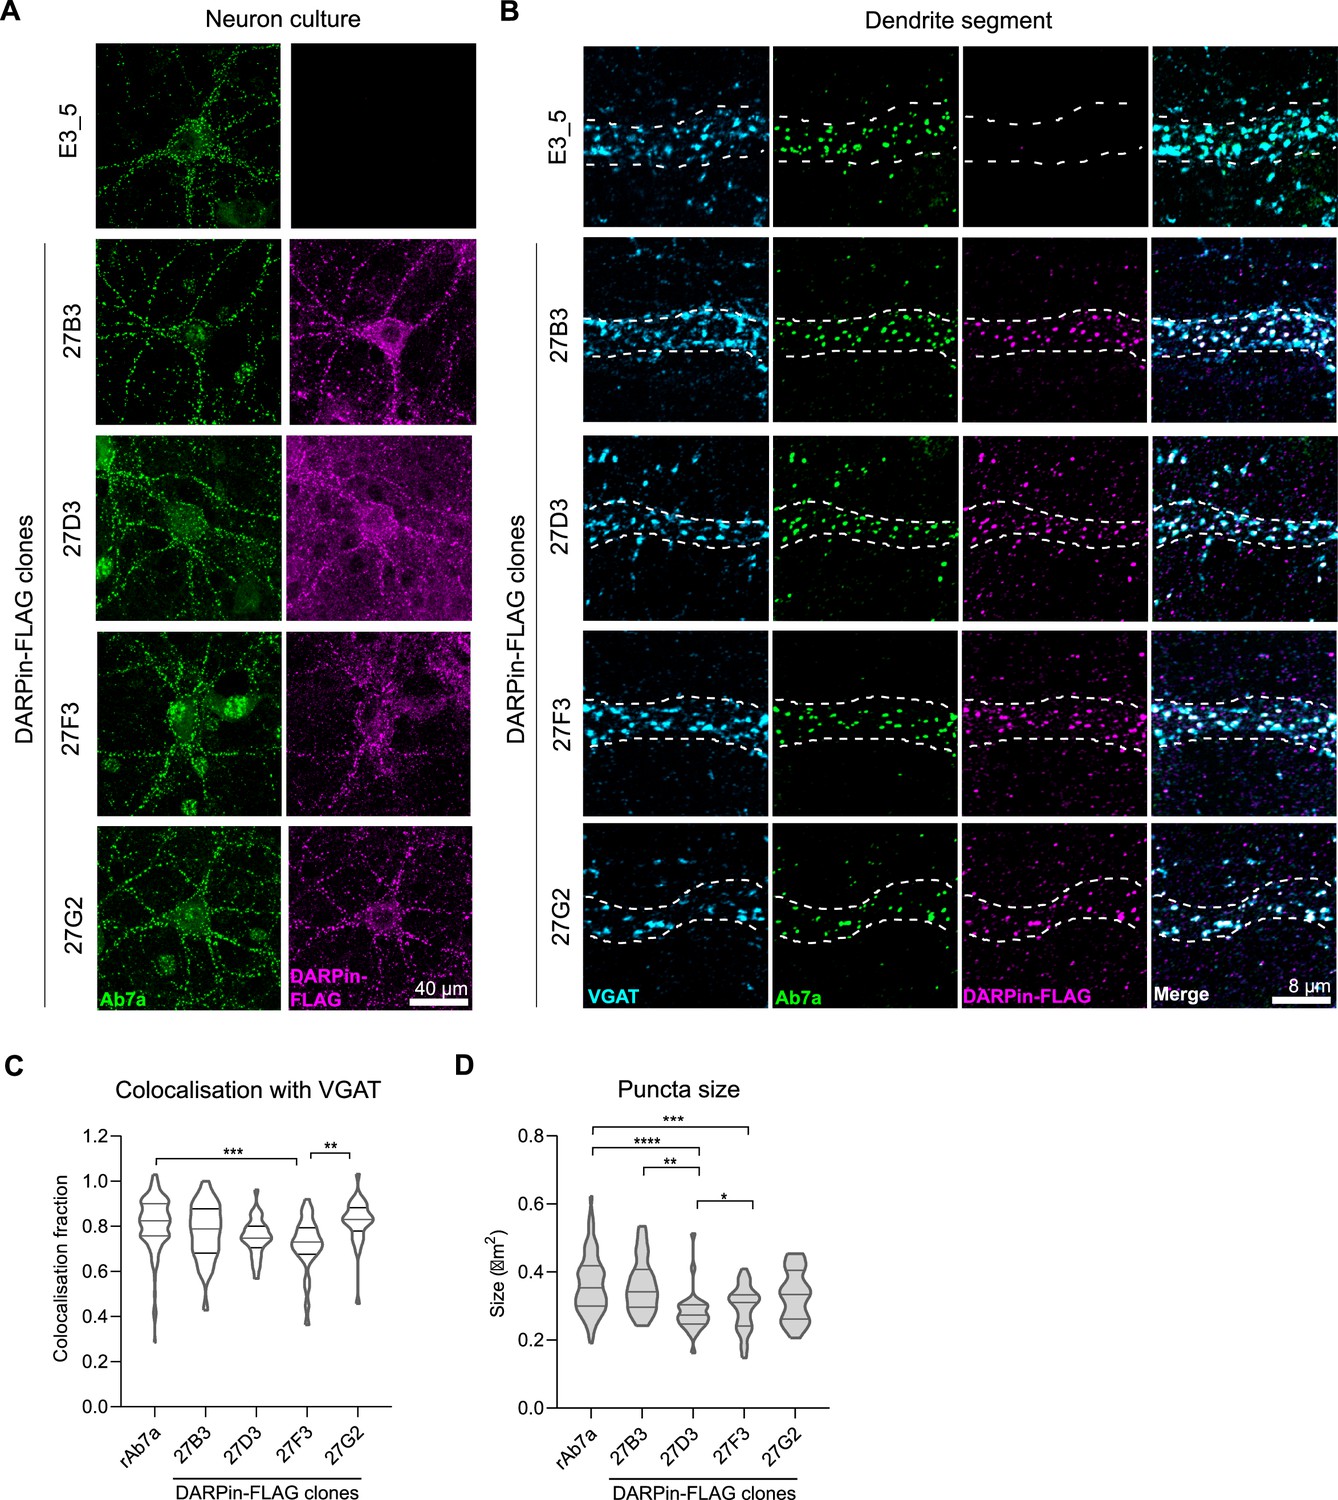
Anti-gephyrin DARPins specifically label gephyrin at inhibitory postsynaptic sites.
Native gephyrin in fixed hippocampal neuron cultures (DIV15) probed using DARPin-FLAG clones, subsequently detected with anti-FLAG antibodies, and compared to staining with commercial anti-gephyrin antibody clone Ab7a. (A) Representative images of DARPin-FLAG clones 27B3, 27D3, 27F3, and 27G2 gephyrin puncta colocalized to Ab7a signal compared to the control DARPin E3_5. (B) Higher-magnification images of dendrite segments showing detected DARPin-FLAG signal colocalized with presynaptic VGAT. (C) Colocalization analysis indicating the fraction of gephyrin puncta that colocalize with VGAT along a proximal dendrite segment (>30 neurons/group pooled across three experiments). (D) Average puncta size identified by antibody Ab7a or DARPin-FLAG clones averaged by cell (pooled across neurons, >1100 synapses/group pooled across three experiment). Statistics: (C, D) one-way ANOVA, Tukey’s post-hoc test comparing all groups ****p<0.0001, ***p<0.0005, **p<0.005, *p<0.05.
-
Figure 2—source data 1
Data and statistical analysis to generate the violin plot in Figure 2C and D.
- https://cdn.elifesciences.org/articles/80895/elife-80895-fig2-data1-v3.xlsx
Figure 2—figure supplement 1
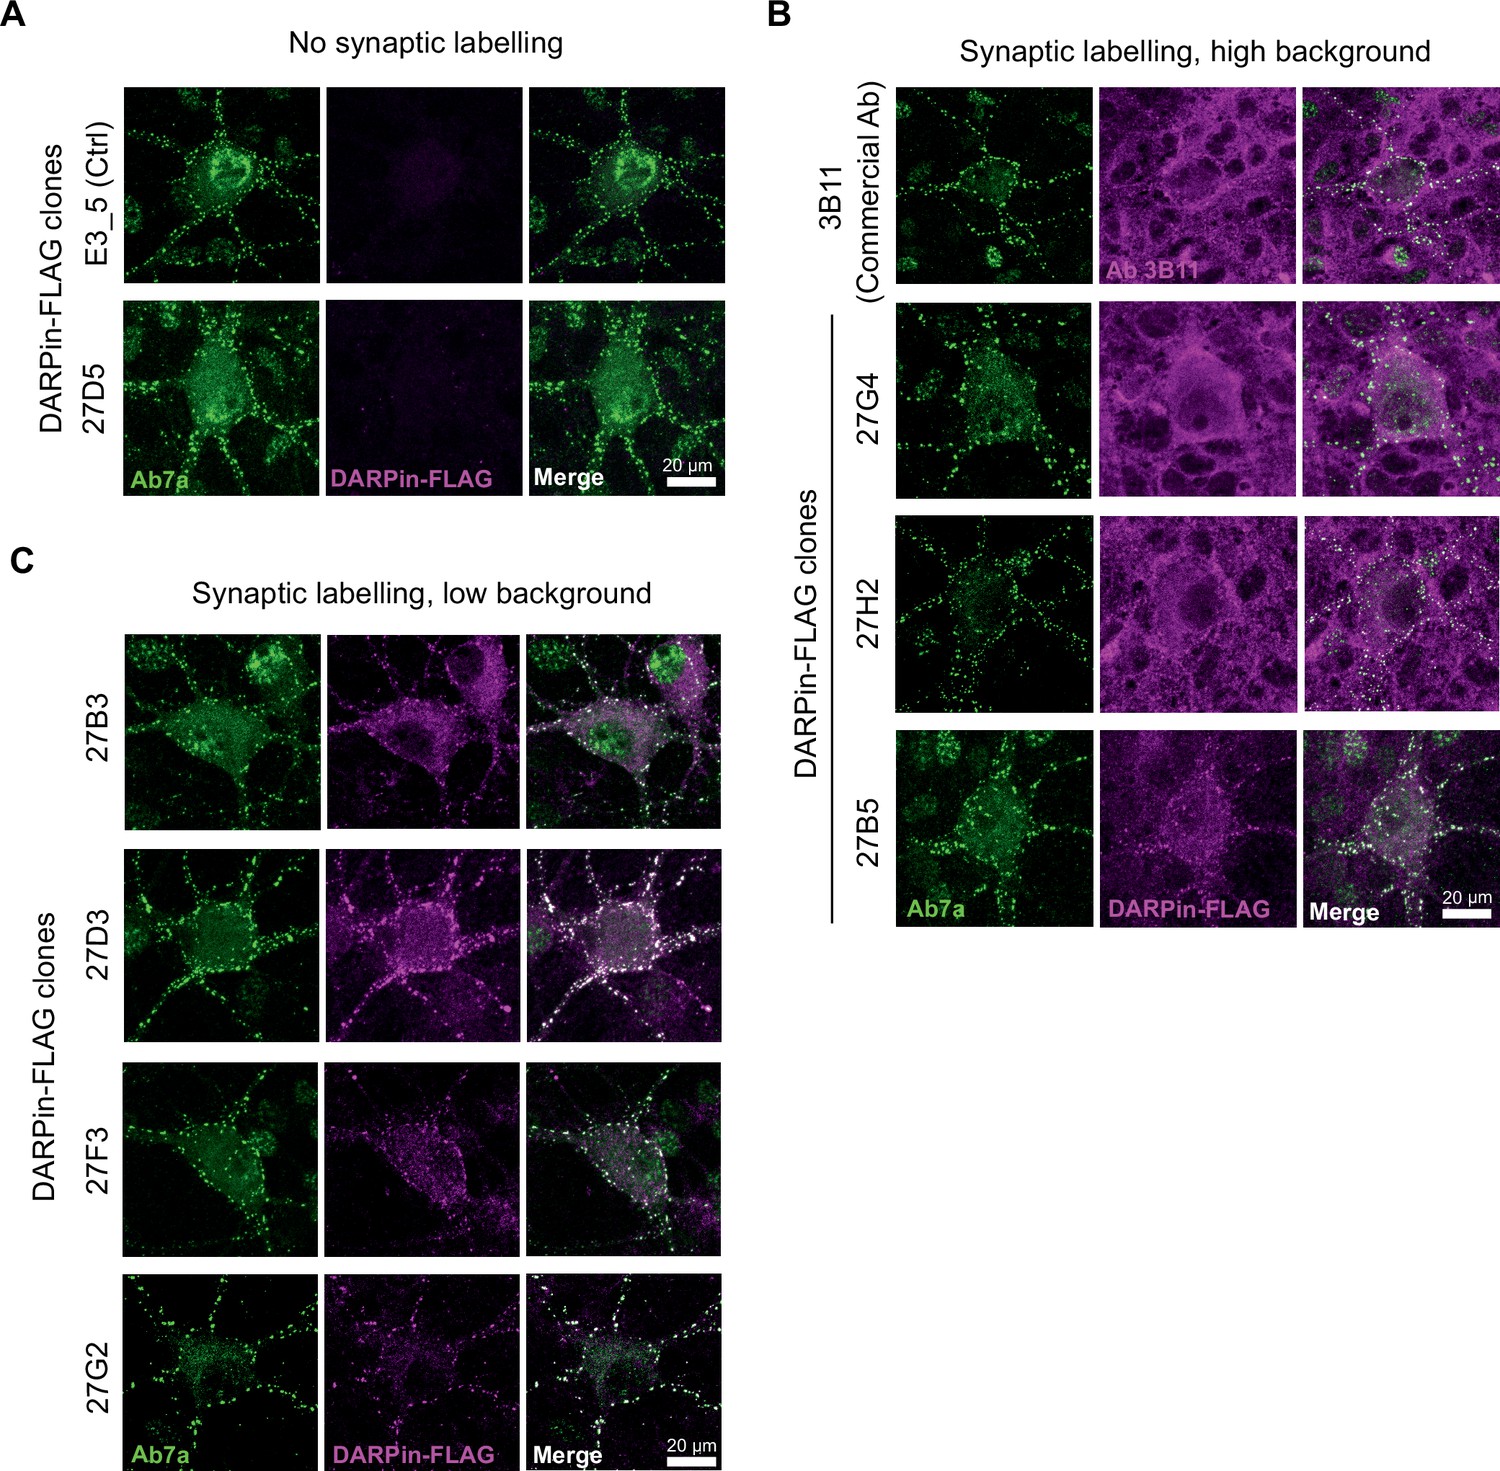
Morphological characterization of DARPin-FLAG labeling in hippocampal neuron culture.
Fixed embryonic E17 rat hippocampal neuron cultures (DIV15) were stained using DARPin-FLAG clones and subsequently detected with anti-FLAG antibodies and compared to staining with commercial anti-gephyrin antibody clone Ab7a or 3B11. (A) DARPin-FLAG control (E3_5) and clone 27D5 with no synaptic labeling. (B) DARPin-FLAG clones and antibody 3B11 that demonstrate high background labeling. (C) DARPin-FLAG clones with highly specific inhibitory synapse labeling.
Figure 3 with 5 supplements
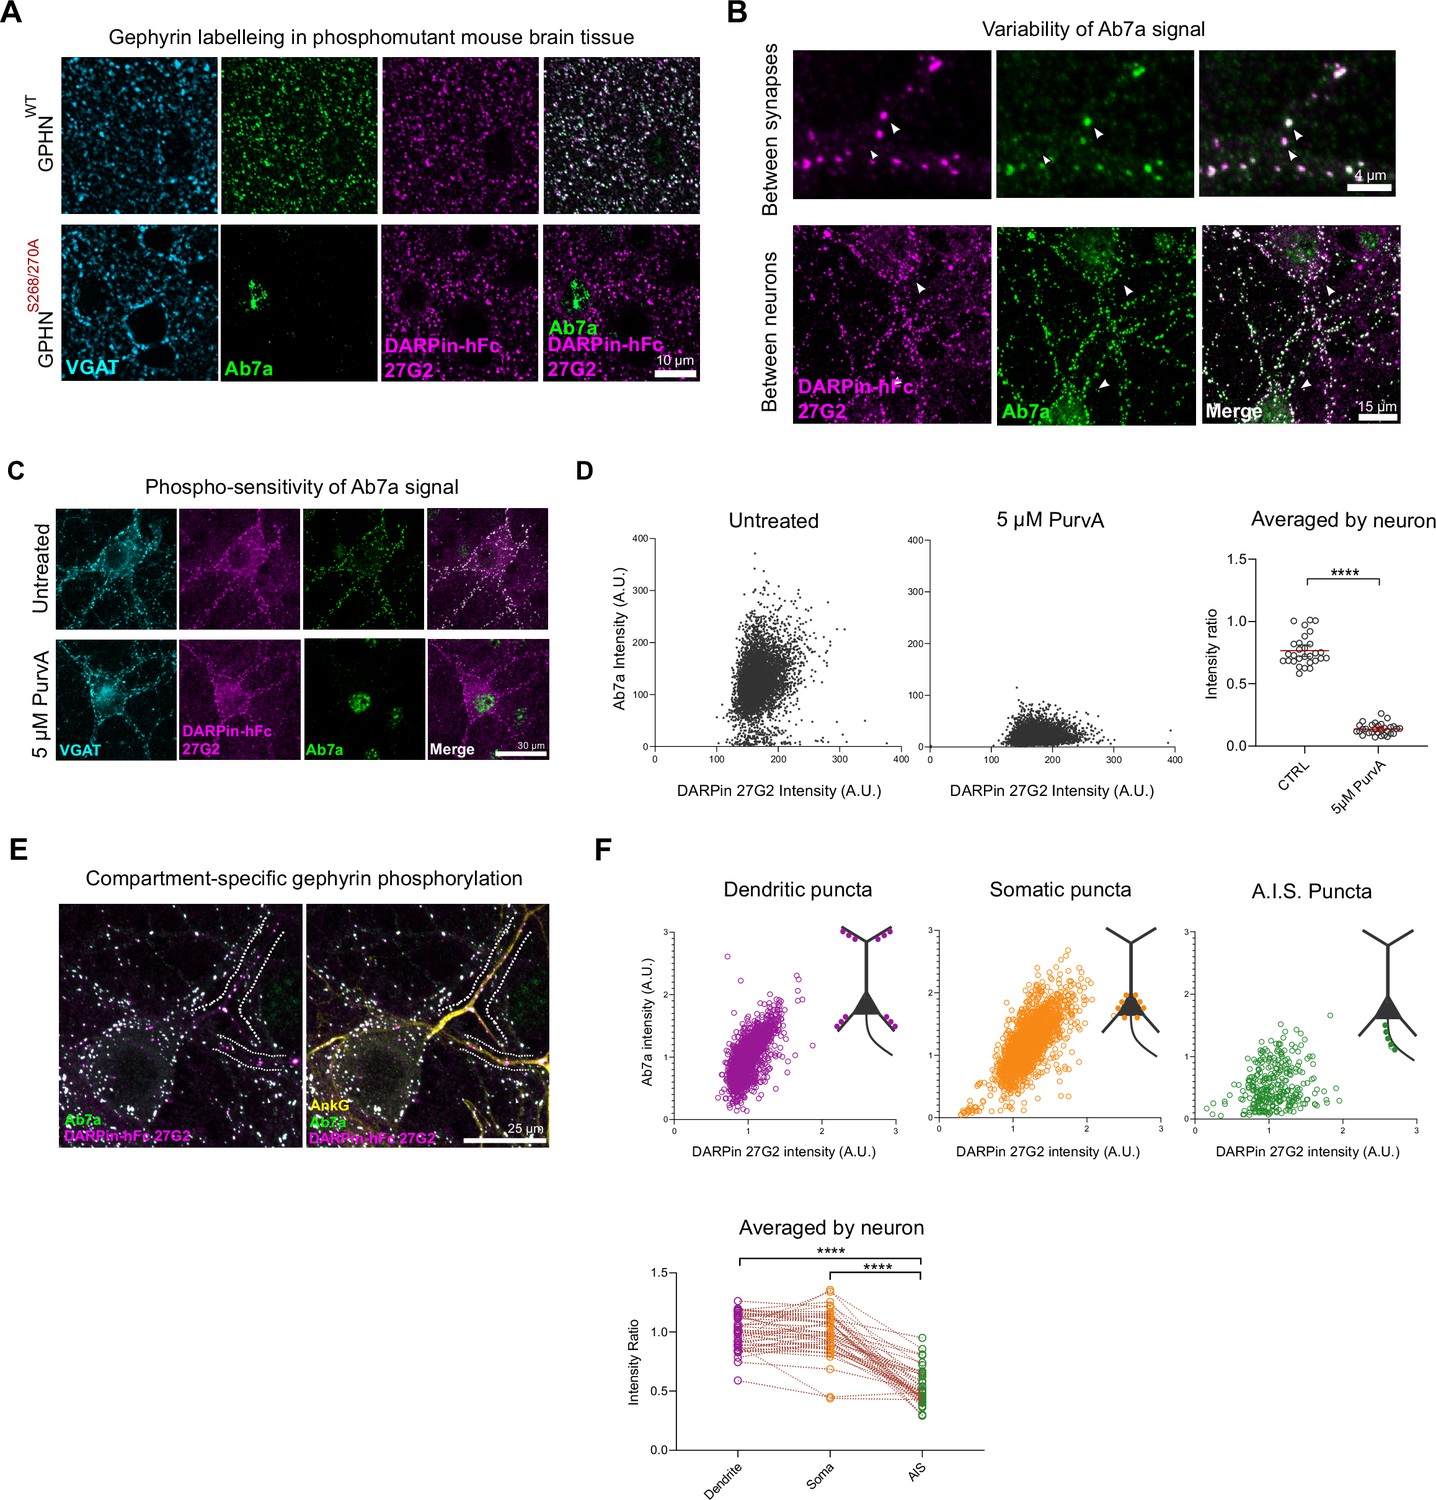
Phospho S270-insensitive DARPin-hFc 27G2 multiplexed with antibody Ab7a can assess synapse-specific gephyrin S270 phosphorylation.
(A) Representative images of DARPin-hFc 27G2 (but not antibody Ab7a) labeling gephyrin puncta in both wildype (WT) and phospho-mutant gephyrin S268A/S270A mutant mouse brain tissue (somatosensory cortex layer 2/3). (B) Representative images from hippocampal neuron culture showing the relative Ab7a signal (indicating S270 phosphorylation) varies by synapse and between neurons. (C) Representative image showing DARPin-hFc 27G2 binding at synaptic puncta in primary hippocampal neuron culture is preserved after inhibition of CDKs following 24 hr treatment with 5 µM aminopurvalanol (PurvA) while Ab7a staining is severely reduced. (D) The relative fluorescence intensity at individual synapses (pooled from 30 neurons per group) showing a pronounced decrease in the average Ab7a/DARPin-hFc 27G2 intensity ratio. Quantification of Ab7a/DARPin-hFc 27G2 fluorescence signal averaged across cells pooled from three independent experiments, n = 30 cells/group. (E) Representative images of hippocampal neuron culture used for quantification of relative Ab7a/DARPin-hFc labeling of clusters on the soma, proximal dendrites, or the axon-initial segment (A.I.S.) (AnkG). (F) Ab7a/DARPin intensity ratio of individual synapses pooled from 45 cells over three independent experiments showing a decrease in A.I.S. cluster Ab7a staining. Lower: quantification indicates significantly reduced A.I.S. Ab7a labeling of clusters compared to dendritic or somatic compartments. Statistics: (D) one-way ANOVA; (F) repeated-measures one-way ANOVA. All panels: *p<0.05, **p<0.01, ***p<0.001, ****p<0.0001. Mean and SD are presented.
-
Figure 3—source data 1
Values and statistical results used to generate Figure 3D and F.
- https://cdn.elifesciences.org/articles/80895/elife-80895-fig3-data1-v3.xlsx
Figure 3—figure supplement 1
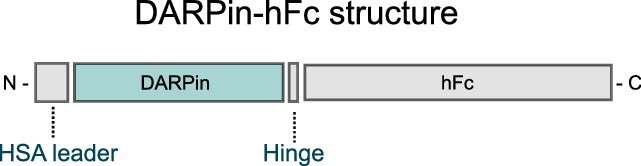
Structure of DARPin-hFc 27G2.
DARPin clones were inserted into a construct containing an N-terminal HSA leader sequence for mammalian recombinant expression and a C-terminal hFc tag for detection with secondary antibodies.
Figure 3—figure supplement 2
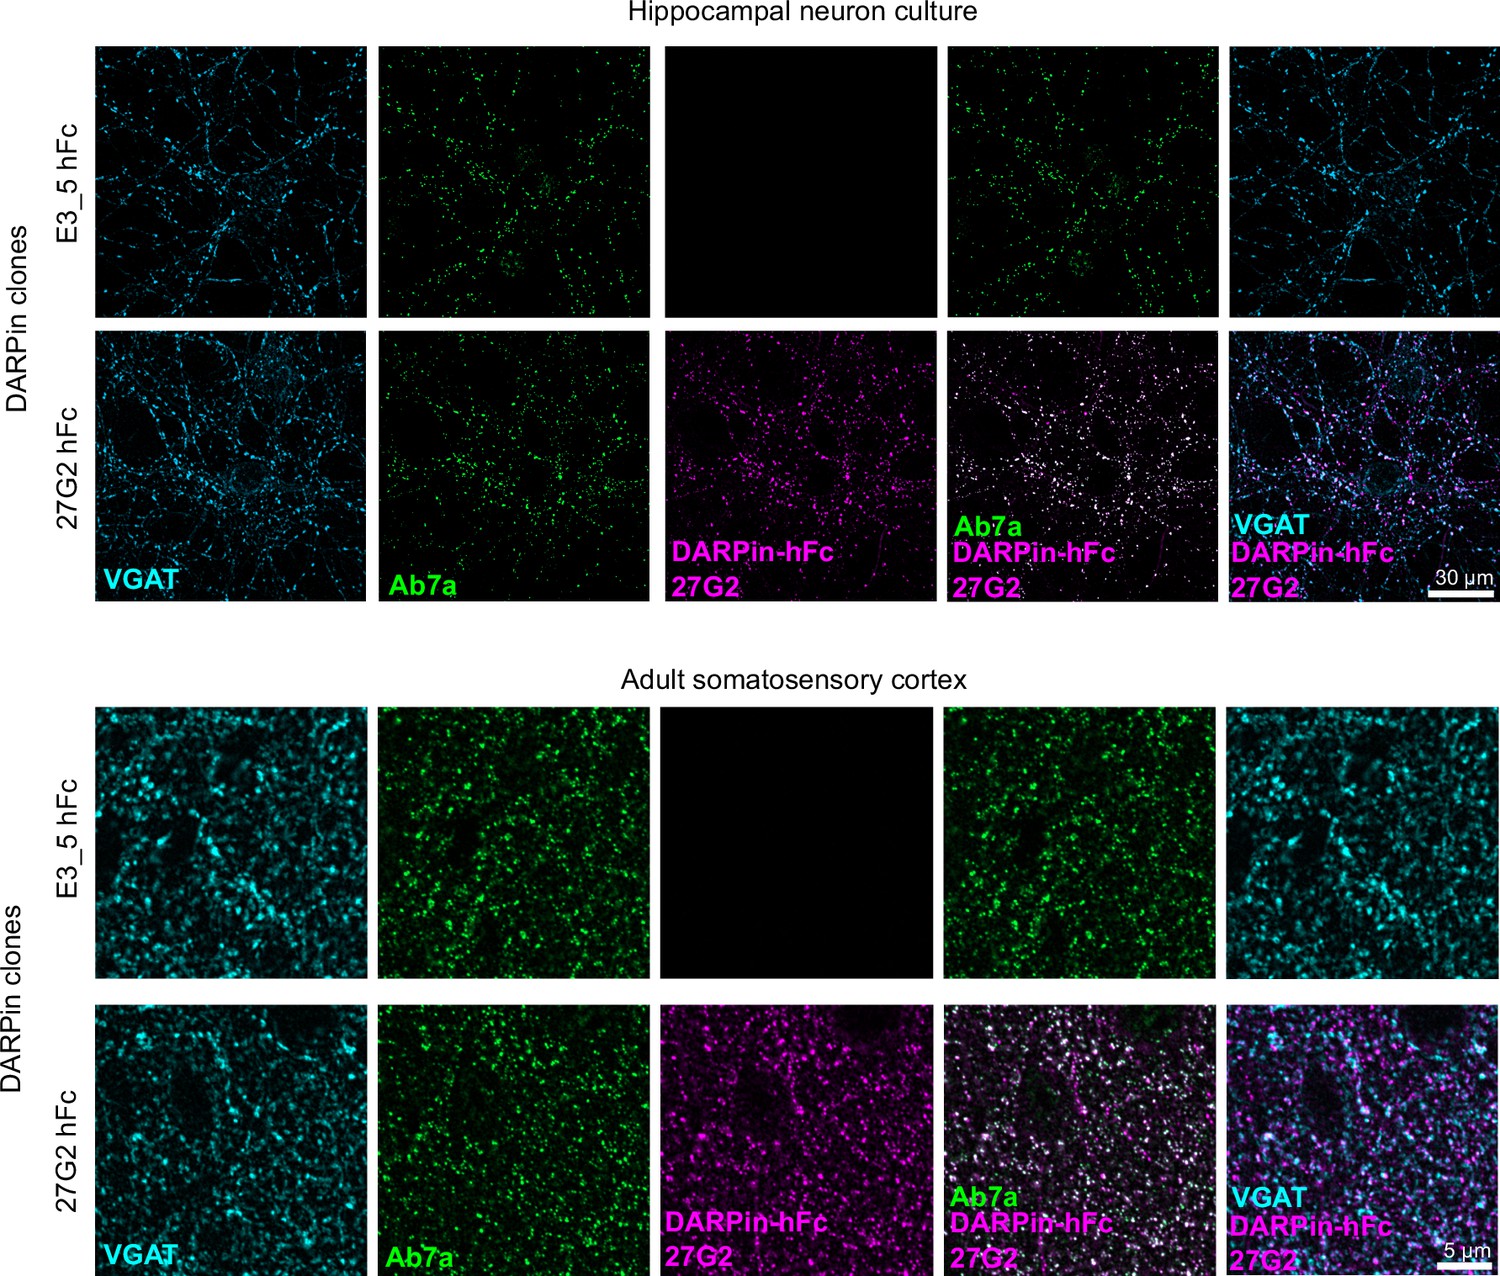
Validation of DARPin-hFc 27G2 for immunostaining.
Anti-gephyrin DARPin-hFc 27G2 labels postsynaptic gephyrin puncta in hippocampal neuron culture and adult brain tissue (layer 2/3 somatosensory cortex).
Figure 3—figure supplement 3
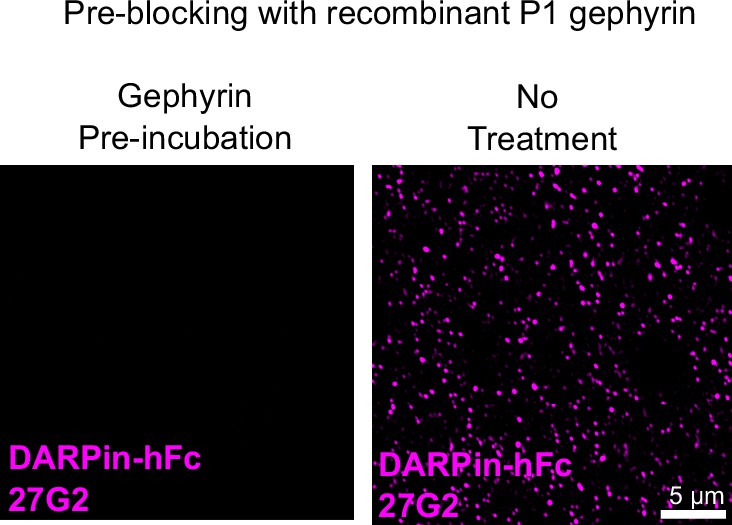
Competition with recombinant gephyrin reduces DARPin-hFc reactivity in tissue.
DARPin-hFc 27G2 cluster detection is blocked by incubation with molar excess of recombinant gephyrin indicating its specificity in tissue.
Figure 3—figure supplement 4
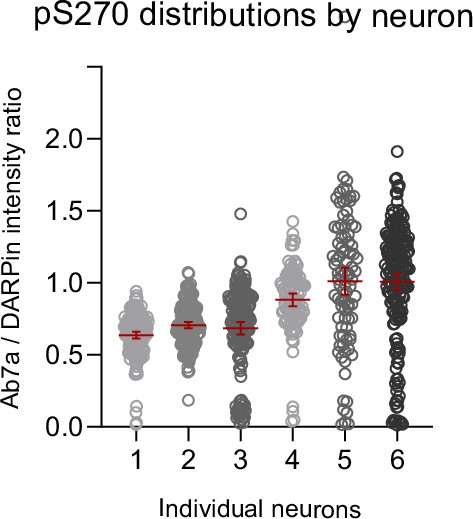
Variation in Ab7a reactivity.
The ratio of fluorescent intensity signal between pS270-specific antibody Ab7a and the phosphorylation nonspecific DARPin-hFc 27G2 indicates that Ab7a labeling is variable between clusters within and between individual synapses and neurons. Each data represents one cluster analyzed from six individual example neurons with different patterns of relative Ab7a reactivity. Median and SD are indicated in red.
-
Figure 3—figure supplement 4—source data 1
Values used to plot Figure 3—figure supplement 4.
- https://cdn.elifesciences.org/articles/80895/elife-80895-fig3-figsupp4-data1-v3.xlsx
Figure 3—figure supplement 5
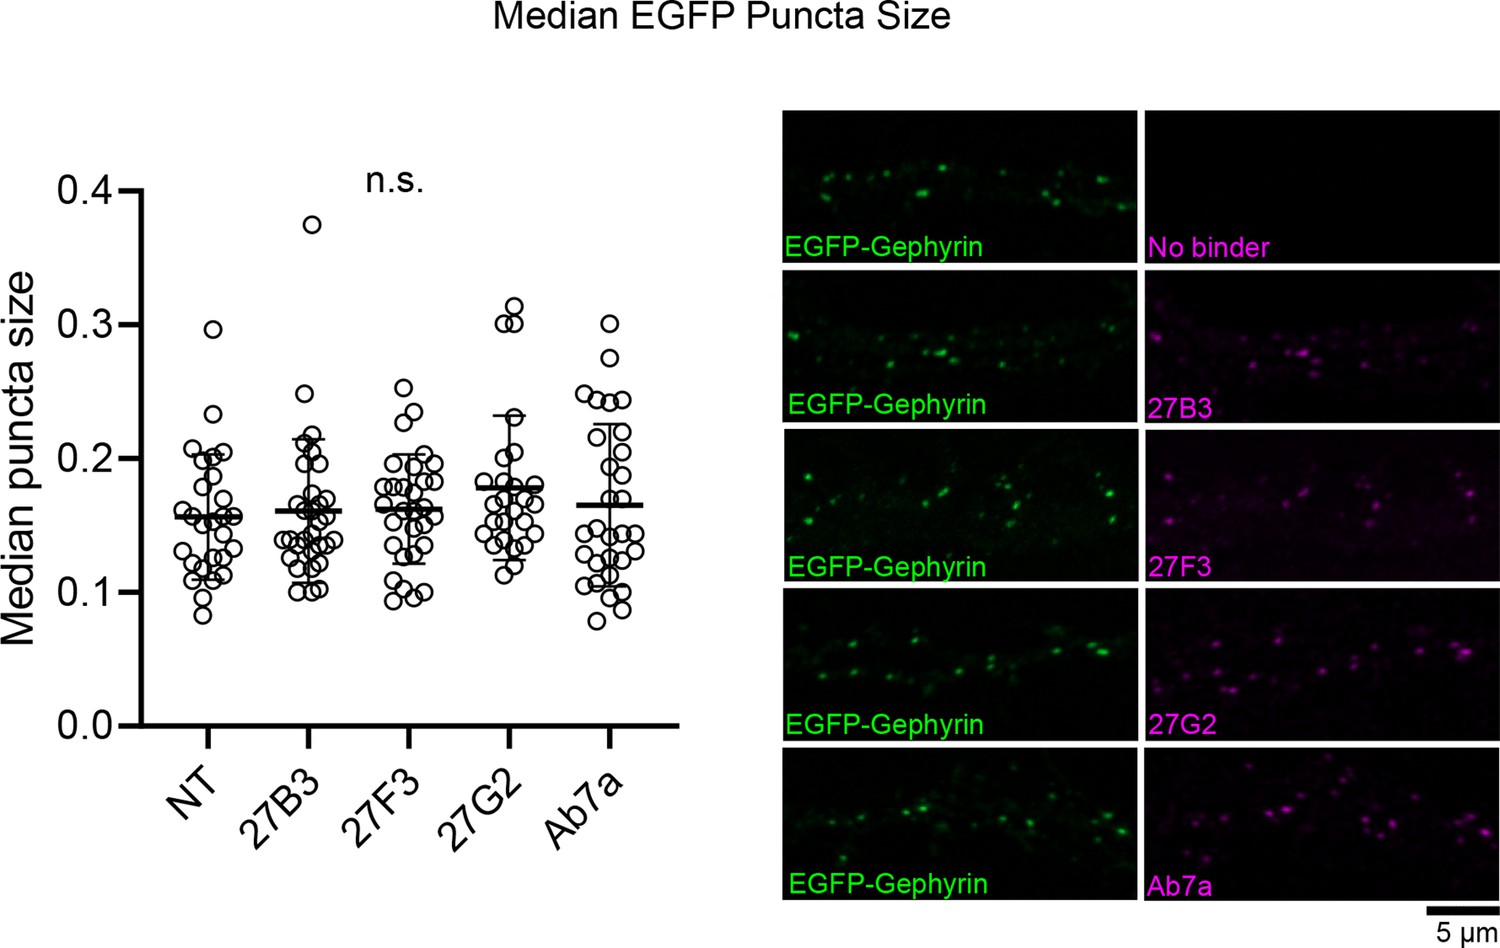
Anti-gephyrin binders do not alter EGFP gephyrin cluster size.
Embryonic E17 rat hippocampal neuron cultures were transfected with plasmid expressing EGFP-gephyrin at days in vitro (DIV) 8 and were fixed and stained using DARPin-hFc clones, antibody Ab7a, or no binder at DIV 15 and analyzed for EGFP-gephyrin cluster size along the principle dendrite. Median puncta size averaged by principal dendrite are presented from 6 to 10 neurons pooled across three independent experiments per group. Statistics: One-way ANOVA, n.s., no significant difference.
-
Figure 3—figure supplement 5—source data 1
Values and statistical analysis used to plot Figure 3—figure supplement 5.
- https://cdn.elifesciences.org/articles/80895/elife-80895-fig3-figsupp5-data1-v3.pdf
Figure 4 with 1 supplement
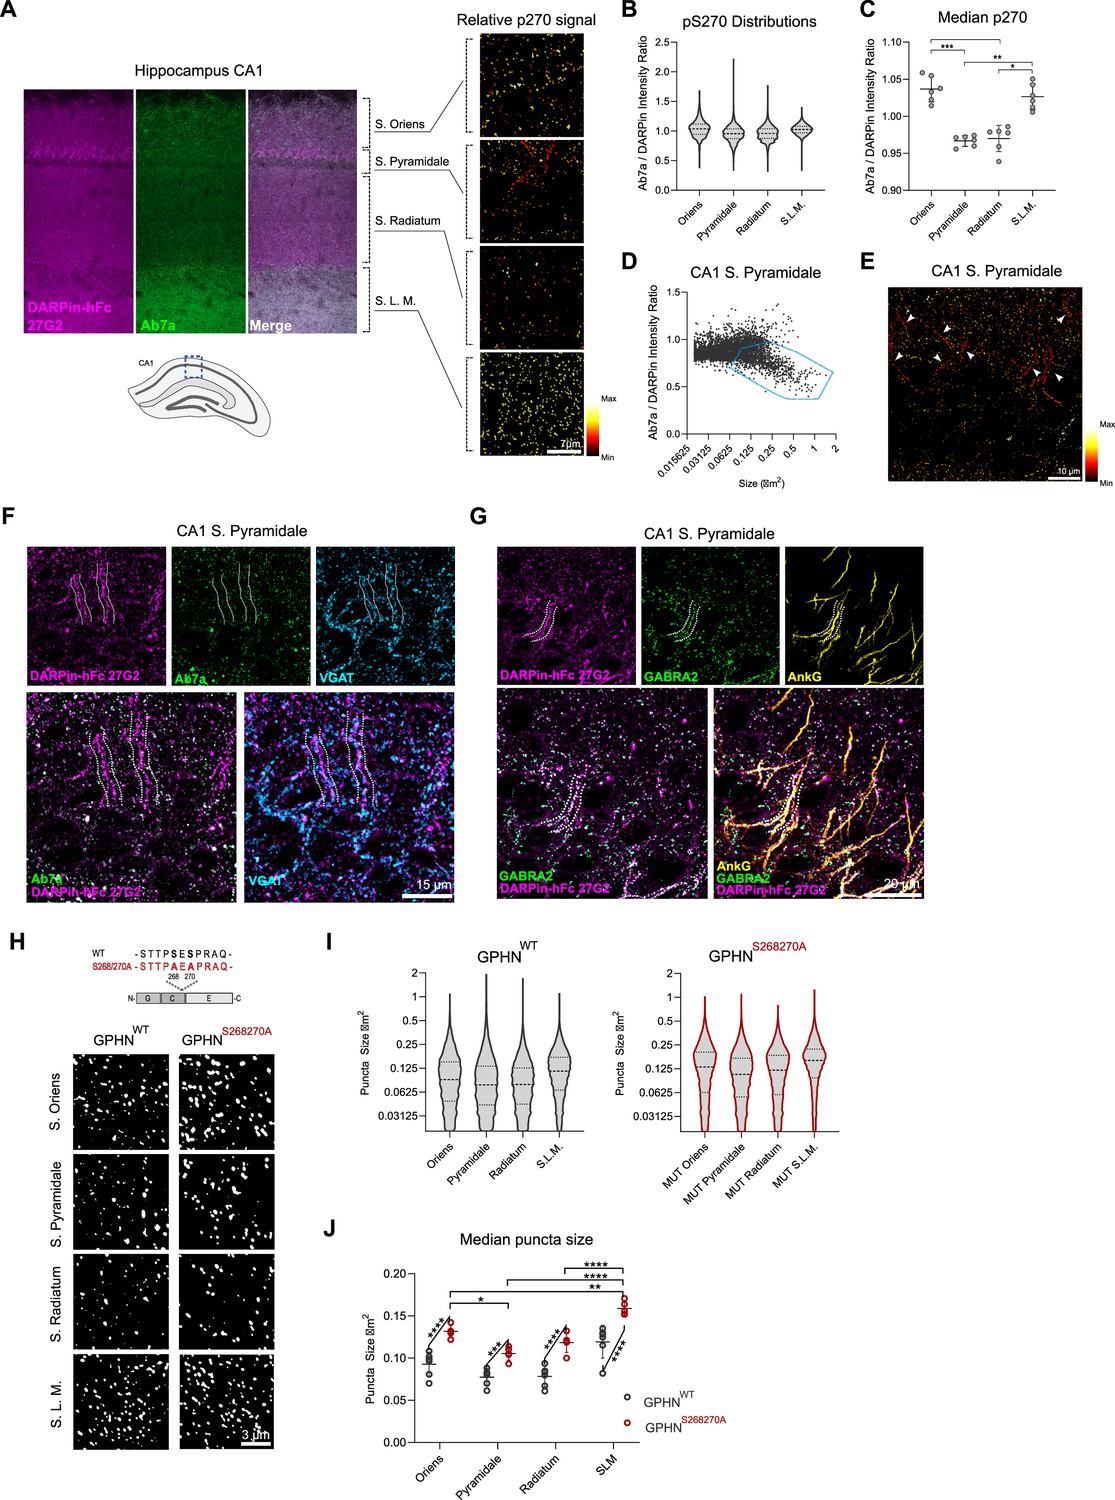
DARPin-hFc 27G2 labeling of gephyrin clusters demonstrates laminar and axon-initial segment (A.I.S.)-specific S270 phosphorylation and phosphorylation-dependent cluster size regulation.
(A) Left: the relative Ab7a to DARPin-hFc 27G2 fluorescence intensity in the mouse hippocampus area CA1 shows layer-specific variability. Right: colorized gephyrin puncta indicating relative S270 phosphorylation as seen from hotter (more red/yellow) coloration. (B) Distribution of relative gephyrin phosphorylated at S270 (p270) at puncta between hippocampal lamina. Data pooled between six adult mice, three sections analyzed per mouse encompassing 14,000–47,000 gephyrin puncta per layer. (C) Analysis of the median relative gephyrin pS270 ratio between hippocampal layers (data pooled between sections per mouse, n = 6 mice quantified). (D) Example distribution of gephyrin pS270 signal by puncta size in the CA1 stratum pyramidale, with a population of large, hypophosphorylated clusters outlined. (E) Representative image of s. pyramidale with hot colors indicating gephyrin clusters with elevated phosphorylation; arrows indicate trains of large hypophosphorylated clusters. (F) Representative image showing large DARPin-identified gephyrin clusters apposed to presynaptic VGAT-containing terminals with corresponding low Ab7a antibody signal. (G) Representative image indicating gephyrin clusters on the A.I.S. (AnkG) colocalize with the α2 GABAA receptor subunit. (H) Representative images of gephyrin puncta identified using cluster analysis software in WT and S268A/S270A phospho-null mutant mice in the hippocampus using identical imaging parameters. (I) Violin plots indicating the distribution of gephyrin puncta sizes (14,000–47,000 puncta per group, pooled across 5–6 mice per group). (J) Analysis of the median puncta size between hippocampal layers and genotypes indicating larger gephyrin clusters in mutant mice. Statistics: (C) one-way ANOVA, (J) mixed-effects analysis comparing hippocampal lamina (horizontal bars) and genotypes (angled bars). All panels: *p<0.05, **p<0.01, ***p<0.001, ****p<0.0001. Median and SD are presented.
-
Figure 4—source data 1
Data and statistical analysis presented in Figure 4B–D, I, and J.
- https://cdn.elifesciences.org/articles/80895/elife-80895-fig4-data1-v3.xlsx
Figure 4—figure supplement 1
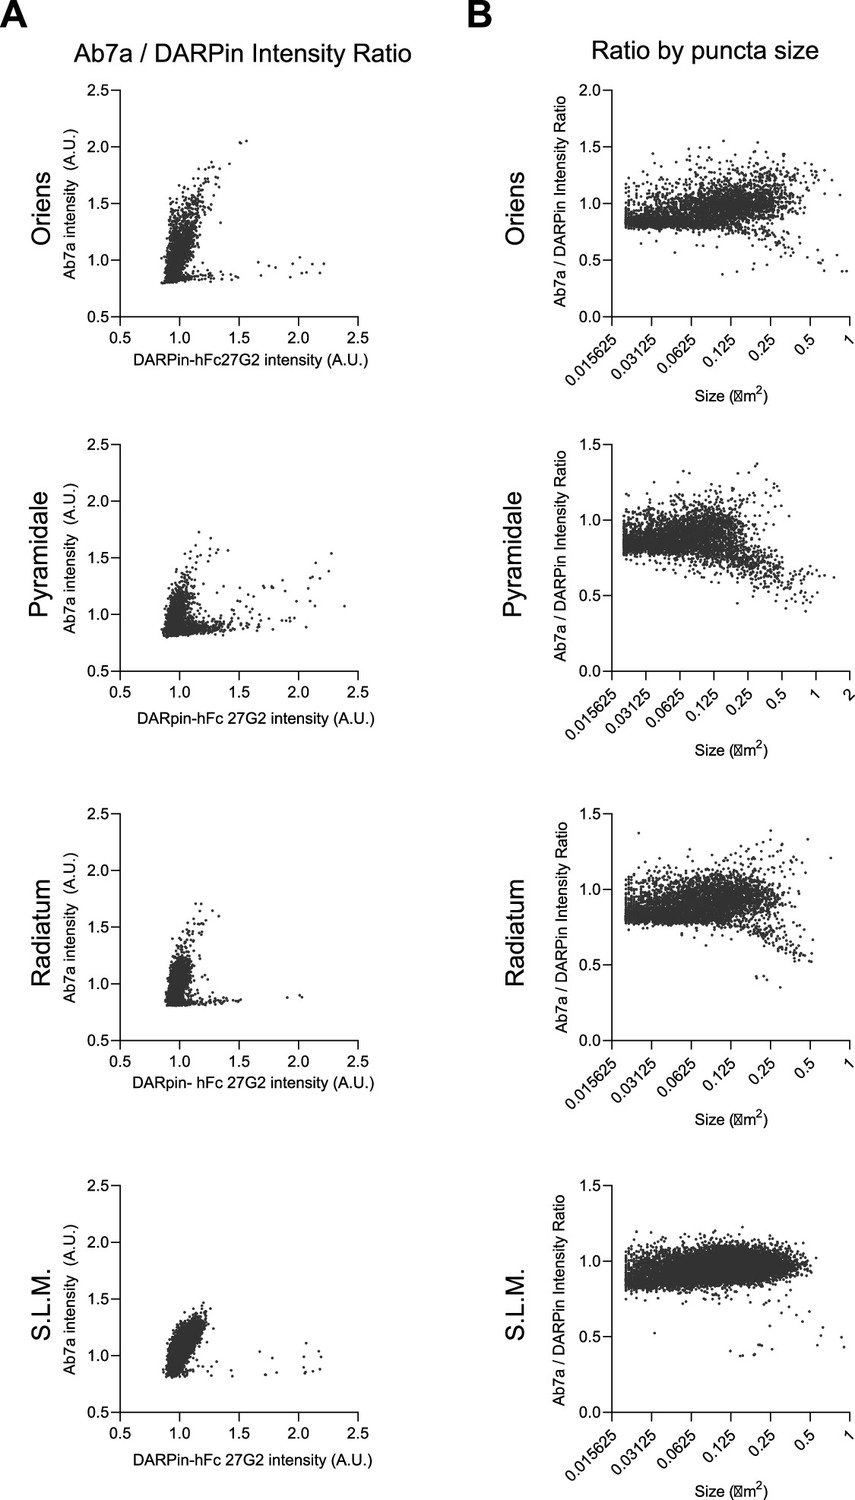
Relative pS270 synaptic distribution in the hippocampal CA1.
Extended example distribution of signal from adult brain tissue from Figure 4. including the s. oriens, pyramidale, radiatum, and stratum lacunosum moleculare (S.L.M.). (A) Ab7a versus DARPin-hFc 27G2 puncta intensity. (B) Ab7a/DARPin-hFc 27G2 intensity ratio plotted by puncta size.
-
Figure 4—figure supplement 1—source data 1
Data and statistical analysis presented in Figure 4—figure supplement 1A, B.
- https://cdn.elifesciences.org/articles/80895/elife-80895-fig4-figsupp1-data1-v3.xlsx
Figure 5 with 4 supplements
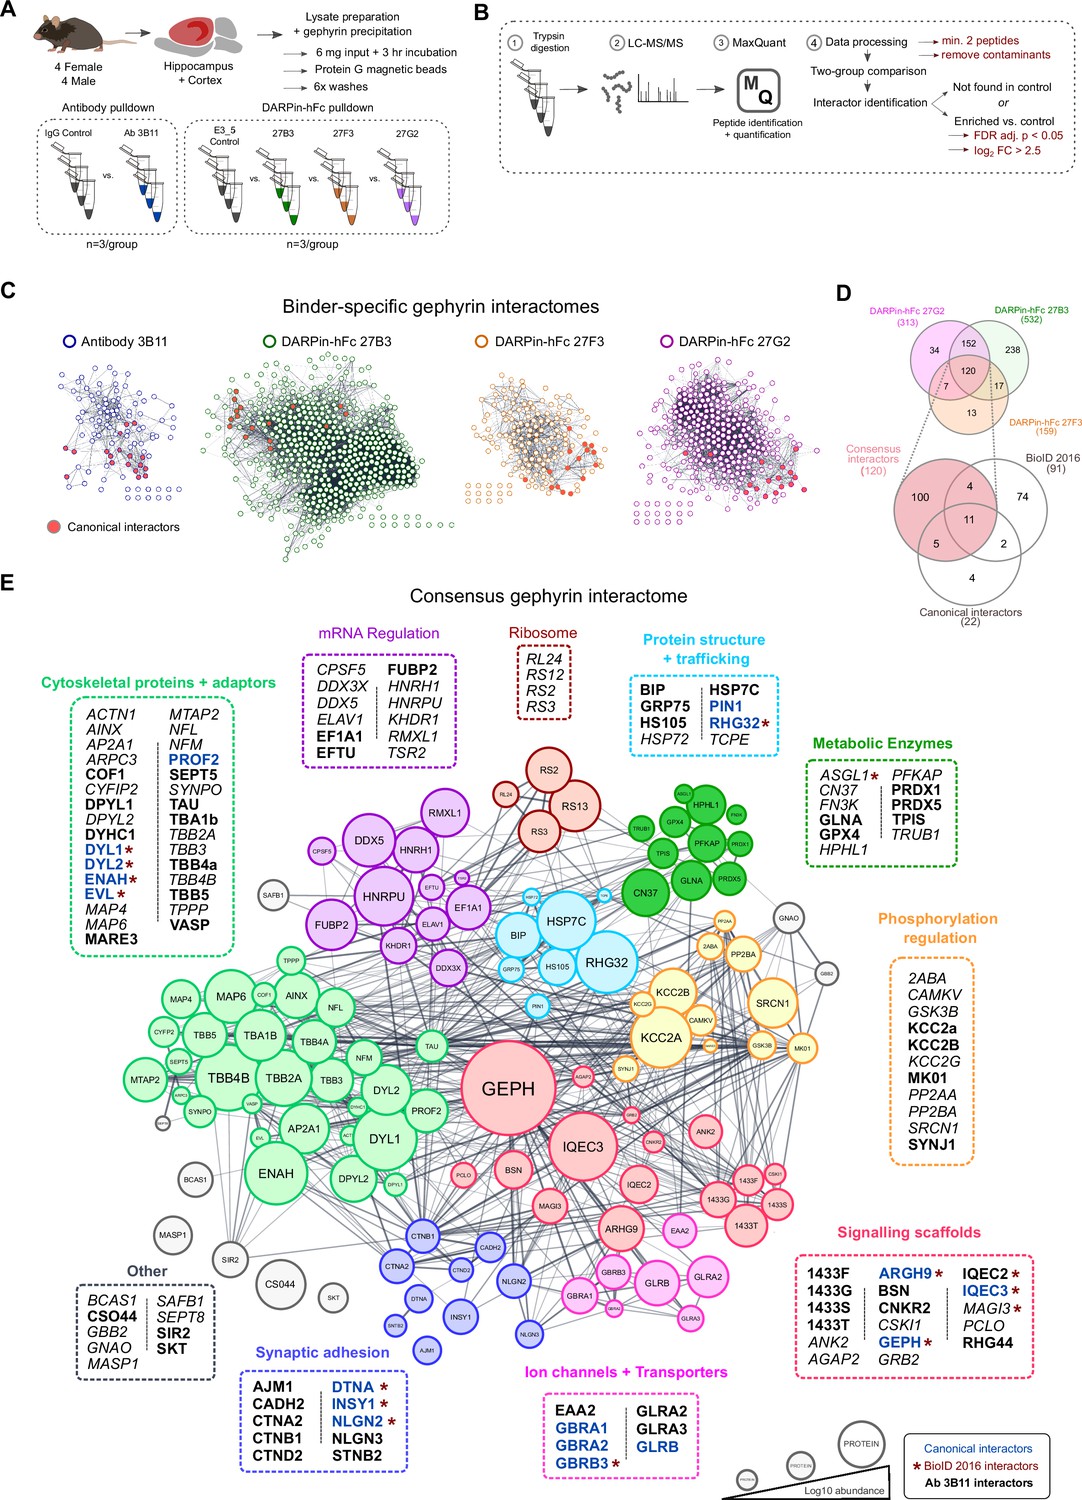
A DARPin-based consensus gephyrin interactome captures both known and novel protein interactors.
A) Mouse brain tissue lysate preparation diagram. (B) Liquid chromatography tandem mass spectrometry (LC-MS/MS) and interactome determination methodology workflow indicating thresholds for consideration of interacting proteins. (C) Scale-free interaction networks (STRING) of gephyrin interactors identified from pulldowns using the commercial antibody 3B11, or DARPin-hFc 27B3, 27F3, and 27G2 compared to control conditions (containing antibody control IgG or the control DARPin-hFc E3_5). Nodes represent unique gephyrin interactors – red nodes indicate known (canonical) gephyrin interactors. (D) Venn diagram of the overlap in identified interactors from gephyrin complexes isolated using different DARPin-hFc clones; bottom indicates coverage compared to an extensive gephyrin interactome determined using BioID labeling (Uezu et al., 2016) and 22 canonical gephyrin interactors identified from the literature. (E) Consensus interactome of proteins identified by all DARPin-hFc clones and colored by protein ontology. Canonical gephyrin interacting proteins are indicated by blue font, and bold font indicates interactors also identified by the antibody clone 3B11. Asterisks indicate proteins previously identified by BioID (Uezu et al., 2016). Italic font indicates interactors exclusively identified by DARPins. Edges connecting protein nodes indicate putative interactions (STRING analysis), and node circle size indicates relative protein abundance averaged across all experiments.
-
Figure 5—source data 1
List of interactors and relative abundance of detected proteins used to construct interaction networks and Venn diagrams in Figure 5C–E.
- https://cdn.elifesciences.org/articles/80895/elife-80895-fig5-data1-v3.xlsx
Figure 5—figure supplement 1
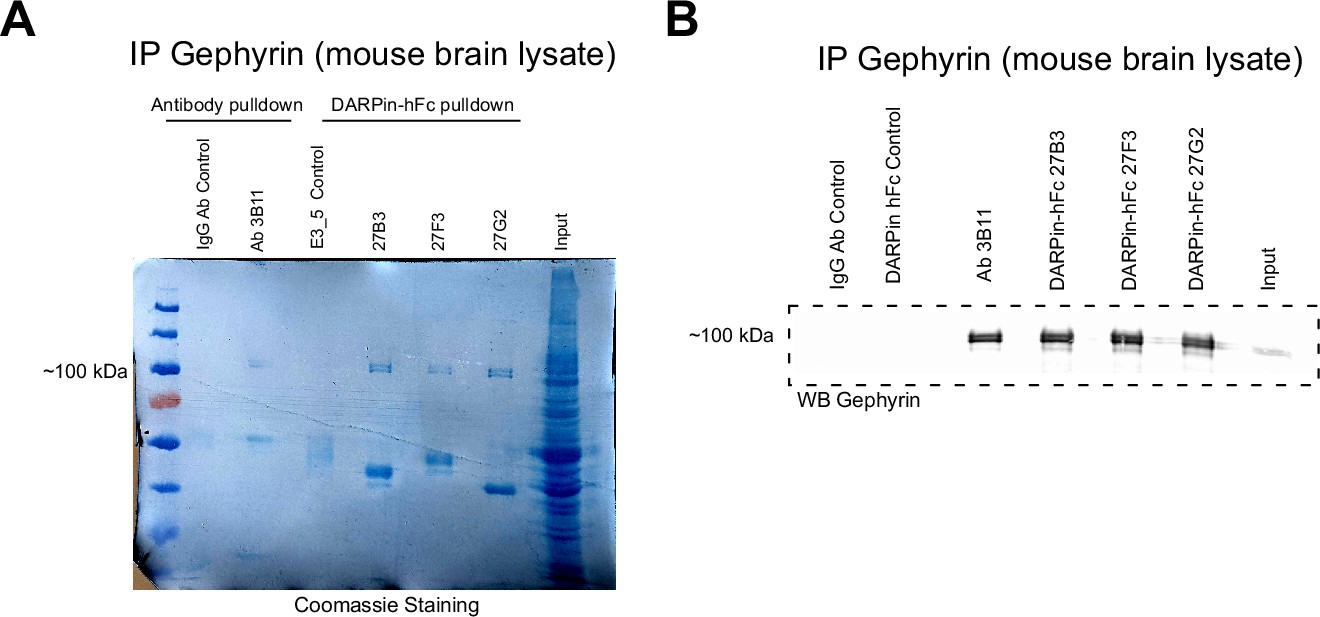
Anti-gephyrin DARPins affinity purify gephyrin from mouse brain lysates.
(A) Coomassie-stained acrylamide gel indicating abundant gephyrin precipitated both by the antibody 3B11 and DARPin-hFc 27B3, 27F3, and 27G2 without signal in antibody (IgG) or DARPin (E3_5) controls. Lower bands correspond to IgG or DARPin-hFc protein. (B) Immunoblot of gephyrin precipitated with different binders probed with the antibody 3B11.
-
Figure 5—figure supplement 1—source data 1
Raw Coomassie gel images and immunoblots from Figure 5—figure supplement 1.
- https://cdn.elifesciences.org/articles/80895/elife-80895-fig5-figsupp1-data1-v3.pdf
Figure 5—figure supplement 2
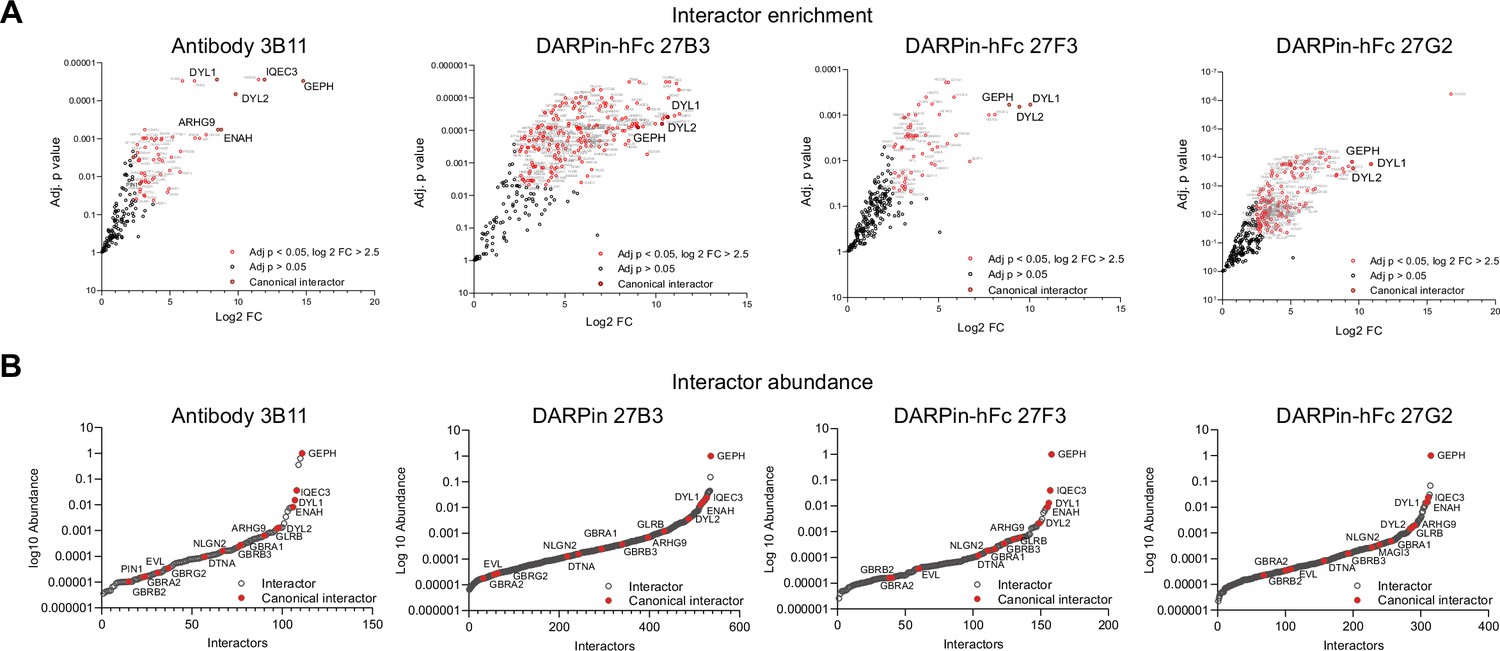
Interactor identification plots.
(A) Volcano plots of enriched proteins with the Log2 FC > 2.5 and false discovery rate (FDR)-adjusted p-value compared to controls. Red points indicate identified gephyrin interacting proteins, with canonical interactors indicated by enlarged text. (B) Abundance of gephyrin interactors for antibody and DARPin-hFc experiments with canonical interactors indicated in red demonstrating several orders of magnitude difference interactors.
-
Figure 5—figure supplement 2—source data 1
Identity and quantification of abundance of interacting proteins presented in Figure 5—figure supplement 2.
- https://cdn.elifesciences.org/articles/80895/elife-80895-fig5-figsupp2-data1-v3.xlsx
-
Figure 5—figure supplement 2—source data 2
Compiled list of proteins from all gephyrin interactor experiments used to assess gephyrin interactor identity.
- https://cdn.elifesciences.org/articles/80895/elife-80895-fig5-figsupp2-data2-v3.xlsx
Figure 5—figure supplement 3
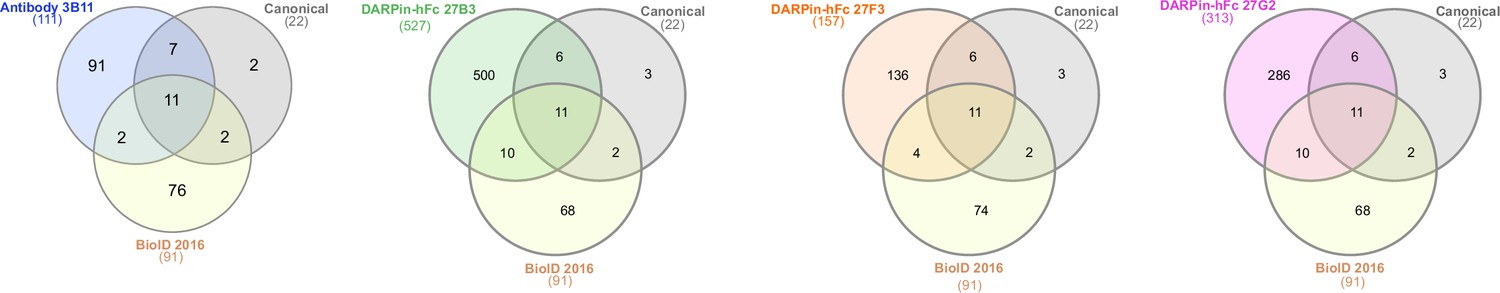
Interactome overlap with previous literature.
Venn diagrams showing the overlap in identified interactors determined using both antibody and DARPin-based interactomes compared to previously identified interactors from the literature (see ‘Materials and methods’) and BioID (Uezu et al., 2016).
Figure 5—figure supplement 4
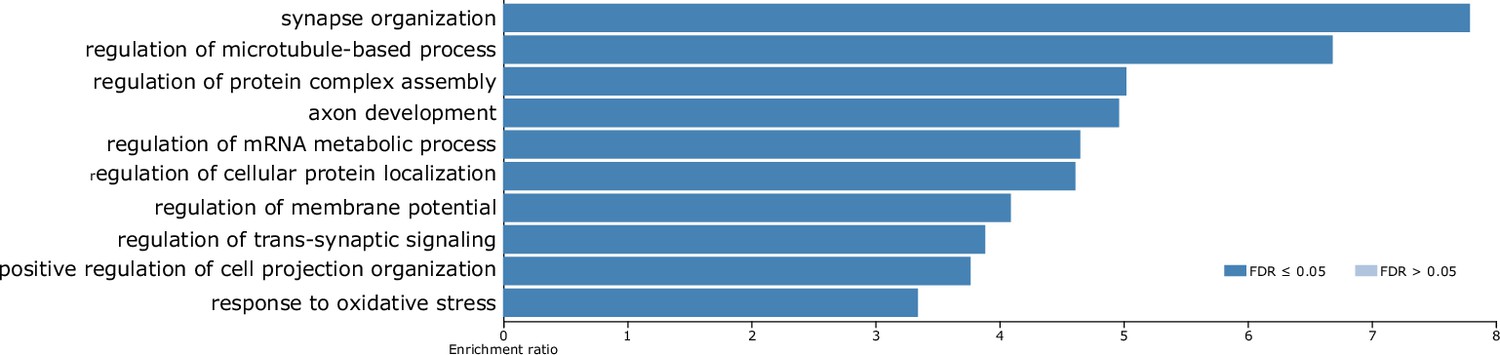
Ontological enrichment analysis of the consensus gephyrin interactome.
Biological process enrichment (WebGestalt) for the 120 consensus gephyrin interactors showing significantly regulated ontologies.
Figure 6 with 4 supplements

Diversity in DARPin-hFc clone-specific interactomes reveals putative isoform-specific gephyrin interactors.
(A) Canonical and non-canonical (metabolic, mRNA binding, and ribosomal ontology) gephyrin interactors show binder-specific abundance profiles. Only significantly regulated interactors are shown. (B) DARPin-hFc clones 27B3 and 27G2 recognize both full-length gephyrin and the GC-domain while clone 27F3 recognizes only full-length gephyrin suggesting different binding epitopes. (C) DARPin-hFc 27F3 only recognizes the principal P1 (synaptic) isoform of gephyrin while clones 27B3 and G2 additionally recognize non-neuronal isoforms containing the C3 cassette. (D) DARPin-hFc 27F3-determined gephyrin interactome enriched over-representation analysis of biological processes. (E) DARPin-hFc 27B3 and 27G2-determined gephyrin interactome enriched over-representation analysis of biological processes. Statistics: (A) two-way ANOVA with multiple-comparisons correction comparisons all groups, three replicates per group.
-
Figure 6—source data 1
Values used to generate heat maps in Figure 6A.
- https://cdn.elifesciences.org/articles/80895/elife-80895-fig6-data1-v3.xlsx
Figure 6—figure supplement 1
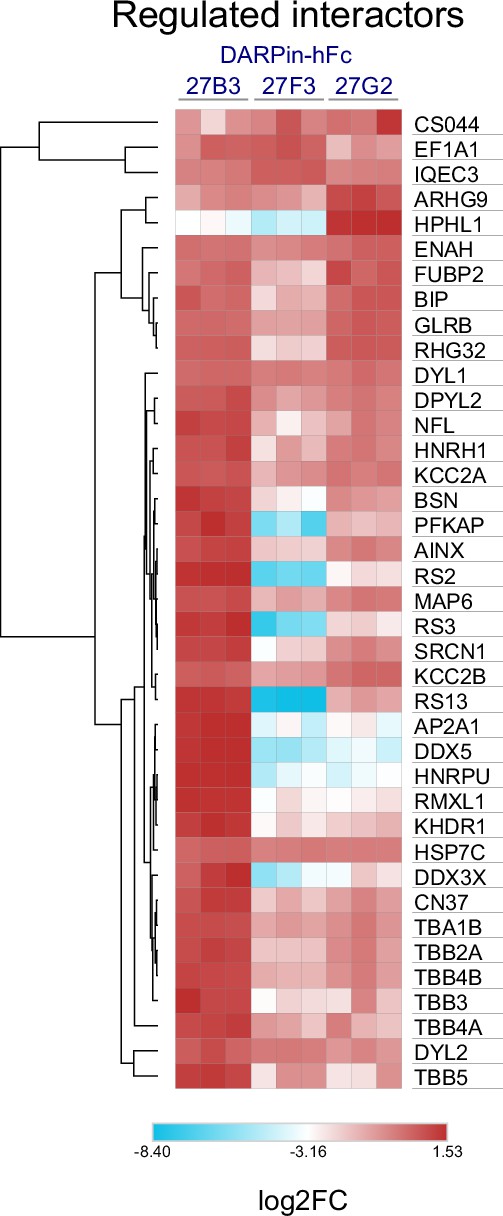
DARPin-specific gephyrin interactor abundance.
Common gephyrin interactors identified by all DARPin-hFc-based interactomes showing proteins with significantly different abundances relative to gephyrin, organized by hierarchical clustering. Only significantly regulated interactors are shown. Statistics: two-way ANOVA with multiple-comparisons correction comparisons all groups, three replicates per group.
-
Figure 6—figure supplement 1—source data 1
Values and statistical test results indicating differentially abundant gephyrin interactors between binding experiments.
- https://cdn.elifesciences.org/articles/80895/elife-80895-fig6-figsupp1-data1-v3.xlsx
Figure 6—figure supplement 2
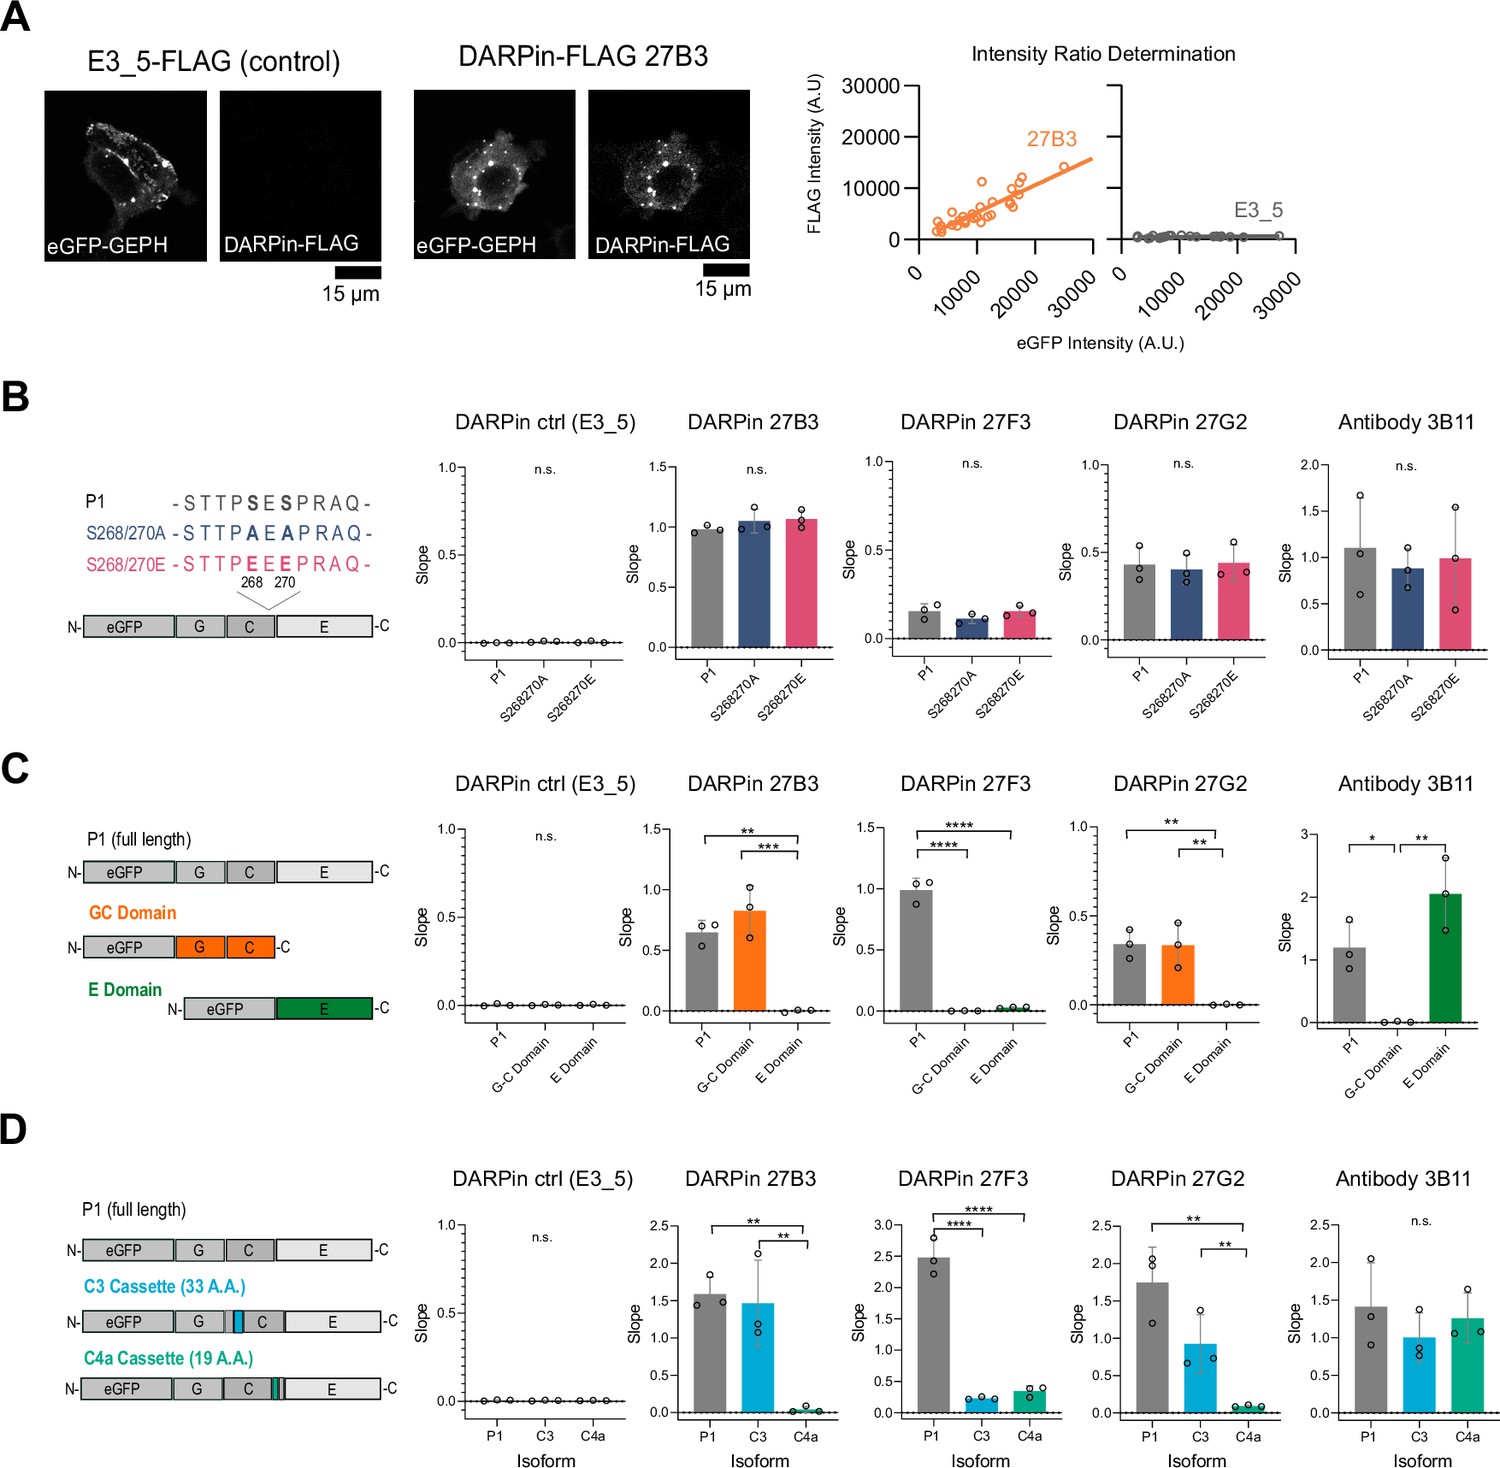
Identification of gephyrin-binding preferences of anti-gephyrin DARPins using an in-cell HEK293T fluorescence assay.
(A) Representative images of eGFP-gephyrin expressed in HEK cells that were fixed and probed using DARPin-FLAG clones or commercial antibody clone 3B11. Shown is eGFP and FLAG signal provided by the control (E3_5) and gephyrin-binding DARPin-FLAG clones (e.g., 27B3). The relative signal between eGFP and FLAG for a given cell is plotted, and the slope compared between clones to assess relative binding. (B) Quantification of binder labeling of eGFP-tagged gephyrin WT versus S268A/S270A and S268E/S270E phospho-mutants overexpressed in HEK293T cells. (C) Quantification of binding to overexpressed full-length (P1 variant) gephyrin or GC or E domains only. (D) Quantification of binding to eGFP-tagged gephyrin P1 isoform or isoforms including the C3 or C4a cassettes. Statistics: one-way ANOVA, *p<0.05, **p<0.01, ***p<0.001, ****p<0.0001. Data points represent the slope calculated from at least 25 cells in three independent experiments. All panels: mean and SD are presented.
-
Figure 6—figure supplement 2—source data 1
Values and statistical analysis performed to generate graphs in Figure 6—figure supplement 2B–D.
- https://cdn.elifesciences.org/articles/80895/elife-80895-fig6-figsupp2-data1-v3.xlsx
Figure 6—figure supplement 3
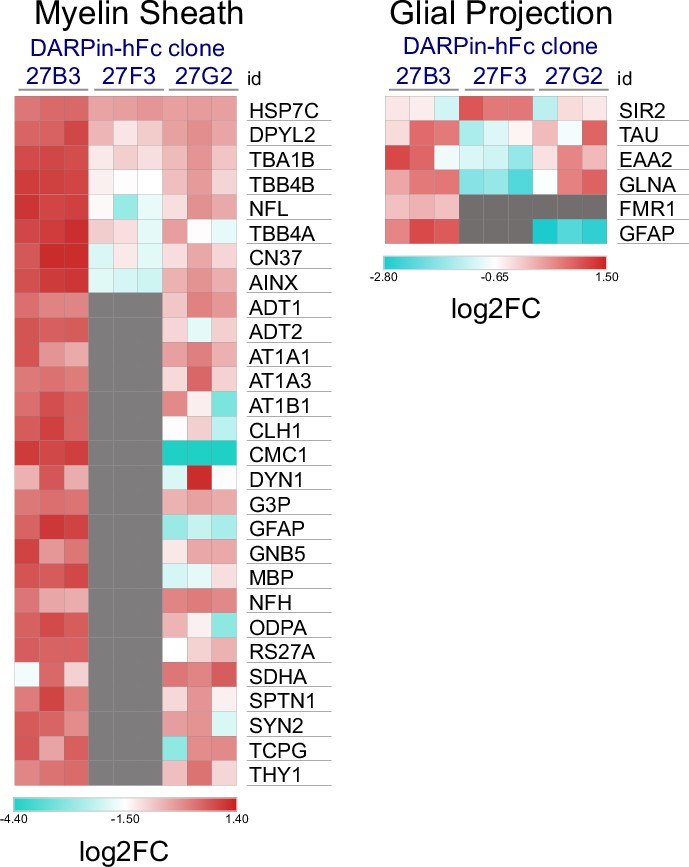
Non-neuronal interactor ontology.
Heat map of relative abundance of proteins of ‘myelin sheath’ or ‘glial projection’ ontology between different DARPin-detected interactomes; gray squares indicate that the binder was not detected as a gephyrin interactor using a given DARPin.
-
Figure 6—figure supplement 3—source data 1
Values used to generate heat maps in Figure 6—figure supplement 3.
- https://cdn.elifesciences.org/articles/80895/elife-80895-fig6-figsupp3-data1-v3.xlsx
Figure 6—figure supplement 4
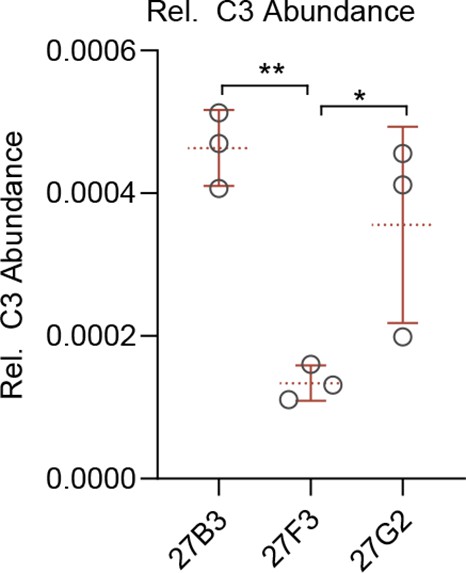
Relative C3 cassette recovery.
Relative recovery of C3-containing gephyrin peptide fragments relative to total gephyrin from liquid chromatography tandem mass spectrometry (LC-MS/MS) analysis. N = individual experimental replicates. Statistics: one-way ANOVA, *p<0.05, **p<0.01, mean and SD are presented.
-
Figure 6—figure supplement 4—source data 1
Values used to generate graphs in Figure 6—figure supplement 4.
- https://cdn.elifesciences.org/articles/80895/elife-80895-fig6-figsupp4-data1-v3.xlsx
Tables
Key resources table
| Reagent type (species) or resource | Designation | Source or reference | Identifiers | Additional information |
|---|---|---|---|---|
| Recombinant DNA reagent | GST within 3′ 6xHis Tag | Provided by the UZH High Throughput Binder Selection platform | pET20b-A(H6)-GST | Used for subcloning recombinant gephyrin constructs for recombinant bacterial expression for use in the ribosome display selection |
| Recombinant DNA reagent | GST within 3′ 6xHis Tag and Avi tag | Provided by the UZH High Throughput Binder Selection platform | pET20b-A(H6)-AviTag | Used for subcloning recombinant gephyrin constructs for recombinant bacterial expression for use in the ribosome display selection |
| Recombinant DNA reagent | BirA enzyme | Provided by the UZH High Throughput Binder Selection platform | pBirAcm | Encodes the AVI-tag-specific biotin ligase BirA for biotin tagging of recombinant gephyrin constructs for use in the ribosome display selection |
| Recombinant DNA reagent | N-terminal 8xHis tag and C-terminal FLAG tag bacterial expression vector | Provided by the UZH High Throughput Binder Selection platform | pQIq_MRGS_HIS8_(DARPin)_FLAG | Used as the backbone for inserting DARPins using HindIII and BamHI restriction sites for recombinant bacterial expression of FLAG tagged DARPins |
| Recombinant DNA reagent | N-terminal HSA leader sequence and C-terminal hFc tag for mammalian expression | Provided by the UZH High Throughput Binder Selection platform | pcDNA3.1_SacB_hFc | Used as the backbone for inserting DARPins using HindIII and BamHI restriction sites for recombinant mammalian expression of hFc tagged DARPins |
| Recombinant DNA reagent | N-terminal His-tagged P1-gephyrin S268/270A | This article | pET20b-A(H6)- P1-gephyrin S268/270A | Subcloned from pEGFPC2-gephyrin S268/270A (Tyagarajan et al., 2013) using added Kpn1 and EcoRI sites into pET20b-A(H6)-GST for use in DARPin ribosome display selection |
| Recombinant DNA reagent | N-terminal His-tagged P1-gephyrin S268/270E | This article | pET20b-A(H6)- P1-gephyrin S268/270E | Subcloned from pEGFPC2-gephyrin S268/270E (Tyagarajan et al., 2013) using added Kpn1 and EcoRI sites into pET20b-A(H6)-GST for use in DARPin ribosome display selection |
| Recombinant DNA reagent | N-terminal His-tagged P1-gephyrin | This article | pET20b-A(H6)- P1-gephyrin | Subcloned from pEGFPC2-gephyrin P1 (Tyagarajan et al., 2013) using added Kpn1 and EcoRI sites into pET20b-A(H6)-GST for use in DARPin ribosome display selection |
| Recombinant DNA reagent | N-terminal HisAvi-tagged P1-gephyrin S268/270A | This article | pET20b-A(H6)- P1-gephyrin S268/270A AviTag | Subcloned from pEGFPC2-gephyrin S268/270A (Tyagarajan et al., 2013) using added Kpn1 and EcoRI sites into pET20b-A(H6)-AviTag for use in DARPin ribosome display selection |
| Recombinant DNA reagent | N-terminal HisAvi-tagged P1-gephyrin S268/270E | This article | pET20b-A(H6)- P1-gephyrin S268/270E AviTag | Subcloned from pEGFPC2-gephyrin S268/270E (Tyagarajan et al., 2013) using added Kpn1 and EcoRI sites into pET20b-A(H6)-AviTag for use in DARPin ribosome display selection |
| Recombinant DNA reagent | N-terminal eGFP-tagged P1-gephyrin S268/270A | Tyagarajan et al., 2013 | pEGFPC2-gephyrin S268/270A | Used for subcloning for recombinant bacterial expression as well as the in-cell fluorescence assays |
| Recombinant DNA reagent | N-terminal eGFP-tagged P1-gephyrin S268/270E | Tyagarajan et al., 2013 | pEGFPC2-gephyrin S268/270E | Used for subcloning for recombinant bacterial expression as well as the in-cell fluorescence assays |
| Recombinant DNA reagent | N-terminal eGFP-tagged P1-gephyrin | Tyagarajan et al., 2013 | pEGFPC2-gephyrin P1 | Used for subcloning for recombinant bacterial expression as well as the in-cell fluorescence assays |
| Recombinant DNA reagent | N-terminal eGFP-tagged gephyrin GC domain | Lardi-Studler et al., 2007 | EGFPC2-Gephyrin GC | Used for in-cell fluorescence assays to assess relative binding of DARPins to the GC domain of gephyrin |
| Recombinant DNA reagent | N-terminal eGFP-tagged gephyrin E domain | Lardi-Studler et al., 2007 | EGFPC2-Gephyrin E | Used for in-cell fluorescence assays to assess relative binding of DARPins to the E domain of gephyrin |
| Recombinant DNA reagent | N-terminal eGFP-tagged gephyrin containing the C3 cassette | Smolinsky et al., 2008 | pEGFPC2 Gephyrin C3 | Used for in-cell fluorescence assays to assess relative binding of DARPins to the C3 cassette containing gephyrin variants |
| Recombinant DNA reagent | N-terminal eGFP-tagged gephyrin containing the C4a cassette | Smolinsky et al., 2008 | pEGFPC2 Gephyrin C4a | Used for in-cell fluorescence assays to assess relative binding of DARPins to the C4a cassette containing gephyrin variants |
| Recombinant DNA reagent | DARPin-FLAG E3_5 (control) | This article | pQIq_MRGS_HIS8_(E3_5)_FLAG | Created by subcloning DARPin E3_5 into pQIq_MRGS_HIS8_(DARPin)_FLAG using BamHI and HindIII sites |
| Recombinant DNA reagent | DARPin-FLAG 27B3 | This article | pQIq_MRGS_HIS8_(27B3)_FLAG | Created by subcloning DARPin 27B3 into pQIq_MRGS_HIS8_(DARPin)_FLAG using BamHI and HindIII sites |
| Recombinant DNA reagent | DARPin-FLAG 27D3 | This article | pQIq_MRGS_HIS8_(27D3)_FLAG | Created by subcloning DARPin 27D3 into pQIq_MRGS_HIS8_(DARPin)_FLAG using BamHI and HindIII sites |
| Recombinant DNA reagent | DARPin-FLAG 27F3 | This article | pQIq_MRGS_HIS8_(27F3)_FLAG | Created by subcloning DARPin 27F3 into pQIq_MRGS_HIS8_(DARPin)_FLAG using BamHI and HindIII sites |
| Recombinant DNA reagent | DARPin-FLAG 27B5 | This article | pQIq_MRGS_HIS8_(27B5)_FLAG | Created by subcloning DARPin 27B5 into pQIq_MRGS_HIS8_(DARPin)_FLAG using BamHI and HindIII sites |
| Recombinant DNA reagent | DARPin-FLAG 27D5 | This article | pQIq_MRGS_HIS8_(27D5)_FLAG | Created by subcloning DARPin 27D5 into pQIq_MRGS_HIS8_(DARPin)_FLAG using BamHI and HindIII sites |
| Recombinant DNA reagent | DARPin-FLAG 27G2 | This article | pQIq_MRGS_HIS8_(27G2)_FLAG | Created by subcloning DARPin 27G2 into pQIq_MRGS_HIS8_(DARPin)_FLAG using BamHI and HindIII sites |
| Recombinant DNA reagent | DARPin-FLAG 27H2 | This article | pQIq_MRGS_HIS8_(27H2)_FLAG | Created by subcloning DARPin 27H2 into pQIq_MRGS_HIS8_(DARPin)_FLAG using BamHI and HindIII sites |
| Recombinant DNA reagent | DARPin-FLAG 27G4 | This article | pQIq_MRGS_HIS8_(27G4)_FLAG | Created by subcloning DARPin 27G4 into pQIq_MRGS_HIS8_(DARPin)_FLAG using BamHI and HindIII sites |
| Recombinant DNA reagent | DARPin-hFc E3_5 (control) | This article | pcDNA3.1_ E3_5 _hFc | Created by subcloning DARPin E3_5 into pcDNA3.1_ SacB _hFc using BamHI and HindIII sites |
| Recombinant DNA reagent | DARPin-hFc 27B3 | This article | pcDNA3.1_27B3_hFc | Created by subcloning DARPin 27B3into pcDNA3.1_ SacB _hFc using BamHI and HindIII sites |
| Recombinant DNA reagent | DARPin-hFc 27F3 | This article | pcDNA3.1_27F3_hFc | Created by subcloning DARPin 27F3into pcDNA3.1_ SacB _hFc using BamHI and HindIII sites |
| Recombinant DNA reagent | DARPin-hFc 27G2 | This article | pcDNA3.1_27G2_hFc | Created by subcloning DARPin 27G2 into pcDNA3.1_ SacB _hFc using BamHI and HindIII sites |
| Recombinant DNA reagent | His/His-AVI F | Microsynth | 5′-A TAT GGT ACC CAC CAC CAC CAC CAC CAC TGA G-3′ | Forward primer used to amplify gephyrin and gephyrin S268A/S270A or E mutants for insertion into recombinant expression vectors (His and His-AVI plasmids) |
| Recombinant DNA reagent | His-AVI R | Microsynth | 5′-T ATA GAA TTC TGA AGA GCC TCC TGA AGA GCC TCC TTC ATG CCA TTC-3′ | Reverse primer used to amplify gephyrin and gephyrin S268/270A or E mutants for insertion into recombinant expression vectors (HIS-AVI plasmids) |
| Recombinant DNA reagent | His-R | Microsynth | 5′-T ATA GAA TTC TGA AGA GCC TCC TGA AGA GCC TCC GTG ATG GTG ATG GT-3′ | Reverse primer used to amplify gephyrin and gephyrin S268A/S270A or E mutants for insertion into recombinant expression vectors (His- plasmids) |
| Antibody | Anti-Ankyrin G (AnkG) (mouse monoclonal) | Neuromab | MABN466; RRID AB_274980 | IF/ICC used at 1:1000 |
| Antibody | Anti-mouse AP (goat polyclonal) | Sigma-Aldrich (Merck) | A3562; RRID:AB_258091 | Used for ELISA screen |
| Antibody | Anti-FLAG M2 (mouse monoclonal) | Sigma-Aldrich (Merck) | F3165; RRID AB_259529 | IF/ICC used at 1:1000 |
| Antibody | Anti-FLAG D2 (mouse monoclonal) | Cisbio | 61FG2DLB | Used for HTRF screen |
| Antibody | Anti-GABRA2 (guinea pig polyclonal) | In-house (Fritschy and Mohler, 1995) | - | IF/ICC used at 1:2000 |
| Antibody | Anti-gephyrin 3B11 (mouse monoclonal) | Synaptic Systems | Cat# 147111; RRID:AB_887719 | IF/ICC used at 1:1000 |
| Antibody | Anti-gephyrin Ab7a (rabbit monoclonal) | Synaptic Systems | 147 008; RRID:AB_2619834 | IF/ICC used at 1:2000 |
| Antibody | Anti-VGAT (guinea pig monoclonal) | Synaptic Systems | 131308; RRID:AB_2832243 | IF/ICC used at 1:2000 |
| Antibody | Anti-mouse Alexa Cy3 (goat polyclonal) | Jackson ImmunoResearch Labs | JAC 115-165-166; RRID:AB_2338692 | IF/ICC used at 1:500 |
| Antibody | Anti-rabbit Alexa 488 (goat polyclonal) | Jackson ImmunoResearch Labs | JAC 111-545-144; RRID:AB_2338052 | IF/ICC used at 1:500 |
| Antibody | Anti-guinea pig Alexa 647 (goat polyclonal) | Jackson ImmunoResearch Labs | JAC 106-605-003; RRID:AB_2337446 | IF/ICC used at 1:500 |
| Antibody | Anti-human Cy3 (goat polyclonal) | Jackson ImmunoResearch Labs | JAC 109-165-170; RRID:AB_2810895 | IF/ICC used at 1:500 |
| Peptide, recombinant protein | Streptavidin-Tb cryptate | Cisbio | 610SATLB | Used for HTRF screen |
| Antibody | IRDye 680RD anti-mouse IgG (donkey polyclonal) | LI-COR Biosciences | LIC925-68072 | WB 1:20,000 |
| Antibody | Anti-human polyclonal Fc HRP | CalBiochem | 401455 | WB 1:40,000 |
| Cell line (Rattus norvegicus) | Wistar (RccHan:WIST) hippocampal cell culture | Envigo (Netherlands) | Order code: 168 | E17 embryos were collected from time-mated dams |
| Biological sample (Mus musculus) | Tissue C57BL/6JCrl | Charles River Laboratories (Germany) | RRID:IMSR_JAX:000664 | Used for synapse analysis and proteomic analysis |
| Biological sample (M. musculus) | Tissue C57Bl6/JCrl GphnS268A/S270A | Cramer et al., 2022 | NA | Used for synapse analysis only |
| Strain, strain background (Escherichia coli) | BL21 DE3 Gold | Bio-Rad | Cat# 161-0156 | Used for recombinant bacterial gephyrin and DARPin expression |
| Strain, strain background (E. coli) | XL1-blue | Agilent | 200249 | Used for DARPin ribosome display screening |
| Cell line (human) | HEK293T | ATCC | CRL 11268 | Used for in-cell DARPin binding screen |
Additional files
-
MDAR checklist
- https://cdn.elifesciences.org/articles/80895/elife-80895-mdarchecklist1-v3.docx
-
Supplementary file 1
List of DARPin sequences.
Amino acid and nucleotide sequences are displayed for all characterized anti-gephyrin DARPins in this study.
- https://cdn.elifesciences.org/articles/80895/elife-80895-supp1-v3.docx
Download links
A two-part list of links to download the article, or parts of the article, in various formats.
Downloads (link to download the article as PDF)
Open citations (links to open the citations from this article in various online reference manager services)
Cite this article (links to download the citations from this article in formats compatible with various reference manager tools)
A DARPin-based molecular toolset to probe gephyrin and inhibitory synapse biology
eLife 11:e80895.
https://doi.org/10.7554/eLife.80895


