Retinal microvascular and neuronal pathologies probed in vivo by adaptive optical two-photon fluorescence microscopy
- Department of Physics, University of California, United States
- Department of Molecular and Cell Biology, University of California, United States
- Helen Wills Neuroscience Institute, University of California, United States
- School of Optometry, University of California, United States
- Vision Science Program, University of California, United States
- Molecular Biophysics and Integrated Bioimaging Division, Lawrence Berkeley National Laboratory, United States
Figures
Figure 1 with 3 supplements
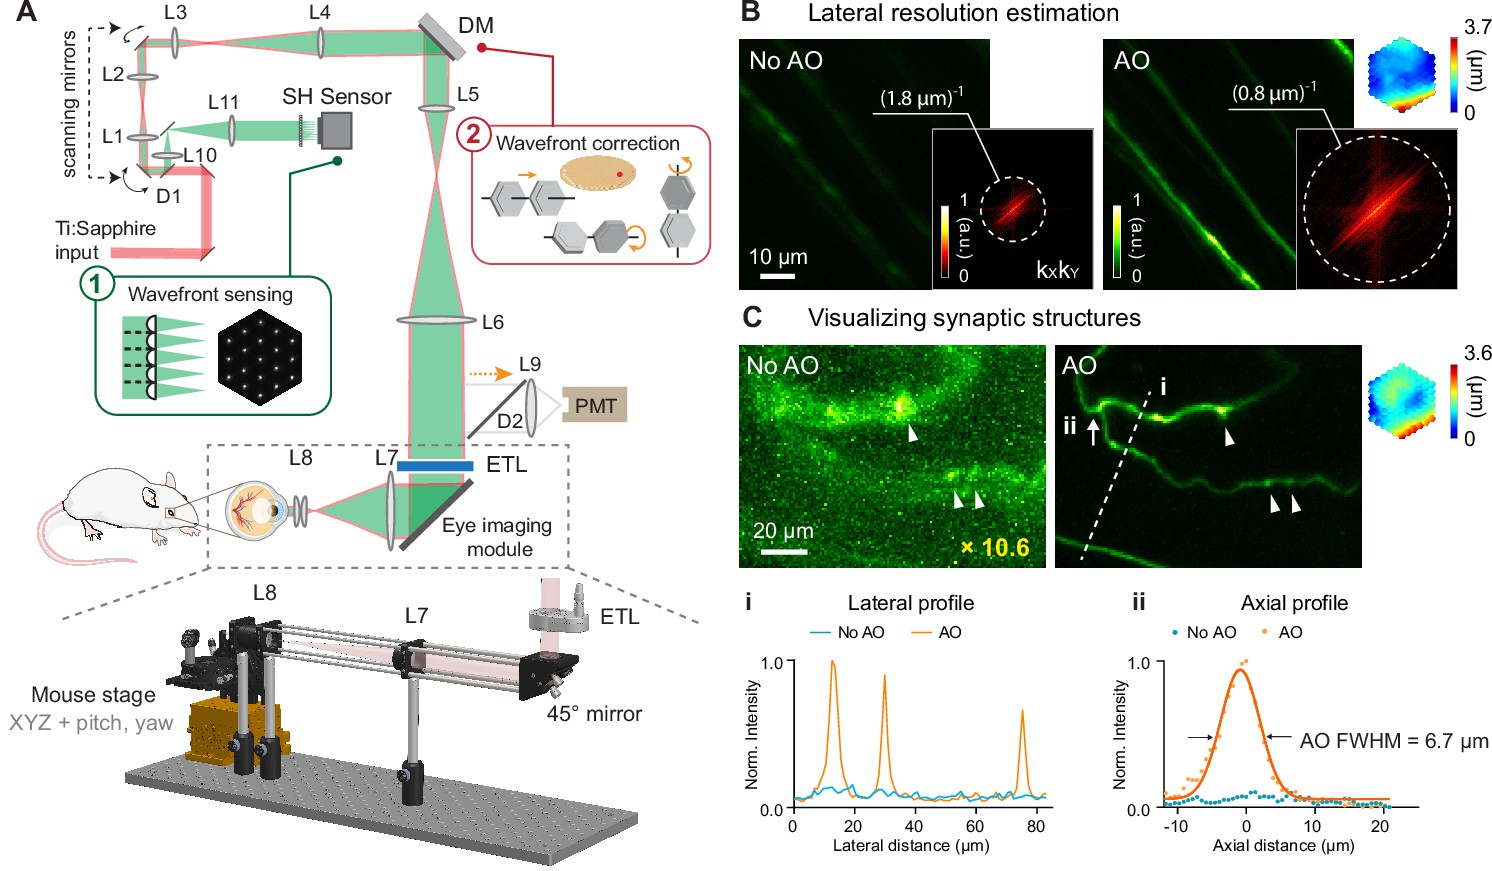
AO-2PFM for diffraction-limited imaging of the mouse retina in vivo.
(A) Schematics of AO-2PFM. Inset 1: direct wavefront measurement by a Shack-Hartmann (SH) sensor composed of a lenslet array and a camera. Inset 2: wavefront correction with a deformable mirror composed of 163 segments with piston, tip, and tilt controls. Grey dashed box: eye imaging module. Bottom: 3D assembly of eye imaging module. L, lens; D, dichroic mirror; DM, deformable mirror; PMT, photomultiplier tube; ETL, electrically tunable lens. (B) Maximum intensity projections (MIPs) of image stacks (72×72×25 µm3) of RGC axons measured without and with AO, respectively, normalized to AO image. Insets: kXkY spatial frequency representation of the images and corrective wavefront. (C) MIPs of image stacks (132×97×32 µm3) of fine RGC processes measured without and with AO, respectively, normalized to AO image. ‘No AO’ image brightness artificially increased by 10.6× for better visualization. White arrowheads: putative synaptic structures. Inset: corrective wavefront. Bottom: i: lateral signal profiles along white dashed line i; ii: axial signal profiles of process ii (white arrow). Signals in the line profiles were normalized to the maximal value of the AO condition. Representative data from >3 experiments (technical replicates).
-
Figure 1—source data 1
Source image stacks of retinal axons (Figure 1B).
‘1-NoAO_8fAvg_stack.tif’ (No AO) and ‘2-AO_8fAvg_stack.tif’ (AO) Figure 1—source data 2 Source image stacks of retinal dendrites (Figure 1C): ‘1-NoAO_8fAvg_160_100_stack.tif’ (No AO) and ‘2-AO_8fAvg_160_100_stack.tif’ (AO).
- https://cdn.elifesciences.org/articles/84853/elife-84853-fig1-data1-v1.zip
-
Figure 1—source data 2
Source image stacks of retinal neuronal processes (Figure 1C).
- https://cdn.elifesciences.org/articles/84853/elife-84853-fig1-data2-v1.zip
Figure 1—figure supplement 1
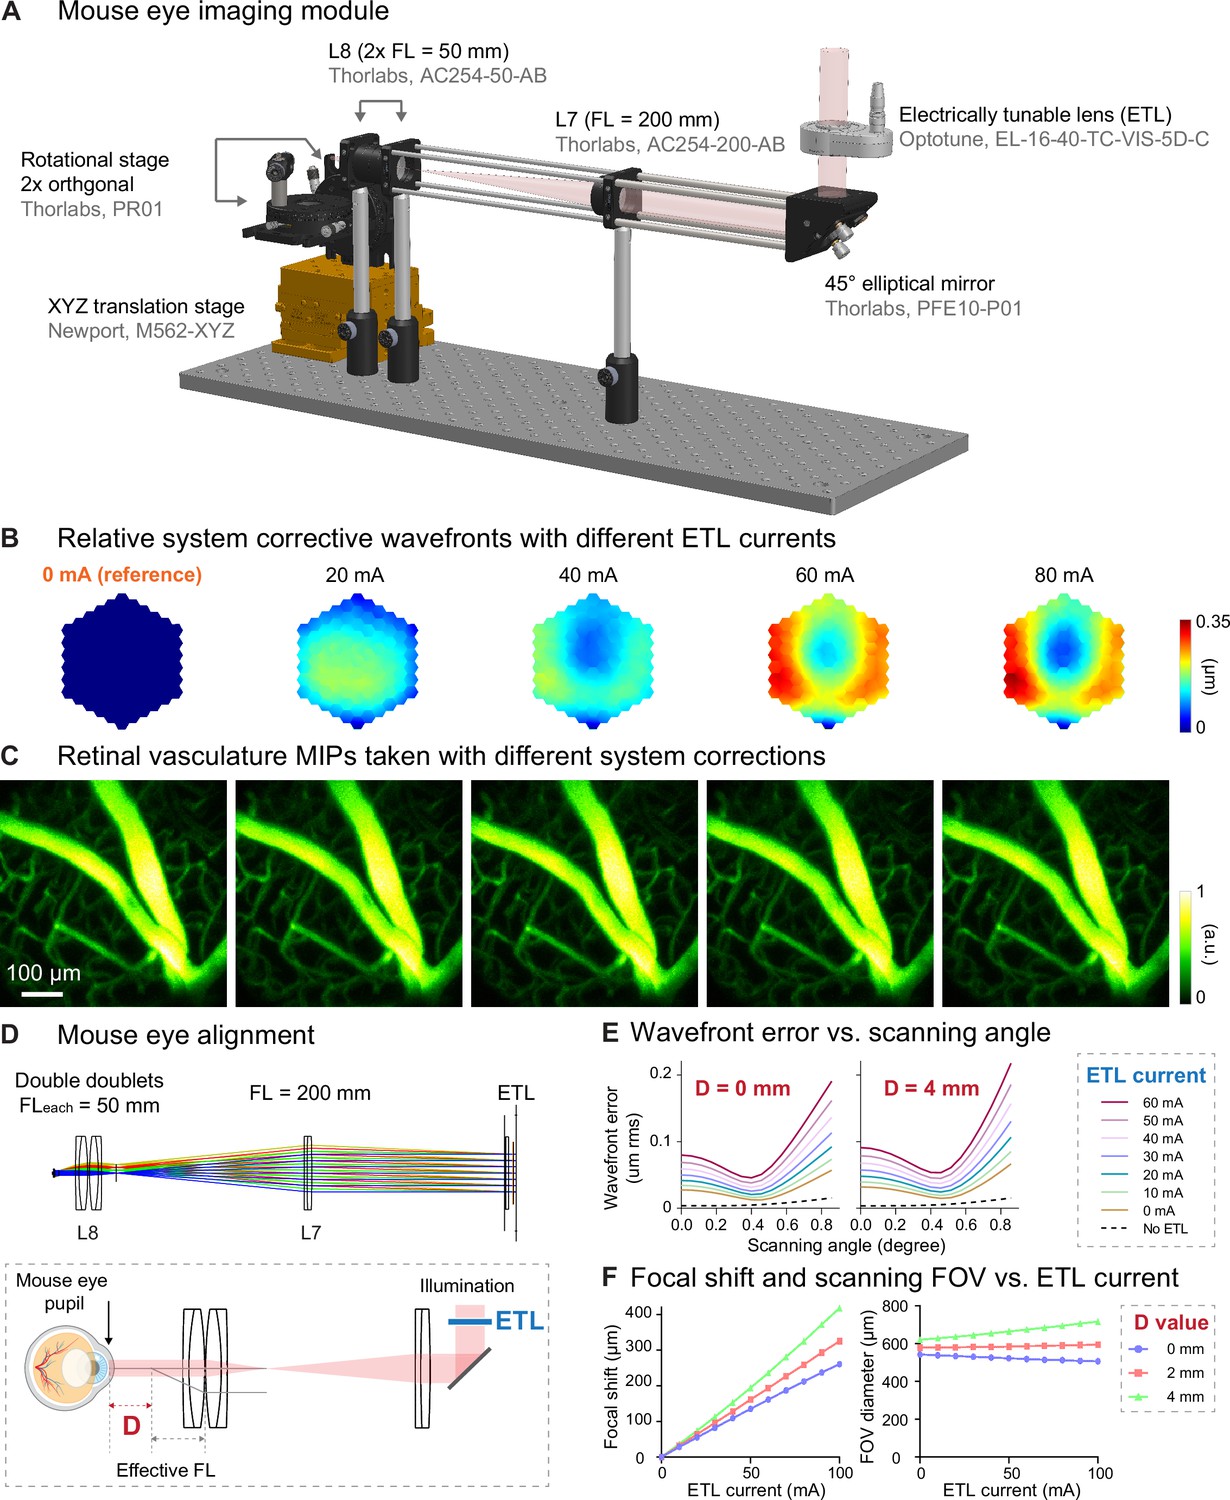
Characterization of aberrations introduced by ETL and alignment.
(A) 3D rendering of the eye imaging module. (B) Additional corrective wavefronts for system aberrations measured with 0, 20, 40, 60, and 80 mA ETL currents, relative to the corrective wavefront measured with 0 ETL current. (C) MIPs of dye-injected retinal vasculature image stacks (550×550×127 µm3) measured with corresponding system corrections in (B). (D) Top: Zemax ray tracing of the eye imaging module. Bottom: illustration of mouse eye alignment (not to scale). D: distance between the mouse eye pupil and L8 focal plane. (E) Wavefront errors versus scanning angle (at the ETL) for different ETL currents with the mouse eye placed at D=0 mm and D=4 mm, respectively, obtained by ray tracing. (F) Relative focal shift and imaging FOV versus ETL current at different D values, obtained by ray tracing.
Figure 1—figure supplement 2
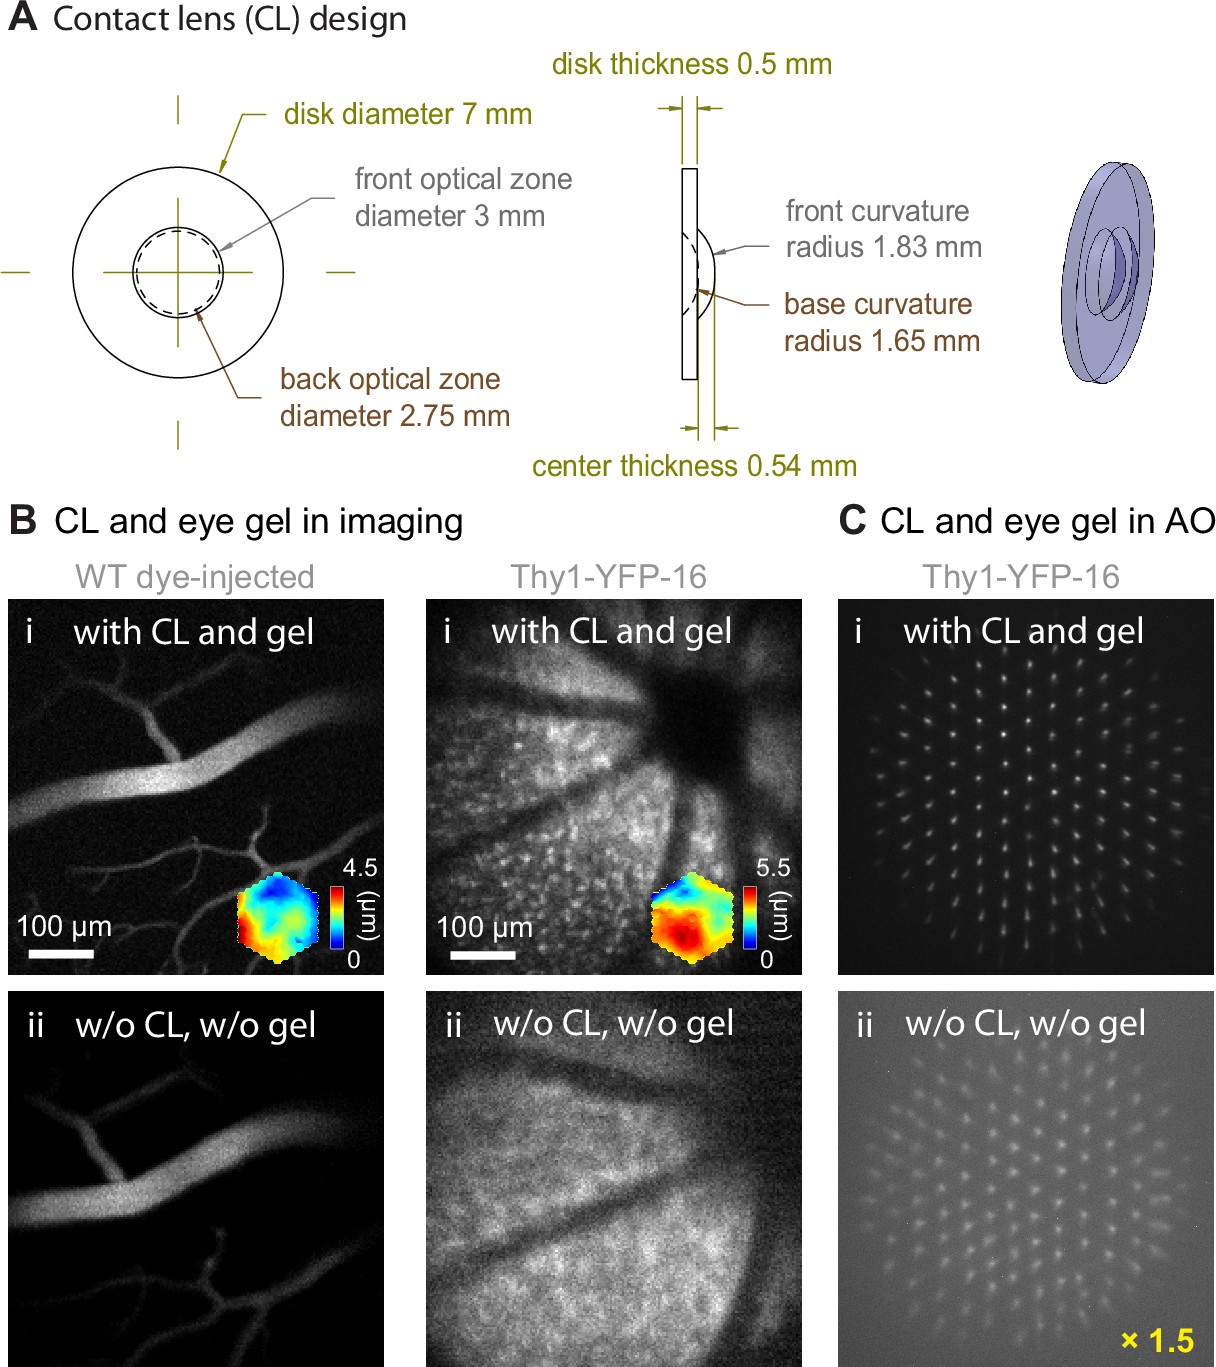
Contact lens and eye gel application improve image and wavefront sensing quality.
(A) Design of the customized contact lens (CL). (B) 2PFM single-plane images of (left) retinal vasculature and (right) retinal cells acquired (i) with CL and eye gel and (ii) without CL or eye gel. All images taken with system aberration correction and normalized to (i). WT: wildtype. (C) Shack-Hartmann (SH) sensor images acquired from the Thy1-YFP-16 mouse retina in (B), normalized to SH image in (i). Brightness of SH image in (ii) artificially increased by 1.5× for better visualization.
Figure 1—figure supplement 3
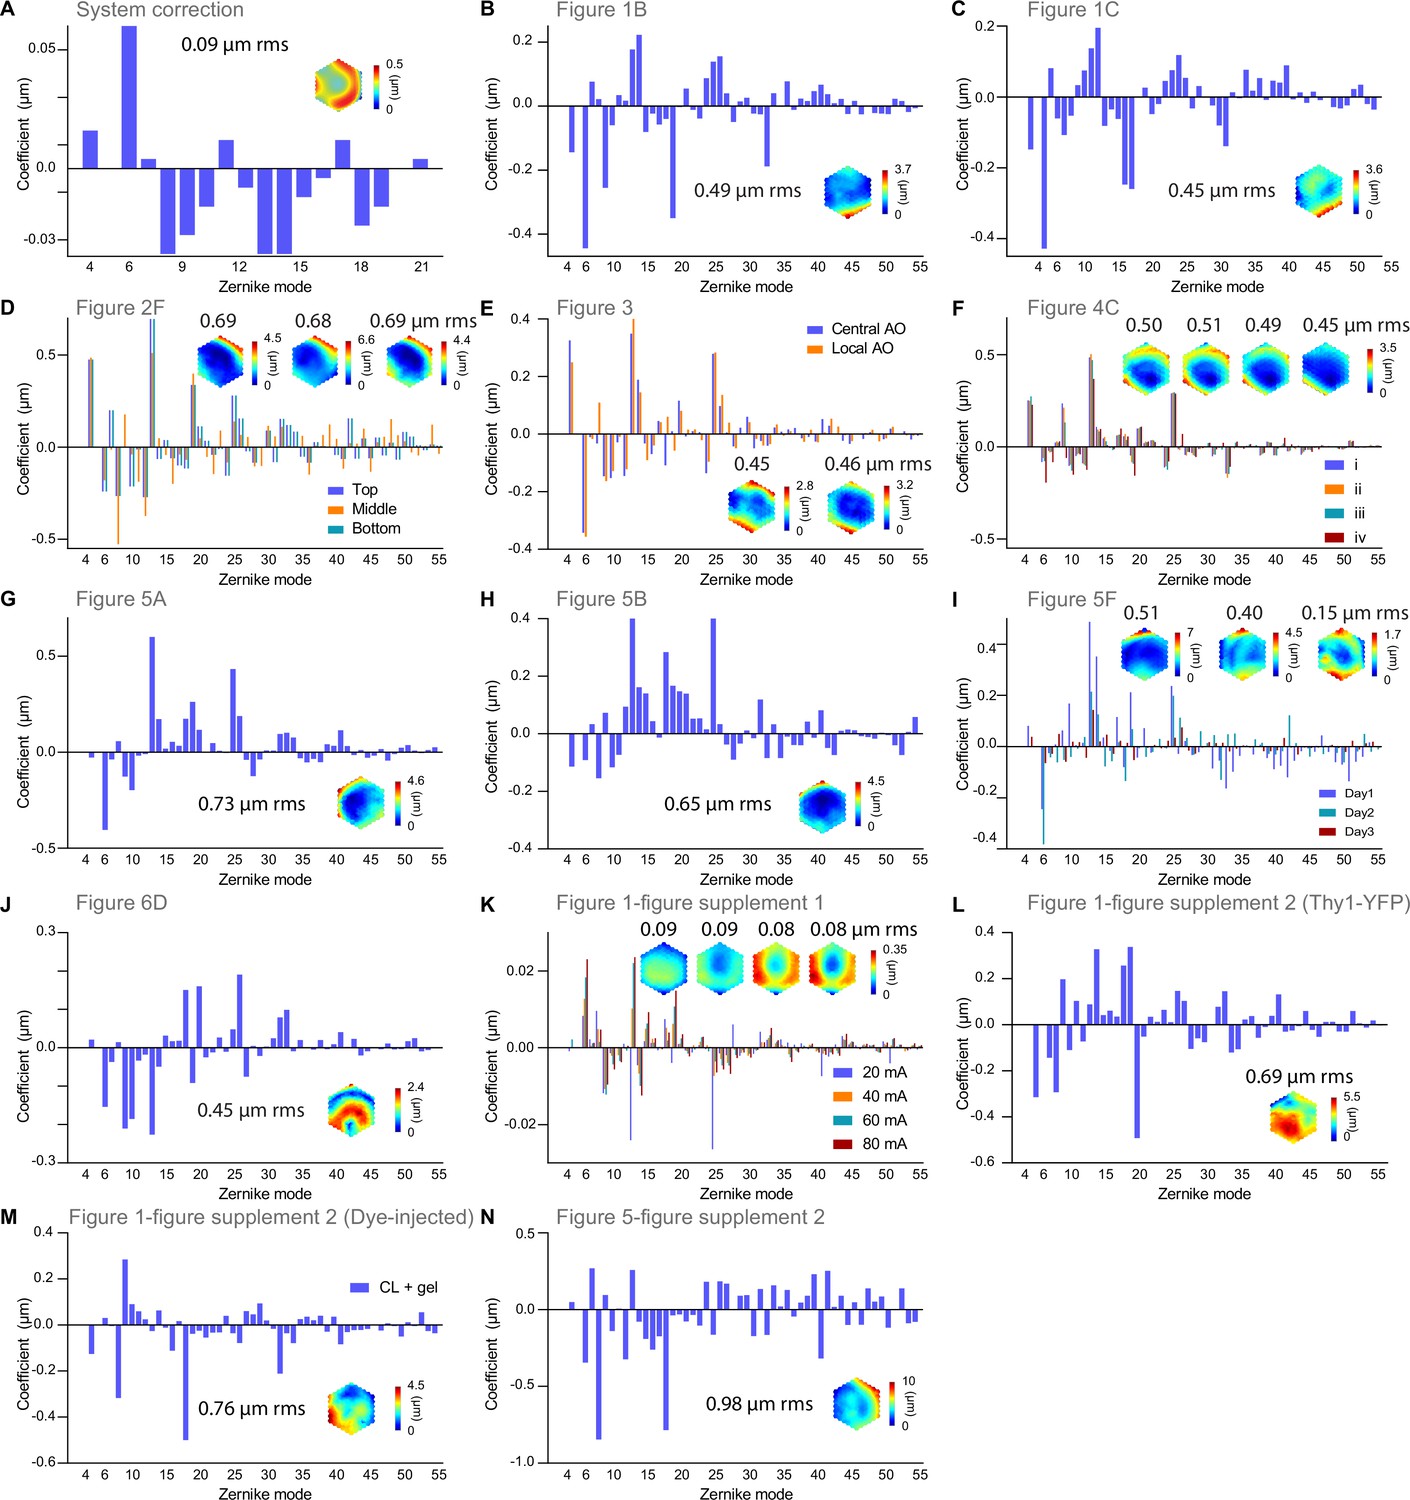
Zernike decompositions and corrective wavefronts for all experiments.
All corrective wavefronts and Zernike decompositions were calculated excluding piston, tip, tilt, and defocus.
Figure 2 with 1 supplement
In vivo imaging of mouse retinal vasculature with AO-2PFM.
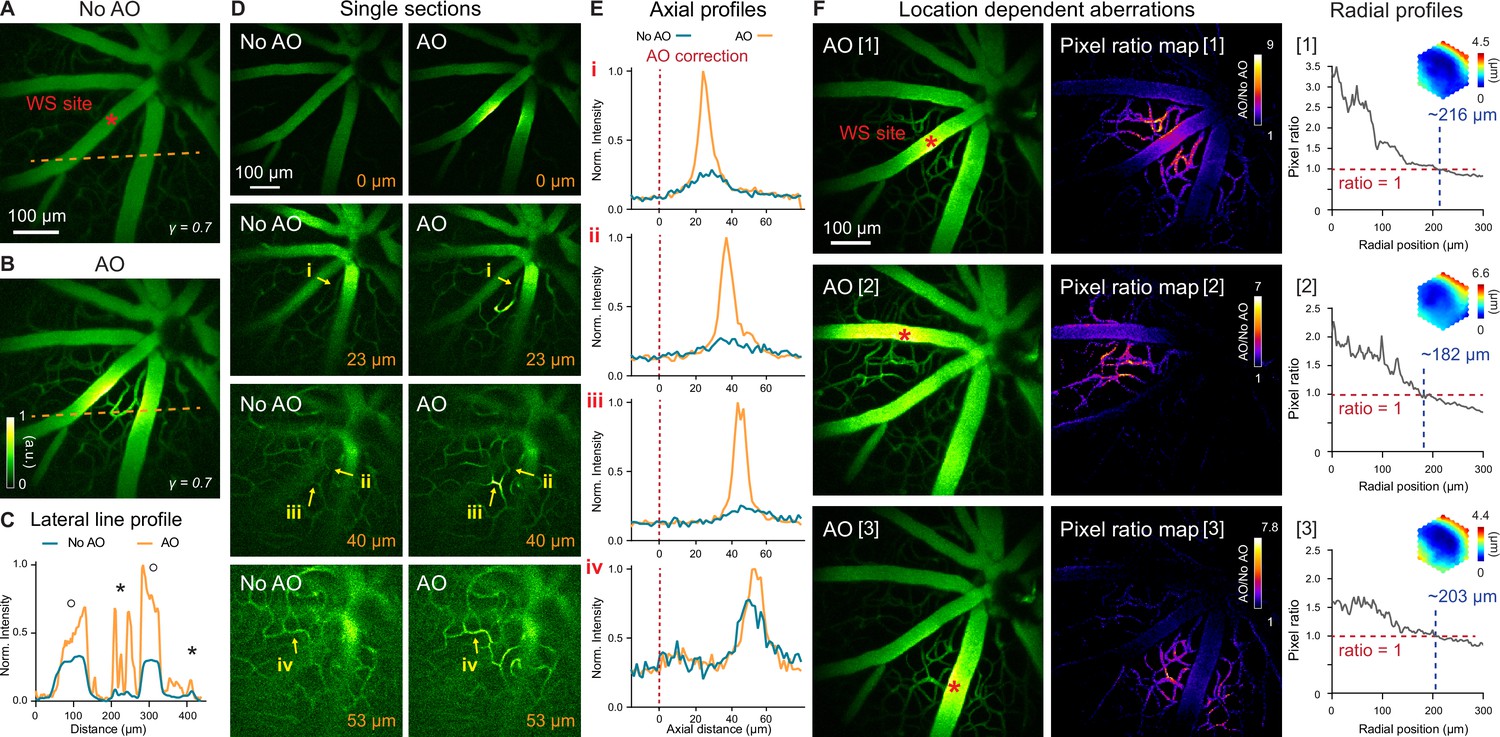
(A,B) MIPs of image stacks (580×580×128 µm3) of vasculature measured (A) without and (B) with AO, respectively, normalized to AO image. Red asterisk: center of 19×19 µm2 wavefront sensing (WS) area. Gamma correction: 0.7. Representative data from >25 experiments (technical replicates). (C) Lateral line profiles along orange dashed lines in A and B. Black circles: large vessels; black asterisks: capillaries. (D) Single image planes at 0, 23, 40, and 53 µm below the superficial vascular plexus acquired without and with AO correction performed at the superficial plexus (0 µm), normalized to AO images. (E) Axial profiles of capillary structures (i-iv in D). Red dashed lines: depth of wavefront sensing area. (F) Left: MIPs of image stacks (580×580×110 µm3) acquired with WS performed at different locations in the FOV (red asterisks). Middle: AO/No AO pixel ratio maps. Right: radially averaged profiles of pixel ratio maps, centered at WS sites. Insets: corrective wavefronts. MIPs and pixel ratio maps individually normalized.
-
Figure 2—source data 1
Source image stacks of retinal vasculature (Figure 2A, B and D).
‘1-NoAO_8fAvg_stack.tif’ (No AO) and ‘2-AO_8fAvg_stack.tif’.
- https://cdn.elifesciences.org/articles/84853/elife-84853-fig2-data1-v1.zip
-
Figure 2—source data 2
Source image stacks with AO measured at different locations (Figure 2F).
‘AO [1]’ stack: ‘1-AO[1]_Location_0_0_stack-9fAVG.tif’, ‘AO [2]’ stack: ‘2-AO[2]_Location_N15_N18_stack-9fAVG.tif’ ‘AO [3]’ stack: ‘3-AO[3]_Location_P4_P25_stack-9fAVG.tif’.
- https://cdn.elifesciences.org/articles/84853/elife-84853-fig2-data2-v1.zip
Figure 2—video 1
In vivo 2-photon image stacks of retinal vasculature in a wildtype mouse measured without and with AO performed at different locations in the field of view (red asterisks).
Same data as shown in Figure 2F. Image volume: 580×580×110 µm3; Z step: 3.26 µm.
Figure 3 with 2 supplements
In vivo imaging of mouse retinal neurons with AO-2PFM.
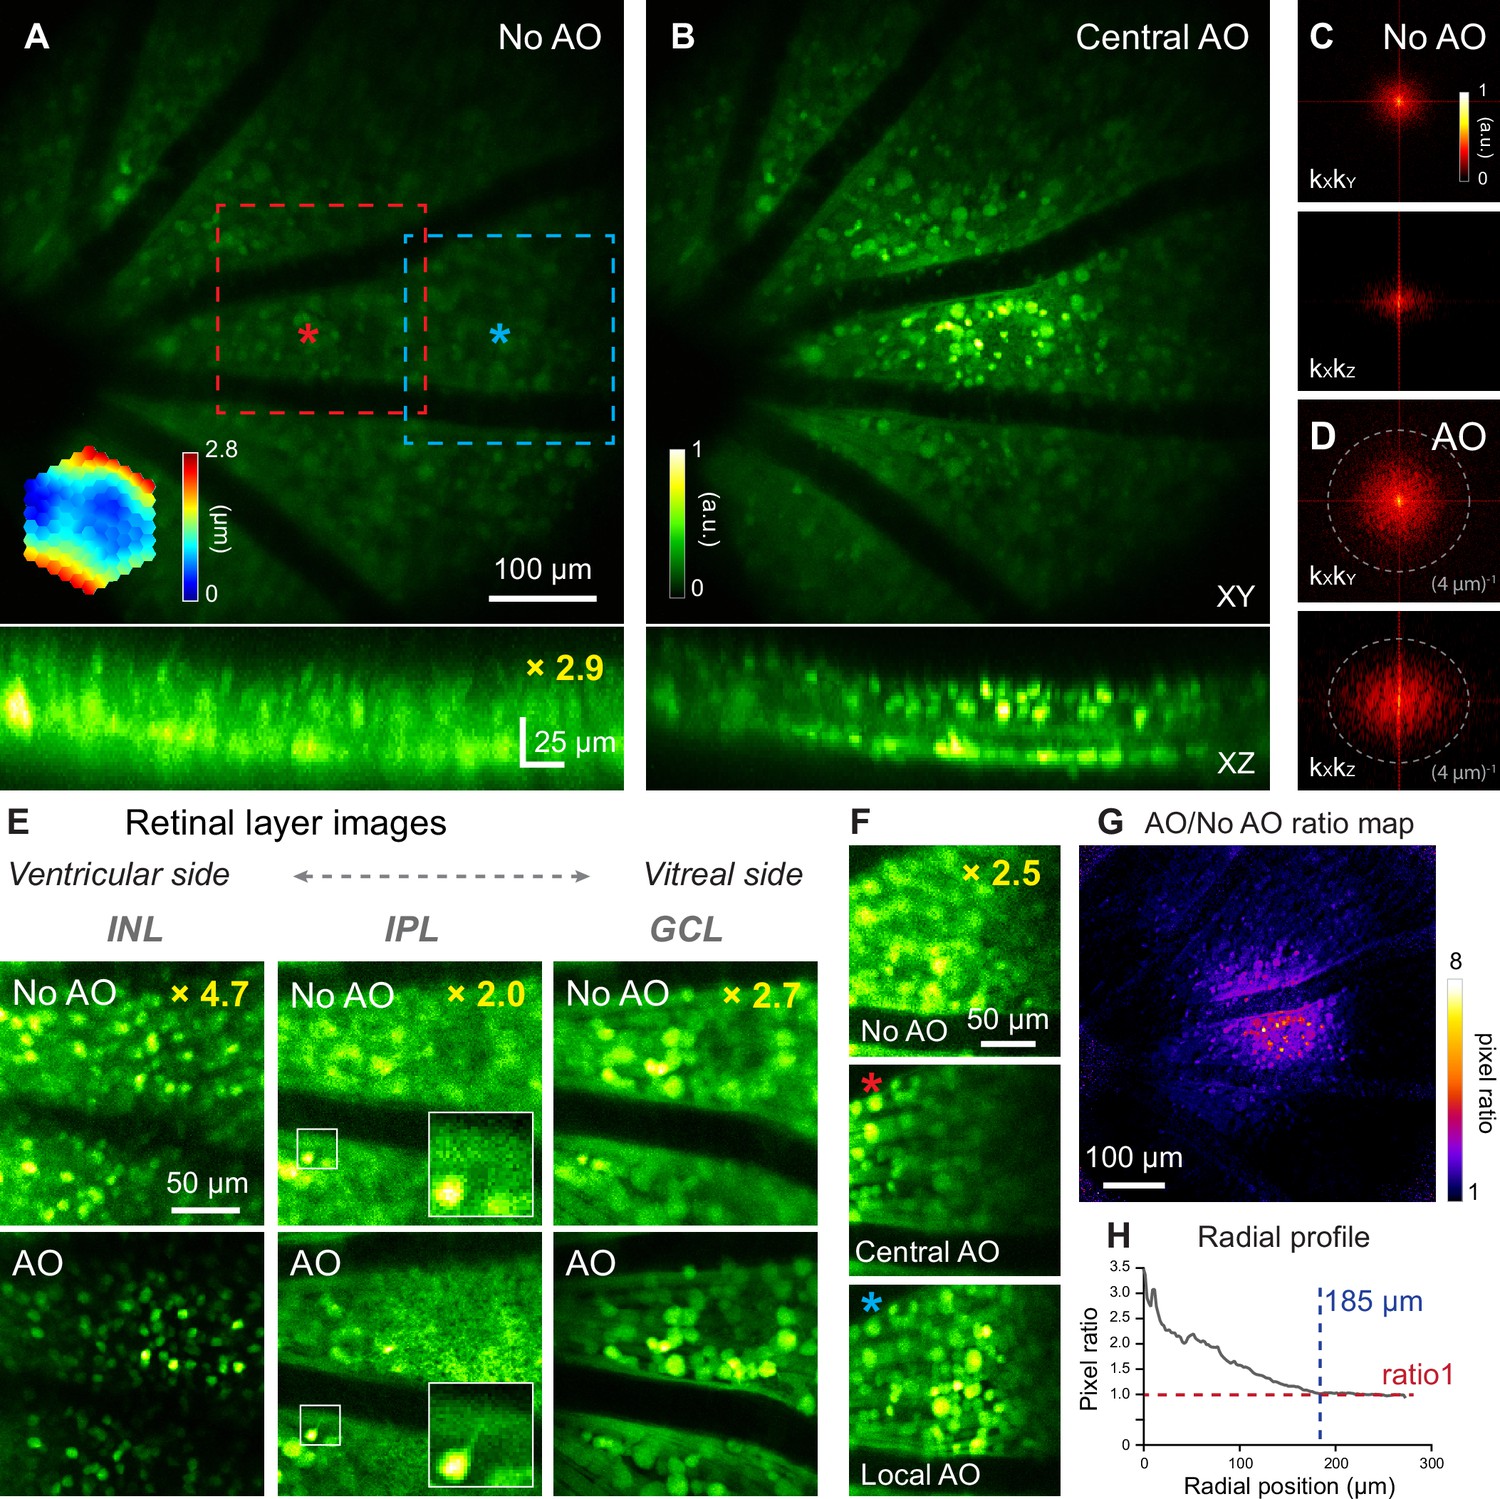
(A,B) MIPs of image stacks (580×580×80 µm3) of a Thy1-YFP-16 retina, measured (A) without and (B) with AO, respectively, normalized to AO images. Red asterisk: center of a 19×19 µm2 WS area. Top: lateral (XY) MIPs. Bottom: axial (XZ) MIPs; ‘No AO’ image brightness artificially increased by 2.9× for visualization. Representative data from>10 experiments (technical replicates). (C,D) kXkY and kXkZ spatial frequency space representation of images in (A,B). (E) Images of different retinal layers within the red dashed box in A acquired (top) without and (bottom) with AO, respectively, normalized to AO images. INL: inner nuclear layer; IPL: inner plexiform layer; GCL: ganglion cell layer. INL/GCL: MIPs of 4.9/7.8-µm-thick image stacks; IPL: single image plane. ‘No AO’ image brightness artificially increased for visualization (gains shown in each image). White boxes: zoomed-in views. (F) Single image planes in GCL at FOV edge (blue dashed box in A) acquired (top) without AO, (middle) with central AO (WS area centered at red asterisk in A), and (bottom) with local AO (WS area centered at blue asterisk in A), respectively. Images normalized to local AO image. ‘No AO’ image brightness artificially increased by 2.5× for visualization. (G) AO/No AO pixel ratio map. (H) Radially averaged profile of pixel ratio map, centered at red asterisk in A.
-
Figure 3—source data 1
Source image stacks of retinal neurons (Figure 3A and B).
‘1-NoAO_60_84_8fAvg.tif’ (No AO) and ‘2-AO_60_84_8fAvg.tif’ (AO).
- https://cdn.elifesciences.org/articles/84853/elife-84853-fig3-data1-v1.zip
-
Figure 3—source data 2
Source image stacks of retinal neurons (Figure 3E).
‘1-NoAO_8fAvg_stack.tif’ (No AO) and ‘2-AO_8fAvg_stack.tif’ (AO).
- https://cdn.elifesciences.org/articles/84853/elife-84853-fig3-data2-v1.zip
-
Figure 3—source data 3
Source image stacks of retinal neurons (Figure 3F).
‘1-central_AO_20_28_8fAvg.tif’ (Central AO) and ‘2-local_AO_20_28_8fAvg.tif’ (Local AO).
- https://cdn.elifesciences.org/articles/84853/elife-84853-fig3-data3-v1.zip
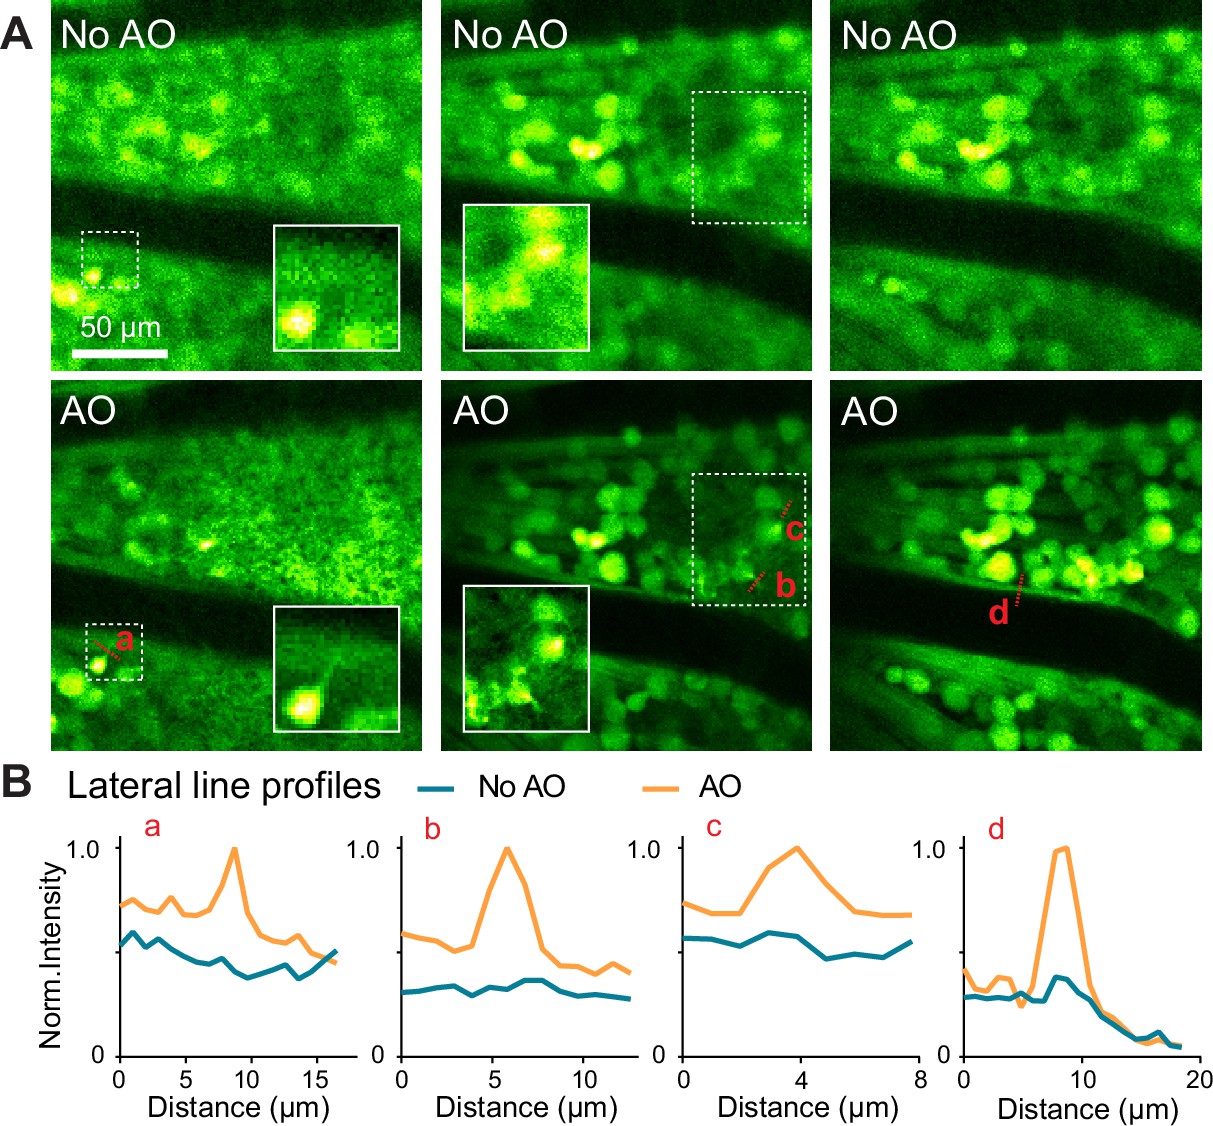
Figure 3—figure supplement 1
AO improves the visualization of subcellular features in vivo.
(A) Lateral images of neurons in a Thy1-YFP-16 retina, measured (top) without and (bottom) with AO, respectively. Insets with white borders highlight the subcellular features within the white dashed boxes. All images are individually normalized to increase visibility. (B) Signal profiles along red dashed lines in A.
Figure 3—video 1
In vivo 2-photon image stacks of retinal neurons in a Thy1-YFP-16 mouse measured without and with AO.
Same data as shown in Figure 3A, B and E. Image volume: 580×580×80 µm3/193×193×50 µm3; Z step: 1.63/0.98 µm.
Figure 4

Larger WS areas enlarges the effective region of AO correction for 3D cellular resolution imaging.
(A) Top: AO/NoAO pixel ratio maps for corrections with differently sized WS areas (yellow dashed boxes; i, 19×19 µm2; ii, 95×95 µm2; iii, 190×190 µm2; iv, 380×380 µm2). Bottom: (for [i]) corrective wavefront and (for [ii-iv]) difference in wavefronts between [ii-iv] corrective wavefronts and [i] corrective wavefront. (B) Radially averaged profiles of pixel ratio maps in (A). Insets: zoomed-in views of shaded areas. (C) Single image planes acquired (top) from INL and (bottom) GCL without and with AO using corrective wavefronts [i-iv], respectively. Insets: zoomed-in views of areas at FOV (a) center and (b,c) edge. All images normalized to AO images (AO [i] for inset a; AO [iv] for inset b,c). (D) Lateral (along red dashed lines) and axial (at the center of the neurons indicated by orange arrows) profiles of neurons in the (a) central and (b) edge regions.
-
Figure 4—source data 1
Source image stacks with AO by measuring aberrations with different wavefront sensing areas.
‘No AO’ stack: ‘1_NoAO_9fAvg_stack.tif’‘AO [i]’ stack: ‘2_AO[i]_2_2.8_9fAvg_stack.tif’ ‘AO [ii]’ stack: ‘3_AO[ii]_10_14_9fAvg_stack.tif’ ‘AO [iii]’ stack: ‘4_AO[iii]_20_28_9fAvg_stack.tif’ ‘AO [iv]’ stack: ‘5_AO[iv]_40_56_9fAvg_stack.tif’.
- https://cdn.elifesciences.org/articles/84853/elife-84853-fig4-data1-v1.zip
Figure 5 with 5 supplements
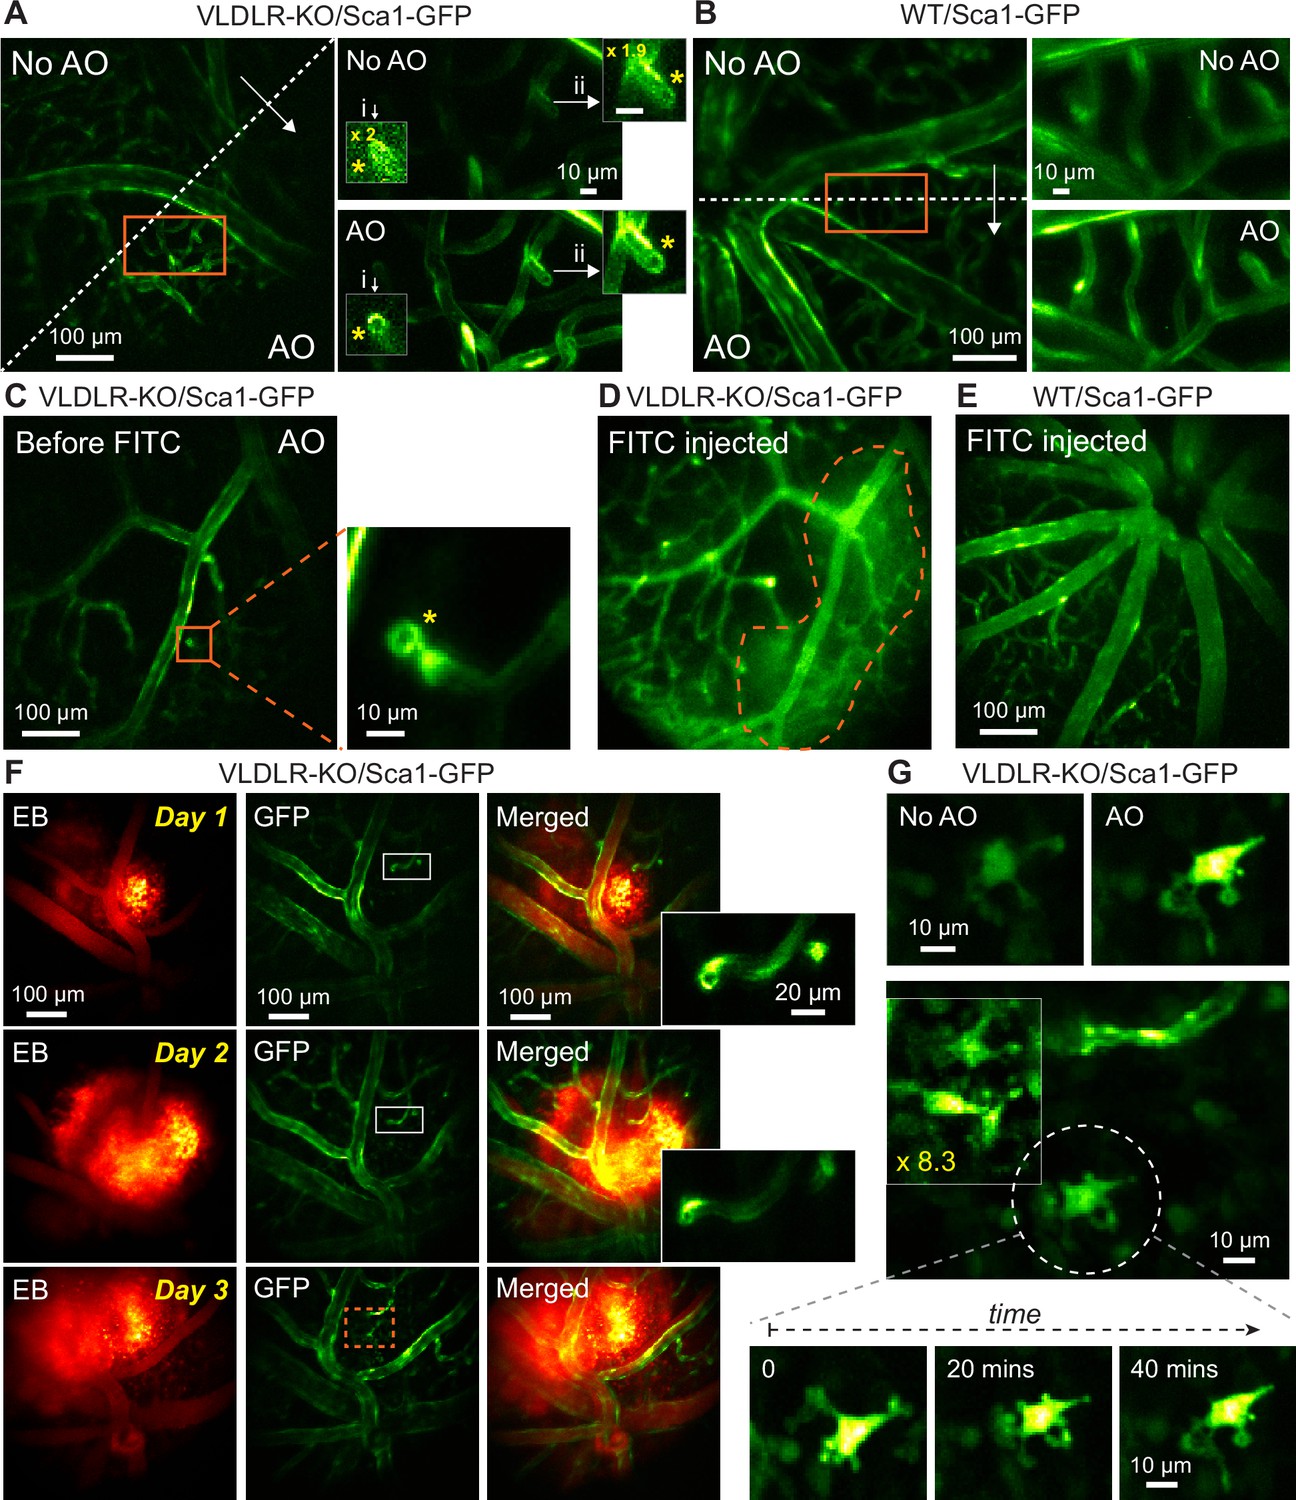
In vivo vasculature imaging in pathological and healthy retinas.
(A,B) Left: MIPs of image stacks of (A) VLDLR-KO/Sca1-GFP (580×580×94 µm3) and (B) WT/Sca1-GFP (520×520×120 µm3) mouse retinas, measured (arrow start) without and (arrow end) with AO. Asterisks: capillary disruptions. Insets: zoomed-in views individually normalized for better visualization. ‘No AO’ inset brightness artificially increased for visualization (gains shown in inset). (C) A single image plane of a VLDLR-KO/Sca1-GFP mouse retina before FITC injection. Inset: MIP of a zoomed-in image stack (58×58×8.2 µm3) showing capillary lesion (orange box). (D) The same FOV in (C) after FITC injection. Dashed region: area with heightened fluorescence outside the vasculature. (E) MIP of an image stack (580×580×150 µm3) of a WT/Sca1-GFP mouse retina after FITC injection. (F) Retinal images taken on (top) day 1, (middle) day 2, and (bottom) day 3 after Evans Blue (EB) injection. Left: near-infrared channel showing EB-labeled vasculature and tissue staining (MIP of a 580×580×166 µm3 volume). Middle: green channel showing GFP-labeled vasculature (single planes). Right: merged images. Insets: zoomed-in views of white boxes within the GFP images. (G) Microglia observed in EB-injected VLDLR-KO/Sca1-GFP mouse retina on day 3 near the lesion site (orange dashed box in F). Top: microglia imaged without and with AO. Middle: multiple microglia in the leaking region. Signal in the boxed region was artificially increased by 8.3× for visualization. Bottom: time-lapse images of the microglia in white dashed circle. All images are single planes. Wavefront sensing area: 19×19 µm2. In vivo data in this Figure were obtained from 3 VLDLR-KO and 2WT mice (biological replicates).
-
Figure 5—source data 1
Source image stacks of VLDLR-KO/Sca1-GFP mouse retina (Figure 5A, full FOV).
‘1-NoAO_8fAvg_60_84_stack.tif’ (No AO) and ‘2-AO_8fAvg_60_84_stack.tif’ (AO). Source image stacks of VLDLR-KO/Sca1-GFP mouse retina (Figure 5A, zoomed-in view). ‘3-NoAO_20_28_8fAvg_stack.tif’ (No AO) and ‘4-AO_20_28_8fAvg_stack.tif’ (AO).
- https://cdn.elifesciences.org/articles/84853/elife-84853-fig5-data1-v1.zip
-
Figure 5—source data 2
Source image stacks of WT/Sca1-GFP mouse retina (Figure 5B, full FOV).
‘1-NoAO_60_84_Stack.tif’ (No AO) and ‘2-AO_60_84_Stack.tif’ (AO). Source image stacks of WT/Sca1-GFP mouse retina (Figure 5B, zoomed-in view). ‘3-NoAO_20_28_stack.tif’ (No AO) and ‘4-AO_reged_8fAvg_stack.tif’ (AO).
- https://cdn.elifesciences.org/articles/84853/elife-84853-fig5-data2-v1.zip
-
Figure 5—source data 3
Source image stacks of VLDLR-KO/Sca1-GFP mouse retina (Figure 5C, full FOV).
‘1-AO_8fAvg_stack.tif’. Source image stacks of VLDLR-KO/Sca1-GFP mouse retina (Figure 5C, zoomed-in view). ‘2-AO_zoomin_8fAvg_stack.tif’.
- https://cdn.elifesciences.org/articles/84853/elife-84853-fig5-data3-v1.zip
-
Figure 5—source data 4
Source image stack of VLDLR-KO/Sca1-GFP mouse retina after FITC injection (Figure 5D).
‘1-NoAO-8fAvg_stack.tif’.
- https://cdn.elifesciences.org/articles/84853/elife-84853-fig5-data4-v1.zip
-
Figure 5—source data 5
Source image stack of WT/Sca1-GFP mouse retina after FITC injection (Figure 5E).
‘1-NoAO-8fAvg_stack.tif’.
- https://cdn.elifesciences.org/articles/84853/elife-84853-fig5-data5-v1.zip
-
Figure 5—source data 6
Source image stacks of VLDLR-KO/Sca1-GFP mouse retina after EB injection (Figure 5F).
Day 1: ‘1A-Day1-NIR_EB_8fAvg_stack.tif’ and ‘1B-Day1-GFP_60_84_8fAvg_stack.tif’ Day 2: ‘2A-Day2-NIR_EB_8fAvg_stack.tif’ and ‘2B-Day2-GFP_60_84_8fAvg_stack.tif’ Day 3: ‘3A-Day3-NIR_EB_8fAvg_stack.tif’ and ‘3B-Day3-GFP_60_84_8fAvg_stack.tif’ Source image stacks of microglia (Figure 5G). ‘4A-Day3-microglia_t=0.tif’, ‘4B-Day3-microglia_t=20.tif’, and ‘4C-Day3-microglia_t=40.tif’.
- https://cdn.elifesciences.org/articles/84853/elife-84853-fig5-data6-v1.zip
Figure 5—figure supplement 1
Ex vivo 2PFM imaging of dissected VLDLR-KO/Sca1-GFP and WT/Sca1-GFP mouse retinas.
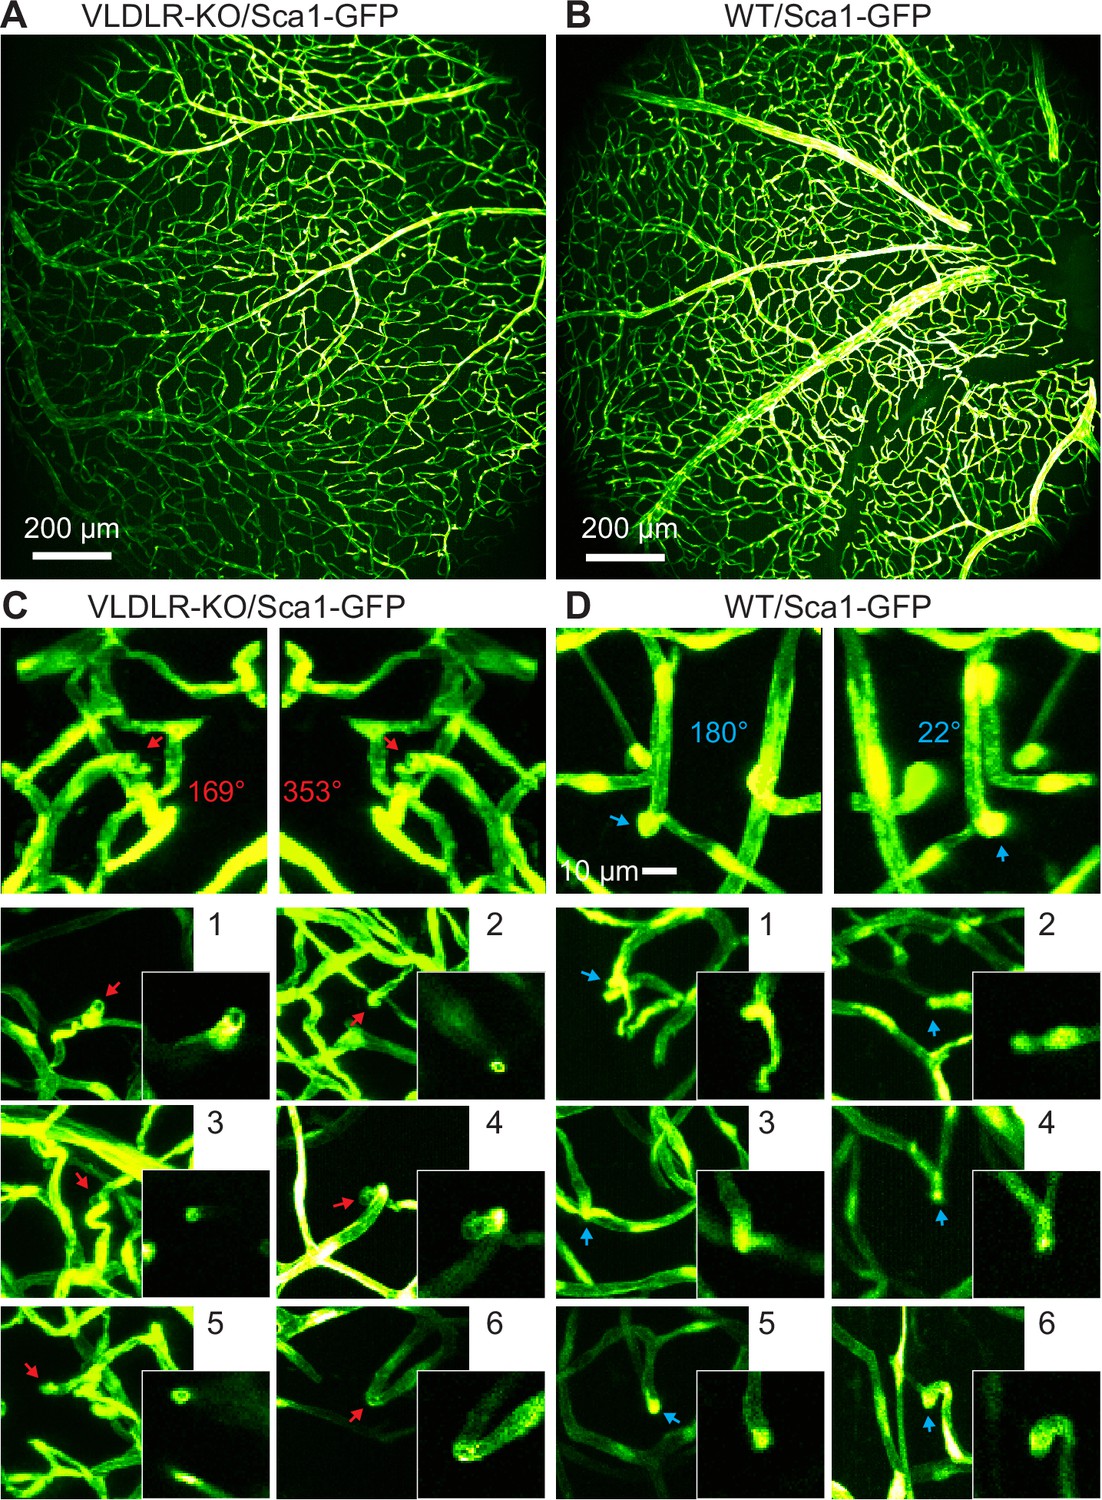
(A,B) Ex vivo MIPs of image stacks from (A) VLDLR-KO/Sca1-GFP (1380×1380×82 µm3) and (B) WT/Sca1-GFP (1380×1380×71 µm3) mouse retinas. (C) Top: 3D projected view of an example capillary lesion (red arrow) displayed at viewing angles of 169° and 353°, respectively. Bottom: MIPs of 6 more FOVs showing capillary disruptions (red arrows). Insets: single-plane zoomed-in images. (D) Top: 3D projected view of an example normal capillary (blue arrow) displayed at viewing angles of 180° and 22°, respectively. Bottom: MIPs of 6 more FOVs showing normal capillary structures (blue arrows). Insets: single-plane zoomed-in images. Image contrast was adjusted individually for better visualization.
Figure 5—figure supplement 2
In vivo AO-2PFM imaging of Evans Blue (EB) leakage in healthy retina.
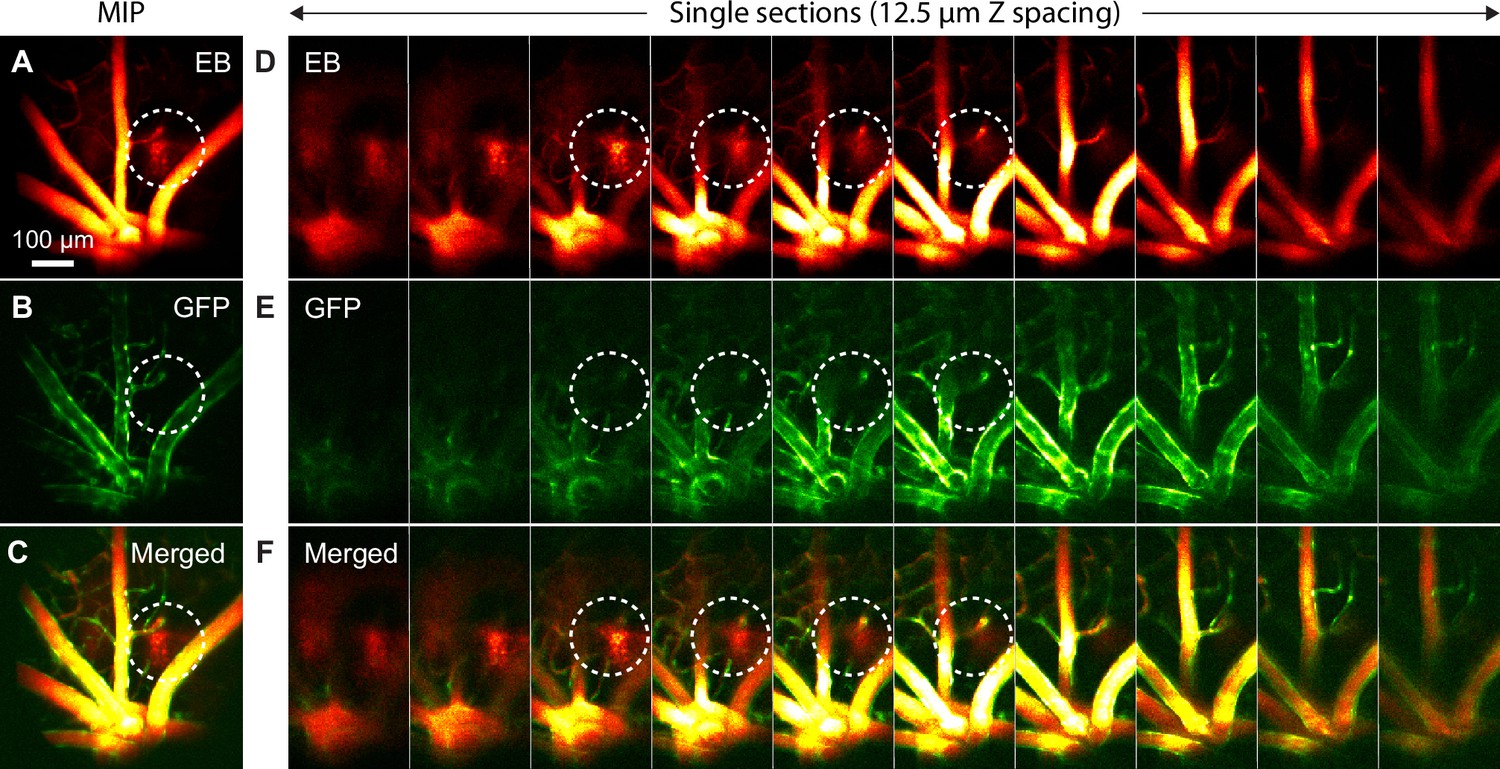
(A–C) MIPs of image stacks of (580×580×130 µm3) WT/Sca1-GFP retina measured in the (A) near-infrared EB and (B) green GFP channels, and (C) merged images. (D–F) Single-plane images from (A–C) with 12.5 µm Z step. White dashed circles: EB leakage areas.
Figure 5—video 1
In vivo two-photon image stacks of abnormal retinal capillaries in a VLDLR-KO/Sca1-GFP mouse measured without and with AO.
Same data as shown in Figure 5A. Image volume: 48×48×65 µm3; Z step: 3.26 µm.
Figure 5—video 2
Ex vivo two-photon image stacks of abnormal capillaries in dissected VLDLR-KO/Sca1-GFP mouse retinas.
Same data as shown in Figure 5—figure supplement 1A and C. Image volume: 1380×1380×82 µm3 / 78×78×82 µm3; Z step: 0.5 µm.
Figure 5—video 3
Ex vivo two-photon image stacks of normal capillaries in dissected WT/Sca1-GFP mouse retinas.
Same data as shown in Figure 5—figure supplement 1B and D. Image volume: 1380×1380×71 µm3/78×78×71 µm3; Z step: 0.5 µm.
Figure 6 with 1 supplement
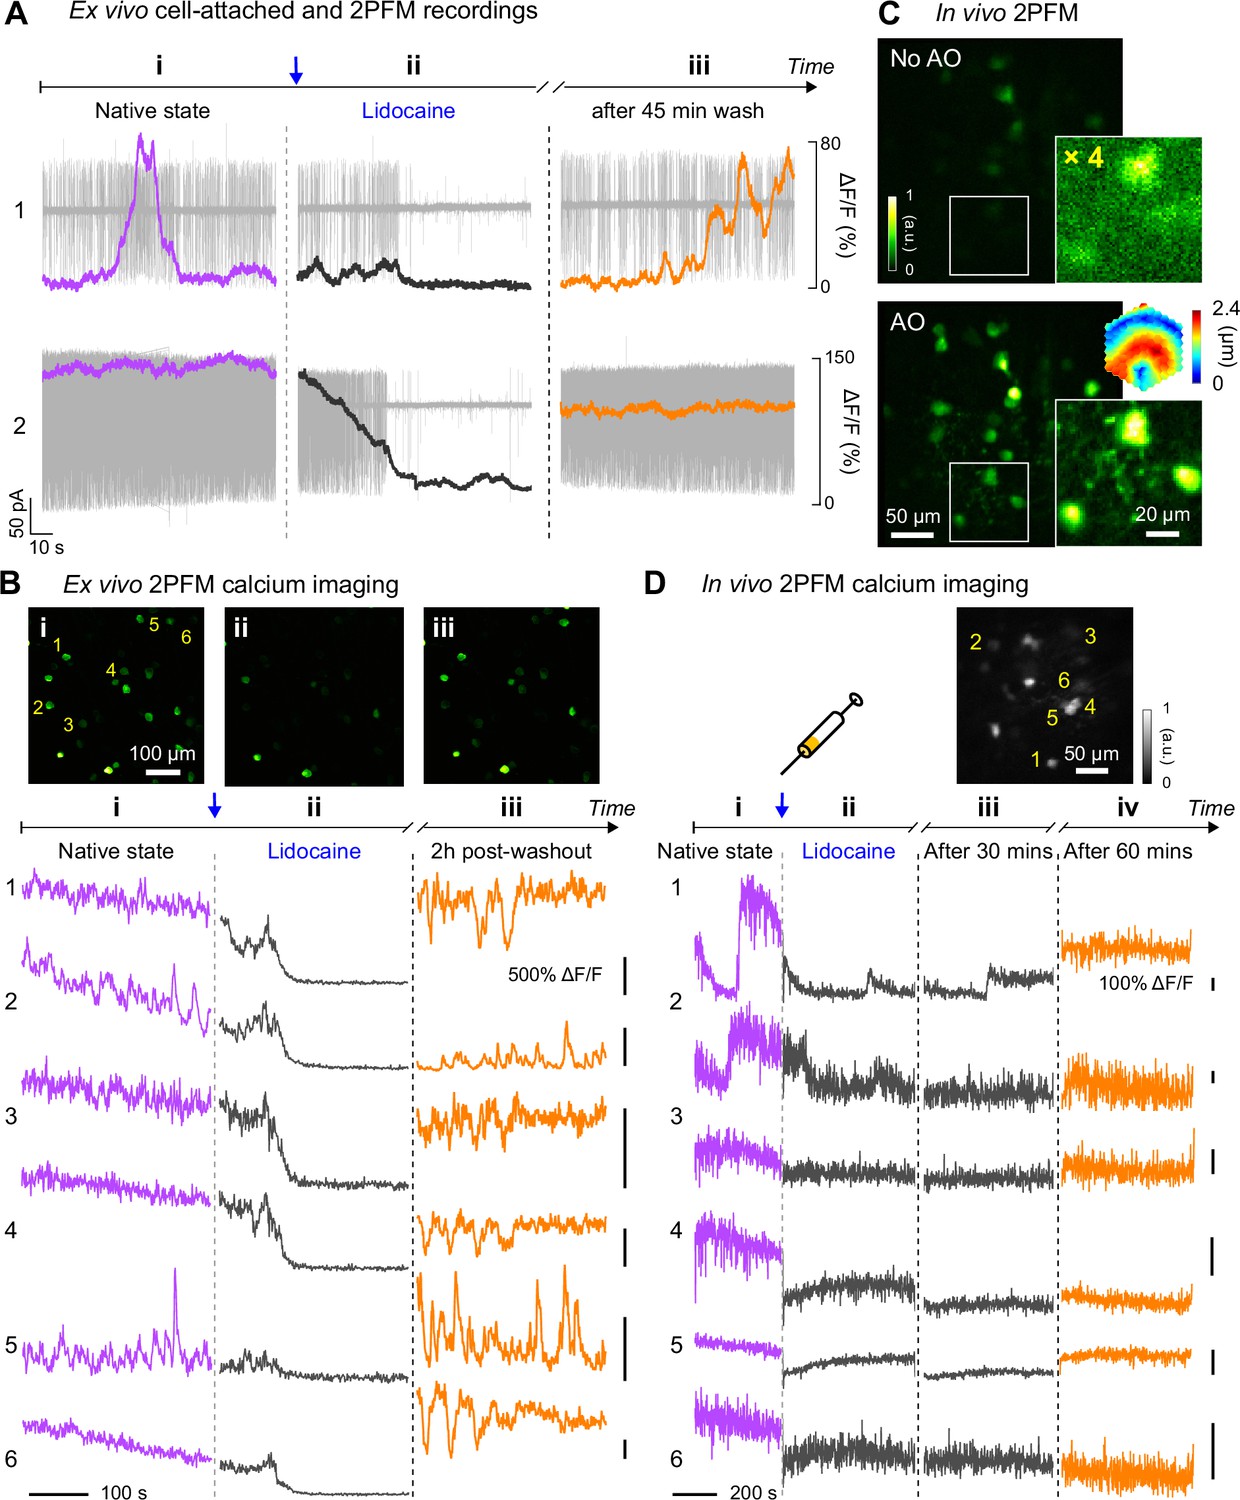
In vivo calcium imaging of Lidocaine-suppressed RGC hyperactivity in rd1-Thy1-GCaMP6s mouse retina.
(A) Simultaneous cell-attached and 2PFM calcium recordings of two RGCs before, during, and 45 min after Lidocaine treatment. Representative data from >3 cells. (B) Top: average intensity projections of ex vivo 2PFM images of RGCs in a dissected retina (i) before, (ii) right after, and (iii) 2 hr after Lidocaine treatment, normalized to the left image. Bottom: Ex vivo calcium dynamics of 6 RGCs therein. Representative data from >3 retinas. (C) In vivo single image planes of RGCs acquired without and with AO, respectively, normalized to AO images. Insets: zoomed-in views and corrective wavefront; ‘No AO’ inset brightness artificially increased by 4.0× for visualization. Representative data from >3 retinas. (D) In vivo calcium dynamics of 6 RGCs (i) before, (ii) right after, (iii) 30 minutes after, and (iv) 60 minutes after Lidocaine treatment, respectively. Wavefront sensing area: 19×19 µm2.
-
Figure 6—source data 1
Source data of ex vivo cell-attached and 2PFM recordings (Figure 6A): RGC #1.
‘1A-RGC1_before-and-during_lidocaine.tiff’ and ‘1A-RGC1_before-and-during_lidocaine.mat’ ‘1B-RGC1_lidocaine-washout.tiff’ and ‘1B-RGC1_lidocaine-washout.mat’ RGC #2. ‘2A-RGC2_before-and-during_lidocaine.tiff’ and ‘2A-RGC2_lidocaine-washout.mat’ ‘2B-RGC2_lidocaine-washout.tiff’ and ‘2B-RGC2_lidocaine-washout.mat’.
- https://cdn.elifesciences.org/articles/84853/elife-84853-fig6-data1-v1.zip
-
Figure 6—source data 2
Source image sequences of ex vivo 2PFM calcium imaging (Figure 6B).
‘1-Sequence-i.tif’, ‘2-Sequence-ii.tif’, and ‘3-Sequence-iii.tif’.
- https://cdn.elifesciences.org/articles/84853/elife-84853-fig6-data2-v1.zip
-
Figure 6—source data 3
Source images of rd1-Thy1-GCaMP6s mouse retina (Figure 6C, full FOV).
‘1-NoAO-large_FOV.tif’ (No AO) and ‘2-AO-large_FOV.tif’ (AO). Source images of rd1-Thy1-GCaMP6s mouse retina (Figure 6C, zoomed-in view). ‘3-NoAO-inset.tif’ (No AO) and ‘4-AO-inset.tif’ (AO).
- https://cdn.elifesciences.org/articles/84853/elife-84853-fig6-data3-v1.zip
-
Figure 6—source data 4
Source data for in vivo 2PFM calcium imaging (Figure 6D).
‘1-pre_Lido’, ‘2-after_Lido_1 min.tif’, ‘3-after_Lido_30 mins.tif’, and ‘4-after_Lido_60 mins.tif’.
- https://cdn.elifesciences.org/articles/84853/elife-84853-fig6-data4-v1.zip
Figure 6—figure supplement 1
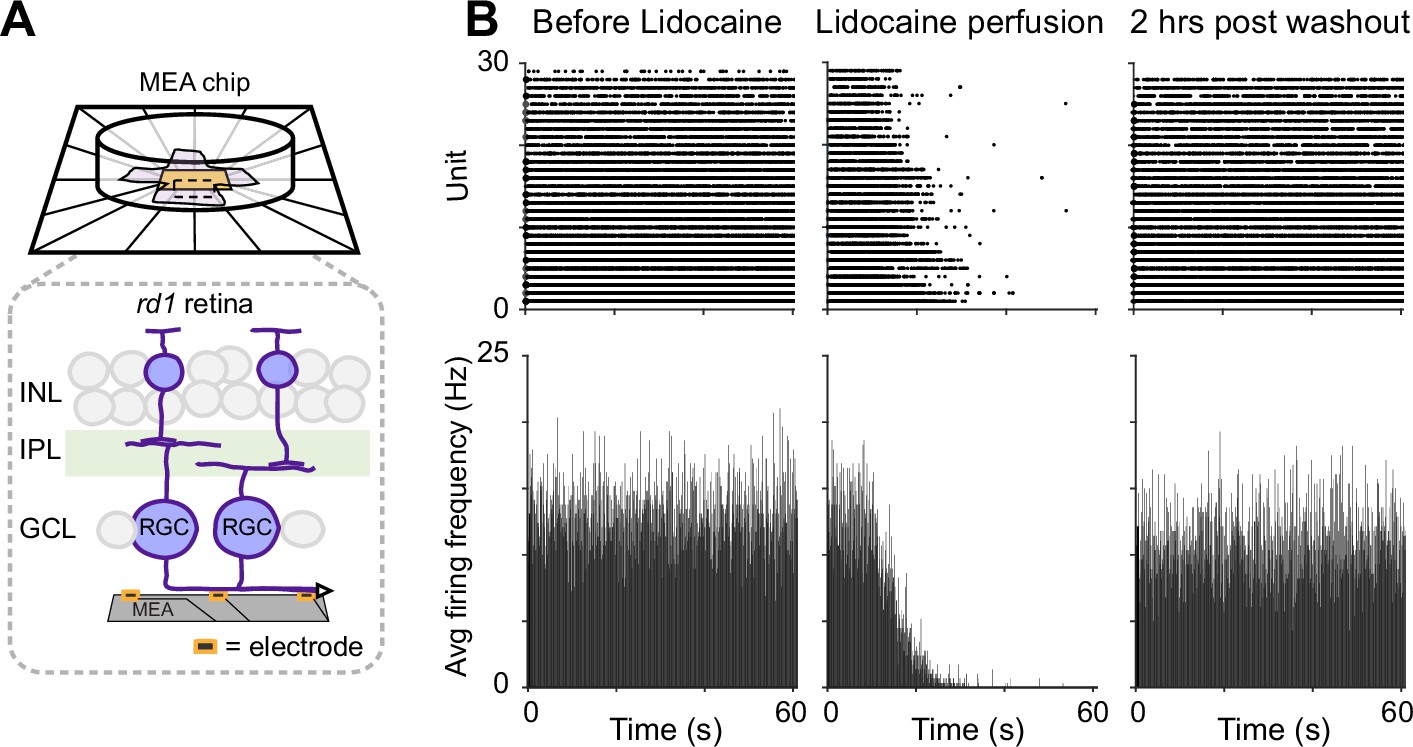
Ex vivo multielectrode array (MEA) recordings of Lidocaine-modified RGC hyperactivity in rd1-Thy1-GCaMP6s mouse retina.
(A) MEA setup for RGC spontaneous spike activity recording. Inset: illustration of retina placement relative to MEA. (B) Raster and average firing frequency plots of RGCs in dissected rd1 mouse retina (left) before and (middle) right after Lidocaine bath perfusion, and (right) 2 hr post washout, respectively.
Tables
Key resources table
| Reagent type (species) or resource | Designation | Source or reference | Identifiers | Additional information |
|---|---|---|---|---|
| Genetic reagent (M. musculus) | C57BL/6 J | Jackson Laboratory | Stock #000664 | |
| Genetic reagent (M. musculus) | B6.Cg-Tg(Thy1-YFP)16Jrs/J | Jackson Laboratory | Stock #003709 | |
| Genetic reagent (M. musculus) | B6.Cg-Tg(Ly6a-EGFP)G5Dzk/J | Jackson Laboratory | Stock #012643 | |
| Genetic reagent (M. musculus) | B6;129S7-Vldlrtm1Her/J | Jackson Laboratory | Stock #002529 | |
| Genetic reagent (M. musculus) | C3H/HeJ | Jackson Laboratory | Stock #000659 | |
| Genetic reagent (M. musculus) | C57BL/6J-Tg(Thy1-GCaMP6s) GP4.3Dkim/J | Jackson Laboratory | Stock #024275 | |
| Software, algorithm | ImageJ software | http://imagej.nih.gov/ij/ | RRID:SCR_003070 | |
| Software, algorithm | GraphPad Prism software | https://graphpad.com | RRID:SCR_015807 | |
| Software, algorithm | MATLAB | https://www.mathworks.com/products/matlab.html | RRID:SCR_001622 | |
| Chemical compound, drug | Lidocaine | Phoenix | NDC: 57319-533-05 |
Additional files
-
MDAR checklist
- https://cdn.elifesciences.org/articles/84853/elife-84853-mdarchecklist1-v1.pdf
-
Supplementary file 1
Imaging parameters for all experiments.
- https://cdn.elifesciences.org/articles/84853/elife-84853-supp1-v1.xlsx
-
Source code 1
Zemax file of the eye imaging module.
- https://cdn.elifesciences.org/articles/84853/elife-84853-code1-v1.zip
Download links
A two-part list of links to download the article, or parts of the article, in various formats.
Downloads (link to download the article as PDF)
Open citations (links to open the citations from this article in various online reference manager services)
Cite this article (links to download the citations from this article in formats compatible with various reference manager tools)
Retinal microvascular and neuronal pathologies probed in vivo by adaptive optical two-photon fluorescence microscopy
eLife 12:e84853.
https://doi.org/10.7554/eLife.84853


