ThermoMaze behavioral paradigm for assessing immobility-related brain events in rodents
- Neuroscience Institute, New York University, United States
- Princeton Neuroscience Institute, Princeton University, United States
- Department of Neurology, School of Medicine, New York University, United States
Figures
Figure 1 with 1 supplement
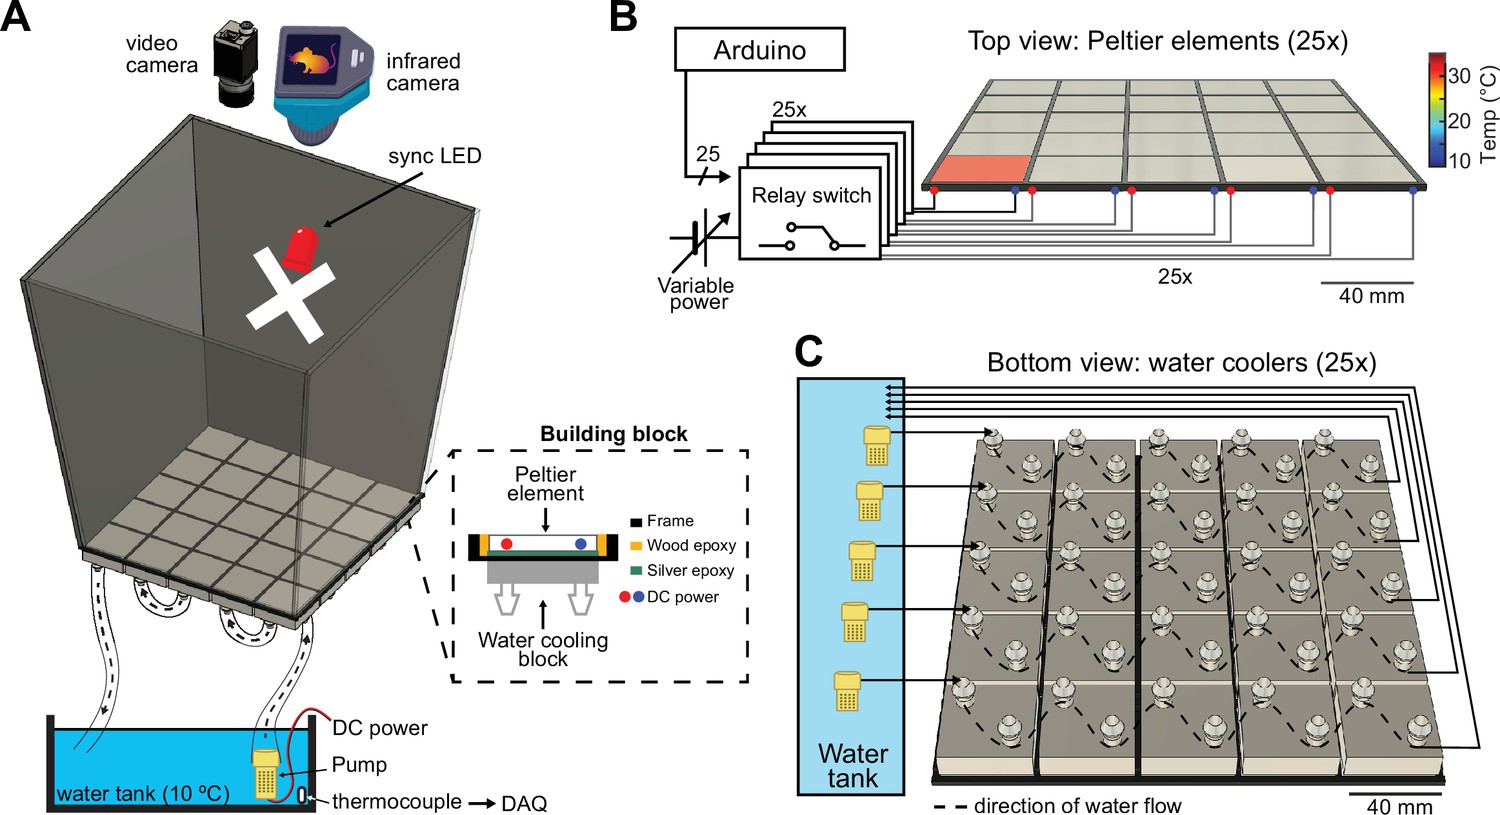
Construction and temperature control of the ThermoMaze.
(A) Schematic of the ThermoMaze. The floor was built using 25 Peltier elements attached to water-cooling block heatsinks (building block). The position of the animal and the temperature of the ThermoMaze can be recorded using a video camera and an infrared camera positioned above the box, respectively. An ‘X’ was taped inside the maze as an external cue below the camera synchronizing light-emitting diode (LED). Water circulates through the water-cooling heatsinks using a water pump submerged in a water tank (one row of heatsinks is attached to one pump). The temperature of the water tank is monitored and recorded using a thermocouple (white symbol inside water tank, DAQ – analog input of the data acquisition system). Peltier elements are connected to a power supply (red and blue dots represent the anode and cathode connection). (B) Circuit diagram and schematic of Peltier elements (n = 25), viewed from the top. TTL pulses generated by an AVR-based microcontroller board (Arduino Mega 2560) close a relay switch connected to a variable voltage power source. Each Peltier element can be independently heated (surface temperature depends on applied voltage and temperature difference between hot and cold plate of Peltier element). (C) Schematic of the water circulation cooling system, viewed from the bottom of the floor (each Peltier element has its own water-cooling aluminum heatsink, shown in silver, n = 25). Five submerging DC pumps are used to circulate water across 25 heatsinks (dashed lines show the Peltier elements connected to one pump). The temperature of the heatsink is transferred to the Peltier element passively through the silver epoxy resulting in passive cooling of the floor of the ThermoMaze.
Figure 1—figure supplement 1
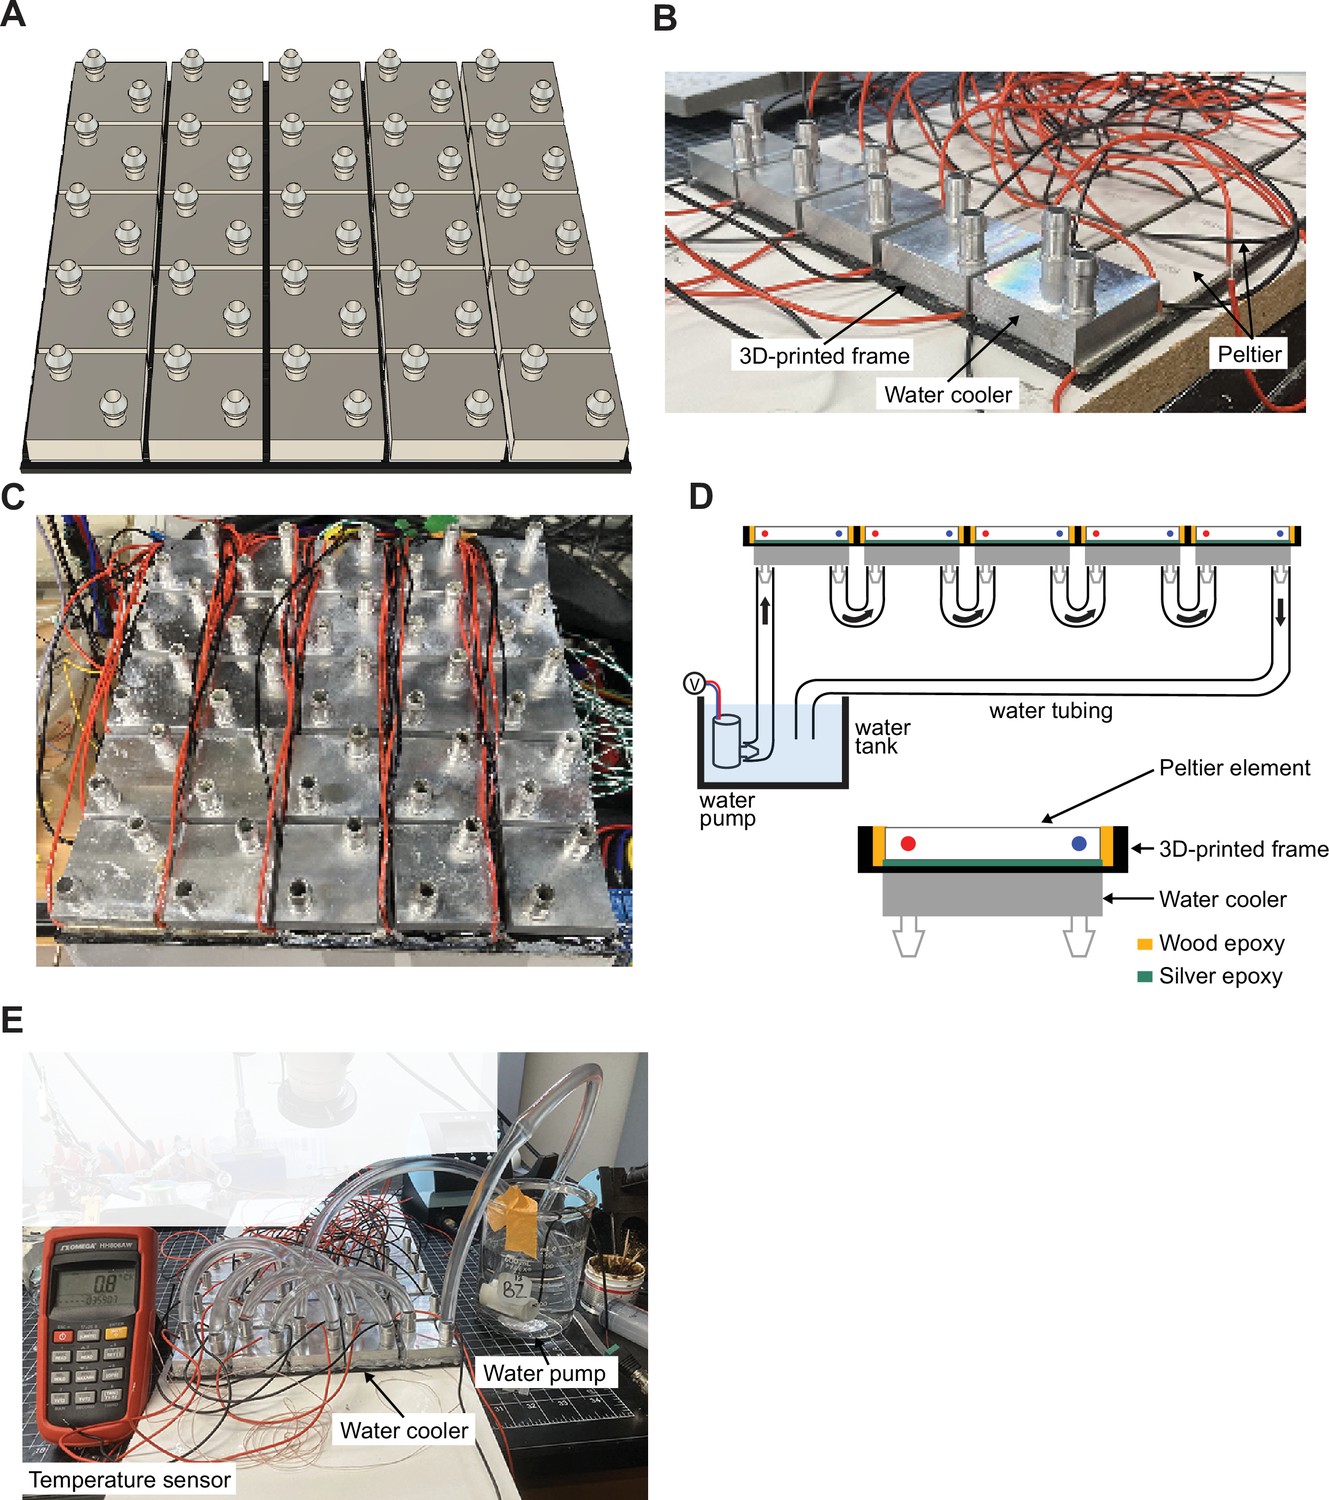
Control of heating and cooling of the surface of ThermoMaze.
(A) Schematic of water coolers (each Peltier element has its own water cooler, n = 25). (B) Photograph of ThermoMaze with all Peltier elements attached to a 3D-printed frame (bottom view). One row of water coolers (n = 5) is also attached to Peltier elements. (C) Photograph of the bottom view of the ThermoMaze showing 25 water coolers without tubing attached. (D) Schematic of water circulation system. (E) Ice-cold water circulating through the water tubes and between five water coolers and Peltier elements (turned off) can passively reduce the surface of the Peltier element to 0.8°C. The temperature is measured by a K-type thermocouple attached to the surface of the last Peltier element in a row.
Figure 2
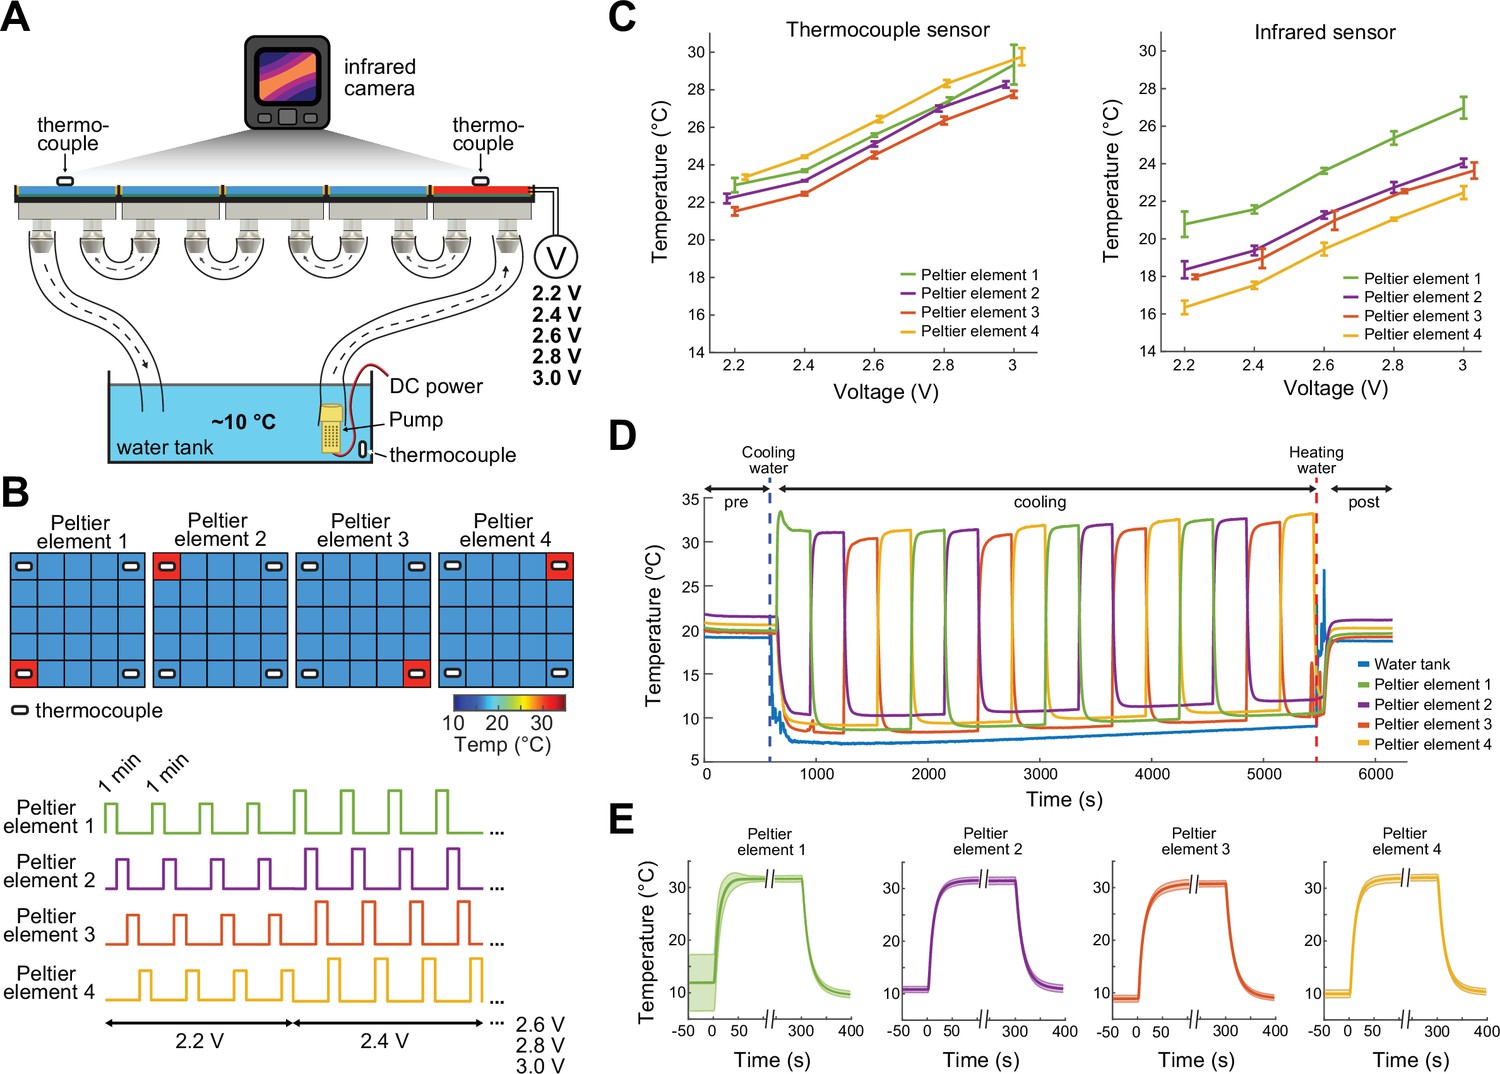
Calibration of the ThermoMaze temperature regulation.
(A) Side view of the ThermoMaze. Prior to animal experiments, we calibrated the heating and cooling performance of the Peltier elements and temperature measurement. We attached thermocouples (white symbols) to the surface of the Peltier elements serving as the ground-truth for calibrating the infrared camera placed above the ThermoMaze. Different voltage levels were used for the calibration (2.2, 2.4, 2.6, 2.8, and 3 V) while the water tank temperature was kept constant. (B) Top: four Peltier elements used in later experiments are chosen for calibration (four corners). Bottom: 1-min heating was repeated four times at each voltage level. (C) Simultaneously recorded temperature by thermocouples (left) and infrared camera (right). Increasing voltages induced increased heating (n = 4 trials per intensity, mean ± SD are shown). While the temporal dynamics yielded similar results between the two systems, we found ~4°C offset between infrared and thermocouple-measured signals. (D) Temperature changes of four Peltier elements used during an emulated behavioral session (without any animal subject) tracked by thermocouples. (E) Temporal dynamics of temperature changes at the four Peltier elements during active heating and following passive cooling. The temperature reaches steady state within 31 ± 10.3 s (mean ± SD, n = 4 trials across 4 Peltier elements).
Figure 3 with 7 supplements
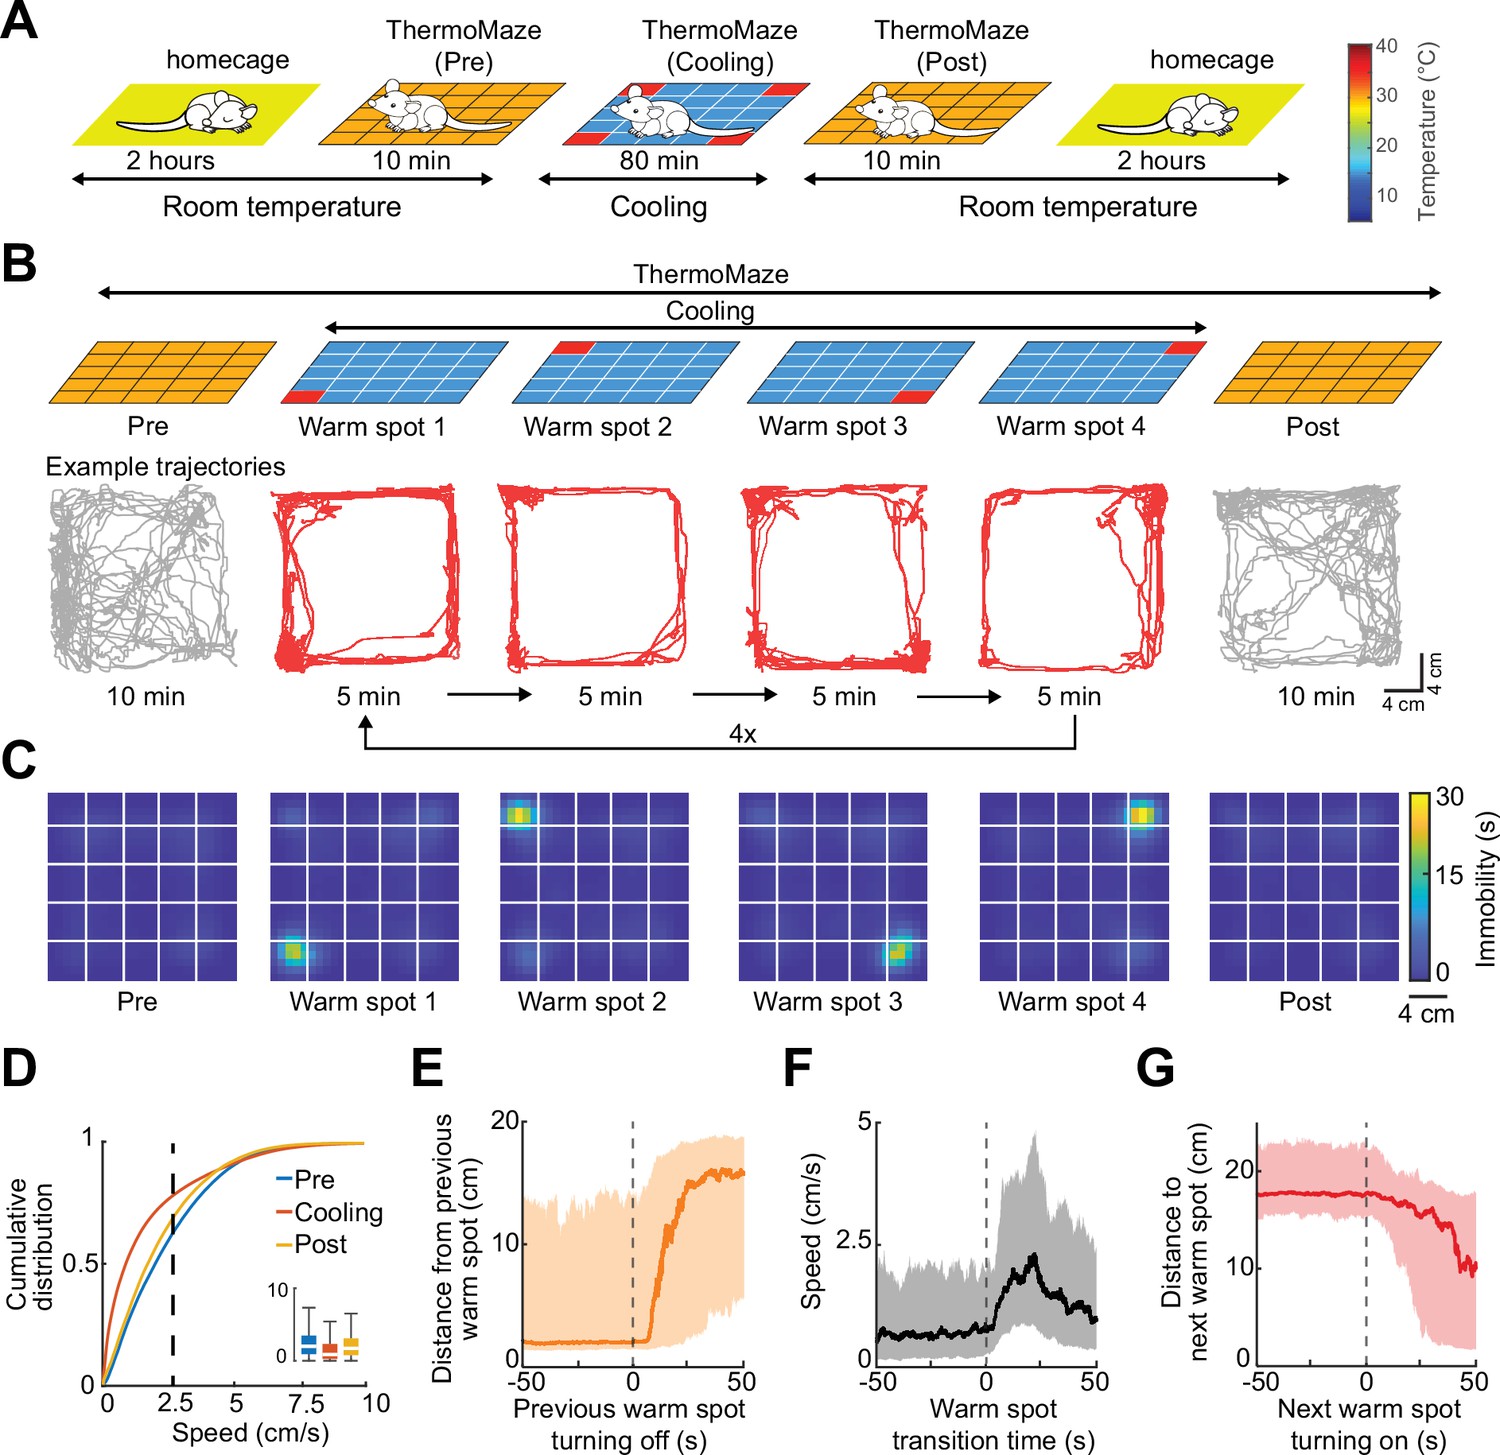
Mice track and stay immobile on hidden warm spots in the ThermoMaze.
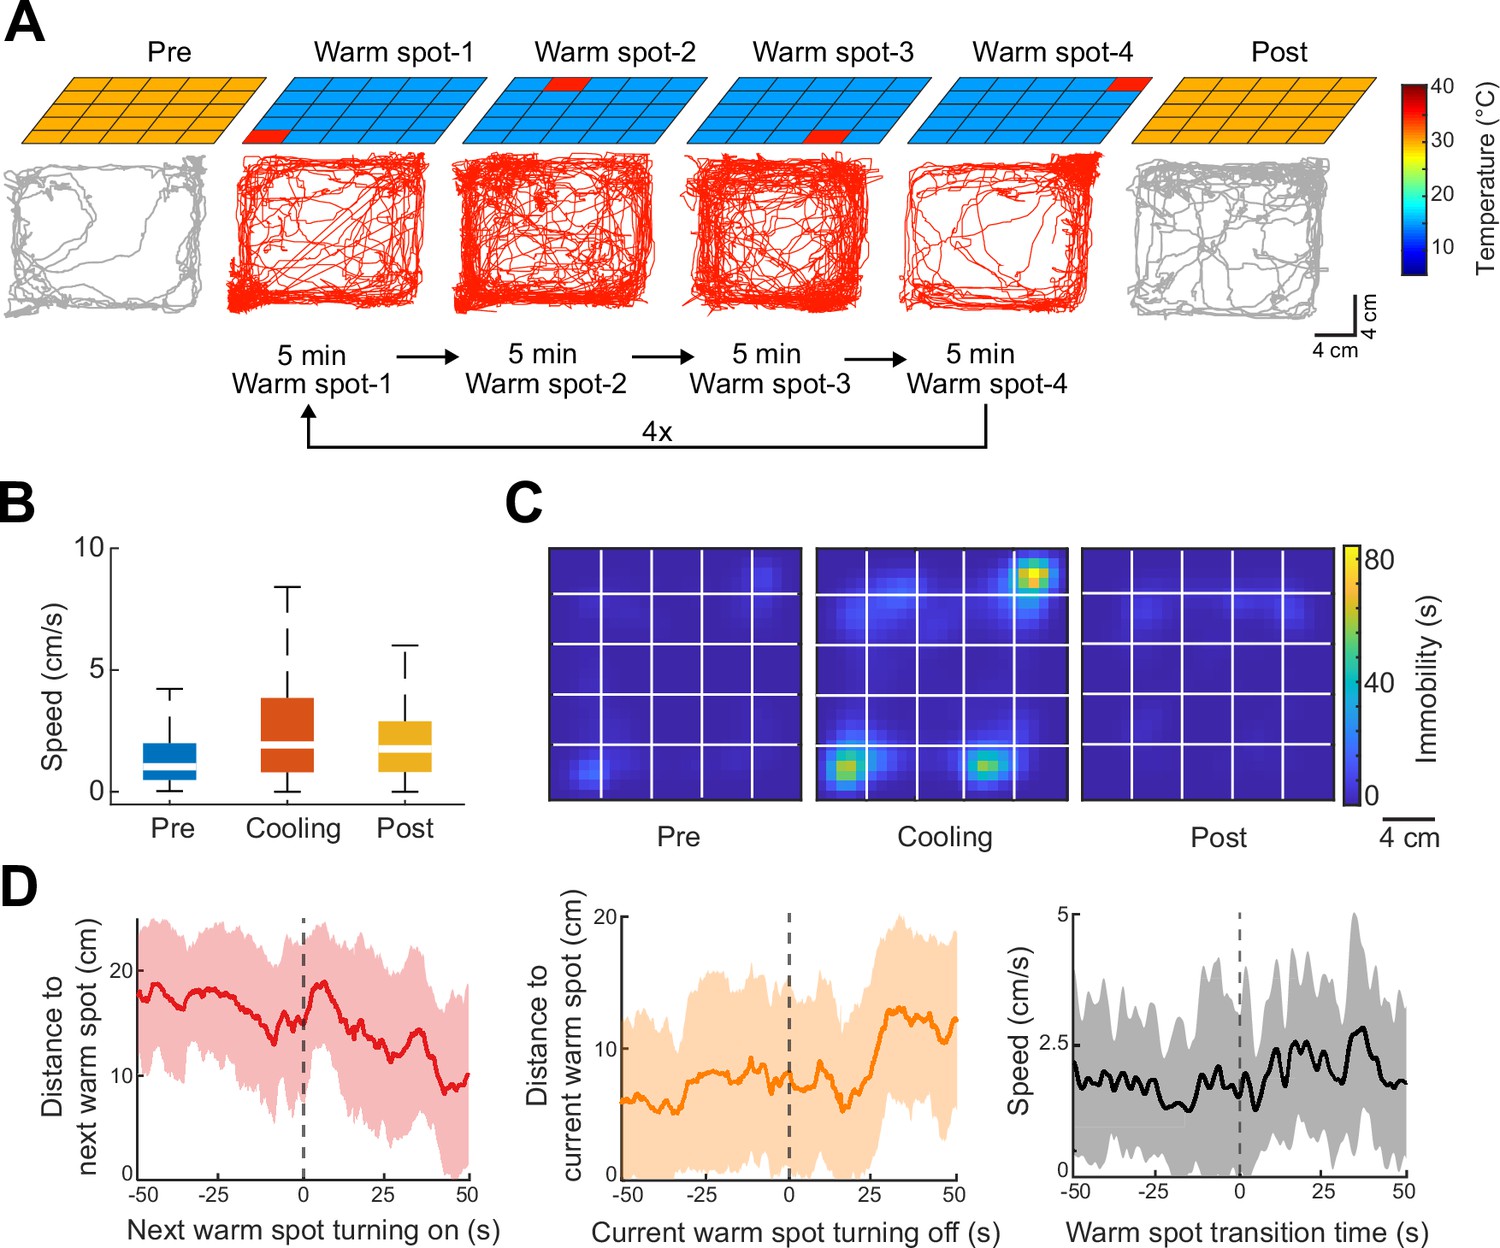
(A) Five sub-sessions (epochs) constituted a daily recording session: (1) rest epoch in the home cage, (2) pre-cooling exploration epoch (Pre), (3) Cooling, (4) post-cooling exploration epoch (Post), and (5) another rest in the home cage. (B) Schematic of temperature landscape changes when the animal is in the ThermoMaze (top) and example animal trajectory (below). During Cooling, one Peltier element always provided a warm spot for the animal (four Peltier elements in the four corners were used in this experiment). Each Peltier element was turned on for 5 min in a sequential order (1–2–3–4) and the sequence was repeated four times. (C) Session-averaged duration of immobility (speed ≤2.5 cm/s) that the animal spent at each location in the ThermoMaze; color code: temporal duration of immobility (s); white lines divide the individual Peltier elements; n = 17 session in 7 mice. (D) Cumulative distribution of animal speed in the ThermoMaze during three sub-sessions from seven mice. Median, Kruskal–Wallis test: H = 139304.10, d.f. = 2, p < 0.001. (E) Animal’s distance from the previously heated Peltier element site. (F) Speed of the animal centered around warm spot transitions. (G) Animal’s distance from the target warm spot as a function of time (red curve: median; time 0 = onset of heating). In all panels, box chart displays the median, the lower and upper quartiles (see Supplementary file 1b for exact p-values and multiple comparisons).
Figure 3—figure supplement 1
Animals learned to track and stay immobile on hidden warm spots in the ThermoMaze.
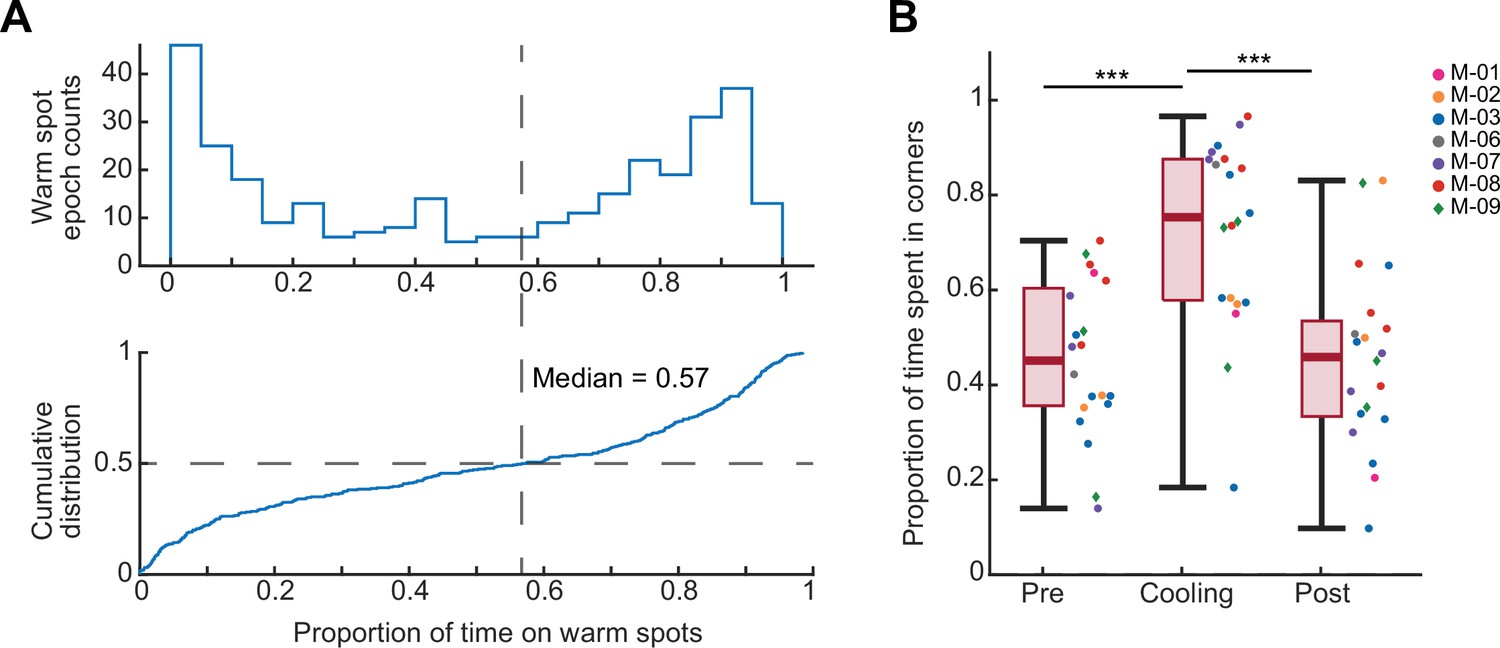
(A) Top: histogram of proportion of time spent on the warm spot during each warm spot epoch when it was providing heat. 0 indicates that the animal did not occupy the warm spot when it was turned on, and 1 indicates that the animal was staying on the warm spot for the entire warm spot epoch. Bottom: cumulative distribution of the proportion of time animal spent on the warm spot during a warm spot epoch (median = 0.57; in other word, median = 2.85 min per 5 min warm spot transition epoch). Therefore, in over 50% of the warm spot epochs, mice found and stayed on the warm spot for over 57% of the time (n = 20 sessions in n = 7 animals). (B) Box plot of the proportion of time that the animal spent in any of the four warm spot corners in the ThermoMaze. Median, Kruskal–Wallis test: H = 19.69, d.f. = 2, p = 5.29 × 10⁻⁵. The proportion of time spent in corners in pre and post and significantly different from cool (Pre vs. Cooling: p = 0.0004; Cooling vs. Post: p = 0.0003), while that of pre and post are not significantly different (Pre vs. Post: p = 0.9996). Dots (females) and diamonds (males) between the boxes represent the individual sessions and the same color represents sessions from the same animal. *p < 0.05, **p < 0.01, ***p < 0.001.
Figure 3—figure supplement 2
Brain temperature is not affected by cooling of the ThermoMaze.
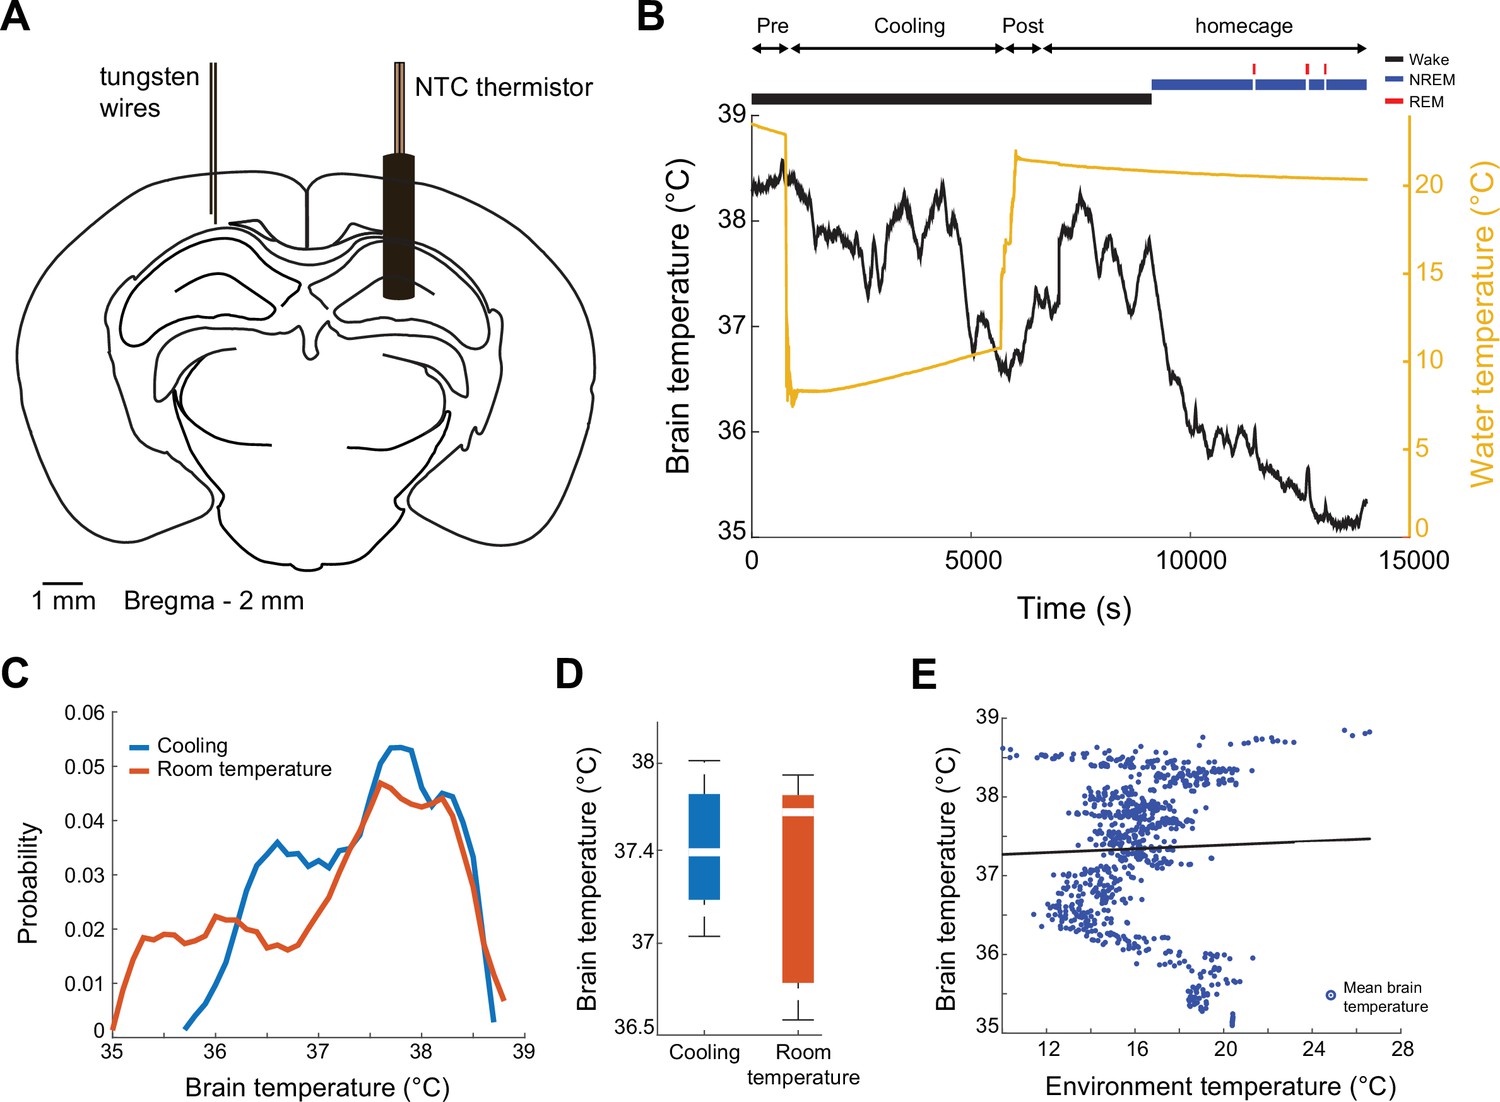
(A) Schematic of implantation of the thermistor. Mice were implanted and tungsten recording wires. (B) Brain temperature variation over time during ThermoMaze behavior (Pre, Cooling, and Post) and post homecage sleep. Note, that the temperature of the environment was reduced to 10°C during cooling (yellow line). Brain state classification is shown above the temperature curves (awake, non-rapid eye movement [NREM], and REM; black, blue, and red lines, respectively) (O’Neill et al., 2006). (C) Probability mass function of brain temperature distributions across 10 recording sessions in 2 mice. Cooling and room temperature sub-sessions are shown in blue and orange, respectively. (D) Median brain temperature during cooling and no cooling (room temperature) sessions (not significant, Kolmogorov–Smirnov test). (E) There is no correlation between brain temperature fluctuation and environmental temperature (linear regression, R = 0.03, p = 0.384; see also Petersen et al., 2022).
Figure 3—figure supplement 3
Behavior in the ThermoMaze did not alter hippocampal power spectra.
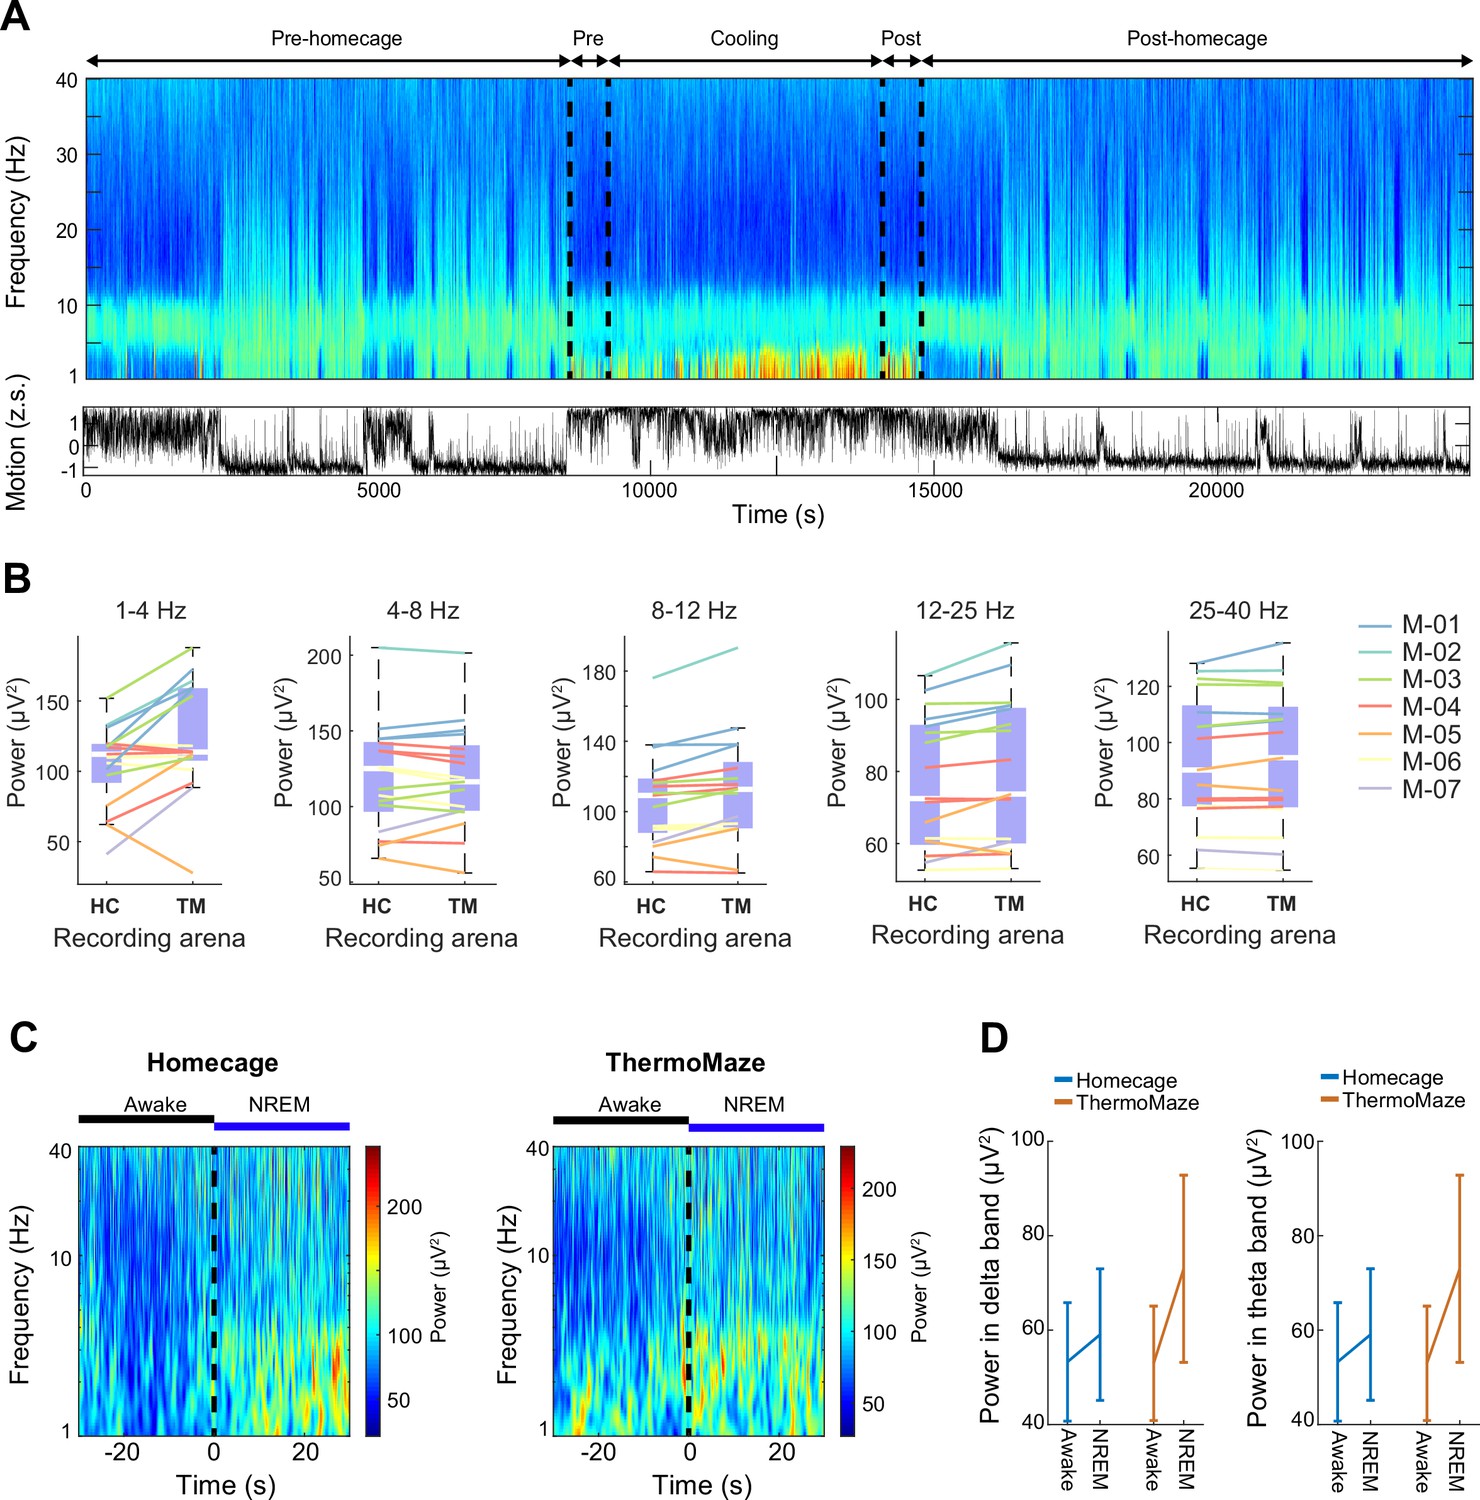
(A) Time-power analysis of hippocampal local field potentials (LFPs). LFP from the CA1 region of the hippocampus was used to calculate the time-resolved fast Fourier transform-based power spectrum (one recording site of a 64-channel silicon probe). Bottom: z-scored motion estimate based on electromyogram (EMG) activity extracted from the intracranially recorded signals (Schomburg et al., 2014). (B) Power spectra of the hippocampal LFP (1–40 Hz) were not altered in the ThermoMaze (TM) compared to homecage (HC) during wakefulness (2500 s in homecage and ThermoMaze, n = 17 sessions in 7 mice, p > 0.05, Wilcoxon rank sum test). (C) Awake–non-rapid eye movement (NREM) transitions (±30 s around the transition) triggered power spectrum (n = 7 and 8 transitions in homecage and ThermoMaze, respectively). (D) Both delta (1–4 Hz) and theta (4–8 Hz) powers were higher in the ThermoMaze following Awake–NREM transitions (n = 7 sessions in 4 mice, p > 0.05, ANOVA paired test).
Figure 3—figure supplement 4
Spatial distributions of immobility duration and SPW-Rr occurrence are more uniform during Cooling compared to room temperature.
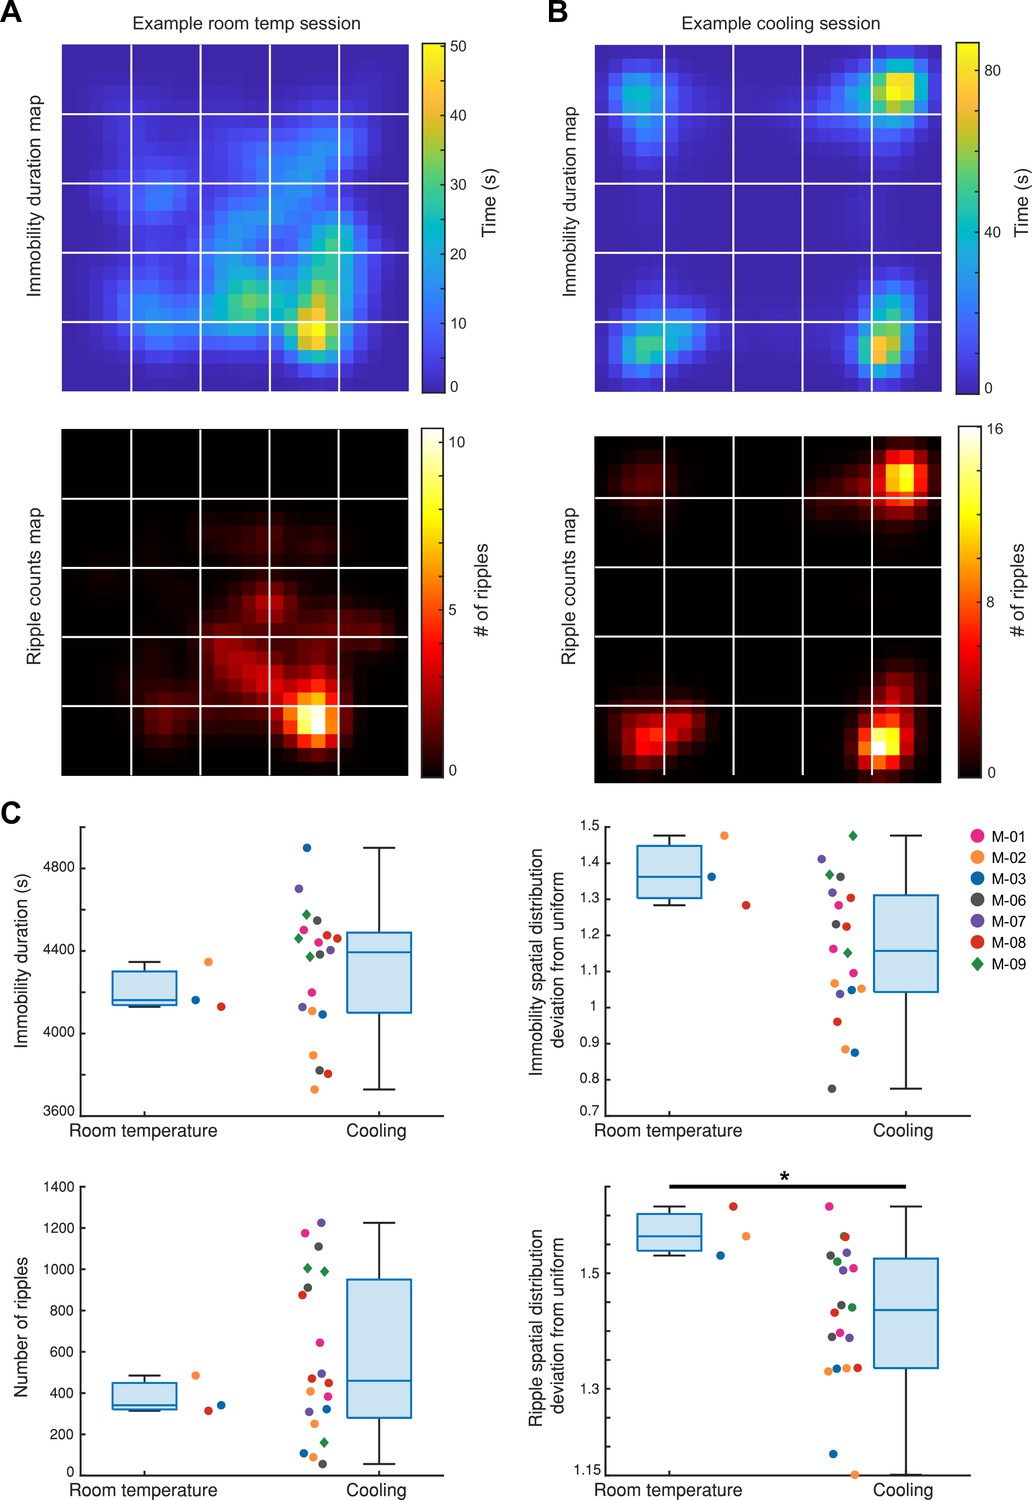
(A) Top: immobility duration map of an example session in which the animal was in the ThermoMaze under 25°C room temperature condition (Mouse_07; Immobility spatial distribution deviation from uniform score: 1.36); bottom: SPW-R counts map of the same session (SPW-R spatial distribution deviation from uniform score: 1.53). The lower spatial distribution deviation from uniform score indicates that the variable (duration/counts) is more uniformly distributed in the ThermoMaze. (B) An example Cooling sub-session (same plots as in (A), Mouse_09; Immobility spatial distribution deviation from uniform score: 1.22; SPW-R spatial distribution deviation from uniform score: 1.43). (C) Left: immobility durations within an 80-min period of free exploration of the ThermoMaze either under room temperature or during the Cooling sub-session in two groups of mice (room temperature n = 3; Cooling n = 20; p = 0.49). Right: deviation of spatial distributions of immobility epochs from a uniform distribution (p = 0.08). (D) Same plots as in (C) but for total SPW-R counts and the degree to which their spatial distributions deviates from uniform distribution (left: p = 0.62; right: p = 0.04, one-sided Wilcoxon rank sum tests). *p < 0.05, **p < 0.01, ***p < 0.001.
Figure 3—figure supplement 5
Changing the location of warm spots shape behavior.
(A) During Cooling, one of the Peltier elements provided a warm spot for the animal (four Peltier elements, two in the corners and two close to the corners were used). Each Peltier element was turned on for 5 min in a sequential order (1–2–3–4, n = 4 trials). (B) Animal speed in the ThermoMaze during Pre-cooling (Pre), Cooling, and Post-cooling (Post) sub-sessions (n = 3 sessions from n = 2 mice). (C) Session-averaged duration of immobility (n = 3 sessions in n = 2 mice, speed ≤2.5 cm/s) that the animal spent at each location in the ThermoMaze (x and y: animal location (20 × 20 cm); color: temporal duration of immobility (s); white lines represent boundaries of individual Peltier elements). (D) Left: median (curve) and first to third quartile (shaded region) across sessions of distance to the next warm spot (left panel), and distance from the previous hotspot (middle panel). Right: speed across sessions centered upon warm spot transition times (time 0).
Figure 3—figure supplement 6
Spatial tuning of hippocampal pyramidal cells in the ThermoMaze.
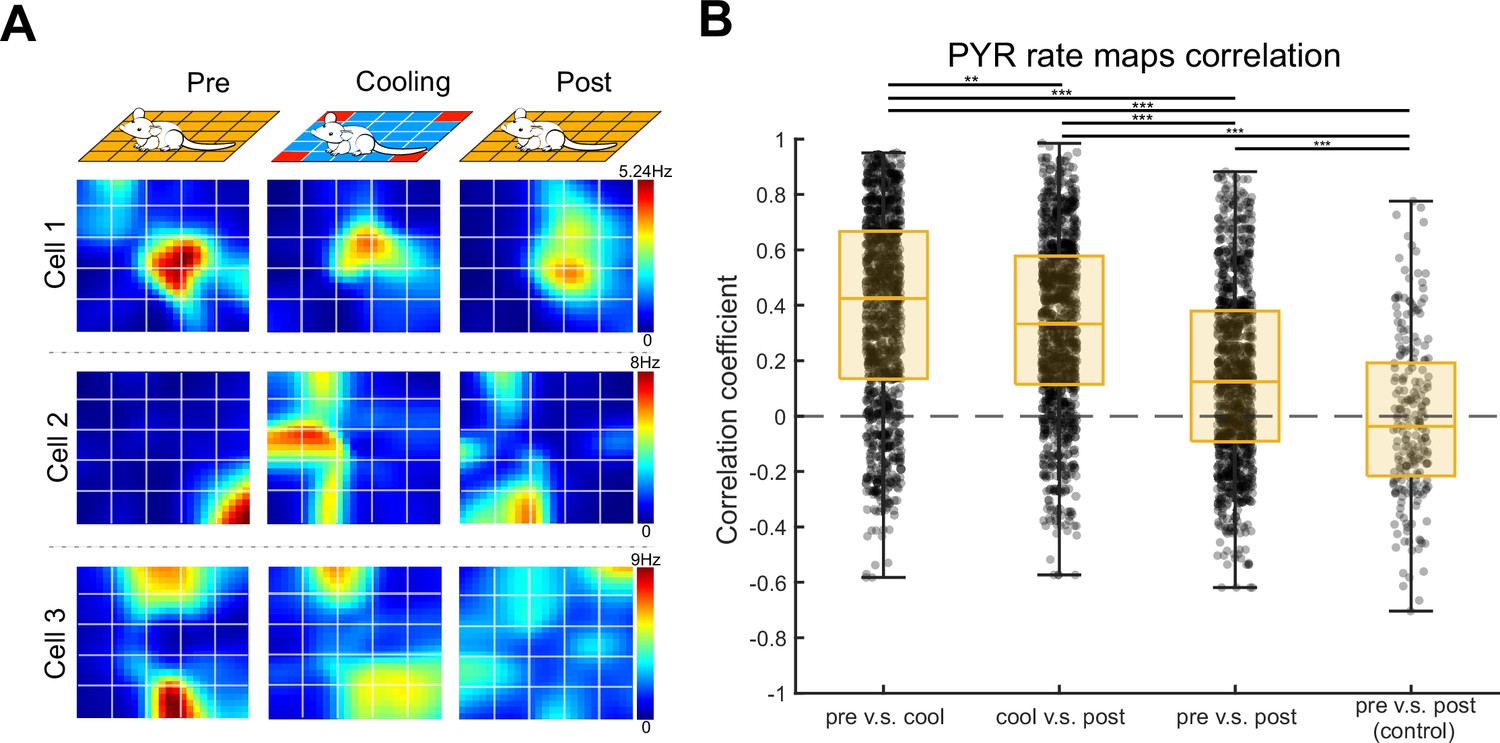
(A) Spatial firing rate maps of three example pyramidal neurons constructed in the three sub-sessions: Pre-cooling (Pre), Cooling, and Post-cooling (Post). X and Y: ThermoMaze dimensions; color: firing rate in Hz (color scale is the same across conditions for each cell). (B) Box plots of Pearson correlation coefficients between spatial firing rate maps constructed in Pre, Cooling, and Post. Median, Kruskal–Wallis test: H = 307.8880, d.f. = 3, p = 0 (n = 1150 pyramidal cells from 7 mice). *p < 0.05, **p < 0.01, ***p < 0.001.
Figure 3—figure supplement 7
Quantification of spatial tuning properties of CA1 pyramidal neurons as the animal moved through the ThermoMaze.
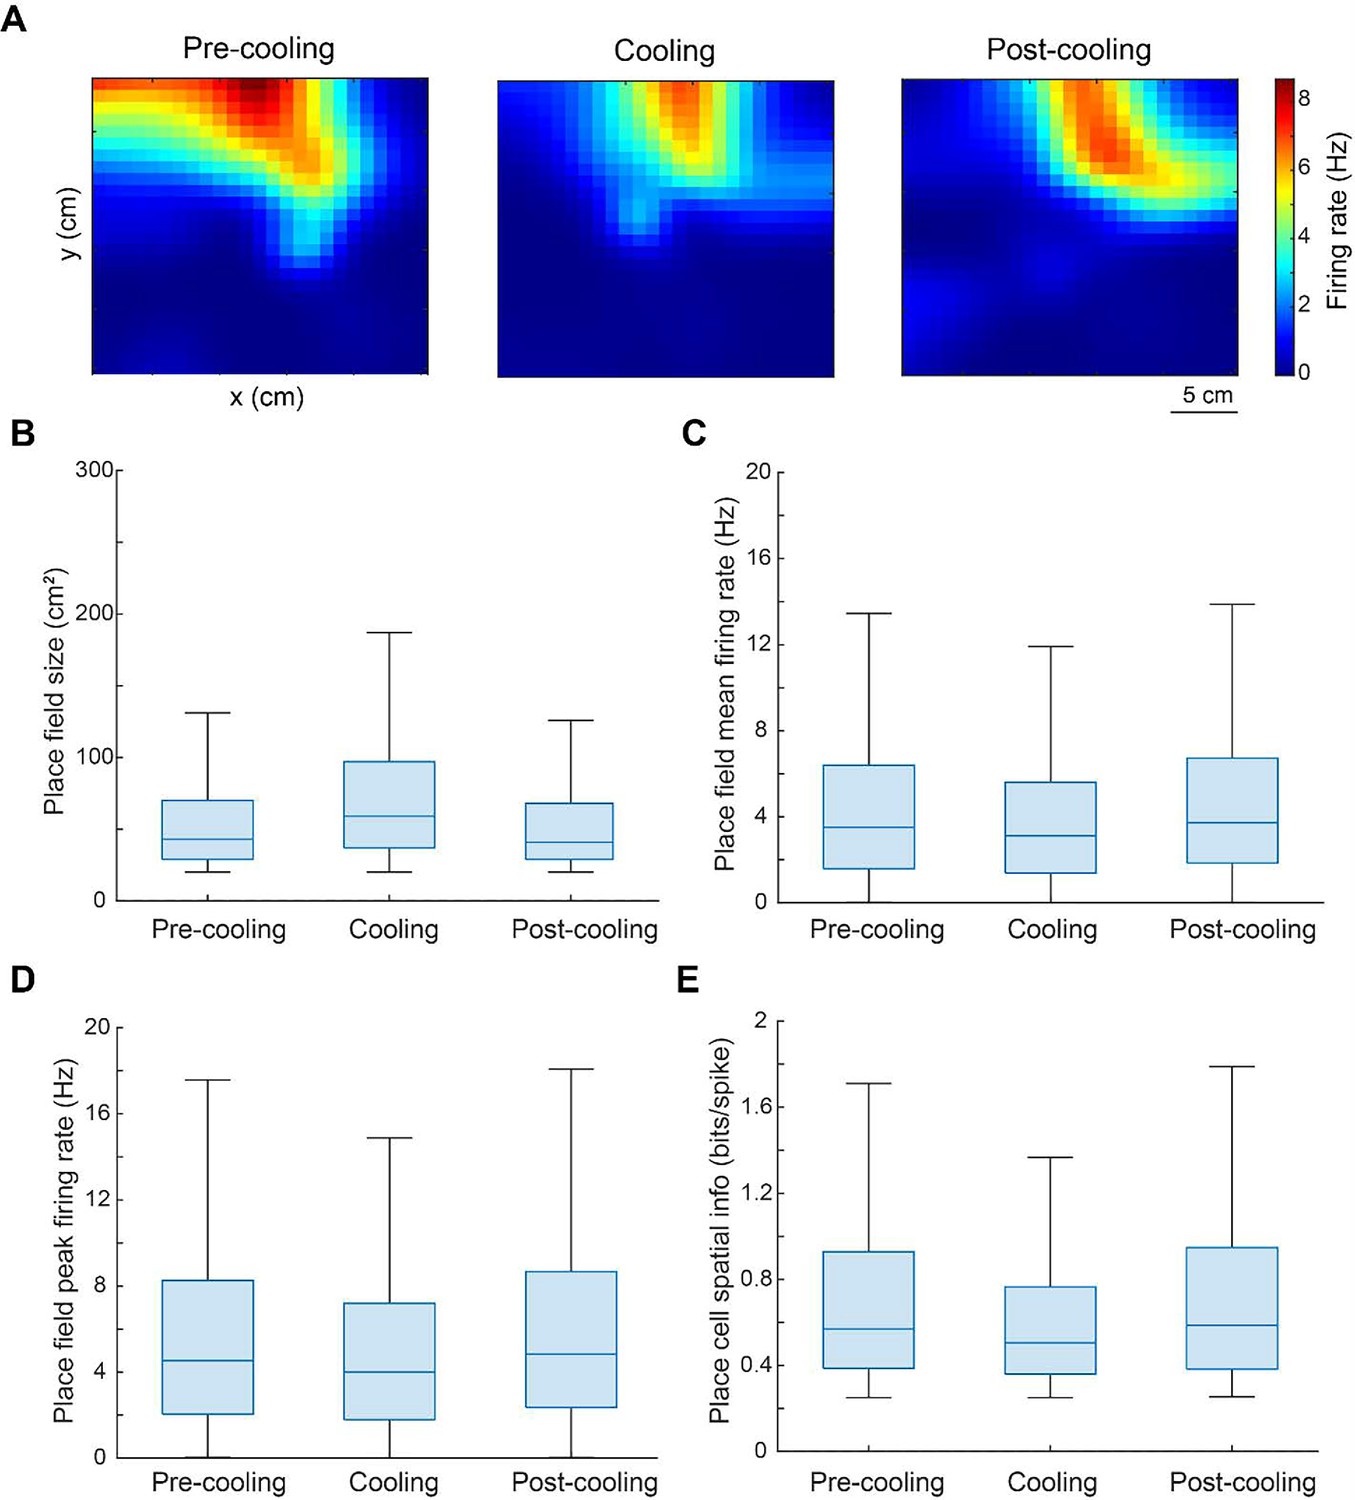
(A) An example neuron showing stable place fields within and across the three sub-sessions. (B–D) Box plot of size (cm2), mean firing rate (Hz), and peak firing rate (Hz) of the identified place fields within all individual sub-sessions. The box plot shows the median (center blue line), the lower and upper quartiles (upper and lower blue lines), and the minimum and maximum values that are not outliers (upper and lower black lines). (E) Box plot of spatial information (in bits/spike) of place cells identified within all sub-sessions.
Figure 4
Location-specific distribution of SPW-R in the ThermoMaze.
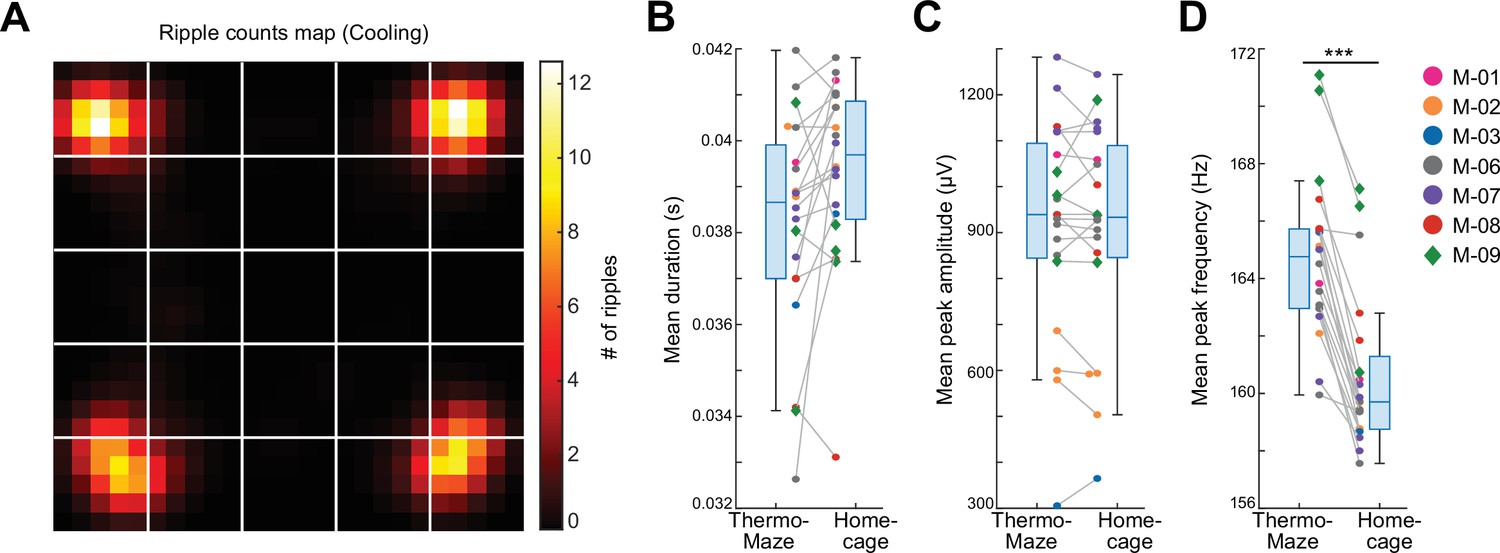
(A) Spatial map of the number of SPW-Rs during the Cooling sub-session averaged across all sessions (color code: average number of SPW-Rs per session at each location). Session-average number of SPW-Rs during Cooling was 627.3 (corresponding to 0.136 Hz). (B–D) Box plots of SPW-R properties in ThermoMaze and in the home cage (n = 19 sessions in n = 7 mice). (B) Mean ripple duration in seconds (s; p = 0.108). (C) Mean ripple amplitude in μV (p = 0.9). (D) Mean ripple peak frequency in Hz (p < 0.001). Dots (females) and diamonds (males) of the same color represent the same animal. *p < 0.05, **p < 0.01, ***p < 0.001.
Figure 5 with 1 supplement
Spikes of CA1 pyramidal neurons during awake SPW-Rs are spatially tuned.
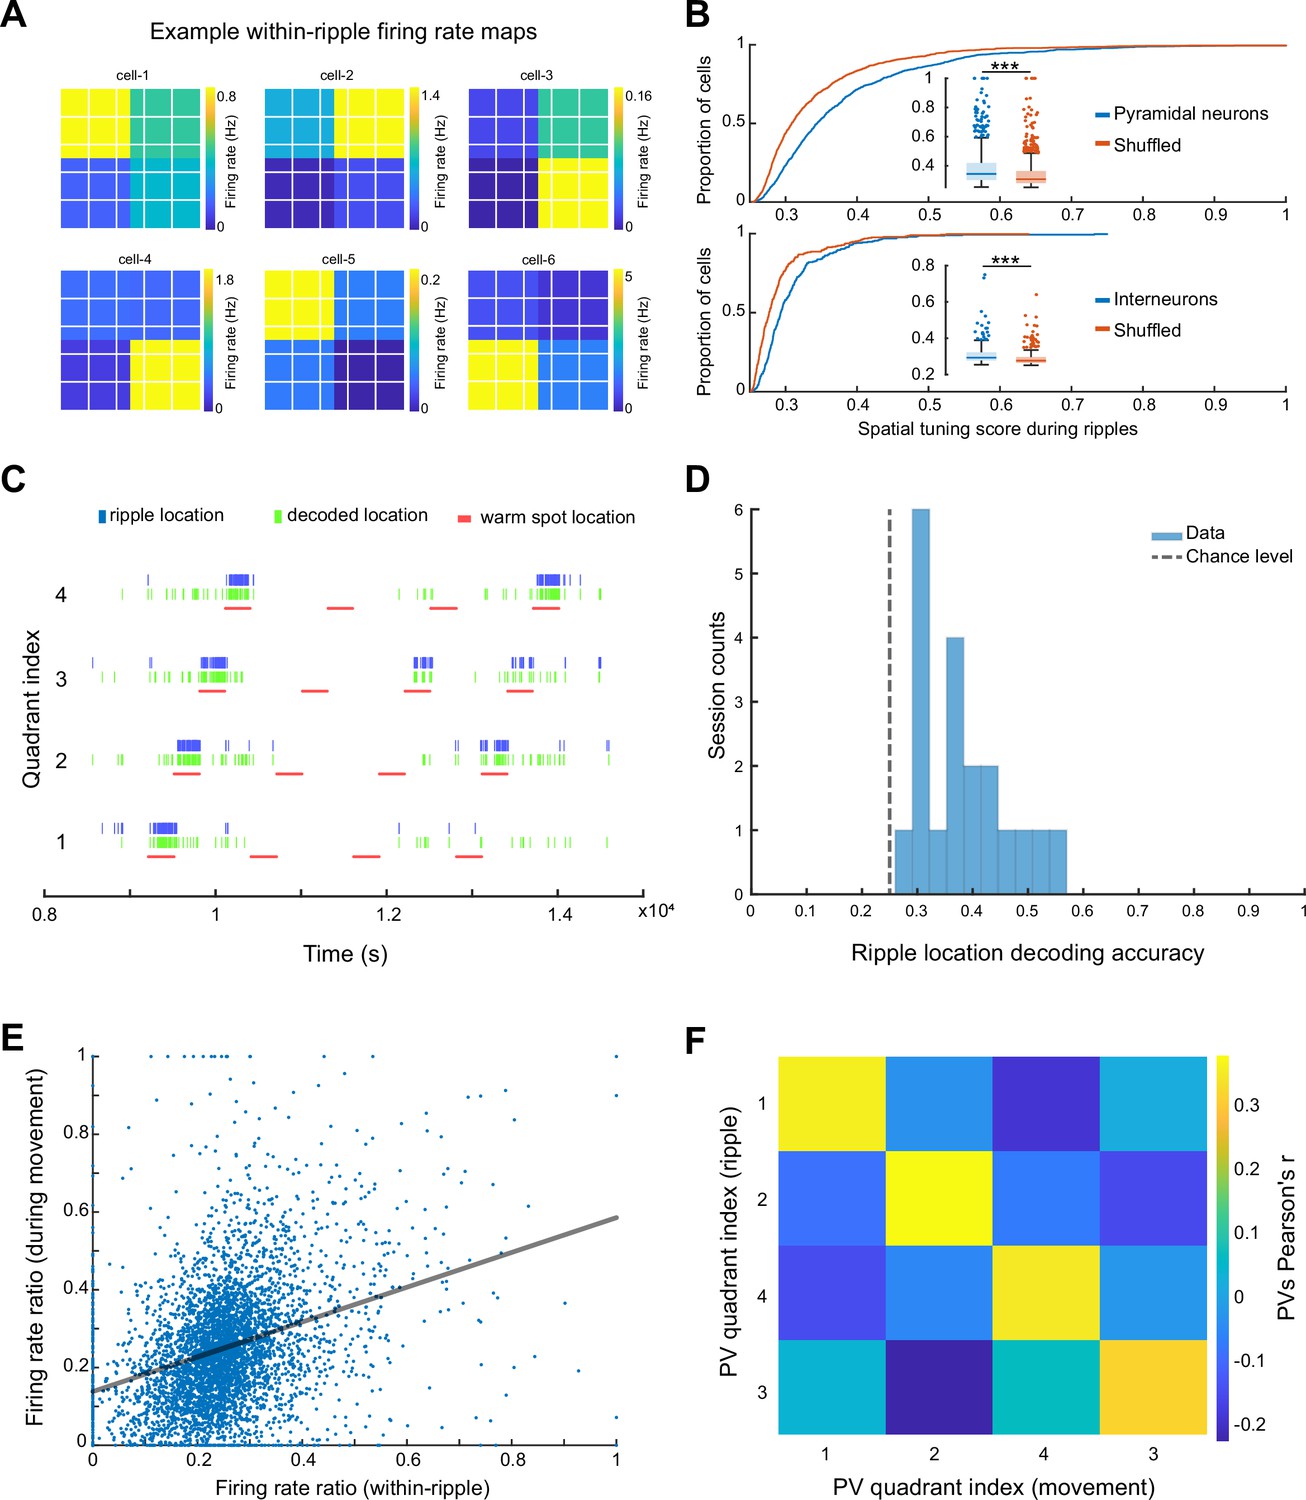
(A) Within-SPW-R firing rate maps (ThermoMaze divided into four quadrants) of six example cells with high within-SPW-R spatial tuning score (STS; from left to right, top to bottom, STS = 0.458, 0.639, 0.592, 0.672, 0.655, and 0.660, respectively). Color represents within-SPW-R firing rate (in Hz) of the neuron in each quadrant of the ThermoMaze. (B) Cumulative distribution of STSs of pyramidal neurons (top; n = 1150; p < 0.001) and interneurons (bottom; n = 288; p < 0.001) during SPW-Rs. Chance levels were calculated by shuffling the quadrant identity of the SPW-Rs. One-sided Wilcoxon rank sum tests. (C) Bayesian decoding of the mouse’s location (quadrant of the ThermoMaze) from spike content of SPW-Rs in an example session (blue: actual ripple location; green: decoded locations; red: locations of the warm spot; session decoding accuracy = 0.65; chance level = 0.26). (D) Histogram of session Bayesian decoding accuracies of ripple locations using spiking rate maps constructed during ripples as templates (with a uniform prior and a 100-fold cross-validation; p < 0.001). One-sample t-test. (E) Firing rate ratios of pyramidal cells constructed during SPW-Rs and movement are positively correlated (Pearson’s r = 0.321, p < 0.001). The firing rate ratio measures the firing rate of a cell in one quadrant versus the sum of its firing rates in all four quadrants under a specific condition (within-ripple or during movement). (F) Matrix of the pairwise correlation coefficient between each pair of firing rate ratio population vectors constructed during SPW-Rs and movements in different quadrants (x and y axes). Color represents Pearson’s r. *p < 0.05, **p < 0.01, ***p < 0.001.
Figure 5—figure supplement 1
Comparison of firing patterns of pyramidal cells and interneurons during SPW-Rs.
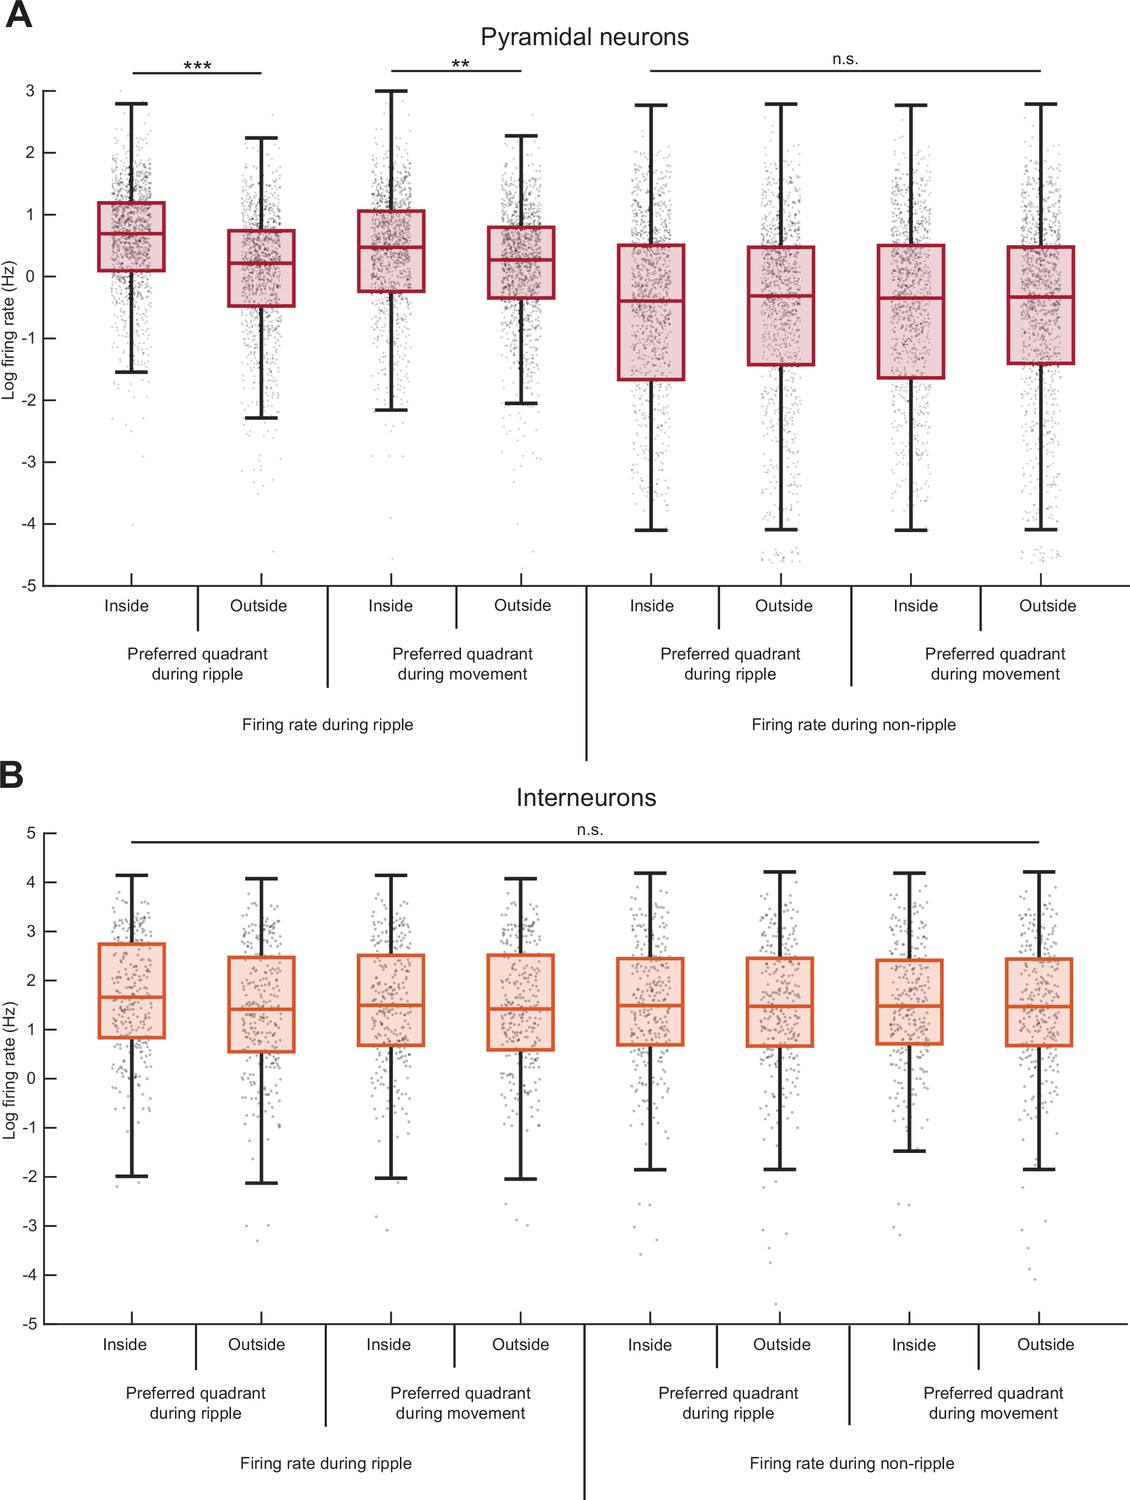
(A) Pyramidal neurons increase their firing rates during SPW-R and movement in their preferred quadrant. Median, Kruskal–Wallis test: H = 992.8856, d.f. = 7, p = 4.1 × 10−210. During SPW-Rs, pyramidal neuron firing rate is significantly higher inside their preferred quadrant (median firing rate = 1.99 Hz) than outside (median = 1.24 Hz), as expected from our definition. This increase in firing rate during SPW-R is also observed when conditioned on inside (median = 1.61 Hz) or outside (median = 1.31 Hz) the cell’s preferred quadrant defined during movement. Firing rate during SPW-R is significantly higher than that during non-ripple (asterisk is omitted in the figure for simplicity; median = 0.67, 0.73, 0.70, and 0.71 Hz for firing rate inside or outside preferred quadrant during ripple or movement, respectively). No significant difference in median is observed among the four conditions for firing rate during non-ripple. (B) Same as panel (A) but for interneurons. From left to right, median firing rate is 5.26, 4.11, 4.46, 4.14, 4.43, 4.36, 4.39, and 4.34 Hz, respectively. Median, Kruskal–Wallis test: H = 7.1594, d.f. = 7, p = 0.41. *p < 0.05, **p < 0.01, ***p < 0.001.
Figure 6
Mice sleep at experimenter-defined locations.
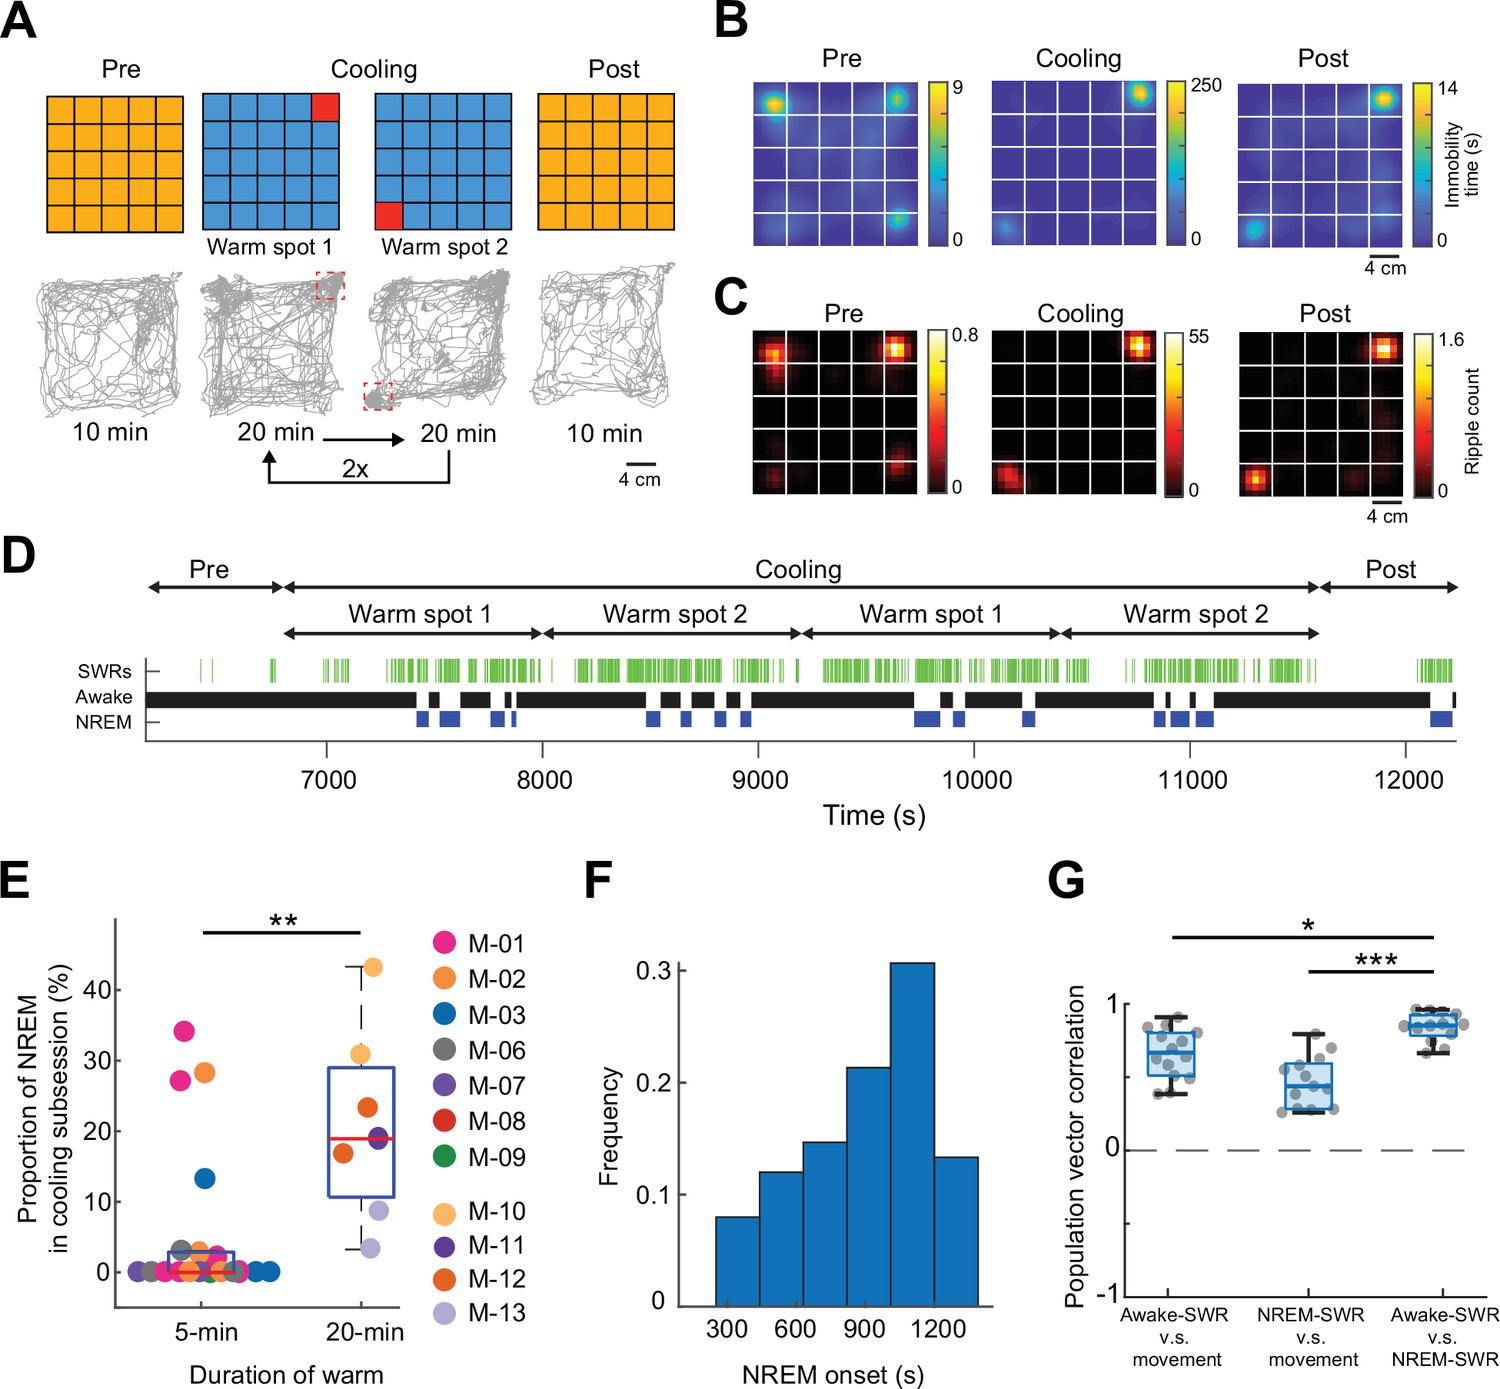
(A) Schematic of ThermoMaze with warm spot locations (top) and the trajectory of an example animal (bottom; red rectangles correspond to the location of warm spots). During Cooling, one Peltier element was turned on for 20 min followed by another (1–2) and the sequence was repeated two times. (B) Session-averaged duration of immobility (speed ≤2.5 cm/s) at each location in the ThermoMaze; white lines divide the individual Peltier elements (n = 7 sessions, n = 4 mice). (C) Spatial distribution of SPW-R occurrences (color code: average number of SPW-Rs per session at each location, n = 7 sessions, n = 4 mice). Session-average of SPW-Rs during Cooling was 775 (corresponding to 0.16 Hz). (D) Long duration of heating allowed for non-rapid eye movement (NREM) sleep occurrence during Cooling sub-session in an example session. Brain state changes (Watson et al., 2016) are shown together with SPW-Rs (green ticks). Note that NREM sleep occurs in the second half of the 20-min warming. (E) Mice spent a larger fraction of time in NREM during 20-min Cooling sub-session compared to the 5-min task variant (**p = 0.003, n = 19 sessions in 7 mice and n = 7 sessions in 4 mice). (F). Mice typically spent ~1000 s awake between NREM epochs. (G) Box charts of Pearson’s correlation coefficients between population vectors of CA1 pyramidal neurons constructed during awake SPW-Rs, movement, and NREM SPW-Rs. Median, Kruskal–Wallis test: H = 20.7, d.f. = 2, p < 0.001 (pairwise comparison: *p = 0.037 and ***p = 1.6 × 10−05).
Author response image 1

NREM sleep either in home cage or in ThermoMaze affects ripple mean peak frequency similarly.
Videos
Video 1
Real and thermal image of a mouse in the ThermoMaze.
The animal’s behavior was recorded with a Basler camera and an infrared thermal camera placed above the ThermoMaze. Four Peltier elements were subsequently heated (one in each corner). Infrared image is overlaid on the raw video. The second half of the video is 10 times faster than real time (10× speed legend in the video).
Video 2
Thermal image of a mouse in the ThermoMaze.
The animal’s behavior was recorded with an infrared thermal camera placed above the ThermoMaze (thermal image is in grayscale). In this video, a Peltier element in the inner part of the floor was heated. The speed of the video is 10 times faster than real time.
Additional files
-
Supplementary file 1
Animal sujects and statistical information.
(a) Summary of animal subjects with brain implants. (b) p-values of multiple group comparisons pertaining to analyses of variance in Figure 3C. Cumulative distribution of animal speed in the ThermoMaze during three sub-sessions. (c) p-values of multiple group comparisons pertaining to analyses of variance in Figure 4. Box plots of Pearson correlation coefficients between spatial firing rate maps. Here, group numbers 1, 2, 3, and 4 refer to correlation values between Pre and Cooling, Cooing and Post, and Pre and Post in control sessions. (d) p-values of multiple group comparisons pertaining to analyses of variance in Figure 5—figure supplement 1A. Pyramidal neurons increase firing rate during ripples in their preferred quadrant during movement. Numbers 1–8 represent pyramidal firing rate: 1. during SPW-R inside the cell’s preferred quadrant during ripple, 2. during SPW-R outside the cell’s preferred quadrant during ripple, 3. during SPW-R inside the cell’s preferred quadrant during movement, 4. during SPW-R outside the cell’s preferred quadrant during movement, 5. during SPW-R inside the cell’s preferred quadrant during ripple, 6. during SPW-R outside the cell’s preferred quadrant during ripple, 7. during SPW-R inside the cell’s preferred quadrant during movement, and 8. during SPW-R outside the cell’s preferred quadrant during movement. (e) p-values of multiple group comparisons pertaining to analyses of variance in Figure 5—figure supplement 1B. Interneurons firing rate does not change during ripples in their preferred quadrant during movement. Numbers 1–8 represent interneuron firing rate: 1. during ripples inside the cell’s preferred quadrant during ripple, 2. during ripples outside the cell’s preferred quadrant during ripple, 3. during ripples inside the cell’s preferred quadrant during movement, 4. during non-ripples outside the cell’s preferred quadrant during movement, 5. during non-ripples inside the cell’s preferred quadrant during ripple, 6. during non-ripples outside the cell’s preferred quadrant during ripple, 7. during non-ripples inside the cell’s preferred quadrant during movement, and 8. during non-ripples outside the cell’s preferred quadrant during movement.
- https://cdn.elifesciences.org/articles/90347/elife-90347-supp1-v1.docx
-
MDAR checklist
- https://cdn.elifesciences.org/articles/90347/elife-90347-mdarchecklist1-v1.docx
Download links
A two-part list of links to download the article, or parts of the article, in various formats.
Downloads (link to download the article as PDF)
Open citations (links to open the citations from this article in various online reference manager services)
Cite this article (links to download the citations from this article in formats compatible with various reference manager tools)
ThermoMaze behavioral paradigm for assessing immobility-related brain events in rodents
eLife 12:RP90347.
https://doi.org/10.7554/eLife.90347.3


