Conditional chemoconnectomics (cCCTomics) as a strategy for efficient and conditional targeting of chemical transmission
- Laboratory of Neurochemical Biology, Chinese Institute for Brain Research, China
- PKU-IDG/McGovern Institute for Brain Research, Peking-Tsinghua Center for Life Sciences, School of Life Sciences, Department of Chemical Biology, College of Chemistry and Chemical Engineering, School of Pharmaceutical Sciences, Peking University, China
- Chinese Institutes for Medical Research, Capital Medical University; Changping Laboratory, China
- Research Unit of Medical Neurobiology, Chinese Academy of Medical Sciences, China
- National Institute of Biological Sciences, Chinese Academy of Medical Sciences & Peking Union Medical College, China
Figures
Figure 1 with 3 supplements
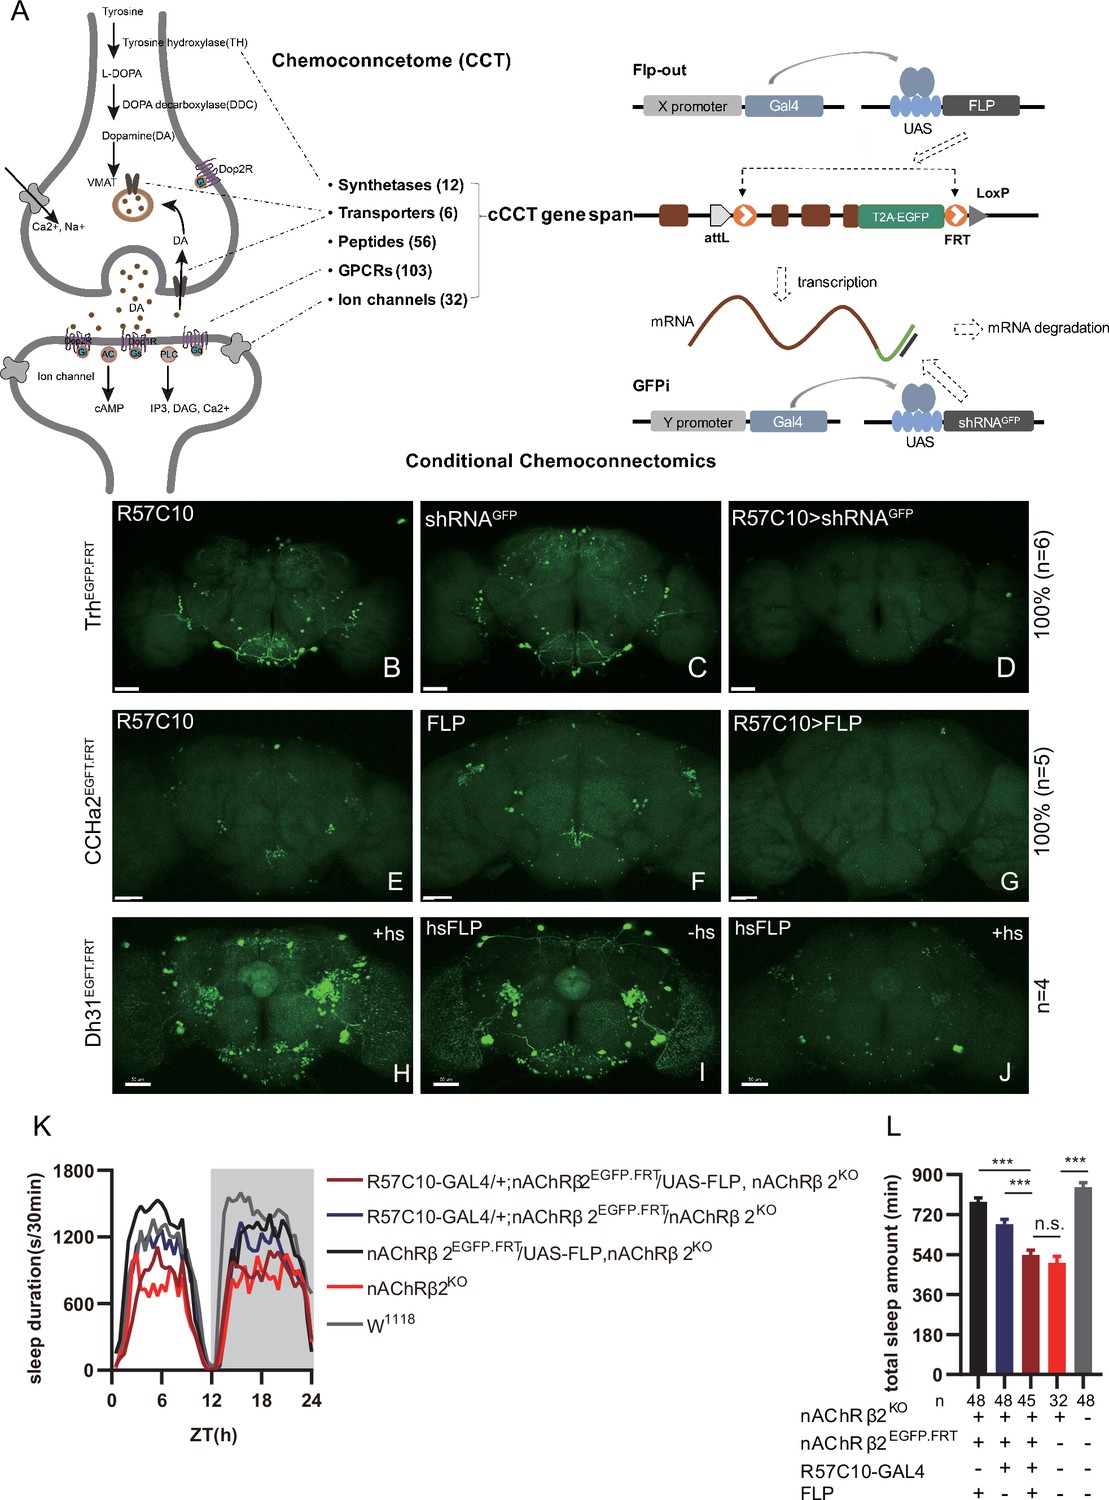
Conditional chemoconnectomics (cCCTomics) mediates efficient conditional disruption of chemoconnectome (CCT) genes.
(A) Schematic of cCCT gene span and principle of cCCTomics. A T2A-EGFP sequence was introduced at the 3′ end of CCT genes and their most or all coding regions (depending on attP-KO lines) were flanked by 34 bp FRT sequence. Both Flp-out (top) and GFP RNAi (down) could mediate CCT gene manipulation. (B–J) Expression of Trh (B–D), CCHa2 (E–G), and Dh31 (H–J) is efficiently disrupted by pan-neuronal expression of GFP-RNAi (B–D), pan-neuronal expression of Flp-out (E–G), and heatshock-Flp (H–J), respectively. Representative fluorescence images of R57C10-Gal4/+;TrhEGFP.FRT/+ (B), UAS-shRNAGFP/TrhEGFP.FRT (C), R57C10-Gal4/+; UAS-shRNAGFP/TrhEGFP.FRT (D), R57C10-Gal4/+;CCHa2EGFP.FRT/+; (E), UAS-Flp/CCHa2EGFP.FRT (F), R57C10-Gal4/+; UAS-Flp/CCHa2EGFP.FRT (G), Dh31EGFP.FRT with heatshock (H), hs-Flp/Dh31EGFP.FRT without heatshock (I), and hs-Flp/Dh31EGFP.FRT with heatshock are shown. Manipulation efficiency and experiment group fly number is noted on the right. Scale bar, 50 um. (K, L) sleep profiles (K) and statistical analysis (L) of Flp-out-induced nAChRβ2 neuronal knockout flies (dark red), nAChRβ2 knockout flies (light red), and genotype controls (dark, gray and blue). Sleep profiles are plotted in 30 min bins. In this and other figures, blank background indicates the light phase (ZT 0–12); shaded background indicates the dark phase (ZT 12–24). Daily sleep duration was significantly reduced in nAChRβ2 neuronal knockout files, which is comparable to nAChRβ2 knockout. In all statistical panels, unless otherwise noted, (1) numbers below each bar represent the number of flies tested. (2) Mean ± SEM is shown. (3) The Kruskal–Wallis test followed by Dunn’s post test was used. ***p<0.001; **p<0.01; *p<0.05; n.s., p>0.05. Male flies were used unless otherwise noted.
-
Figure 1—source data 1
Data points for Figure 1K and L.
- https://cdn.elifesciences.org/articles/91927/elife-91927-fig1-data1-v1.zip
Figure 1—figure supplement 1
Efficient conditional disruption of chemoconnectome (CCT) genes by conditional chemoconnectomics (cCCTomics).
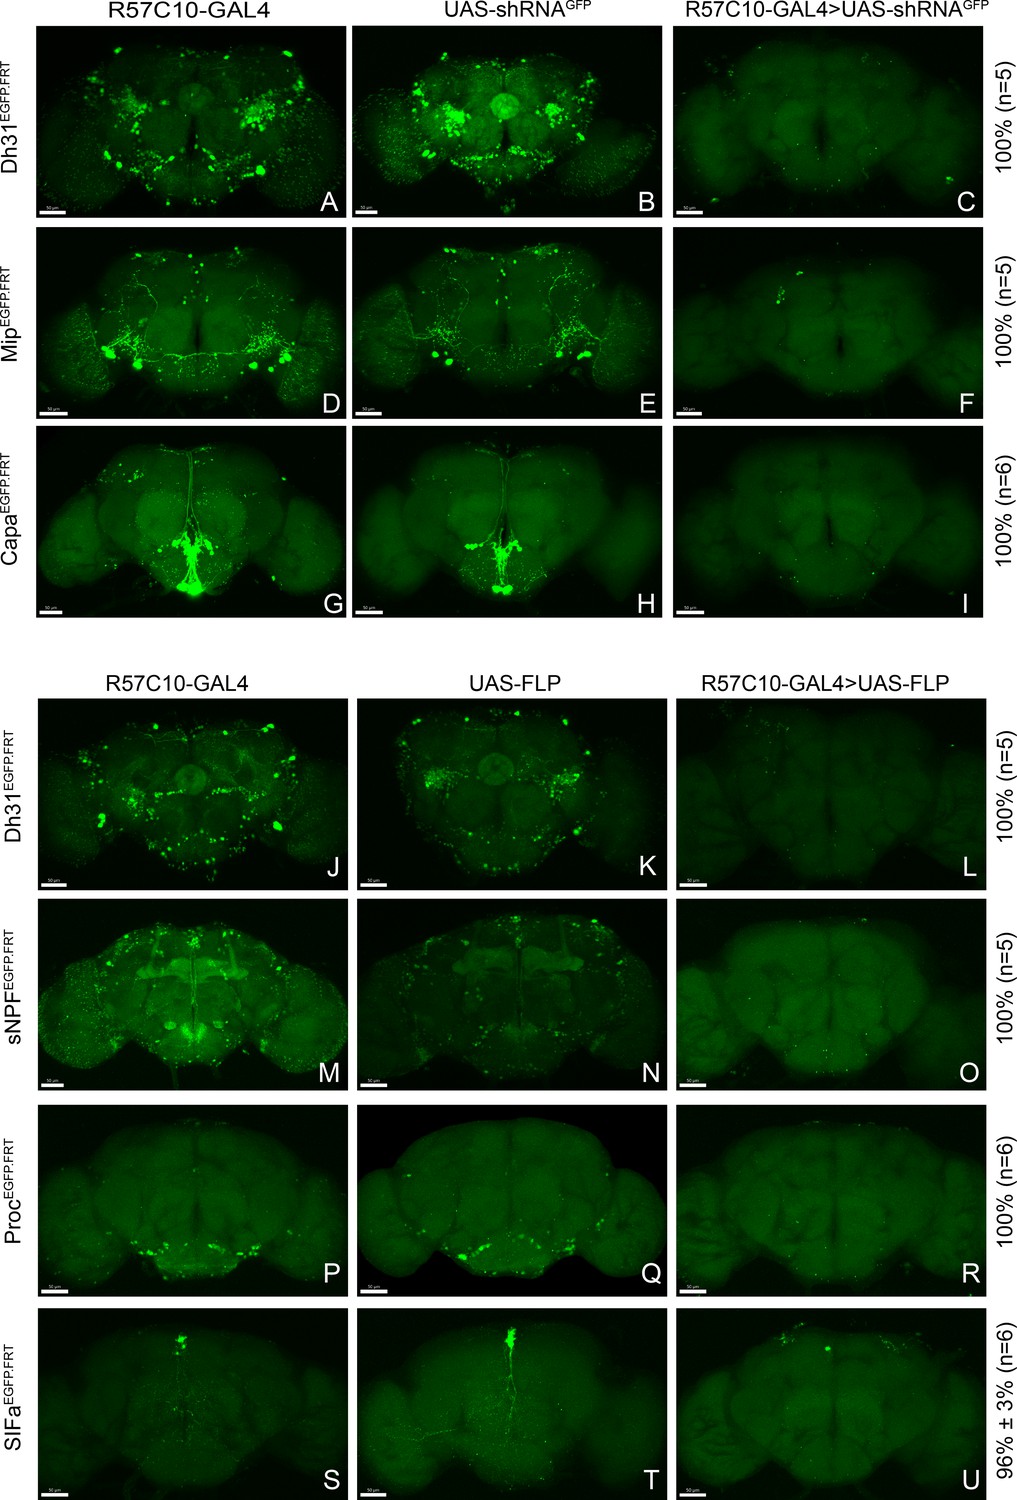
(A–I) Pan-neuronal knockdown of Dh31 (A–C), Mip (D–F), and Capa (G–I) by GFPi. All experimental fly brains (C, F, I) showed no GFP signal after knockdown by GFPi. As described in Figure 1, all percentages on the right represent gene disruption efficiency, and n represents the number of experimental flies. (J–U) Pan-neuronal knockout of Dh31, sNPF, Proc, and SIFa by Flp-out strategy. No obvious GFP signal was found in the experimental fly brains (L, O, R), excepting one GFP-positive neurons in SIFa Flp-out group (U).
Figure 1—figure supplement 2
Gene disruption of target genes by induced shRNA.
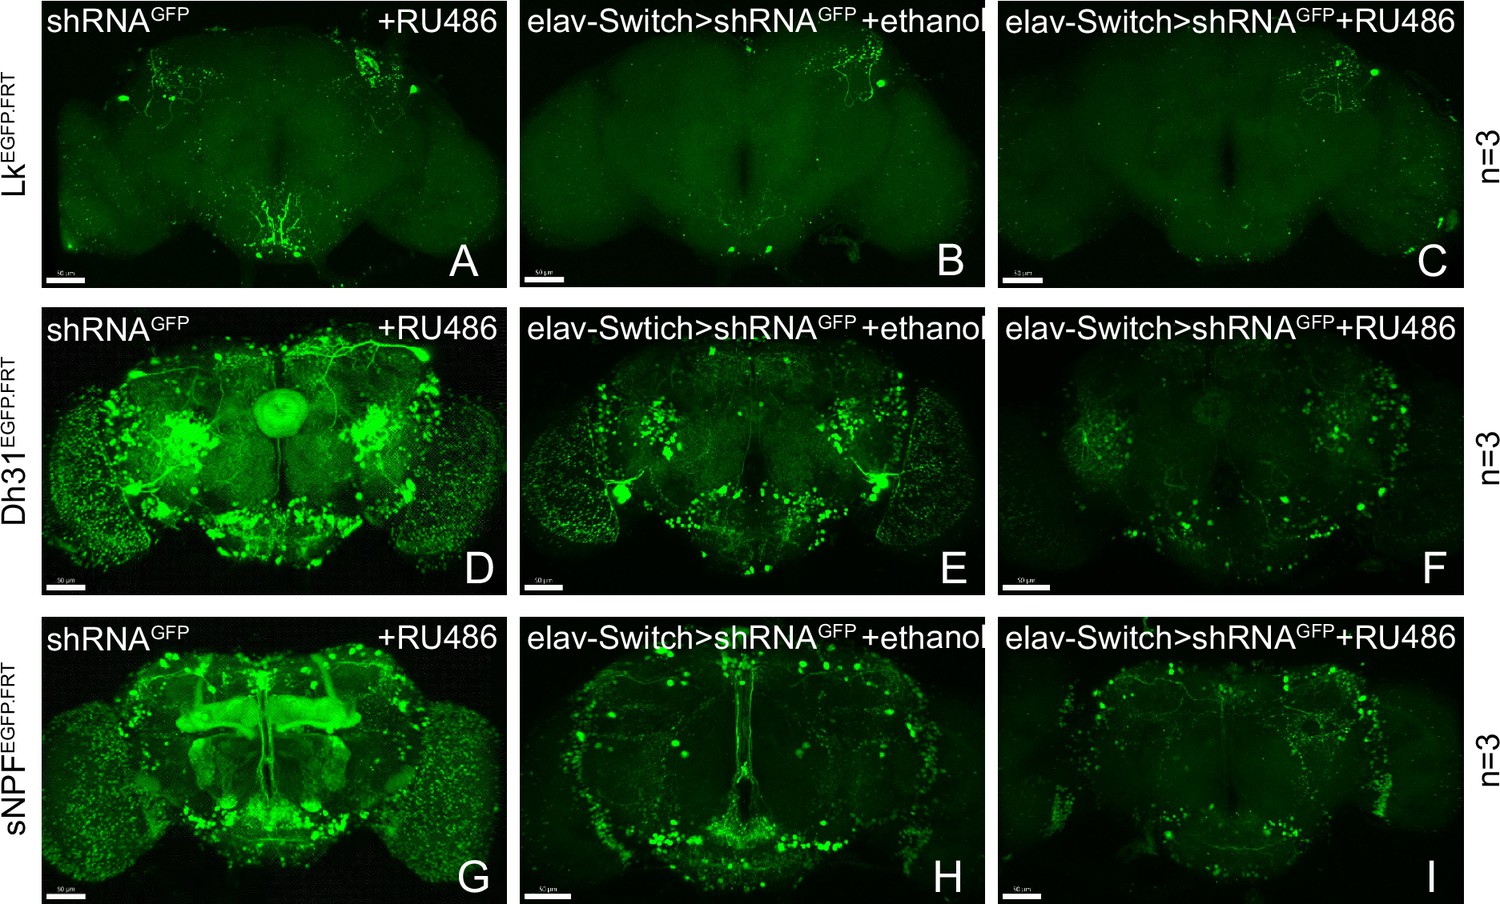
(A–I) Knockdown of Lk, Dh31, and sNPF by elav-Switch. Most GFP signal is lost in the experimental group (C, F, I).
Figure 1—figure supplement 3
Accurate labeling of target genes by cCCT lines.
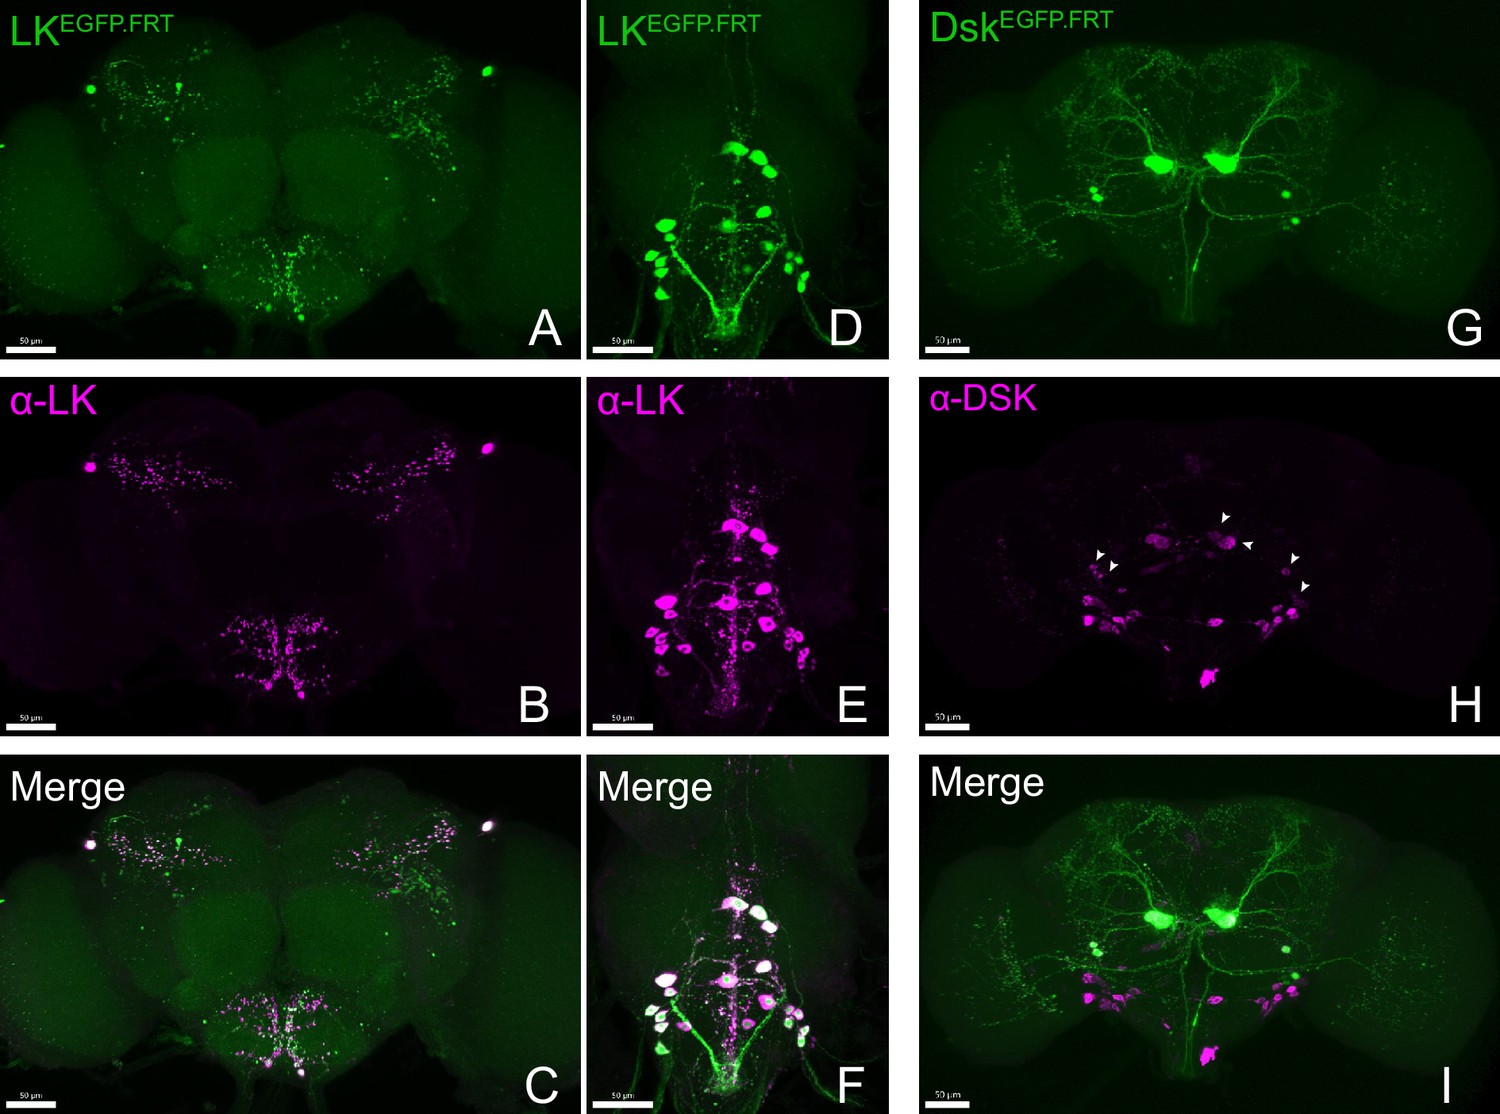
(A–I) Co-localization of fused EGFP-labeled CCT genes and corresponding antibodies. All the EGFP-labeled Lk (A, D) and Dsk (G) neurons (green) were co-localized with anti-LK (B, E); merge C (F) and anti-DSK (H, merge I) signal (purple). Arrowheads represent specific anti-DSK signal (Wu et al., 2020).
Figure 2 with 1 supplement

C-cCCTomics mediates efficient conditional knockout of chemoconnectome (CCT) genes.
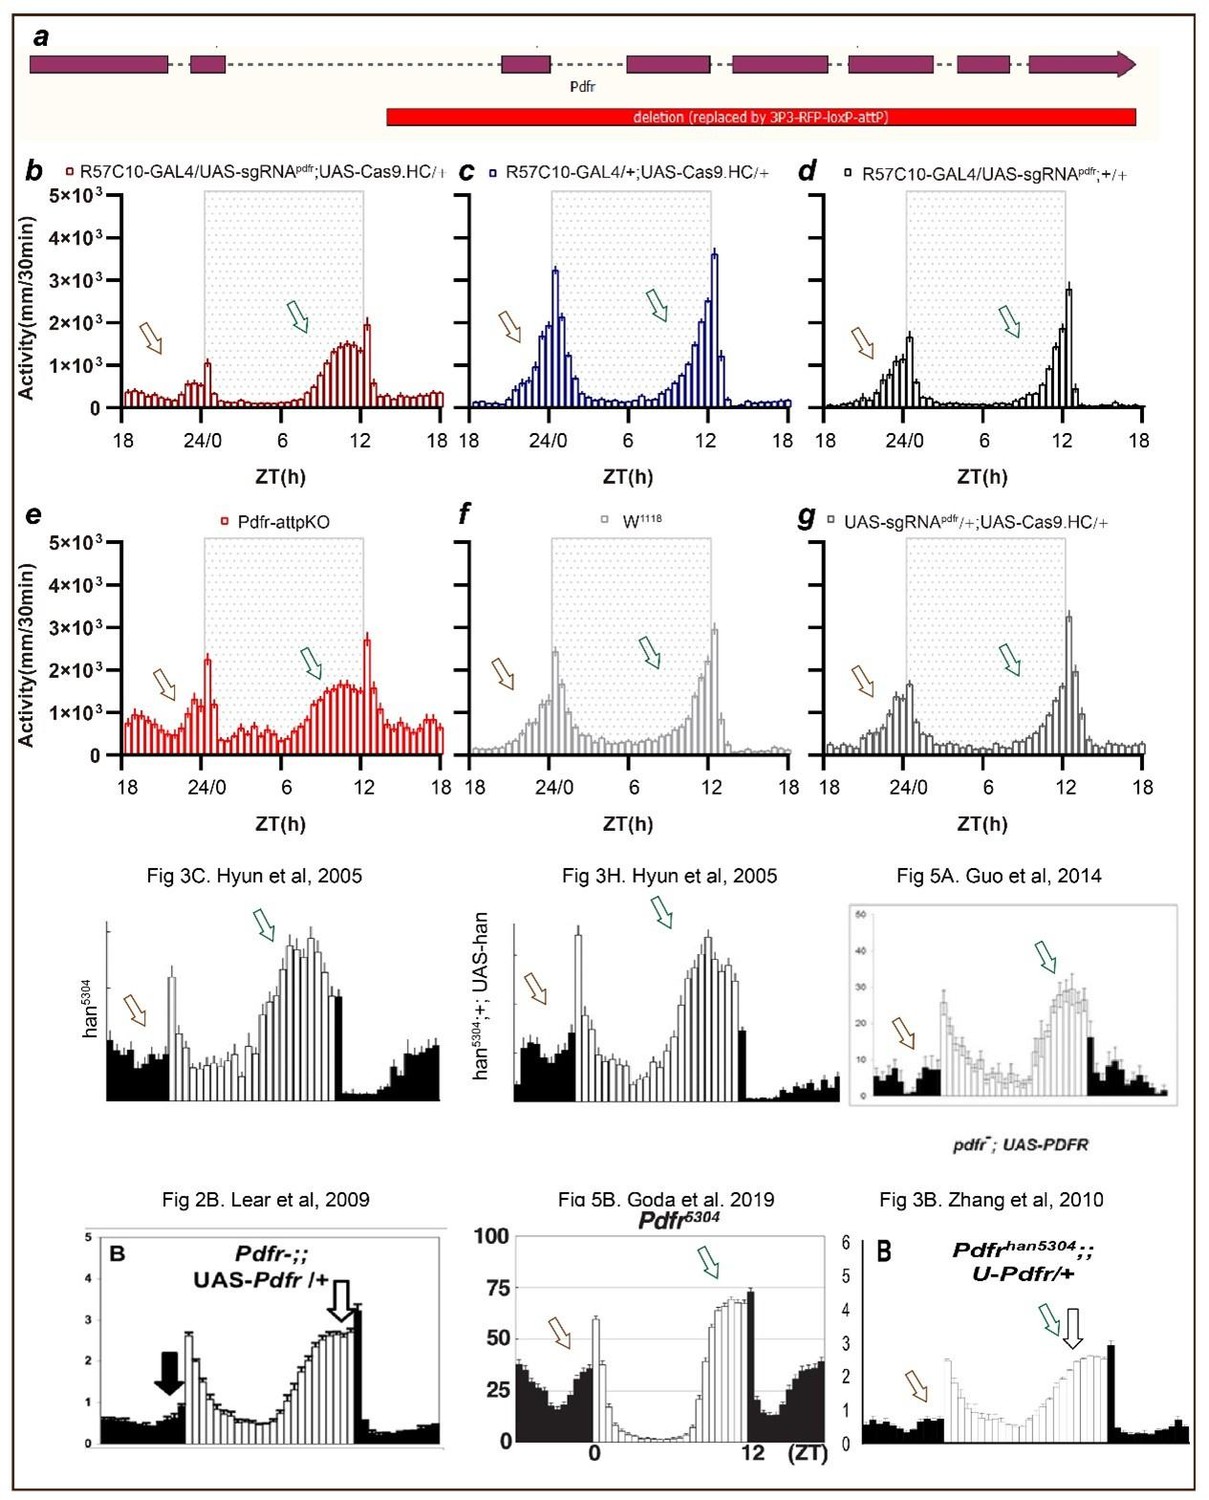
(A) Schematic of C-cCCTomics principle. Cas9 and three sgRNAs are driven by GAL4/UAS system. Three tandem sgRNAs are segregated by fly tRNAGly and matured by RNase Z and RNase P. (B–G) Pan-neuronal knockout of Dh31 (D) and Pdf (G) by C-cCCTomics strategy. Representative fluorescence images presented expression of Dh31 (B–D) or anti-PDF (E–G). Pan-neuronal expression of Cas9 and sgRNA eliminated most (D) (n=6)or all (G) (n=7) fluorescent signal compared to control fly brains (B–C, E–F). Scale bar, 50 μm. (H) Activity profiles of pan-neuronal knockout of Pdfr and Pdfr-attpKO. Activity profiles were centered of the 12 hr darkness in all figures with evening activity on the left and morning activity on the right, which is different from general circadian literatures. Plotted in 30 min bins. (I) Statistical analysis of morning anticipation index (MAI), power, and period for pan-neuronal Pdf knockout and Pdfr-attpKO flies. Knocking out of Pdfr in neurons reduced both MAI, power, and period significantly. (J, K) Statistical analysis of nAChRα2 (J) and nAChRβ2 (K) pan-neuronal knockout flies’ sleep phenotype. Sleep of these flies was not disrupted.
-
Figure 2—source data 1
Data points for Figure 2H–K.
- https://cdn.elifesciences.org/articles/91927/elife-91927-fig2-data1-v1.zip
Figure 2—figure supplement 1
Validation of primary C-cCCTomics.
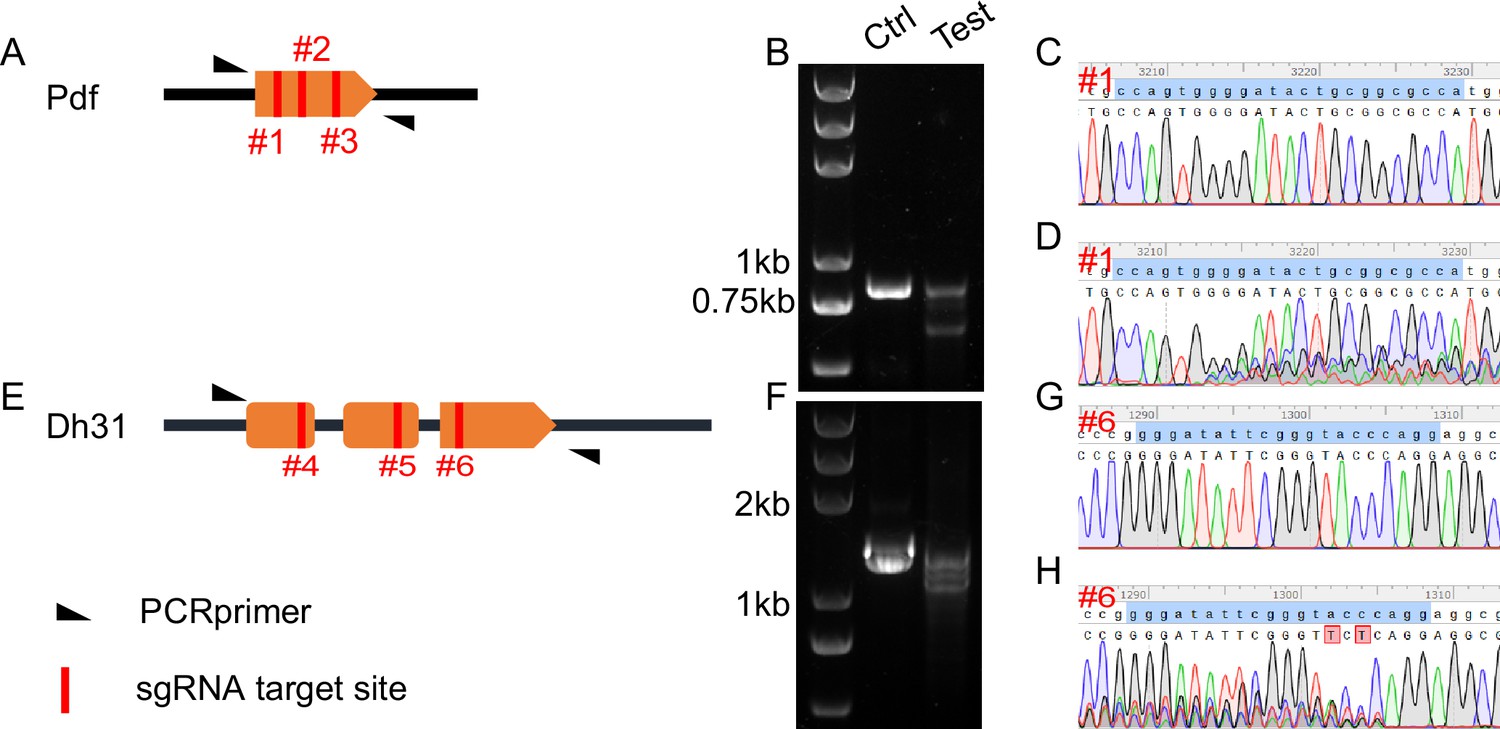
(A) Gene span of Pdf. #1, #2, and #3 with red lines denote sgRNA targets regions in Pdf coding sequence. (B) DNA gel electrophoresis of PCR products after pdf KO by C-cCCTomics. ‘Ctrl’ denotes PCR products from genomic DNA mixture of Act5C-GAL4/+; UAS-Cas9.P2/+flies and UAS-sRNAPdf flies. ‘Test’ denotes PCR products from Act5C-GAL4/UAS-sRNAPdf; UAS-Cas9.P2 flies. (C, D) Sanger sequencing results of Ctrl (C) and test (D) PCR products at #1 sgRNA target site. (E–H) Similar to (A–D) with Dh31 as target.
-
Figure 2—figure supplement 1—source data 1
Original files of the full raw unedited blots for Figure 2—figure supplement 1B and F.
- https://cdn.elifesciences.org/articles/91927/elife-91927-fig2-figsupp1-data1-v1.zip
-
Figure 2—figure supplement 1—source data 2
Uncropped blots with the relevant bands labeled for Figure 2—figure supplement 1B and F.
- https://cdn.elifesciences.org/articles/91927/elife-91927-fig2-figsupp1-data2-v1.zip
Figure 3 with 3 supplements

Efficiency evaluation of variations of chromatin-modulating peptides modified Cas9.
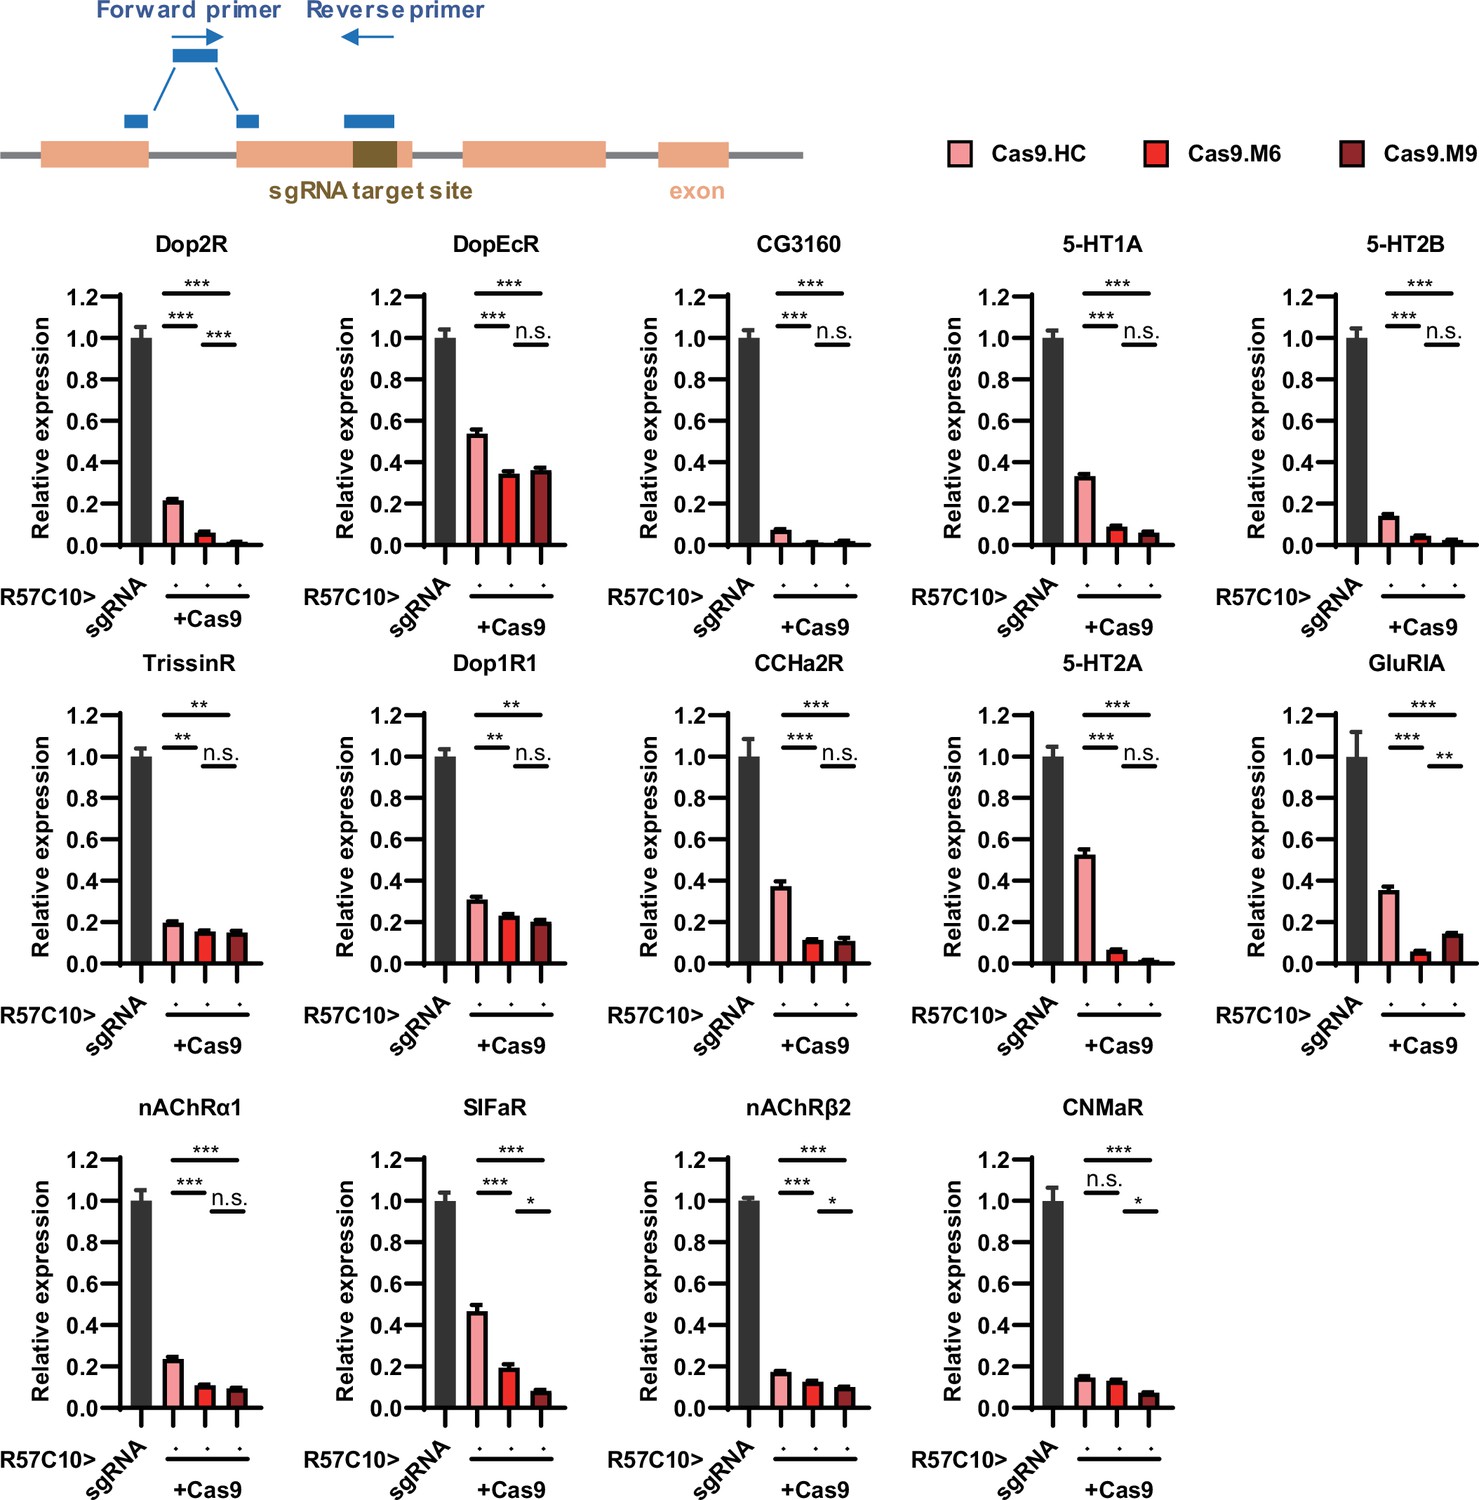
(A) Schematics of chromatin-modulating peptides modified Cas9. (B–J) Efficiency evaluation of Cas9 variants. Fluorescence imaging of R57C10-Gal4>UAS-sgRNAple (B), R57C10-Gal4>UAS-Cas9 (C–F), and R57C10-Gal4>UAS-Cas9, UAS-sgRNAple (G–J) flies is shown. Brains were stained with anti-TH (green). Scale bar is 50 μm. (K) Anterior TH-positive neuron numbers of (K–U).The Kruskal–Wallis test followed by Dunn’s post test was used, each Cas9 variant tested was compared to the two genotype controls (R57C10-GAL4/+; UAS-sgRNAple/+ and R57C10-GAL4/+; UAS-Cas9 variant/+ ) . ***p<0.001. (L) Statistical analysis of ple knockout efficiency related to (K). Modified Cas9.M6 and Cas9.M9 showed an improved efficiency compared to Cas9.HC. Student’s t-test was used. (M) Statistical analysis of representational KO efficiency of Cas9 variants as related to Figure 3—figure supplement 1. Gene symbols on the right indicate tested genes. (N) Statistical analysis of Cas9 expression level. (O, P) Workflow of efficiency validation by next-generation sequencing (O) and statistical analysis of single-site mutation ratios induced by Cas9 variants (P). Paired t-test was used in (M), (N), and (P). (Q, R) Statistical analysis of sleep amount for nAChRα2 (Q) or nAChRβ2 (R) pan-neuronal knockout flies. Knockout of nAChRα2 and nAChRβ2 by modified Cas9.M9 significantly decreased flies’ sleep amount.
-
Figure 3—source data 1
Data points for Figure 3K–O and Q–R.
- https://cdn.elifesciences.org/articles/91927/elife-91927-fig3-data1-v1.zip
-
Figure 3—source data 2
Original next-generation seq file for Figure 3P.
- https://cdn.elifesciences.org/articles/91927/elife-91927-fig3-data2-v1.zip
-
Figure 3—source data 3
Original CRISPResso2 analysis report related to Figure 3P and Figure 3—figure supplement 2.
- https://cdn.elifesciences.org/articles/91927/elife-91927-fig3-data3-v1.zip
Figure 3—figure supplement 1
Efficiency validation by real-time quantitative PCR.
This figure corresponds to Figure 3M. The schematic at the top illustrates the principle of primer design. The gene symbol above each panel indicates the target of sgRNAs. The expression of the target gene in the experimental groups (where R57C10-GAL4 drives the expression of both Cas9 variants and sgRNA) was normalized to the control group (where R57C10-GAL4 drives sgRNA expression only). n = 2 for R57C10-GAL4/UAS-sgRNA5HT-2A; n = 3 for all other genotypes in this figure.
-
Figure 3—figure supplement 1—source data 1
Data points for Figure 3—figure supplement 1.
- https://cdn.elifesciences.org/articles/91927/elife-91927-fig3-figsupp1-data1-v1.zip
Figure 3—figure supplement 2
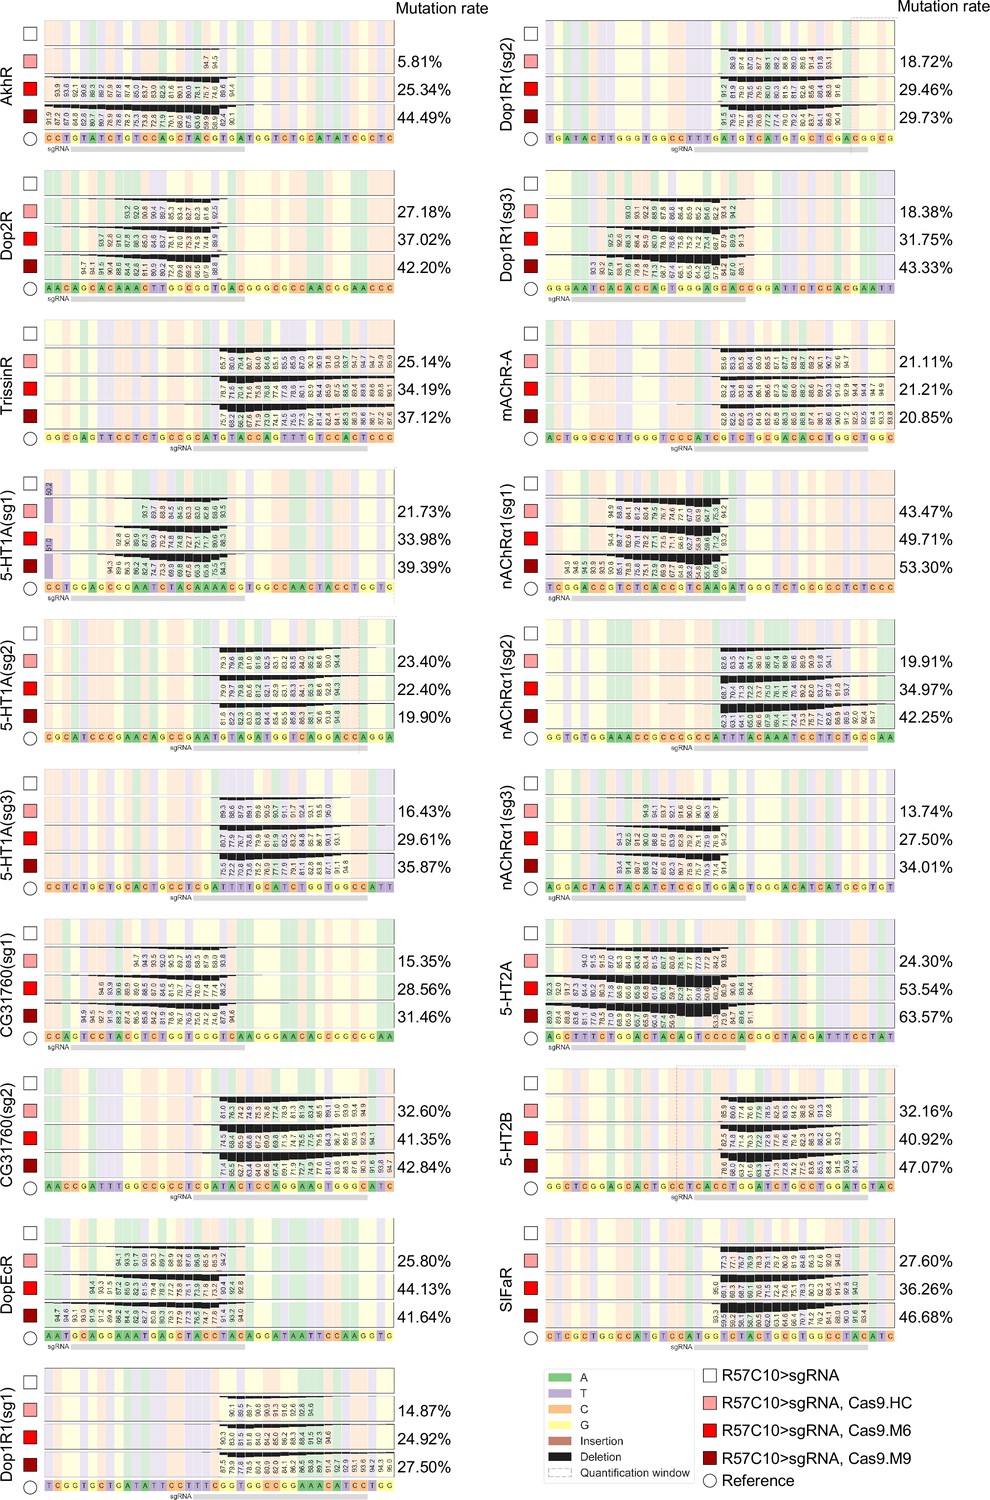
Efficiency validation by high-throughput sequencing.
This figure corresponds to Figure 3P. Gene symbol on the left side of each panel denotes the target gene, while the percentages on the right denotes mutation rate as calculated by CRISPResso2. A minimum of 10,000 reads were analyzed for each genotype.
Figure 3—figure supplement 3

Impact on viability of Cas9 variants expression by GMR57C10-GAL4.
F1 ratio of UAS-Cas9 variants (male) cross GMR57C10-GAL4/cyo (virgin female). Expression of Cas9.M9 decreased progeny viability slightly. **p<0.01, n.s. p>0.05. Two Student’s test was used.
-
Figure 3—figure supplement 3—source data 1
Data points for Figure 3—figure supplement 3.
- https://cdn.elifesciences.org/articles/91927/elife-91927-fig3-figsupp3-data1-v1.zip
Figure 4 with 3 supplements
Genetic dissection of Clk856-labeled clock neurons.
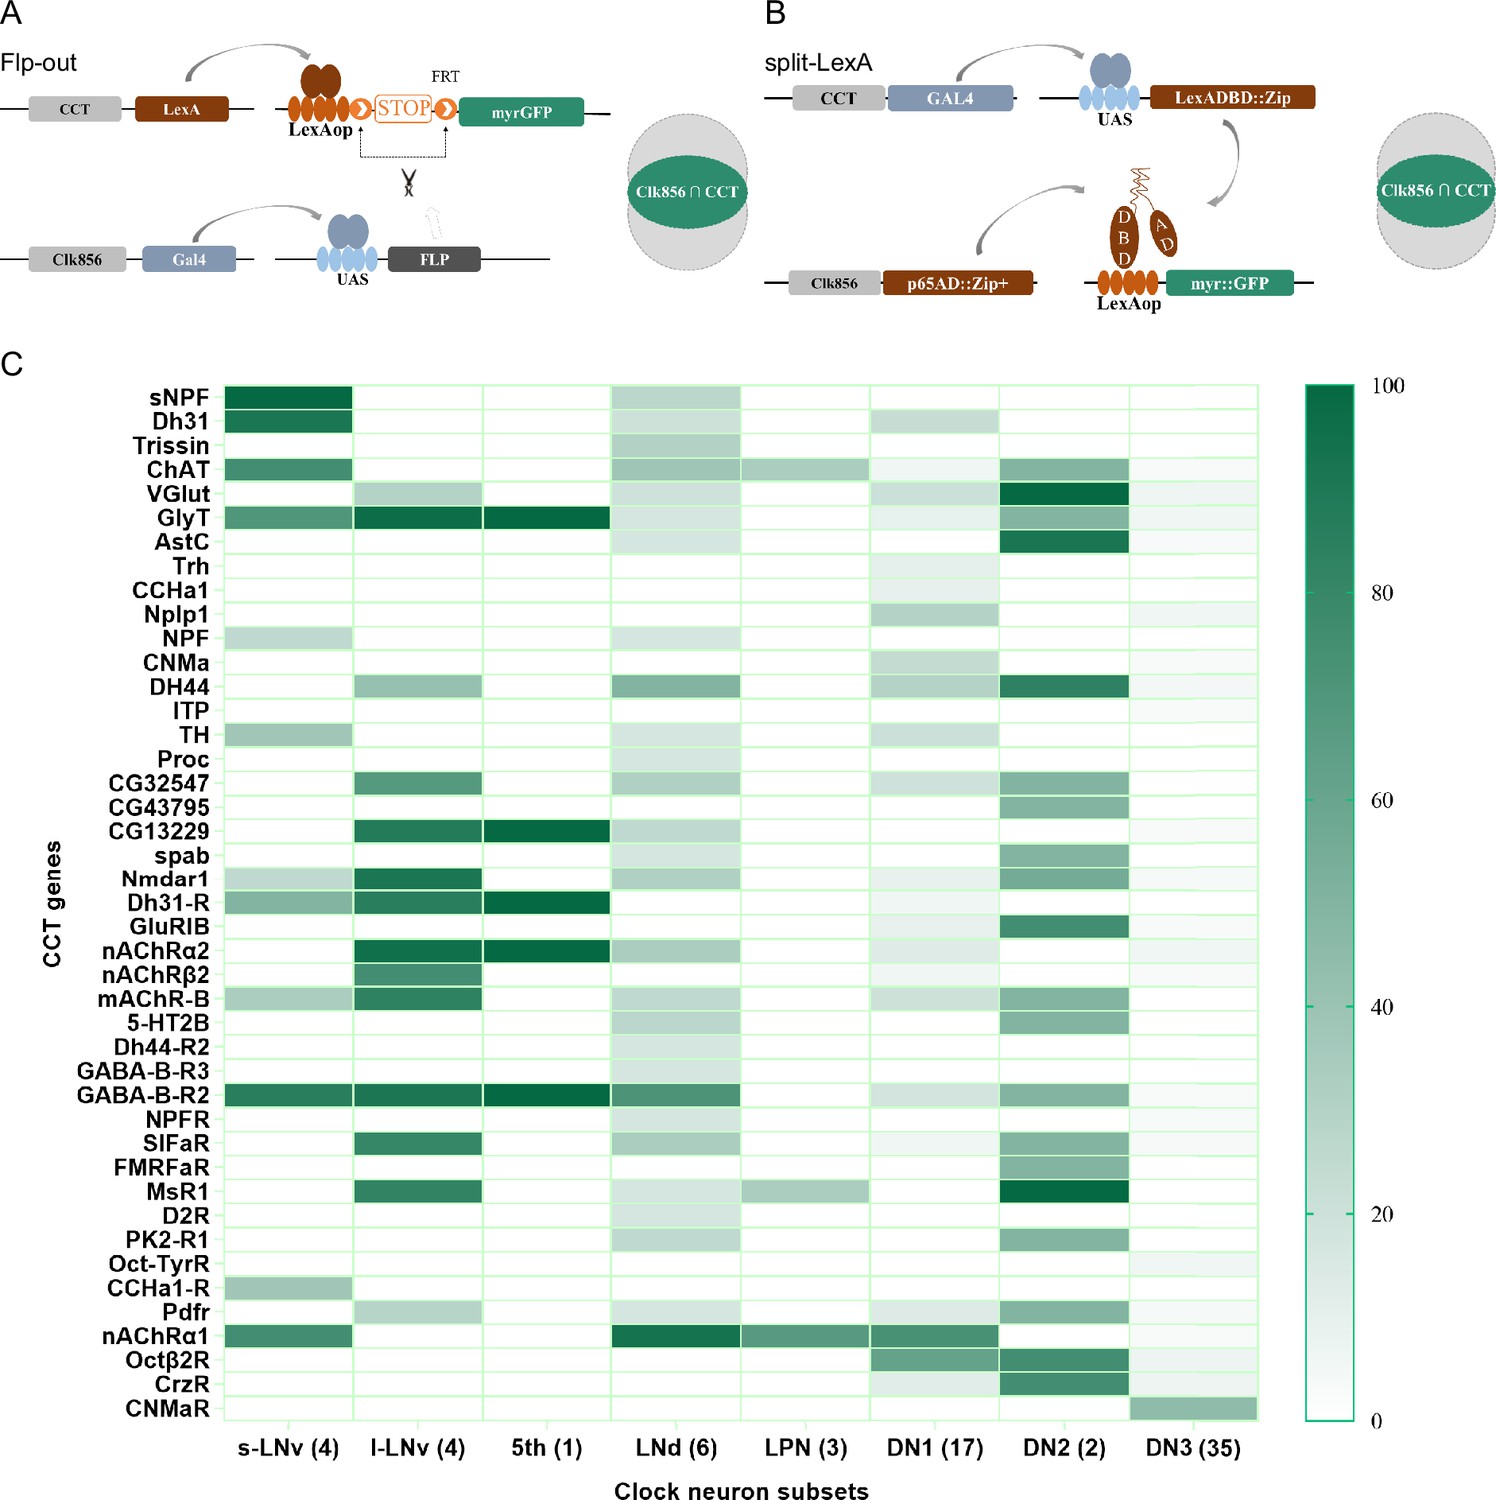
(A, B) Schematic of intersection strategies used in Clk856-labeled clock neurons dissection, Flp-out strategy (A) and split-LexA strategy (B). The exact strategy used for each gene is annotated in Supplementary file 5. (C) Expression profiles of CCT genes in clock neurons. Gradient color denotes proportion of neurons that were positive for the chemoconnectome (CCT) gene within each subset. The exact cell number for each subset is annotated in Supplementary file 4.
-
Figure 4—source data 1
Exact percentage for Figure 4C.
- https://cdn.elifesciences.org/articles/91927/elife-91927-fig4-data1-v1.zip
Figure 4—figure supplement 1
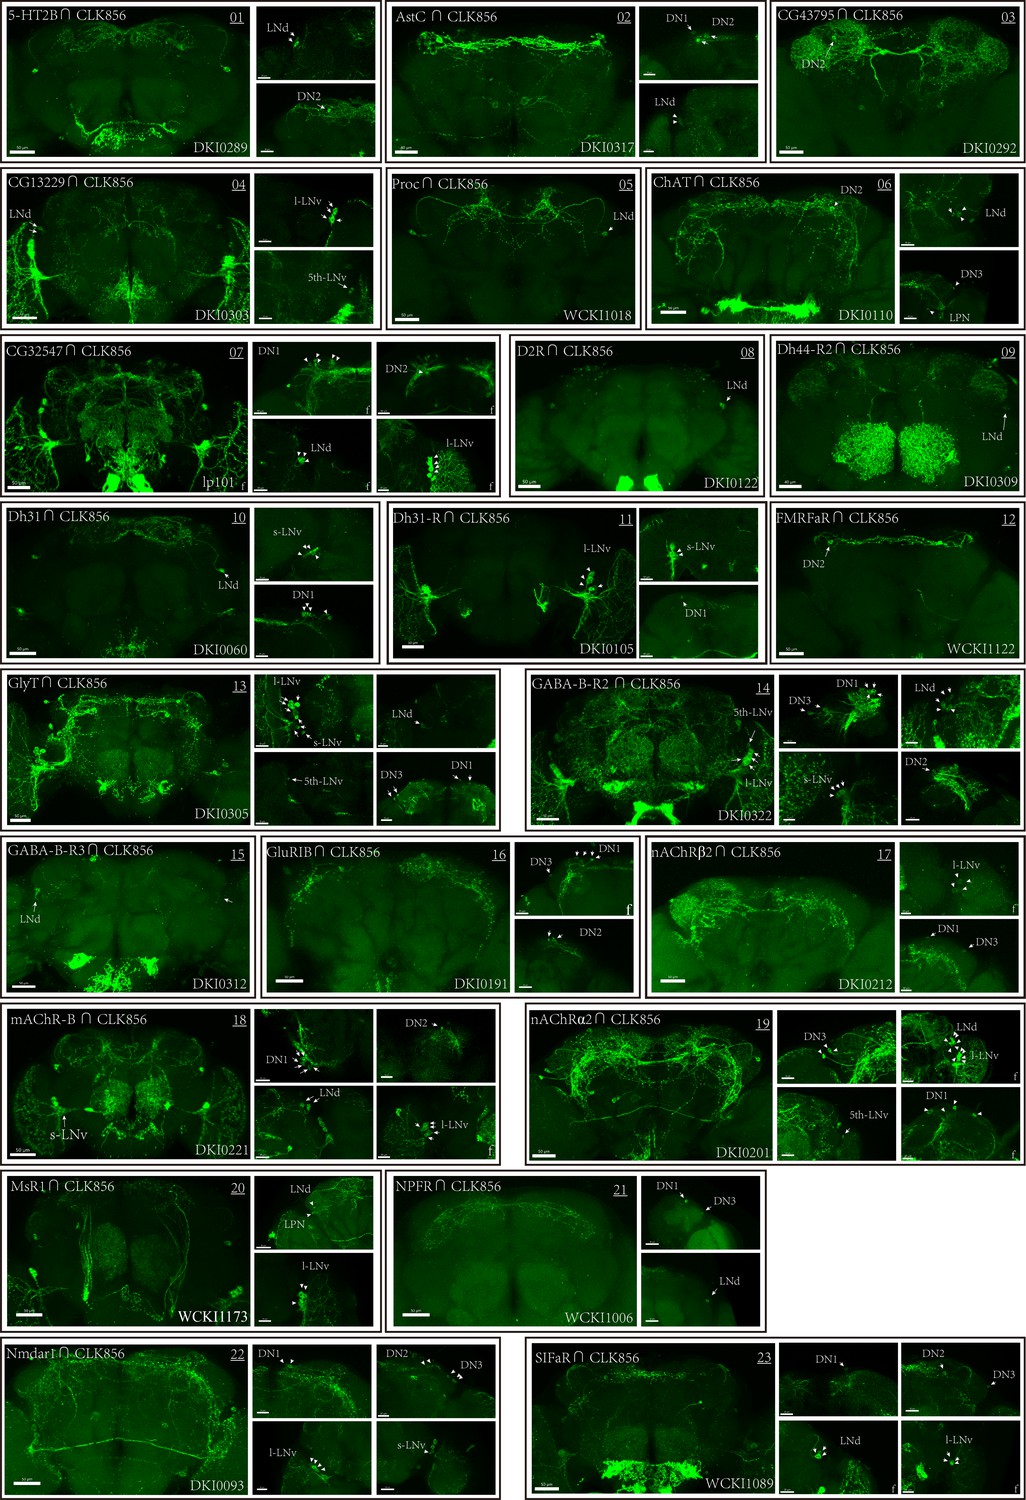
Co-expression of Clk856 with chemoconnectome (CCT) genes (01–23) intersectional expression patterns of CCT drivers with Clk856.
The exact strategy used for each gene is annotated in Supplementary file 5. Maximum neuron numbers are presented in each image. Note at the bottom-right corner is category ID of CCT drivers in Rao Lab fly stock library. ‘f’ denotes female fly brain, otherwise male brain is shown.
Figure 4—figure supplement 2
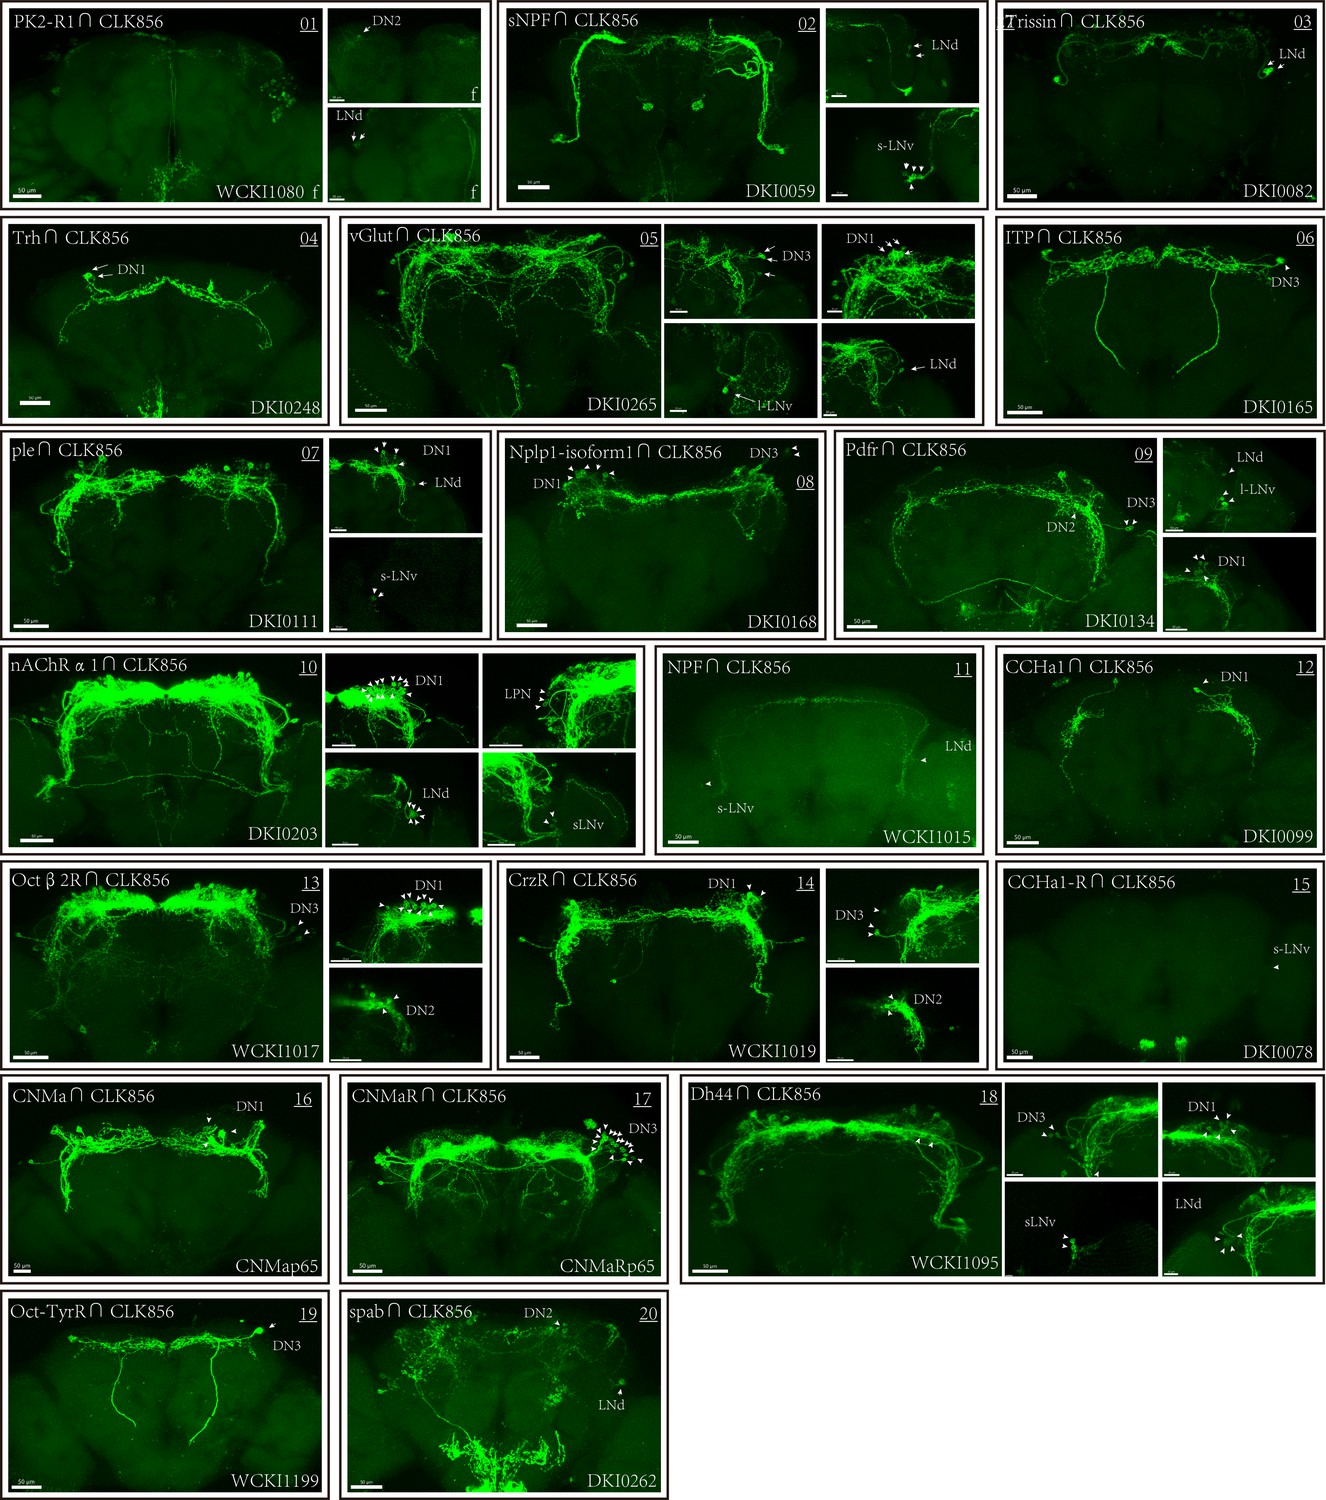
Co-expression of Clk856 with chemoconnectome (CCT) genes (01–20) intersectional expression patterns of CCT drivers with Clk856.
The exact strategy used for each gene is annotated in Supplementary file 5. Maximum neuron numbers are presented in each image. Note at the bottom-right corner is category ID of CCT drivers in Rao Lab fly stock library. ‘f’ denotes female fly brain, otherwise male brain is shown.
Figure 4—figure supplement 3
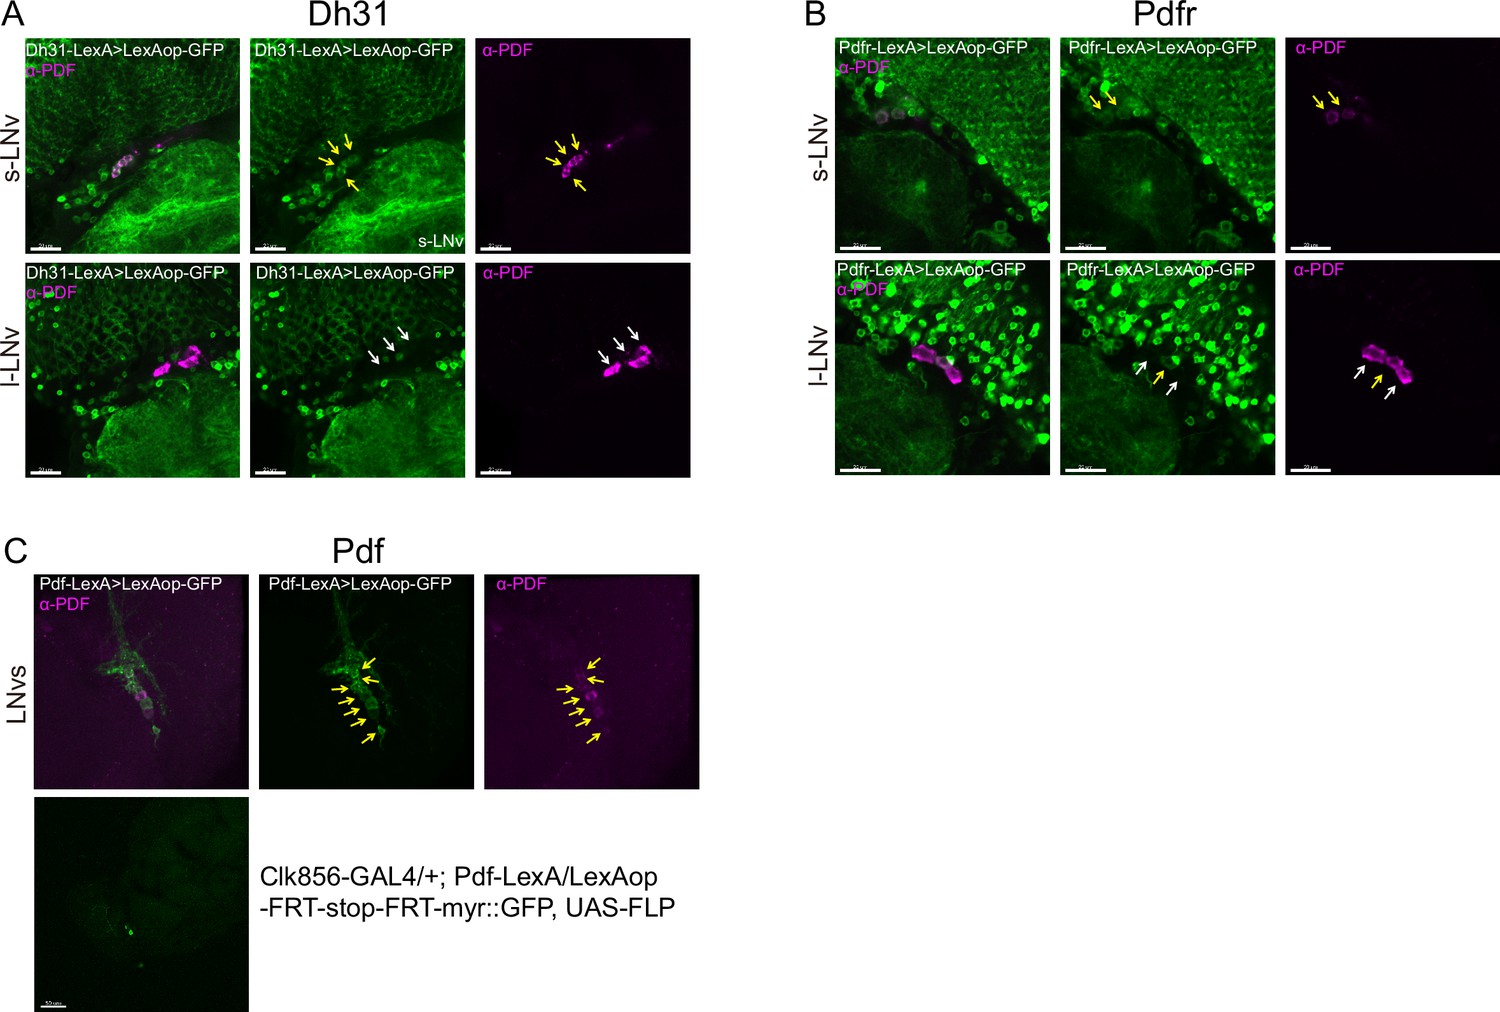
Co-localization analyses of Dh31, Pdfr, and Pdf -KI-LexA with LNvs.
LNvs are labels by anti-PDF. Yellow arrowheads indicate KI-LexA (green, A, B) co-localized with anti-PDF (violet, A–C) and white arrowheads indicate KI-LexA did not co-localize with anti-PDF. (C) Pdf-KI-LexA labels all PDF-positive LNvs but only scattered signal observed when intersect with CLK856-GAL4.
Figure 5 with 2 supplements
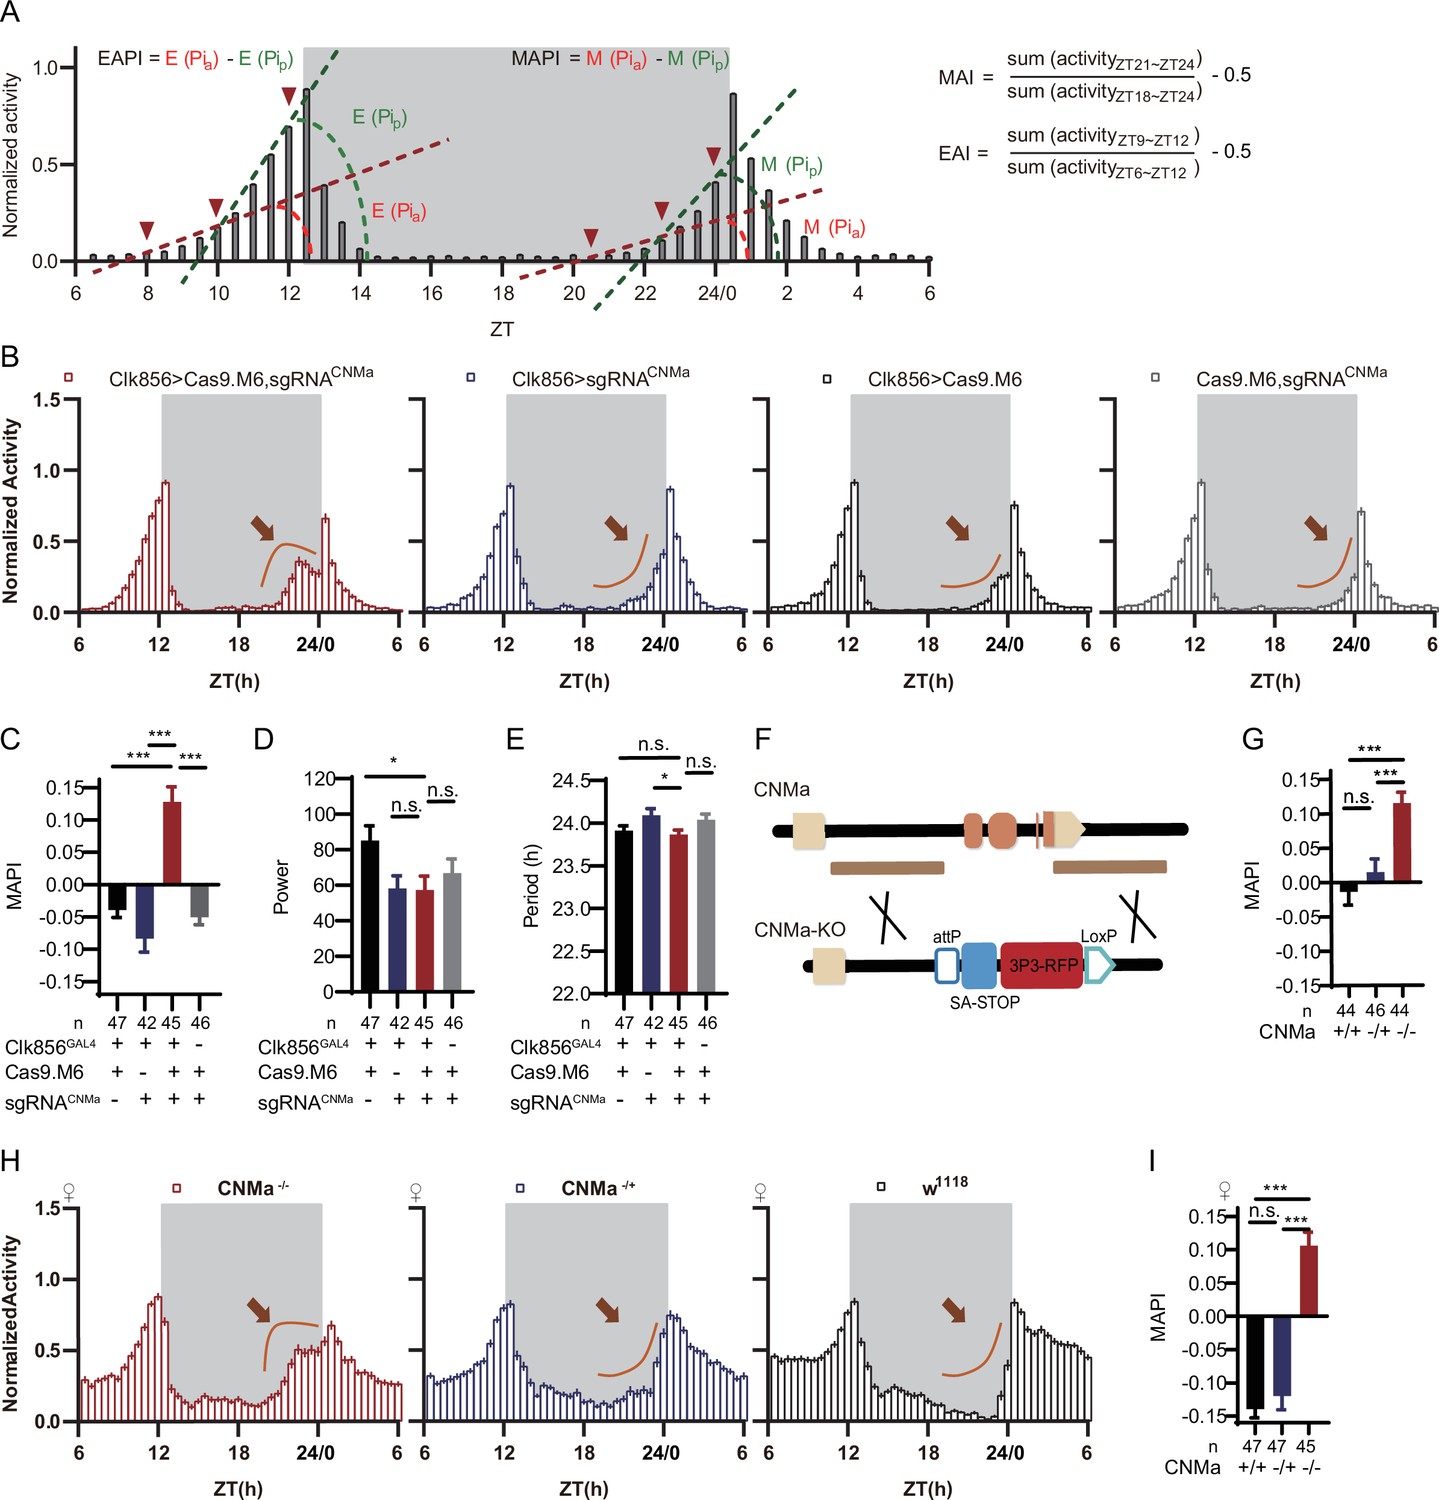
CNMa regulation of morning anticipation in clock neuron.
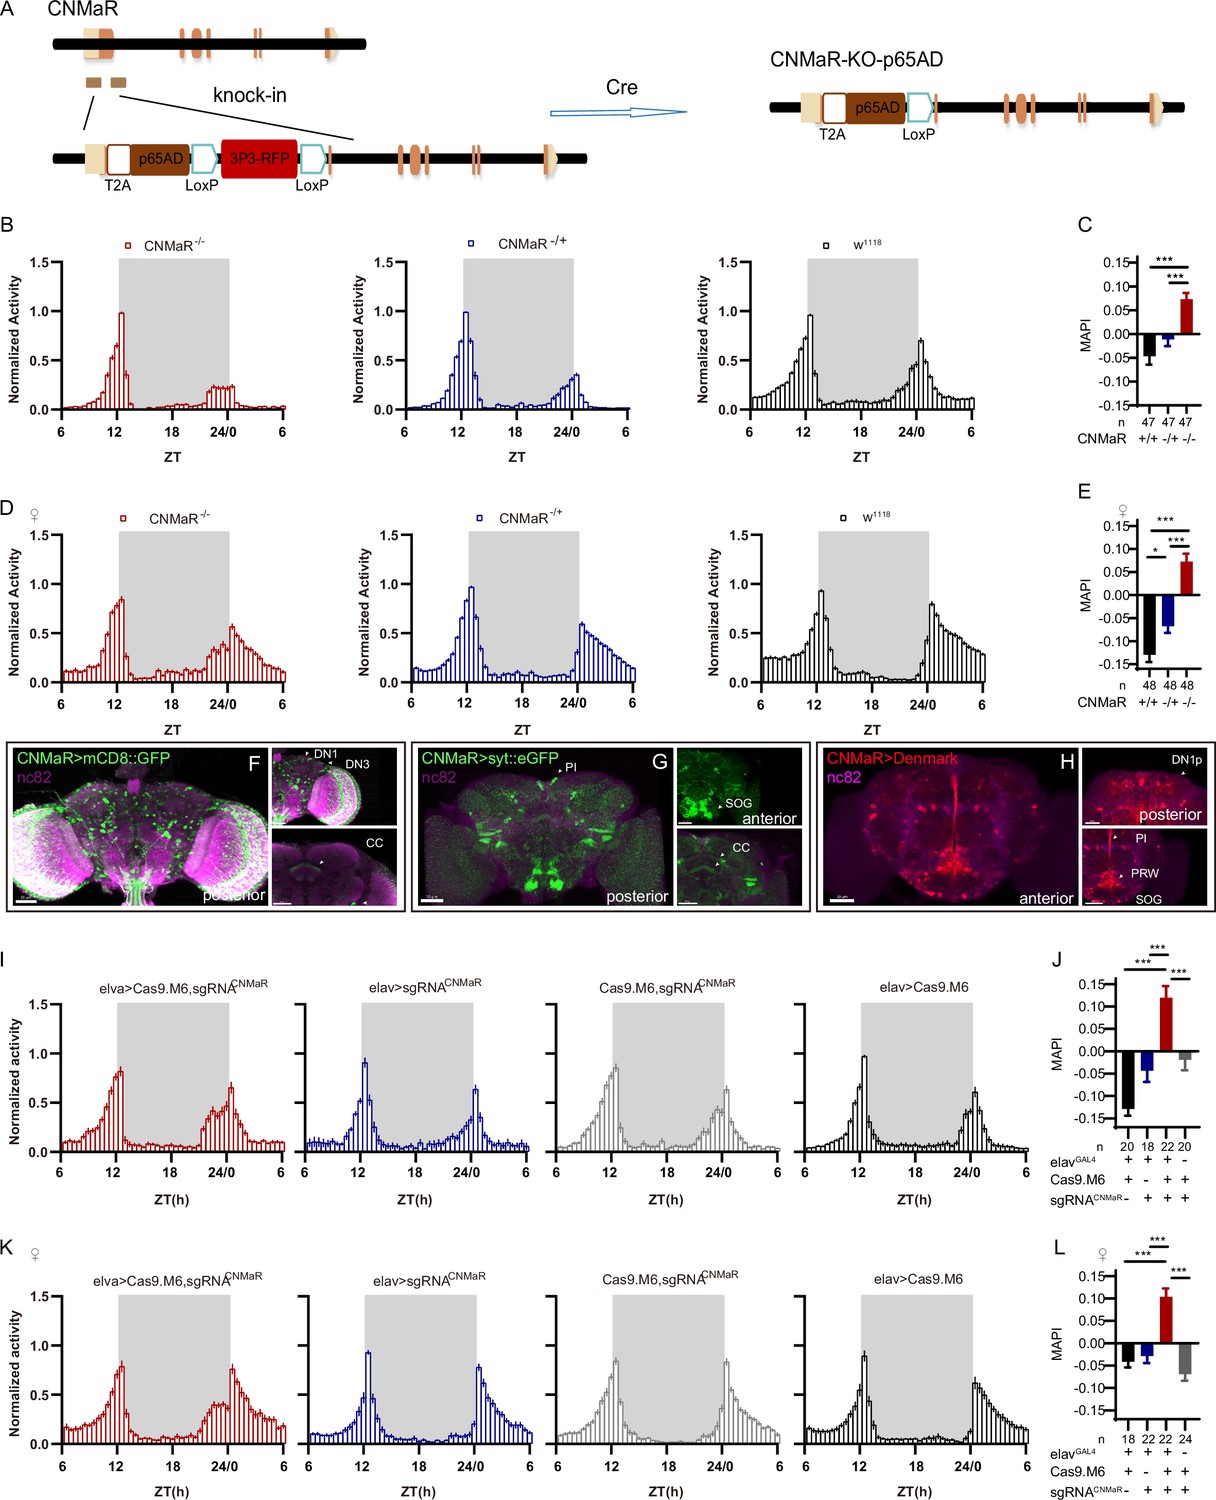
(A) Schematic of morning anticipation index (MAI), evening anticipation index (EAI), morning anticipation pattern index (MAPI), and evening anticipation pattern index (EAPI) definition. (B) Activity plots of male flies with CNMa knockout in clock neurons (red) and controls (blue, black, and gray), plotted in 30 min bins. An advancement of morning activity peak was presented in CNMa clock neuron-specific mutants (brown arrowhead). (C–E) Statistical analyses of MAPI, power, and period of flies in (B). MAPI was significantly increased in clock neurons-specific CNMa-deficient flies (C) while power (D) and period (E) were not changed. (F) Schematic of CNMaKO generation. The entire encoding region of CNMa was replaced by an attP-SAstop-3P3-RFP-loxP cassette using CRISPR-Cas9 strategy. (G) Statistical analysis of MAPI of male CNMaKO flies (red) and controls (blue and black). MAPI significantly increased in male CNMaKO flies. (H) Activity plots of female CNMaKO flies (red) and controls (blue and black). (I) Statistical analysis of MAPI of female CNMaKO flies (red) and controls (blue and black). MAPI was significantly increased in female CNMaKO flies.
-
Figure 5—source data 1
Data points for Figure 5B–E and G–I.
- https://cdn.elifesciences.org/articles/91927/elife-91927-fig5-data1-v1.zip
Figure 5—figure supplement 1
Disruption of chemoconnectome (CCT) genes due to leaky expression of Cas9.M9.
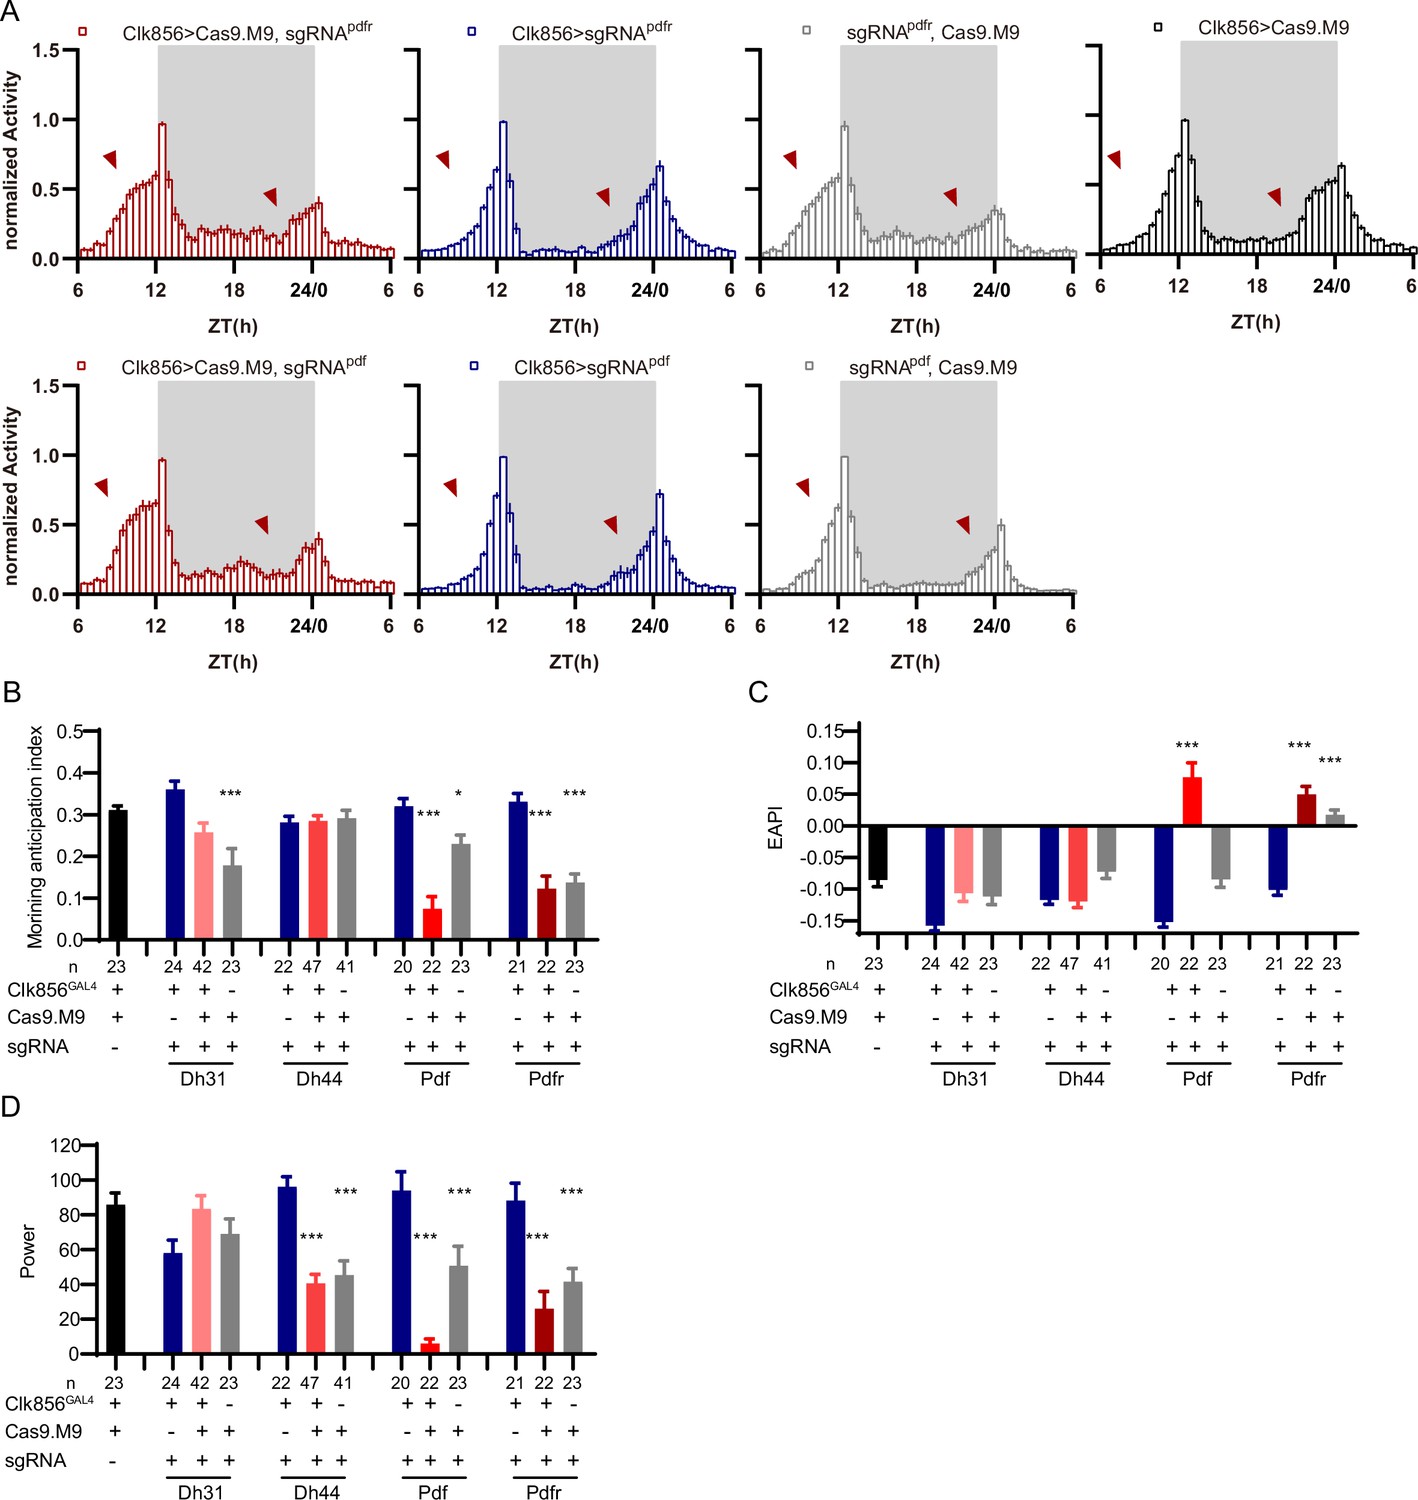
(A) Activity plots of Pdfr or Pdf clock neuron knockout flies (red) and control groups (blue, black, and gray). (B–D) Statistical analyses of morning anticipation index (B), evening anticipation pattern index (EAPI) (C), and power (D) after CCT genes were knockdown by Cas9.M9/sgRNAs. Leakage expression of Cas9.M9 and sgRNAs might disrupt target genes at certain levels (gray bar). Cas9.M9 denotes UAS-Cas9.M9. sgRNA denotes UAS-sgRNA. The Kruskal–Wallis test followed by Dunn’s post test was used, each experimental group (Clk856-GAL4/UAS-sgRNAtarget gene;UAS-Cas9.M9/+ and +/UAS-sgRNAtarget gene;+/UAS-Cas9.M9 in this figure) was compared to the two genotype controls (Clk856-GAL4/UAS-sgRNAtarget gene and Clk86-GAL4/+; UAS-Cas9.M9/+ ) . ***p<0.001, **p<0.01, *p<0.05. Only the results displaying statistically significant differences were annotated on the graph.
-
Figure 5—figure supplement 1—source data 1
Data points for Figure 5—figure supplement 1A–D.
- https://cdn.elifesciences.org/articles/91927/elife-91927-fig5-figsupp1-data1-v1.zip
Figure 5—figure supplement 2
Morning activity advanced by loss of CNMa.
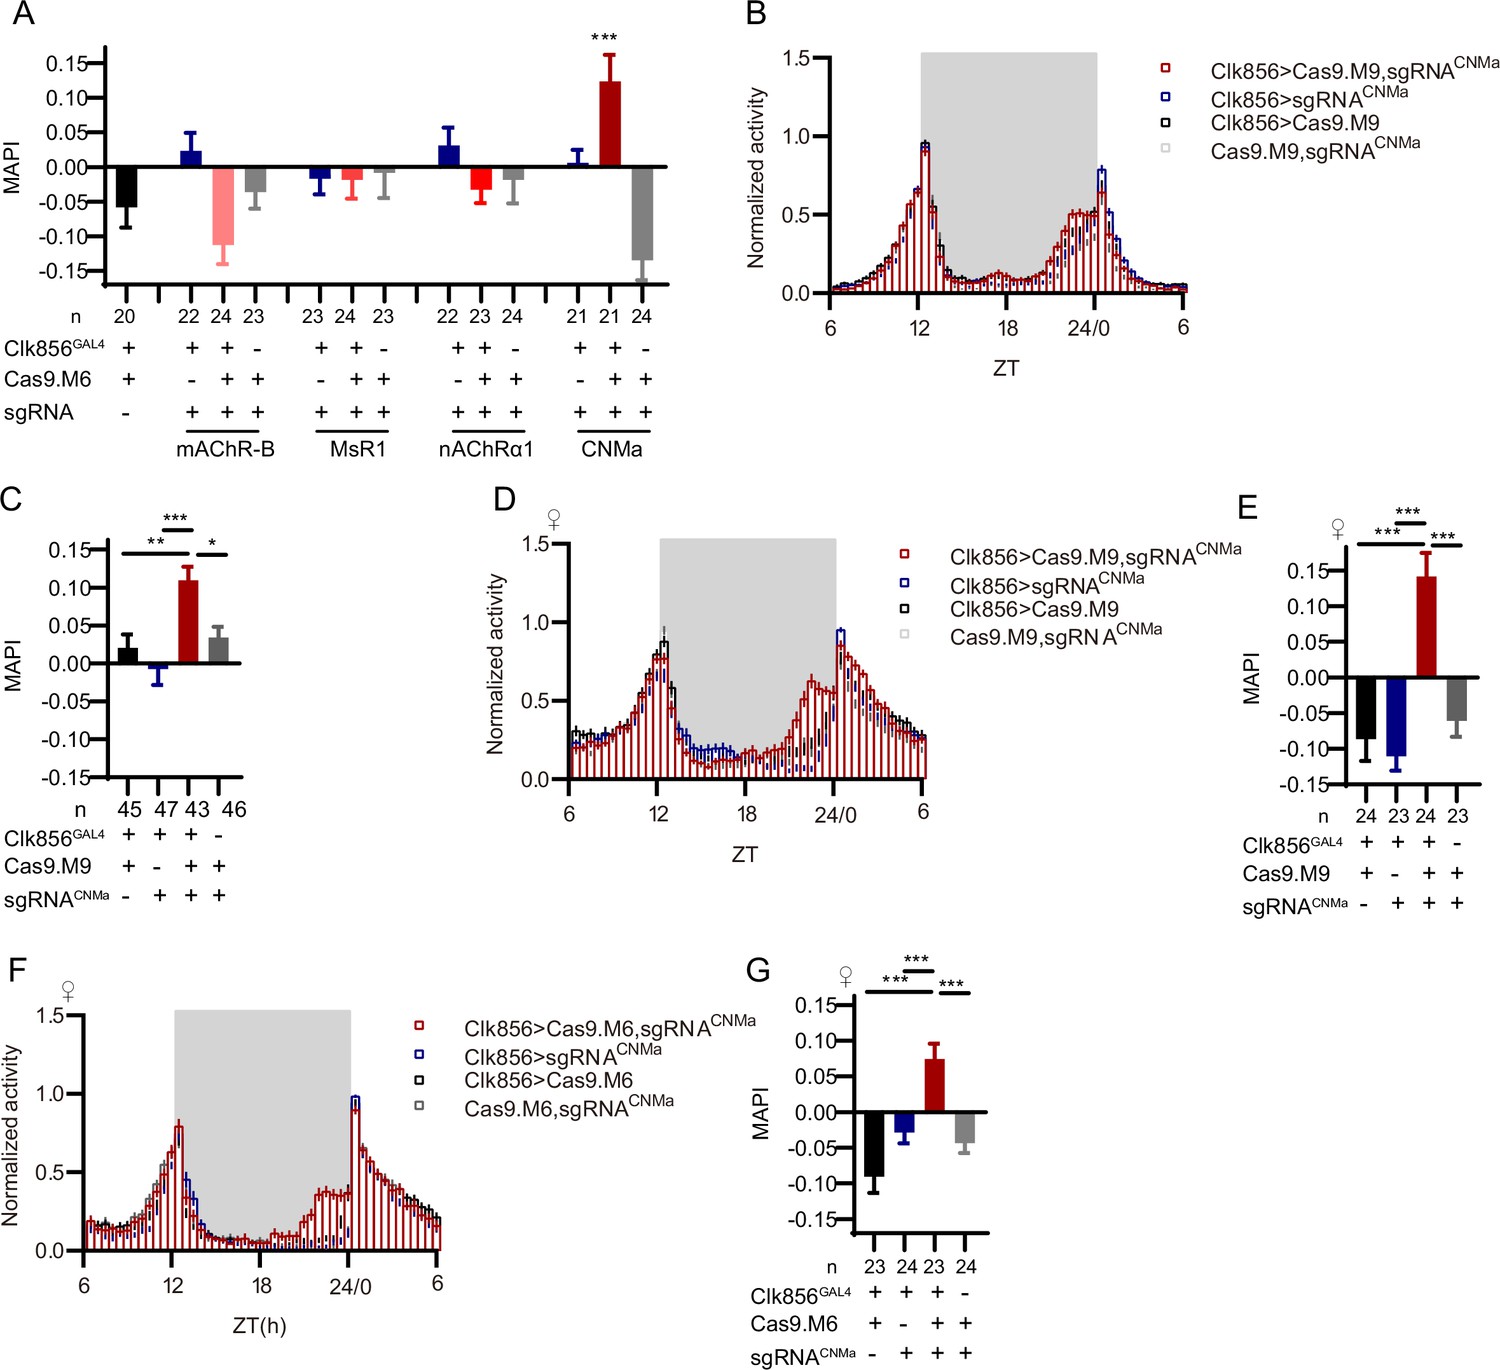
(A) Morning anticipation pattern index (MAPI) statistical analyses after mAChR-B, MsR1, nAChRα1, and CNMa knockout in clock neurons. Only the CNMa knockout in clock neurons increased MAPI significantly. (B–E) Activity plots (B, D) and statistical analyses (C, E) of male (B, C) and female (D, E) flies with CNMa knockout in clock neurons. Both male and female flies showed advanced morning activity patterns (B, C) and increased MAPIs (D, E). UAS-sgRNACNMa/UAS-Cas9.M9 flies showed a slightly increased MAPI which indicate possible leakage expression. (F, G) Activity plots (F) and statistical analyses (G) of female flies with CNMa deficient in clock neurons with Cas9.M6 used. The Kruskal–Wallis test followed by Dunn’s post test was used, each experimental group (Clk856-GAL4/UAS-sgRNAtarget gene;UAS-Cas9.M6/+ in this figure) was compared to the three genotype controls (Clk856-GAL4/UAS-sgRNAtarget gene, Clk86-GAL4/+; UAS-Cas9.M6/+ and UAS-sgRNAtarget gene/+;UAS-Cas9.M6/+) . ***p<0.001, **p<0.01, *p<0.05.Only the results displaying statistically significant differences were annotated on the graph.
-
Figure 5—figure supplement 2—source data 1
Data points for Figure 5—figure supplement 2A–G.
- https://cdn.elifesciences.org/articles/91927/elife-91927-fig5-figsupp2-data1-v1.zip
Figure 6 with 2 supplements
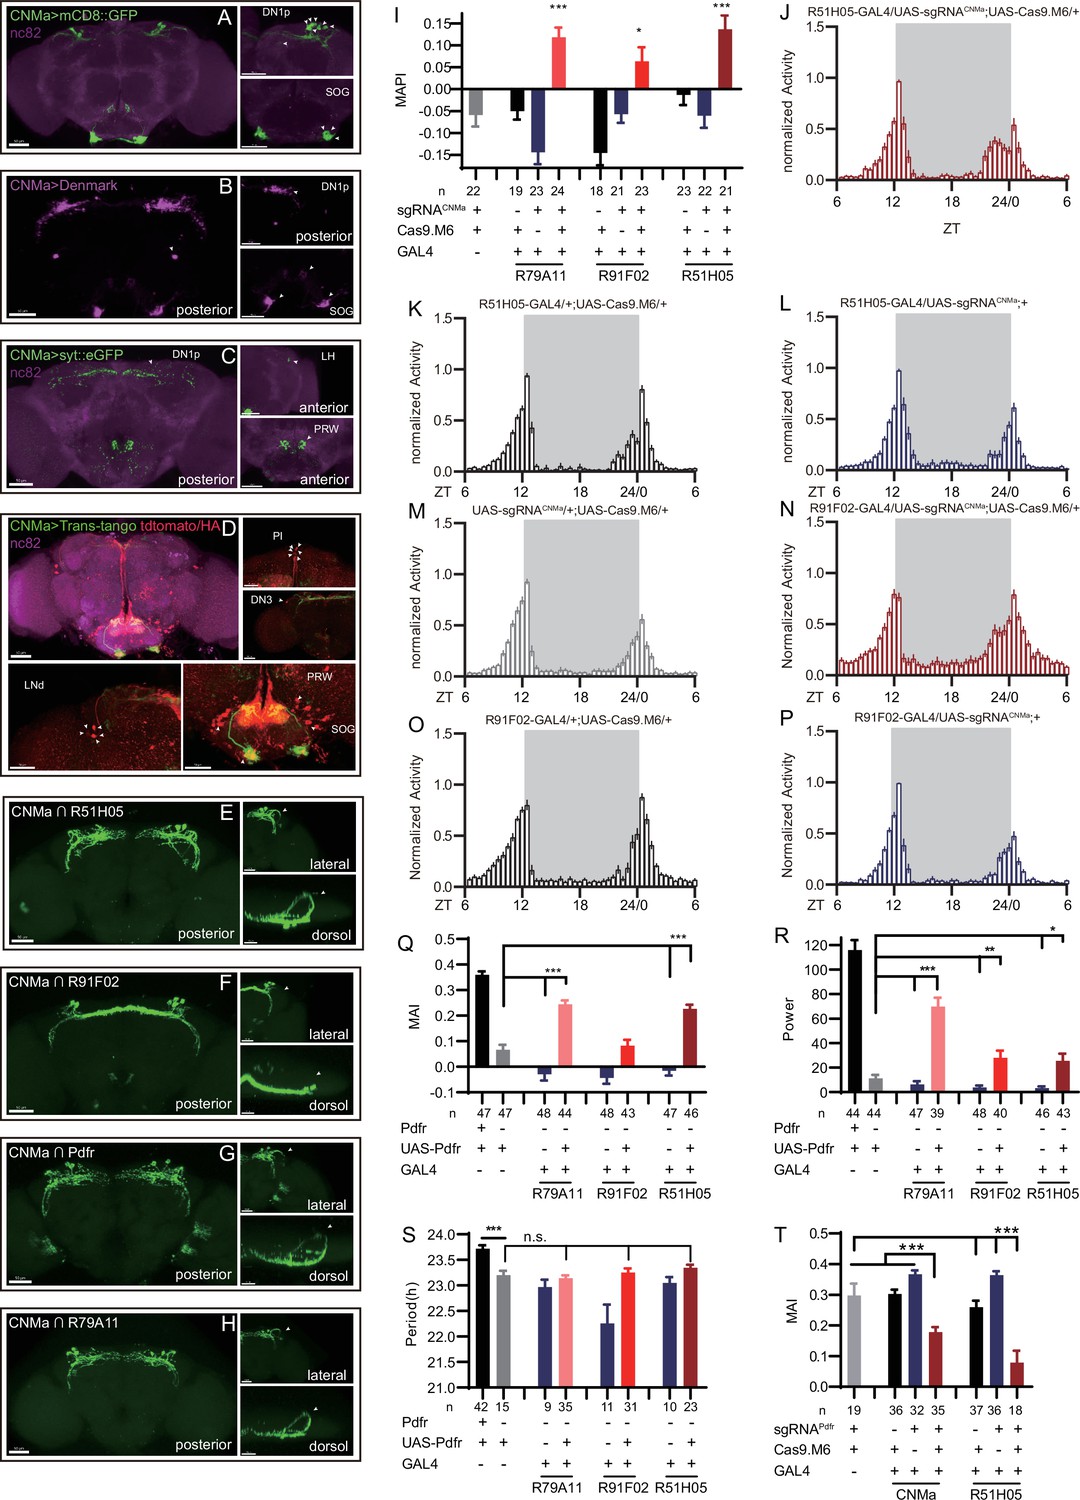
Expression, projection, and trans-projection feature of CNMa neurons and its functional subset.
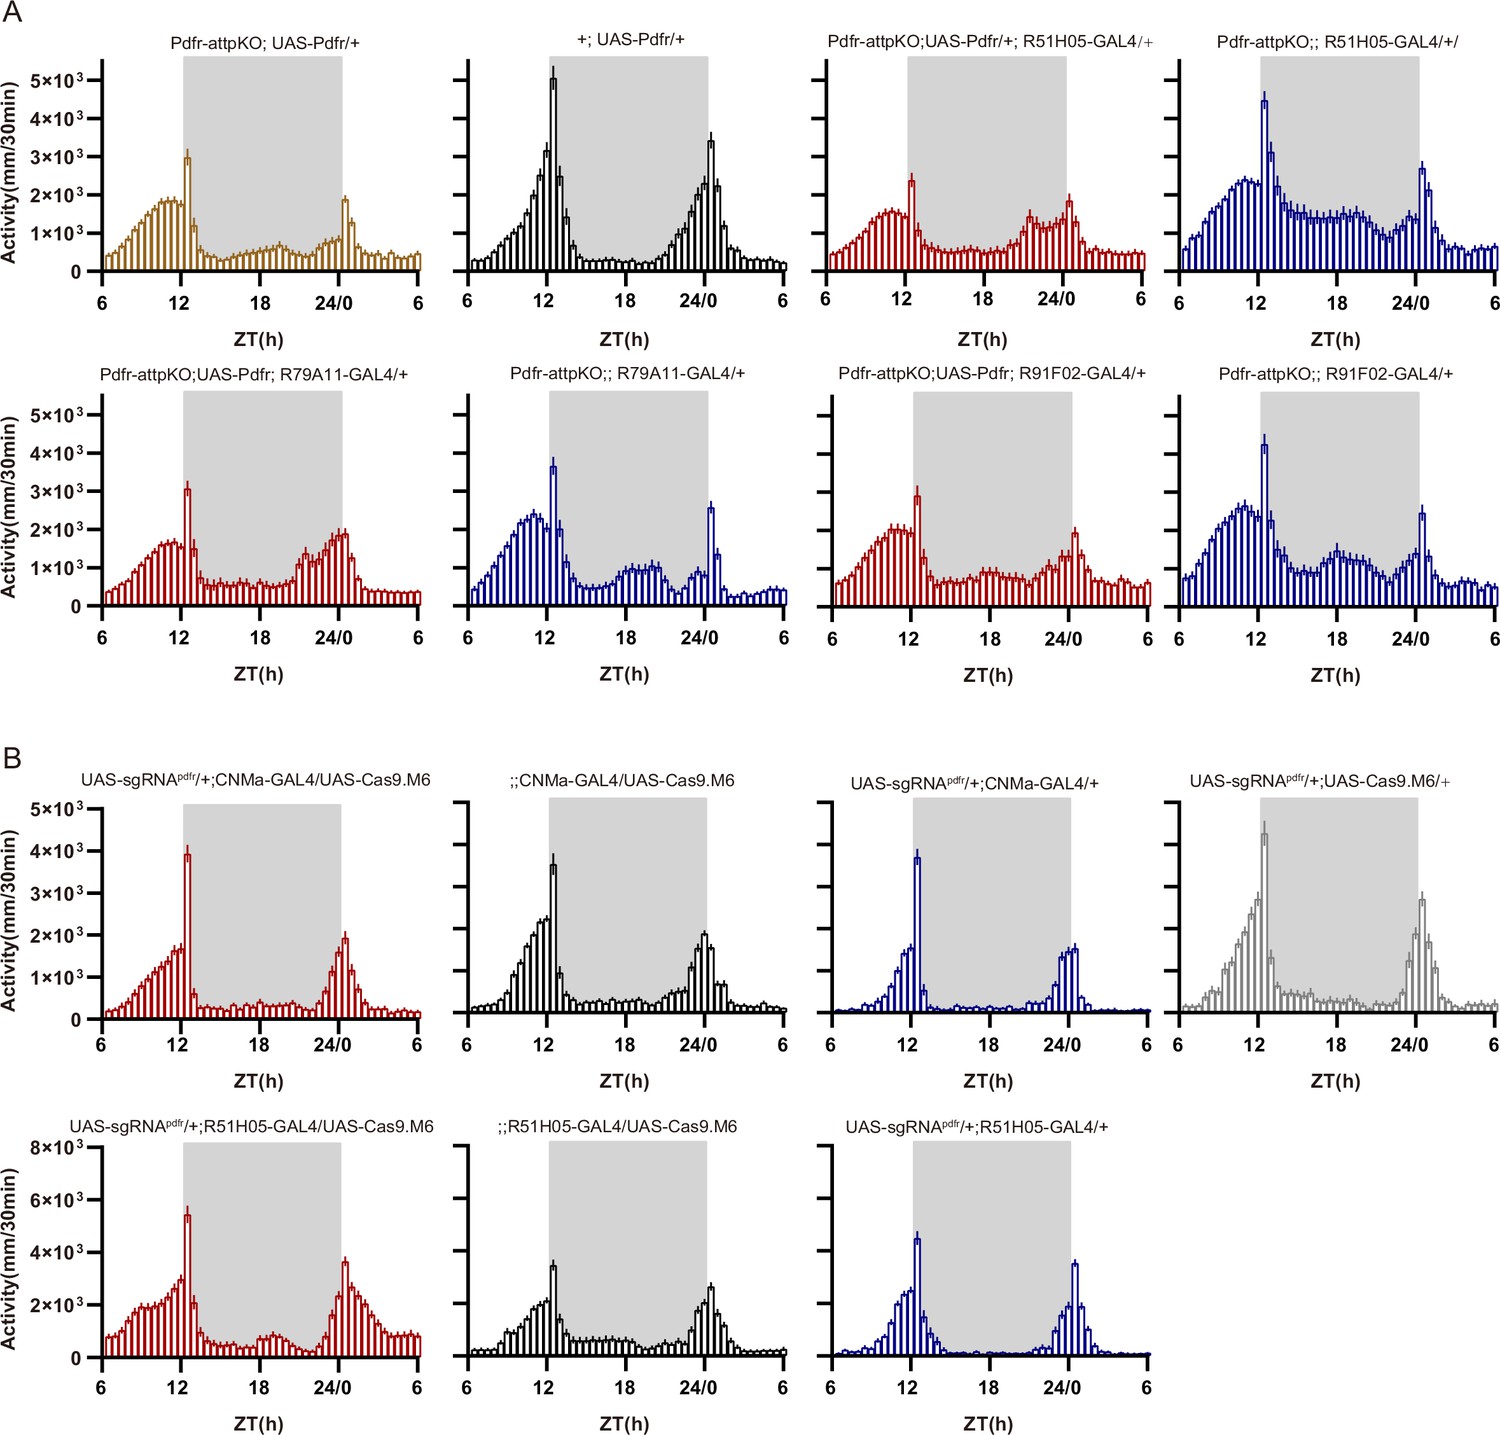
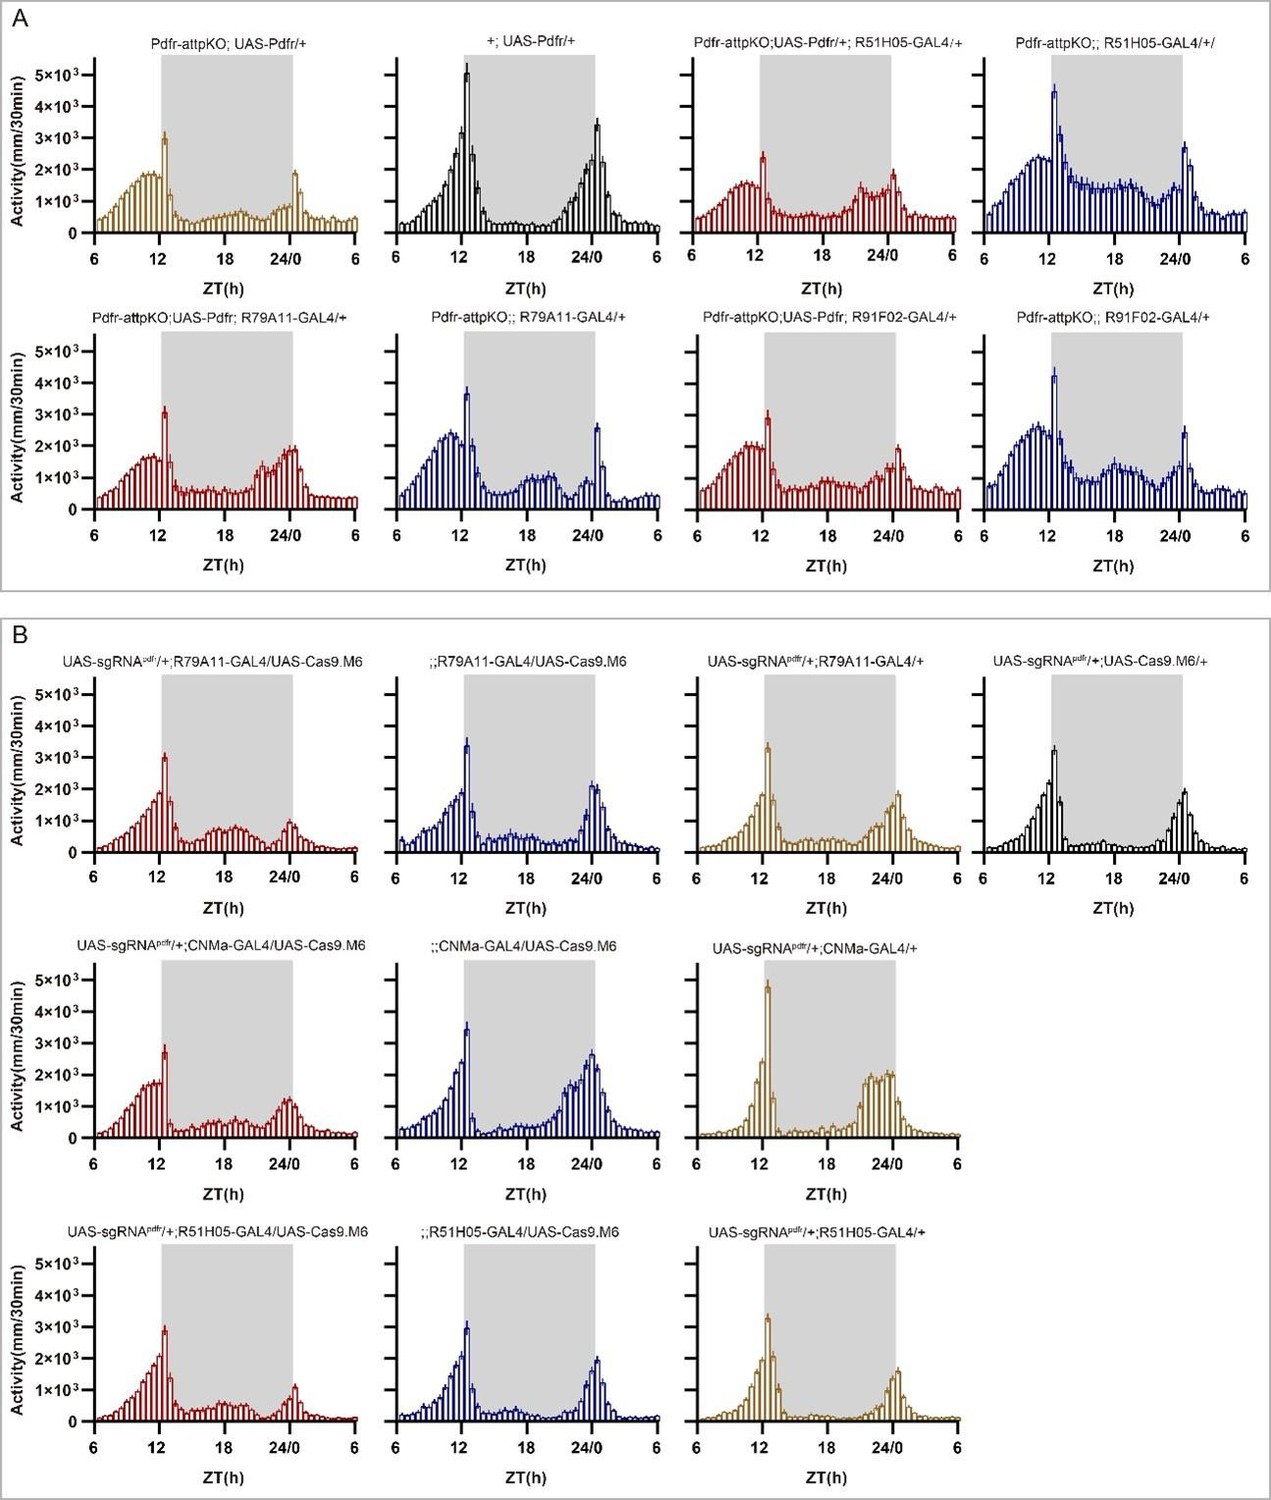
(A–C) Expression and projection patterns of CNMa-KI-Gal4 in the brain. Membrane, dendrites, and axon projections are labeled by mCD8::GFP (A), Denmark (B), and syt::eGFP (C), respectively. (D) Downstream neurons labeled through trans-tango driven by CNMa-KI-GAL4. Arrowheads indicate candidate downstream neurons: 6 neurons in PI, 1 pair in DN3, 5 pairs in LNd, and about 15 pairs in subesophageal ganglion (SOG). (E–H) Intersection of DN1p CNMa neurons with DN1p-labeled drivers. GMR51H05-GAL4 (E), GMR91F02-GAL4 (F), Pdfr-KI-GAL4 (G), and GMR79A11-GAL4 (H) were intersected with CNMa-p65AD, UAS-LexADBD, LexAop-myr::GFP. Two type I (E, G, H) neurons projected to anterior region and four type II (F) neurons had fewer projections to anterior region. Scale bar, 50 μm. (I) Morning anticipation pattern index (MAPI) was significantly increased in all three DN1p drivers-mediated CNMa knockout. Each experimental group(red) was compared to their three genotype controls. (J, K) Activity plots of CNMa knockout in R51H05-GAL4 (J) and R91F02-GAL4 (N) neurons. R51H05-GAL4-mediated CNMa knockout flies showed an advanced morning activity peak (J), while R91F02-Gal4-mediated CNMa knockout flies did not (N). (Q–S) Statistical analyses of morning anticipation index (MAI), power, and period. Each experimental group (pink, light red and dark red)was compared to their genotype controls (grey and blue).There was no significant difference between Pdfr-attpKO;UAS-Pdfr/+; R91F02-GAL4/+(light red) and its genotype control Pdfr-attpKO;UAS-Pdfr/+ (grey). Pdfr reintroduction in R79A11 and R51H05 neurons could partially rescue the MAI-decreased phenotype of Pdfr knockout flies. (T) Statistical analyses of MAI of Pdfr knocking out in CNMa-GAL4 and R51H05-GAL4-labeled neurons.
-
Figure 6—source data 1
Data points for Figure 6I–T.
- https://cdn.elifesciences.org/articles/91927/elife-91927-fig6-data1-v1.zip
Figure 6—figure supplement 1
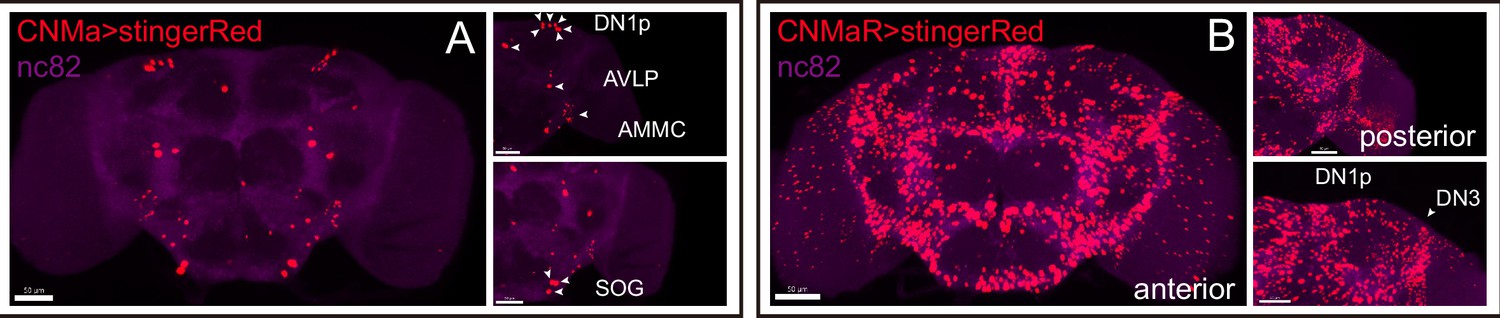
Expression of CNMa and CNMaR.
(A, B) Stinger::Red-labeled neurons in brain driven by CNMa-KI-GAL4 (A) and CNMaR-KI-GAL4 (B).
Figure 6—figure supplement 2
Activity plots related to Figure 6.
-
Figure 6—figure supplement 2—source data 1
Data points for Figure 6—figure supplement 2A and B.
- https://cdn.elifesciences.org/articles/91927/elife-91927-fig6-figsupp2-data1-v1.zip
Figure 7
CNMaR regulation of morning anticipation.
(A) Schematic of CNMaRKO-p65AD generation. Most of the first exon in CNMaR was replaced by a T2A-p65AD-loxP-3P3-RFP-loxP cassette using CRISPR-Cas9 strategy and the T2A-p65AD was inserted in the reading frame of the remaining CNMaR codon. 3P3-RFP was removed latterly by Cre mediated recombination. (B–E) Activity plot (B, D) and statistical analysis (C, E) of male (B–C) or female (D–E) CNMaRKO-p65AD flies (red) and genotypical controls (blue and black). Morning anticipation pattern index (MAPI) was significantly increased in both male and female CNMaRKO-p65AD flies. In this and other figures, ‘♀’ denotes female flies. (F–H) Expression and projection patterns of CNMaR-KI-Gal4 in the brain. Scale bars, 50 μm. (I–L) Activity plots (I, K) and statistical analyses (J, L) of CNMaR pan-neuronal knockout flies. Neuronal knockout of CNMaR increased MAPI (J, L).
-
Figure 7—source data 1
Data points for Figure 7B–E and I–L.
- https://cdn.elifesciences.org/articles/91927/elife-91927-fig7-data1-v1.zip
Author response image 1

Author response image 2

Author response image 3

Author response image 4
Author response image 5

Author response image 6
Author response image 7

Tables
Key resources table
| Reagent type (species) or resource | Designation | Source or reference | Identifiers | Additional information |
|---|---|---|---|---|
| Antibody | Anti-Bruchpilot antibody (mouse monoclonal) | Developmental Studies Hybridoma Bank | RRID:AB_2314866 | 1:40 |
| Antibody | Anti-TH (rabbit polyclonal) | Novus Biologicals | NOVUS NB300-109; RRID:AB_10077691 | 1:1000 |
| Antibody | Anti-mouse IgG-Alexa633 (goat polyclonal) | Invitrogen | Cat#A-21050; RRID:AB_2535718 | 1:1000 |
| Antibody | Anti-PDF (mouse monoclonal) | Developmental Studies Hybridoma Bank | PDF C7; RRID:AB_760350, AB_2315084 | 1:200 |
| Antibody | Anti-LK (rabbit polyclonal) | Rao Lab | Anti-LK | 1:1000 |
| Antibody | Anti-DSK (rabbit polyclonal) | Wu et al., 2020 | Anti-DSK | 1:1000 |
| Antibody | Anti-rabbit IgG- Alexa488 (goat polyclonal) | Invitrogen | Cat# A-11008; RRID:AB_143165 | 1:1000 |
| Antibody | Anti-rabbit IgG- Alexa633 (goat polyclonal) | Invitrogen | Cat# A-21070; RRID:AB_2535731 | 1:1000 |
| Genetic reagent (Drosophila melanogaster) | CCT attP KO lines | Deng et al., 2019 | N/A | |
| Genetic reagent (D. melanogaster) | CCT KI GAL4/LexA lines | Deng et al., 2019 | N/A | |
| Genetic reagent (D. melanogaster) | Clk856-GAL4 | Bloomington | #93198 | |
| Genetic reagent (D. melanogaster) | w*, P{nos-phiC31\int.NLS}X;;P{CaryP}attP2 | Jenelia Research Campus | N/A | |
| Genetic reagent (D. melanogaster) | w1118;P{GMR57C10-GAL4}attP40 | Luo Lab, Peking University | N/A | |
| Genetic reagent (D. melanogaster) | y1 M{vas-int.Dm}ZH-2A w*; PBac{y+-attP-9A}VK00005 | Bloomington | #24862 | |
| Genetic reagent (D. melanogaster) | y1 w* P{nos-phiC31\int.NLS}X; P{CaryP}attP40 | Bloomington | #79604 | |
| Genetic reagent (D. melanogaster) | y1 w*; P{UAS-mCD8::GFP.L}LL5, P{UAS-mCD8::GFP.L}2 | Bloomington | #5137 | |
| Genetic reagent (D. melanogaster) | w1118;P{GMR57C10-GAL4}attP2 | Bloomington | #39171 | |
| Genetic reagent (D. melanogaster) | 20xUAS-IVS-FLP1;in attp2 | Jenelia Research Campus | 1116428 PJFRC152 | |
| Genetic reagent (D. melanogaster) | 20xUAS-IVS-FLP1;;PEST in attp2 | Jenelia Research Campus | 1116430 PJFRC150 | |
| Genetic reagent (D. melanogaster) | y[1] sc[*] v[1]; P{y[+t7.7] v[+t1.8]=VALIUM20-EGFP.shRNA.1}attP40 | Bloomington | #41555 | |
| Genetic reagent (D. melanogaster) | P{13XLexAop2(FRT.stop)myr::GFP}attP2 | Rubin Lab | #1116847 | |
| Genetic reagent (D. melanogaster) | y1 w*; P{elav-Switch.O}GSG301 | Bloomington | #43642 | |
| Genetic reagent (D. melanogaster) | w*; P{trans-Tango}attP40 | Bloomington | #77123 | |
| Genetic reagent (D. melanogaster) | w[1118]; P{w[+mC]=UAS-RedStinger}4/CyO | Bloomington | #8546 | |
| Genetic reagent (D. melanogaster) | w[1118]; P{w[+mC]=UAS-Denmark}2 | Bloomington | #33062 | |
| Genetic reagent (D. melanogaster) | w[*]; P{w[+mC]=UAS-syt.eGFP}3 | Bloomington | #6926 | |
| Genetic reagent (D. melanogaster) | UAS-Cas9.HC(VK00005) | This paper | Rao Lab | |
| Genetic reagent (D. melanogaster) | UAS-Cas9.M0(attP40 or attP2) | This paper | Rao Lab | |
| Genetic reagent (D. melanogaster) | UAS-Cas9.M6(attP40 or attP2) | This paper | Rao Lab | |
| Genetic reagent (D. melanogaster) | UAS-Cas9.M9(attP40 or attP2) | This paper | Rao Lab | |
| Recombinant DNA reagent | pACU2 | Jan Lab, University of California, San Francisco | N/A | |
| Recombinant DNA reagent | pEC14 | Deng et al., 2019 | N/A | |
| Recombinant DNA reagent | pBSK-attB-loxP-myc-T2A-Gal4-GMR-miniwhite | Deng et al., 2019 | N/A | |
| Recombinant DNA reagent | pAAV-Efla-DIO-mScarlet | Addgene | #130999 | |
| Software, algorithm | MATLAB | MathWorks, Natick, MA | https://www.mathworks.com/products/matlab.html | |
| Software, algorithm | Prism 8 | GraphPad | https://www.graphpad.com/ | |
| Software, algorithm | Imaris | Bitplane | http://www.bitplane.com/imaris/imaris |
Additional files
-
Supplementary file 1
List of conditional chemoconectome knockin flies.
- https://cdn.elifesciences.org/articles/91927/elife-91927-supp1-v1.docx
-
Supplementary file 2
cCCT knockin strategy cannot rescue all knockout phenotype.
- https://cdn.elifesciences.org/articles/91927/elife-91927-supp2-v1.docx
-
Supplementary file 3
List of sgRNAs targeting CCT genes.
- https://cdn.elifesciences.org/articles/91927/elife-91927-supp3-v1.docx
-
Supplementary file 4
CCT gene expression profile of clock neuron.
- https://cdn.elifesciences.org/articles/91927/elife-91927-supp4-v1.docx
-
Supplementary file 5
List of CCT genes intersected with Clk856 drivers.
- https://cdn.elifesciences.org/articles/91927/elife-91927-supp5-v1.docx
-
Supplementary file 6
Phenotypes of CCT genes knocking out in clock neurons.
- https://cdn.elifesciences.org/articles/91927/elife-91927-supp6-v1.docx
-
Supplementary file 7
Arrhythmicity related to Figure 6R.
- https://cdn.elifesciences.org/articles/91927/elife-91927-supp7-v1.docx
-
Supplementary file 8
Phenotypes of candidate CCT genes knockout in clock neurons.
- https://cdn.elifesciences.org/articles/91927/elife-91927-supp8-v1.docx
-
Supplementary file 9
Conditional knockout of VGlut in DN1s.
- https://cdn.elifesciences.org/articles/91927/elife-91927-supp9-v1.docx
-
Supplementary file 10
Sequence of pBSK-attB-FRT-HpaI-T2A-EGFP-FRT, PM04, pMsgNull, Cas9.M0, Cas9.M6, Cas9.M9, and UAS-sgRNA structure.
- https://cdn.elifesciences.org/articles/91927/elife-91927-supp10-v1.docx
-
MDAR checklist
- https://cdn.elifesciences.org/articles/91927/elife-91927-mdarchecklist1-v1.pdf
-
Source code 1
Python and R script for Drosophila activity analysis.
- https://cdn.elifesciences.org/articles/91927/elife-91927-code1-v1.zip
Download links
A two-part list of links to download the article, or parts of the article, in various formats.
Downloads (link to download the article as PDF)
Open citations (links to open the citations from this article in various online reference manager services)
Cite this article (links to download the citations from this article in formats compatible with various reference manager tools)
Conditional chemoconnectomics (cCCTomics) as a strategy for efficient and conditional targeting of chemical transmission
eLife 12:RP91927.
https://doi.org/10.7554/eLife.91927.3


