Comment on 'Accumbens cholinergic interneurons dynamically promote dopamine release and enable motivation'
- Neuroscience Institute and Fresco Institute for Parkinson's and Movement Disorders, University Grossman School of Medicine, United States
- Department of Neurobiology, Howard Hughes Medical Institute, Harvard Medical School, United States
- Department of Neurology, University of California, San Francisco, United States
Figures
Figure 1 with 1 supplement
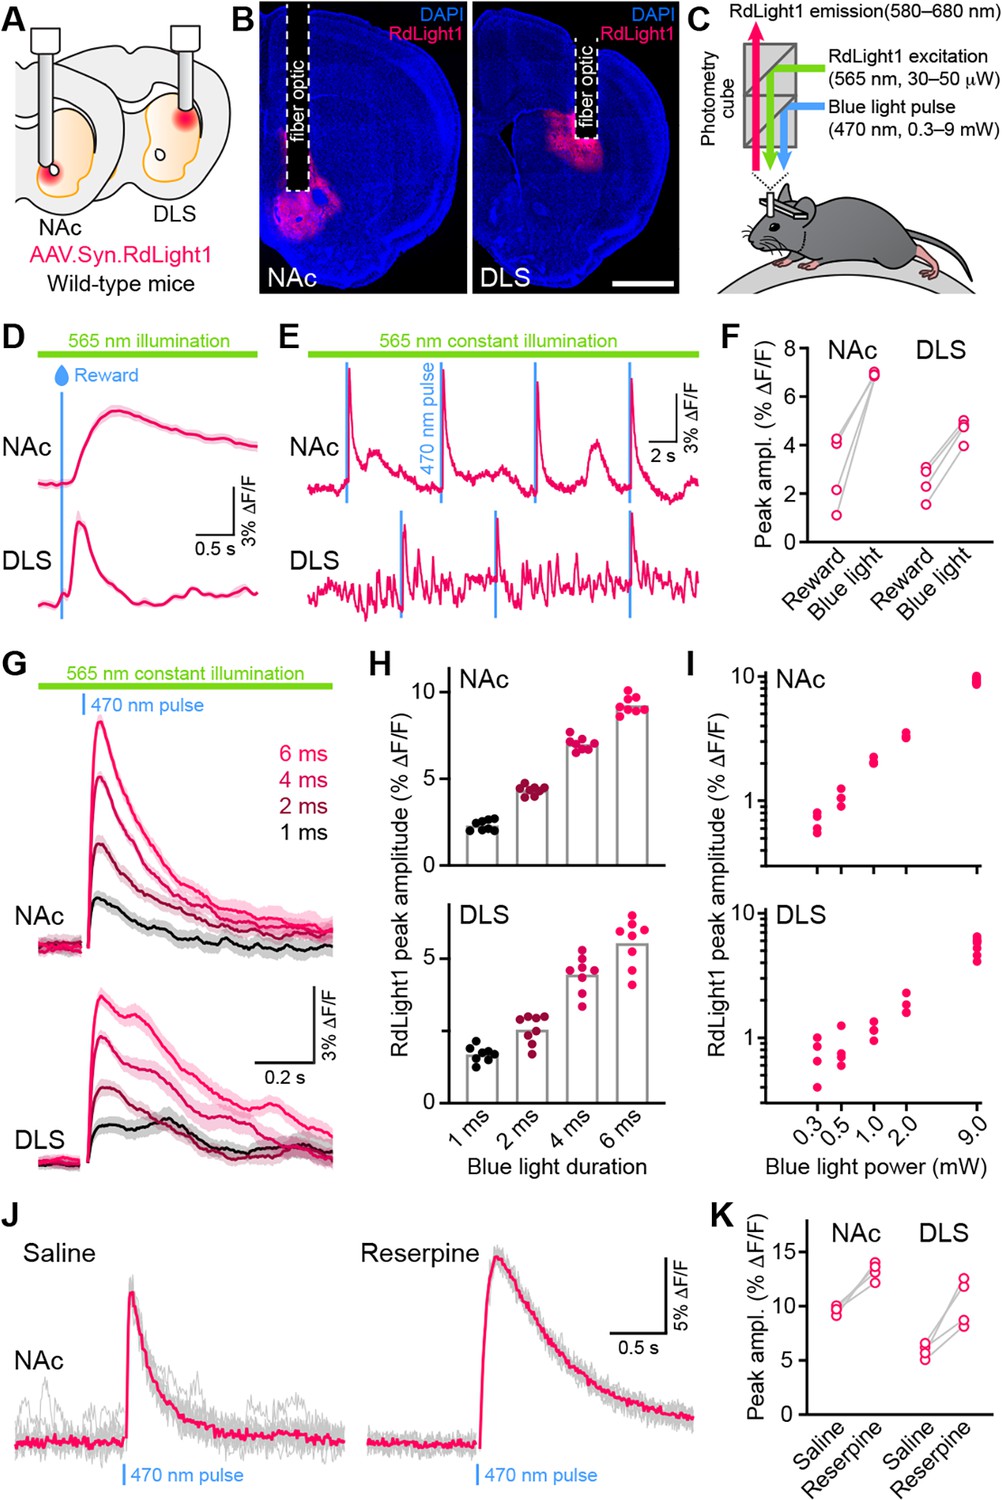
Blue light evokes RdLight1 photoactivation transients resembling DA release.
(A) The red DA sensor RdLight1 was virally expressed in neurons of the nucleus accumbens (NAc) or dorsolateral striatum (DLS) of wild-type mice and imaged in vivo via chronically-implanted fiber optic cannulas. (B) Example fixed coronal sections from two mice stained for the nuclear marker DAPI (blue) and imaged by epifluorescence showing RdLight1 (red) expression in the NAc (left) and DLS (right). Scale bar: 1 mm. (C) Experimental setup for imaging RdLight1 by photometry while delivering blue light (470 nm) via the same fiber optic in awake behaving mice. RdLight1 was excited with continuous yellow-green light (565 nm) and red emitted fluorescence (580–680 nm) was collected via a dual color photometry minicube. (D) Representative RdLight1 transient aligned to water reward delivery in NAc (top) and DLS (bottom). Solid lines are the mean of 15 trials. Shaded area shows SEM. (E) Continuous RdLight1 photometric imaging during immobility in NAc (top) and DLS (bottom). Blue lines highlight 4 ms-long pulses of blue light (9 mW) delivered through the same fiber optic, each followed by a delayed RdLight1 transient. (F) Comparison of mean reward- and blue light-evoked RdLight1 transients recorded in N=4 mice in NAc and DLS. (G) RdLight1 fluorescence (emitted upon continuous excitation with 565 nm light) increases upon exposure to blue light pulses (470 nm; 9 mW at tip of patch cord) of various durations (1–6ms; color-coded) in the NAc (top) and DLS (bottom) of a representative mouse. Solid lines are the mean of 15 blue light presentations. Shaded area shows SEM. (H) The magnitude of blue light-evoked RdLight1 fluorescence transients (i.e., photoactivation) grows with the duration of blue light pulses in both NAc (top; N=8 mice) and DLS (bottom; N=8 mice).(I) Magnitude of RdLight1 fluorescence transients evoked by 6 ms-long blue light pulses of various intensities (0.3–9 mW, measured at tip of patch cord) in both NAc (top) and DLS (bottom). Data plotted on Log10-Log10 scales. (J) Representative RdLight1 photoactivation transients (red: mean of 10 individual traces shown in gray) imaged in NAc before and after systemic block of vesicular DA release with reserpine. (K) Magnitude of blue light-evoked (9 mW; 6ms pulse width) RdLight1 photoactivation before and after reserpine treatment in NAc (N=4 mice) and DLS (N=4 mice).
Figure 1—figure supplement 1
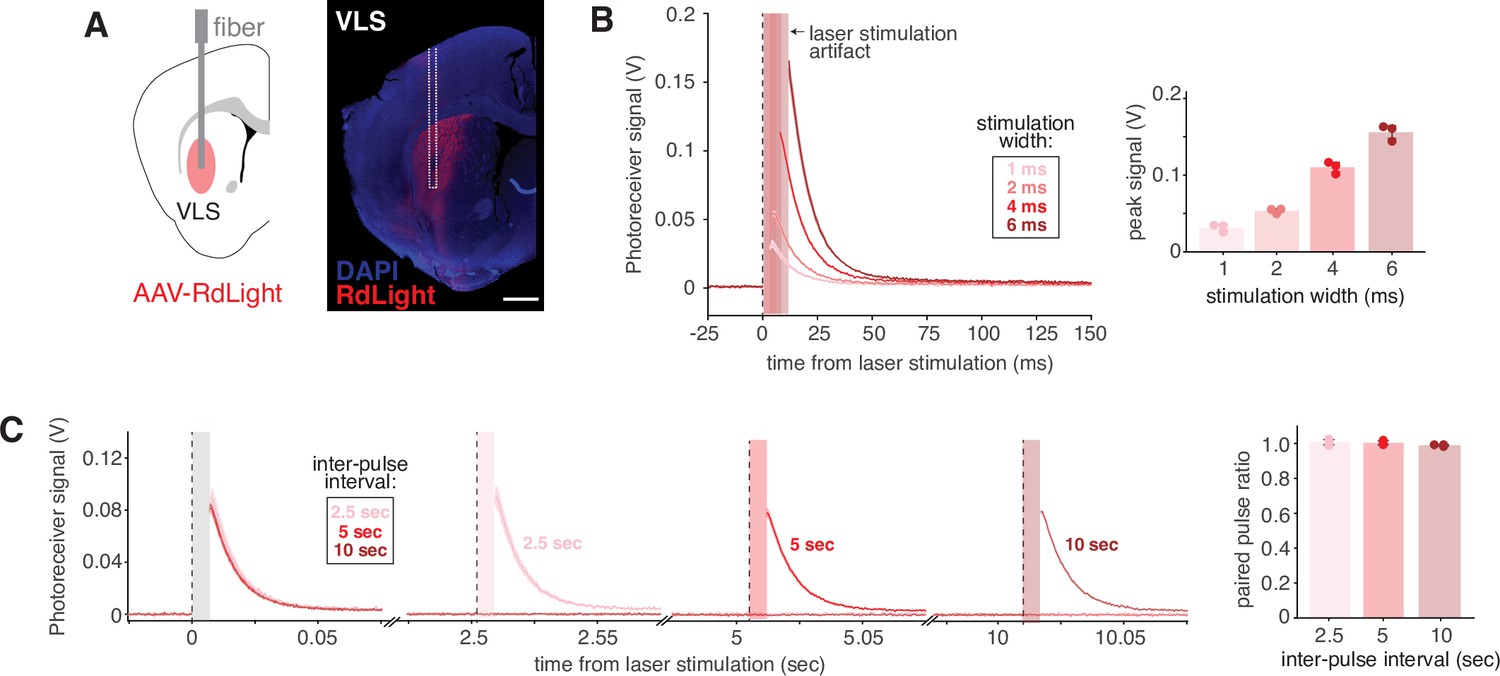
Blue light evokes RdLight1 photoactivation in VLS.
(A) Injection and fiber implantation scheme for mice expressing RdLight1 in the VLS (left). Images of sensor expression from a representative mouse (right; scale bar: 800 µm). (B) Mean (± SEM) RdLight1 photoactivation signal in the VLS in response to 1, 2, 4, or 6ms single pulses of blue light stimulation (10 mW) coupled with constant 565 nm illumination (30 µW). Colored vertical bars indicate laser stimulation artifacts which were removed. Mean maximal RdLight1 photoactivation signals recorded under the indicated stimulation widths are displayed. Each dot represents the average signal from a single mouse, and error bars denote the standard deviation (N=3 mice). (C) Mean (± SEM) RdLight1 photoactivation signal in the VLS in response to a pair of 4ms blue light pulses (10 mW) separated by the indicated inter-pulse intervals. Mean paired pulse ratios are displayed (magnitude of pulse #2/pulse #1), with each dot representing a single mouse, and the error bars denoting the standard deviation (N=3 mice).
Figure 2
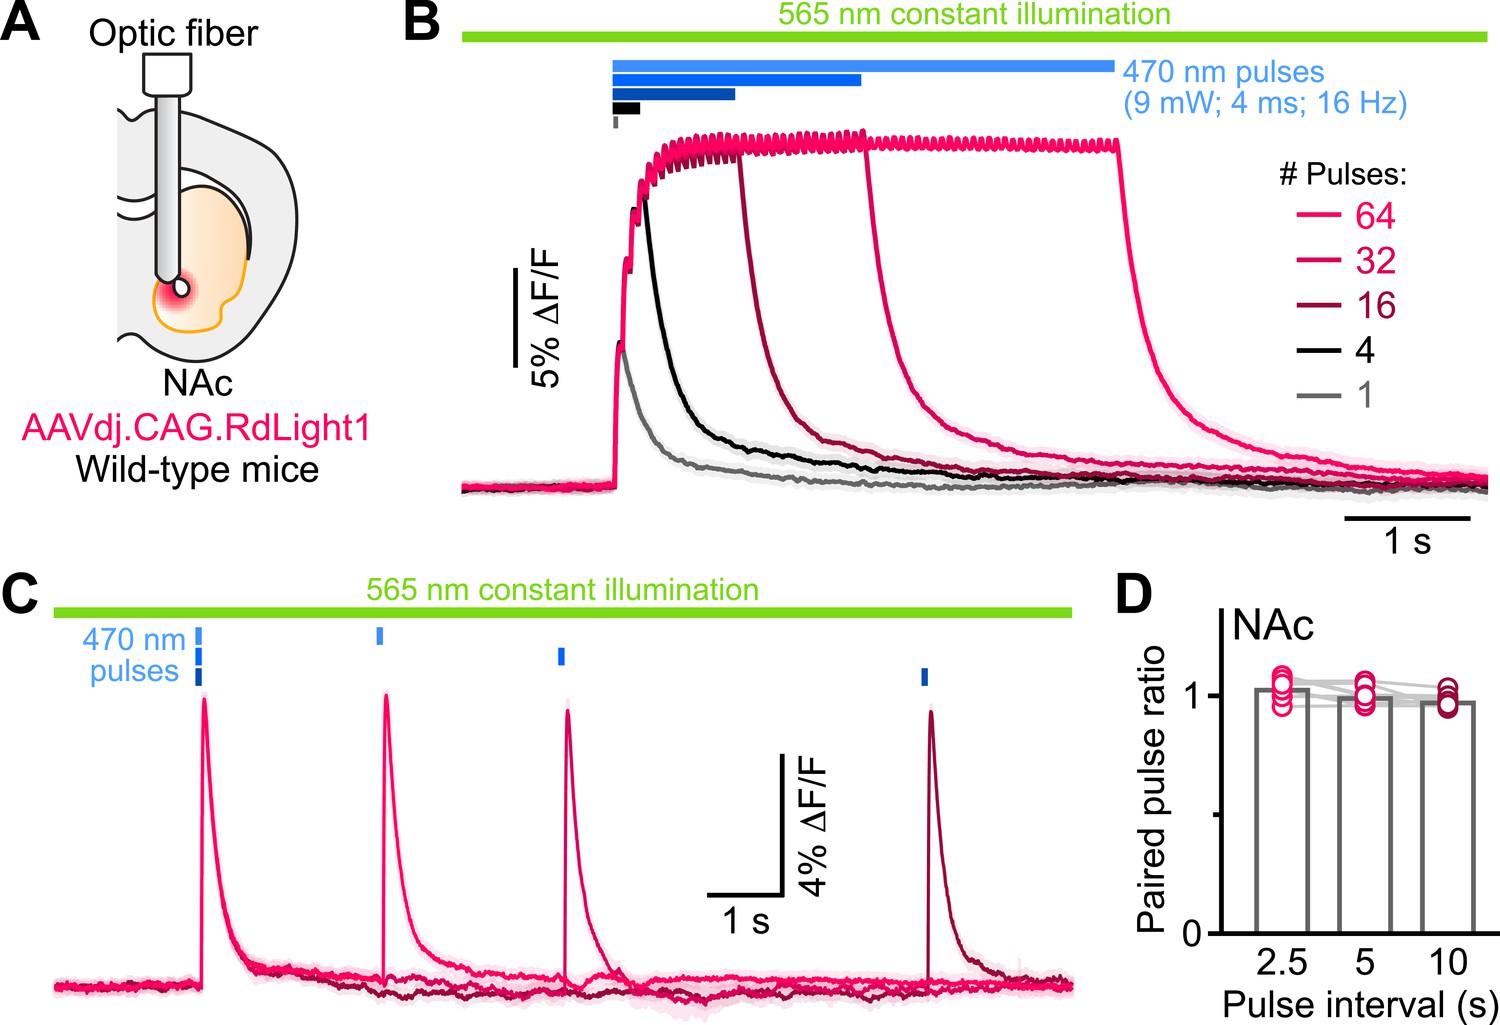
RdLight1 photoactivation transients evoked by blue light pulse trains.
(A) Experimental setup. (B) Mean (± SEM) RdLight1 photoactivation in response to 1, 4, 16, 32, or 64 blue light pulses (9 mW, 4ms width, 16 Hz frequency) in the NAc of a representative mouse. Green bar illustrates constant 565 nm illumination. Blue bars show when blue light is delivered. (C) Same as (B) for pairs of blue light pulses (9 mW, 4ms width) separated by 2.5, 5 and 10 s. (D) Mean paired-pulse ratio (magnitude of pulse #2/pulse #1) across three inter-pulse intervals in each of N=8 mice.
Additional files
Download links
A two-part list of links to download the article, or parts of the article, in various formats.
Downloads (link to download the article as PDF)
Open citations (links to open the citations from this article in various online reference manager services)
Cite this article (links to download the citations from this article in formats compatible with various reference manager tools)
Comment on 'Accumbens cholinergic interneurons dynamically promote dopamine release and enable motivation'
eLife 13:e95694.
https://doi.org/10.7554/eLife.95694


