Extinction risk and conservation of the world’s sharks and rays
- Simon Fraser University, Canada
- NatureBureau International, United Kingdom
- College of William and Mary, United States
- British Antarctic Survey, Natural Environment Research Council, United Kingdom
- Charles Darwin University, Australia
- NOAA/National Marine Fisheries Service, United States
- The Ocean Foundation, United States
- National Institute of Water and Atmospheric Research, New Zealand
- International Union for the Conservation of Nature, United Kingdom
- James Cook University, Australia
- University of Florida, United States
- Old Dominion University, United States
- South African Museum, South Africa
- Moss Landing Marine Laboratories, United States
- Australian Institute of Marine Science, Australia
- Conservation International, United States
- Commonwealth Scientific and Industrial Research Organisation, Australia
Figures
Figure 1
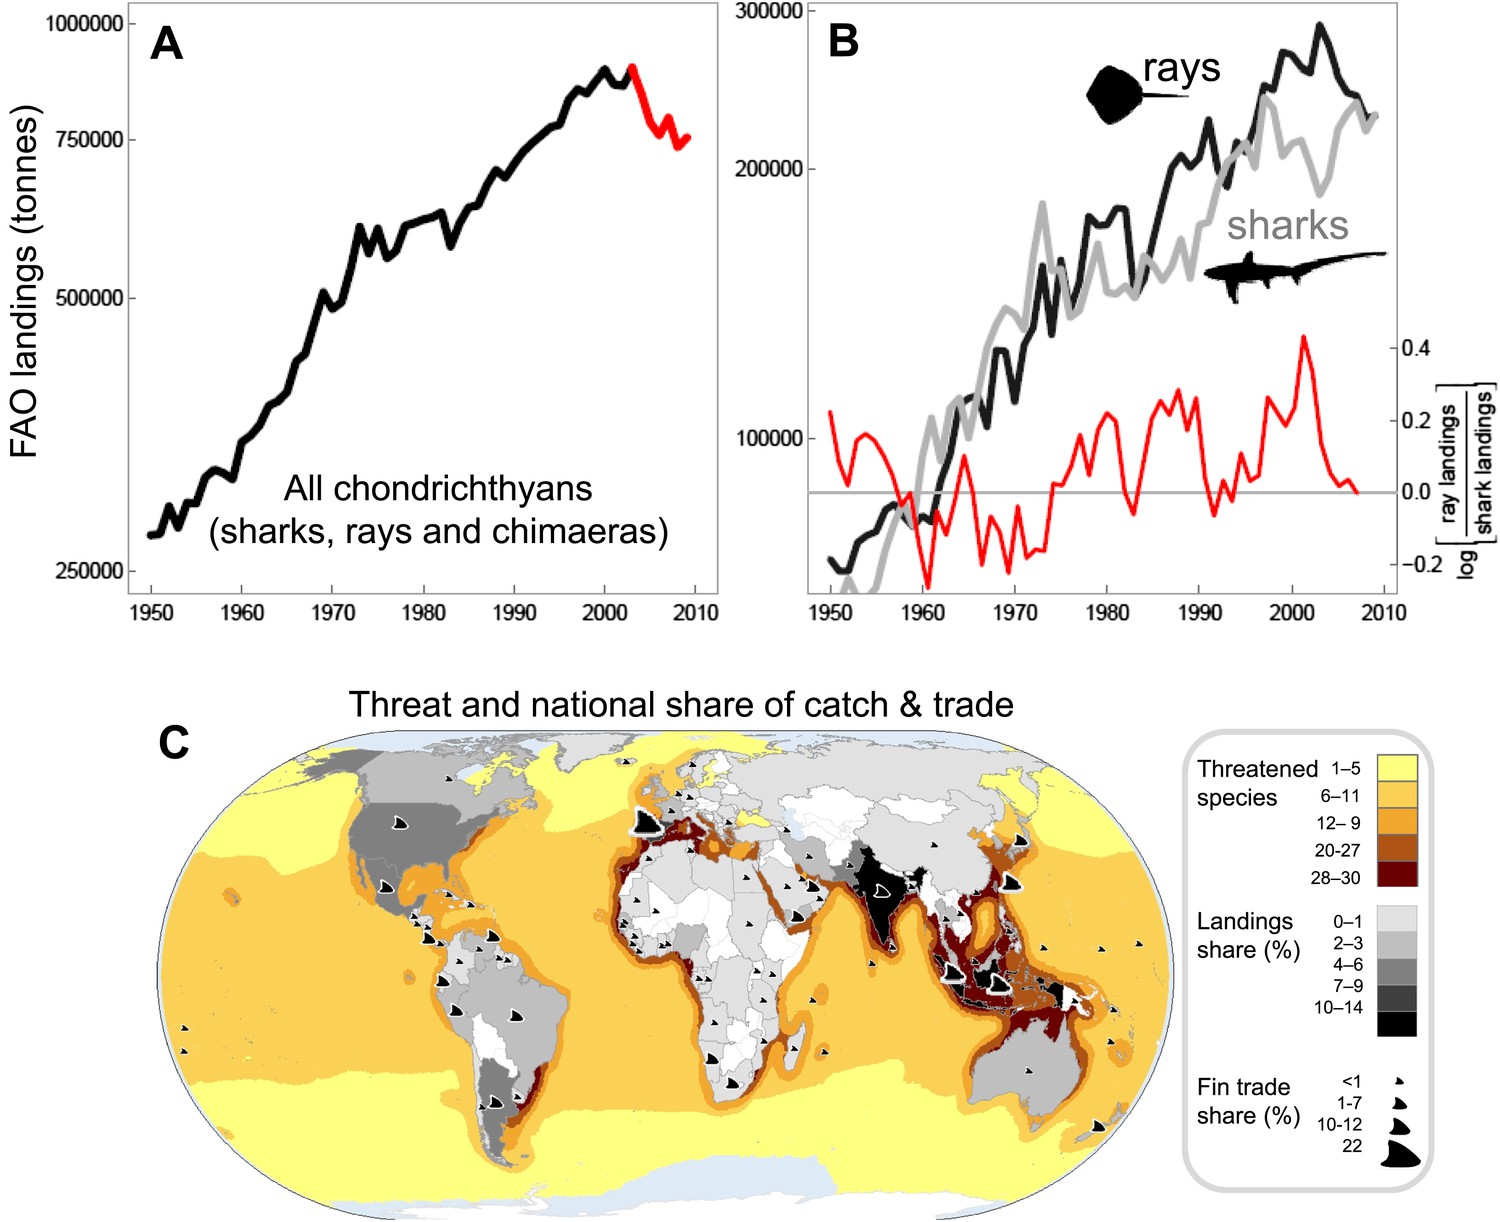
The trajectory and spatial pattern of chondrichthyan fisheries catch landings and fin exports.
(A) The landed catch of chondrichthyans reported to the Food and Agriculture Organization of the United Nations from 1950 to 2009 up to the peak in 2003 (black) and subsequent decline (red). (B) The rising contribution of rays to the taxonomically-differentiated global reported landed catch: shark landings (light gray), ray landings (black), log ratio [rays/sharks], (red). Log ratios >0 occur when more rays are landed than sharks. The peak catch of taxonomically-differentiated rays peaks at 289,353 tonnes in 2003. (C) The main shark and ray fishing nations are gray-shaded according to their percent share of the total average annual chondrichthyan landings reported to FAO from 1999 to 2009. The relative share of shark and ray fin trade exports to Hong Kong in 2010 are represented by fin size. The taxonomically-differentiated proportion excludes the ‘nei’ (not elsewhere included) and generic ‘sharks, rays, and chimaeras’ category.
Figure 2 with 1 supplement
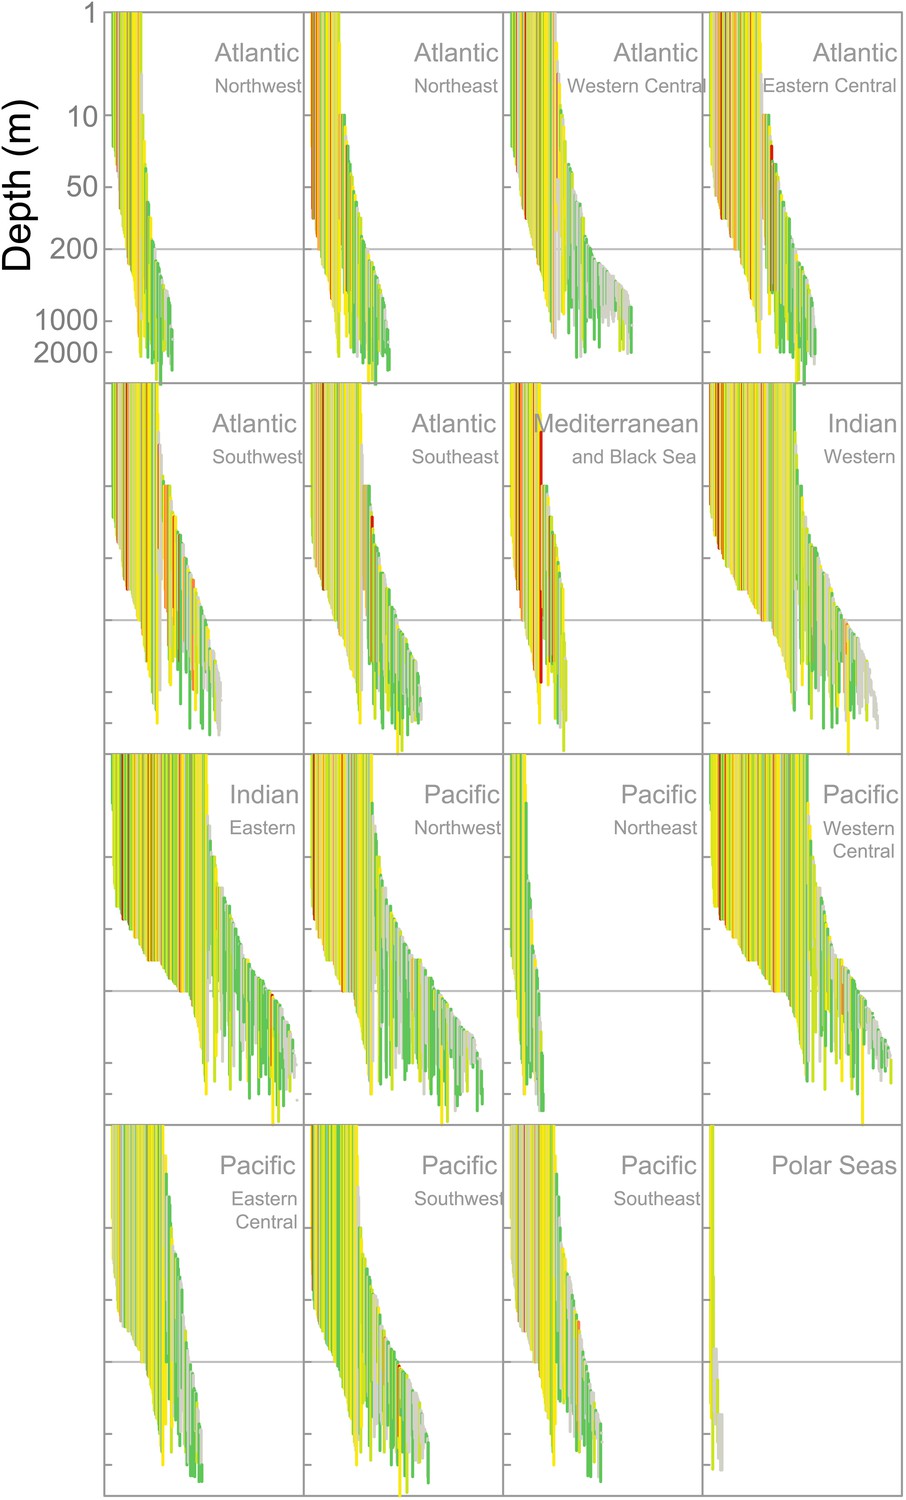
IUCN Red List Threat status and the depth distribution of chondrichthyans in the FAO Fishing Areas of the Atlantic, Indian and Pacific Oceans, and Polar Seas.
Each vertical line represents the depth range (surface-ward minimum to the maximum reported depth) of each species and is colored according to threat status: CR (red), EN (orange), VU (yellow), NT (pale green), LC (green), and DD (gray). Species are ordered left to right by increasing median depth. The depth limit of the continental shelf is indicated by the horizontal gray line at 200 m. The Polar Seas include the following FAO Fishing Areas: Antarctic–Atlantic (Area 48), Indian (Area 58), Pacific (Area 88), and the Arctic Sea (Area 18).
Figure 2—figure supplement 1

Map of Food and Agriculture Organization of the United Nations Fishing Areas and their codes: 18, Arctic Sea; 21, Atlantic, Northwest; 27, Atlantic, Northeast; 31, Atlantic, Western Central; 34, Atlantic, Eastern Central; 37, Mediterranean and Black Sea; 41, Atlantic, Southwest; 47, Atlantic, Southeast; 48, Atlantic, Antarctic; 51, Indian Ocean, Western; 57, Indian Ocean, Eastern; 58, Indian Ocean, Antarctic and Southern; 61, Pacific, Northwest; 67, Pacific, Northeast; 71, Pacific, Western Central; 77, Pacific, Eastern Central; 81, Pacific, Southwest; 87, Pacific, Southeast; and, 88, Pacific, Antarctic.
https://doi.org/10.7554/eLife.00590.008
Figure 3
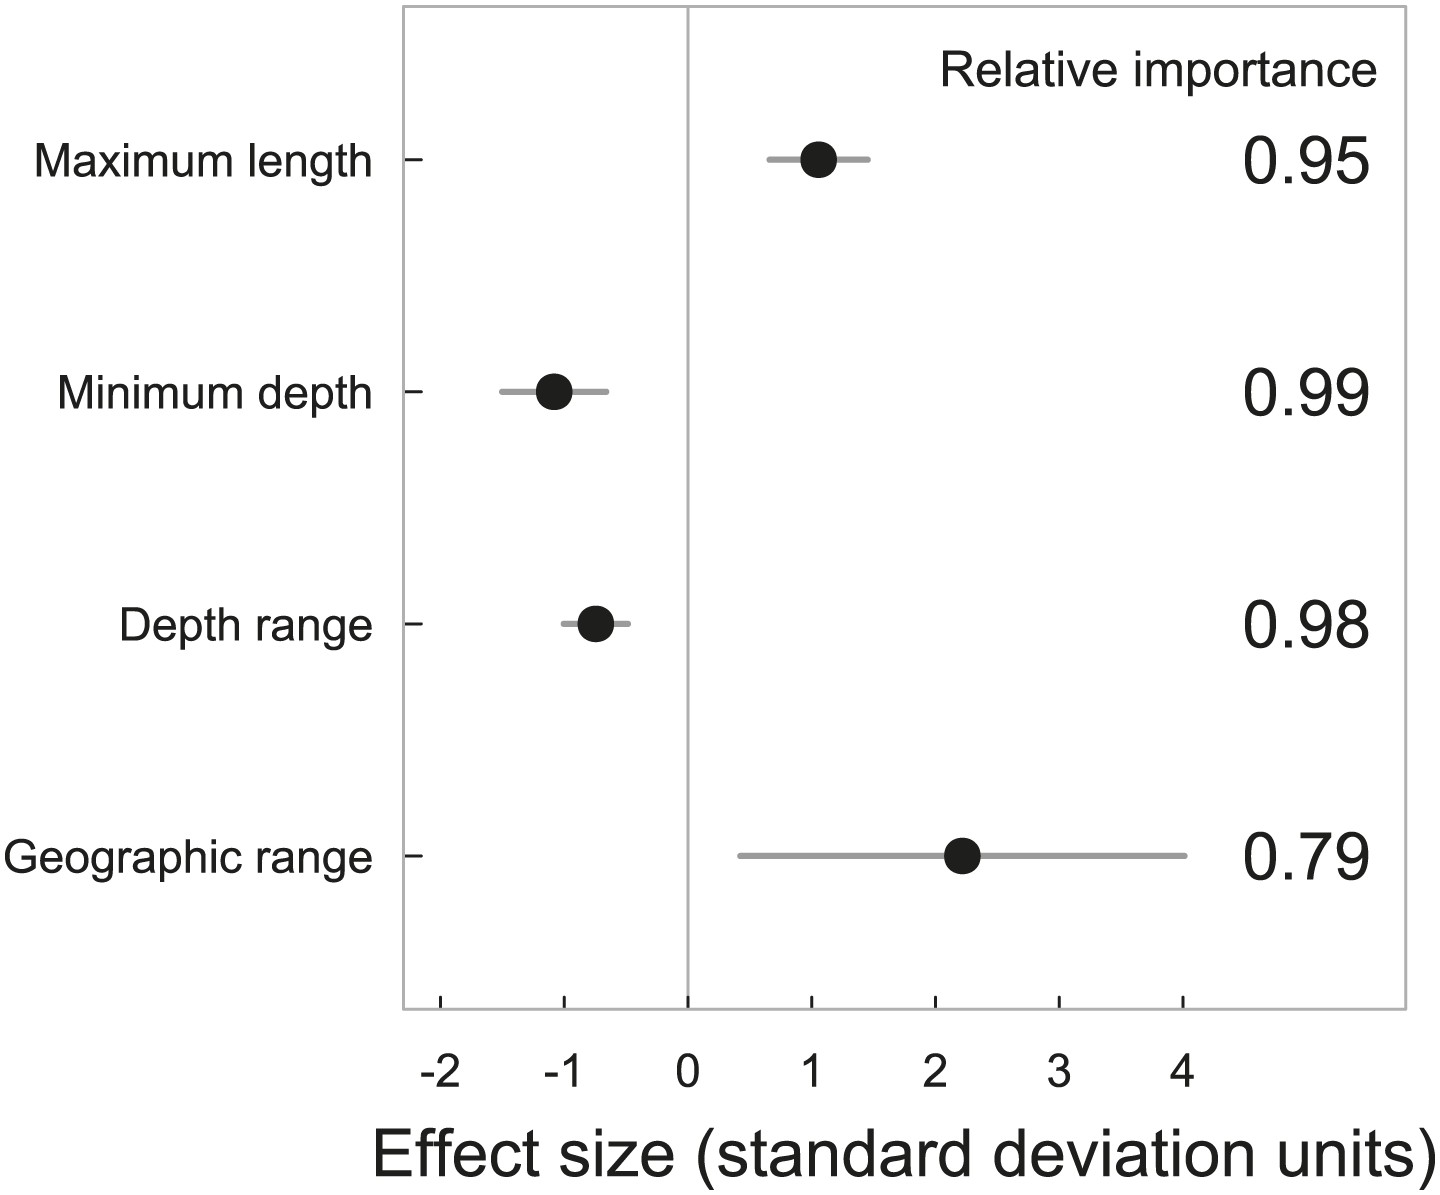
Standardized effect sizes with 95% confidence intervals from the two best explanatory models of life histories, geographic range and extinction risk in chondrichthyans.
The data were standardized by subtracting the mean and dividing by one standard deviation to allow for comparison among parameters. The relative importance is calculated as the sum of the Akaike weights of the models containing each variable. Chondrichthyans were scored as threatened (CR, EN, VU) = 1 or Least Concern (LC) = 0 for n = 367 marine species. Threat status was modeled using General Linear Mixed-effects Models, with size, depth and geography treated as fixed effects and taxonomy hierarchy as a random effect to account for phylogenetic non-independence.
Figure 4
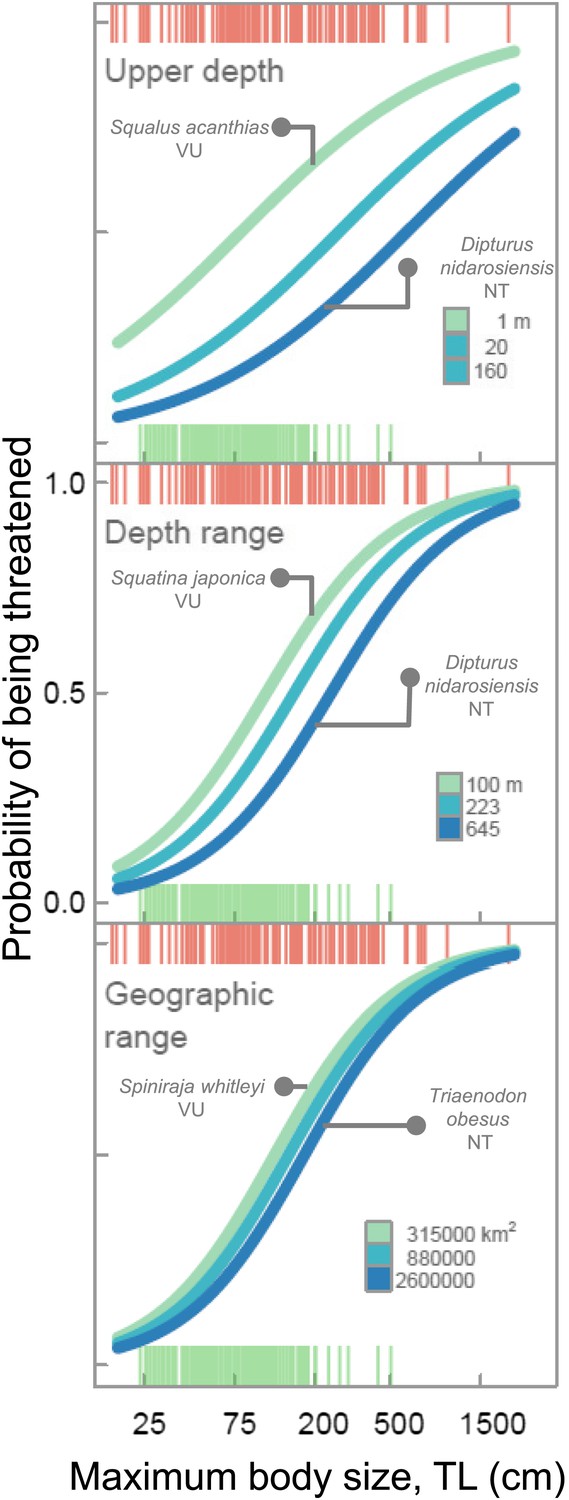
Life history sensitivity, accessibility to fisheries and extinction risk.
Probability that a species is threatened due to the combination of intrinsic life history sensitivity (maximum body size, cm total length, TL) and accessibility to fisheries which is represented as minimum depth limit, depth range, and geographic range size (Extent of Occurrence). The lines represent the variation in body size-dependent risk for the upper quartile, median, and lower quartile of each range metric. The examplar species are all of similar maximum body length and the difference in risk is largely due to differences in geographic distribution. Chondrichthyans were scored as threatened (CR, EN, VU) = 1 or Least Concern (LC) = 0 for n = 366 marine species. The lines are the best fits from General Linear Mixed-effects Models, with maximum body size and geographic distribution traits treated as fixed effects and taxonomy hierarchy as a random effect to account for phylogenetic non-independence. Each vertical line in each of the ‘rugs’ represents the maximum body size and Red List status of each species: threatened (red) and LC (green).
Figure 5
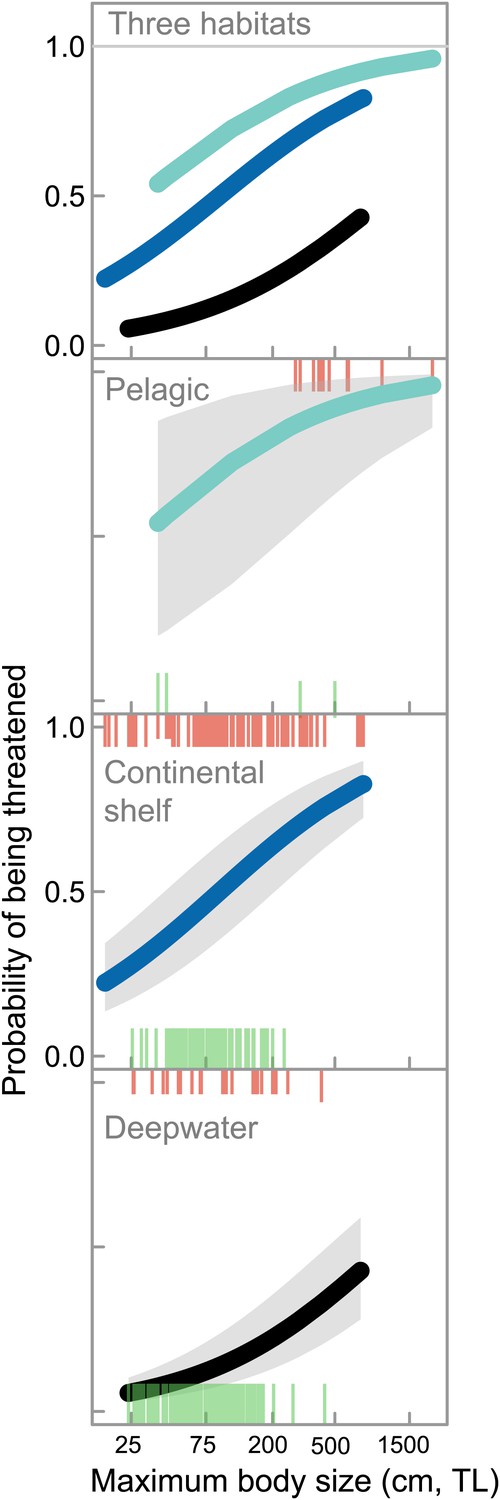
Life history, habitat, and extinction risk in chondrichthyans.
IUCN Red List status as a function of maximum body size (total length, TL cm) and accessibility to fisheries in marine chondrichthyans in three main habitats: coastal and continental shelf <200 m (‘Continental shelf’); neritic and oceanic pelagic <200 m (‘Pelagic’); and, deepwater >200 m (‘Deepwater’), n = 367 (threatened n = 148; Least Concern n = 219). The upper and lower ‘rug’ represents the maximum body size and Red List status of each species: threatened (upper rugs) and Least Concern (lower rugs). The lines are best fit using Generalized Linear Mixed-effects Models with 95% confidence intervals (Table 9).
Figure 6

Evolutionary uniqueness and taxonomic conservation priorities.
Threat among marine chondrichthyan families varies with life history sensitivity (maximum length) and exposure to fisheries (depth distribution). (A) Proportion of threatened data sufficient species and the richness of each taxonomic family. Colored bands indicate the significance levels of a one-tailed binomial test at p=0.05, 0.01, and 0.001. Those families with significantly greater (or lower) than expected threat levels at p<0.05 against a null expectation that extinction risk is equal across families (35.6%). (B) The most and least threatened taxonomic families. (C) Average life history sensitivity and accessibility to fisheries of 56 chondrichthyan families. Significantly greater (or lower) risk than expected is shown in red (green).
-
Figure 6—source data 1
Number and IUCN Red List status of chondrichthyan species in IUCN Red List categories by family (alphabetically within each order).
- https://doi.org/10.7554/eLife.00590.013
Figure 7
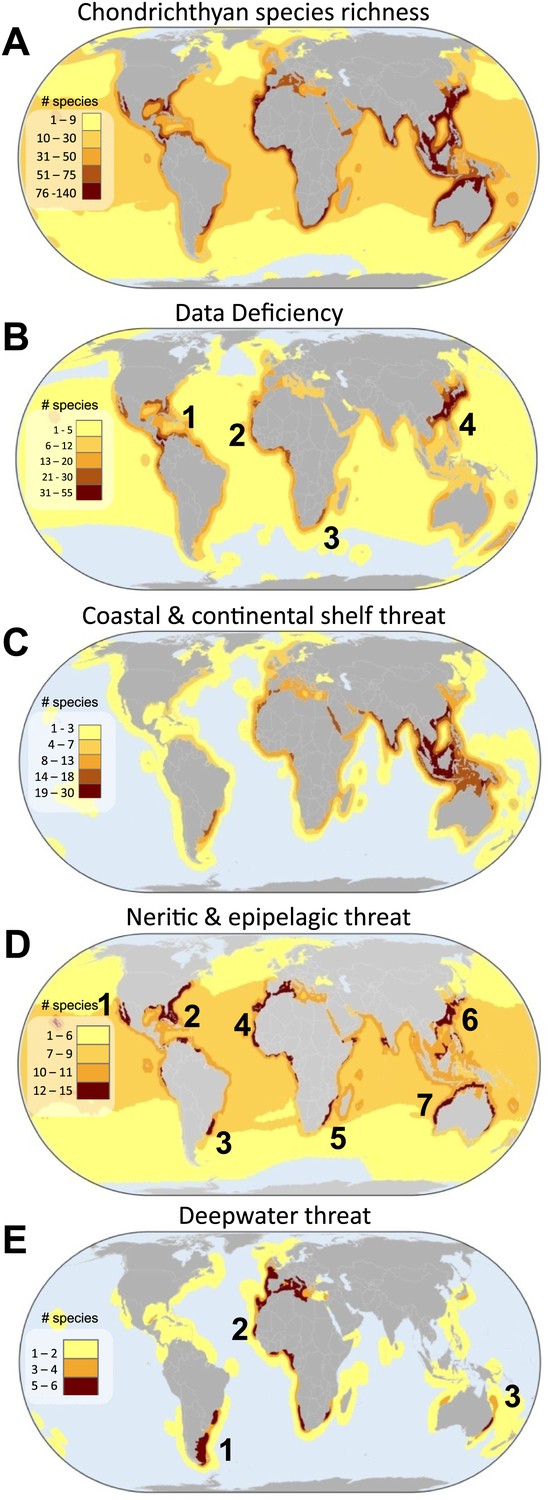
Global patterns of marine chondrichthyan diversity, threat and knowledge.
(A) Total chondrichthyan richness, (B) the number of Data Deficient and threat by major habitat: (C) coastal and continental shelf (<200 m depth), (D) neritic and epipelagic (<200 m depth), and (E) deepwater slope and abyssal plain (>200 m) habitats. Numbers expressed as the total number of species in each 23,322 km2 cell. The numbers are hotspots refereed to in the text.
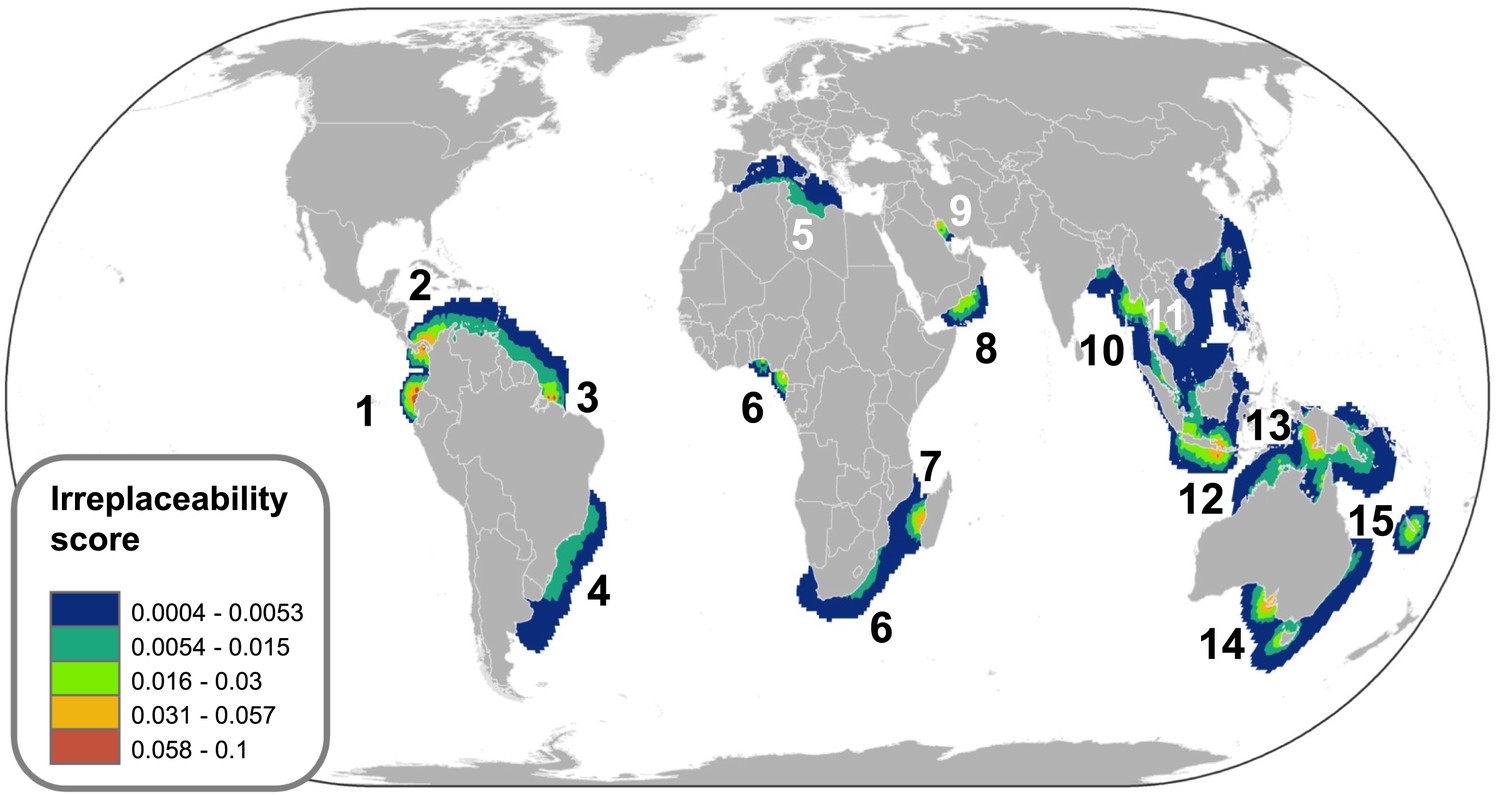
Figure 8
Irreplaceability hotspots of the endemic threatened marine chondrichthyans.
Endemics were defined as species with an Extent of Occurrence of <500,000 km2 (n = 66). Irreplaceable cells with the greatest number of small range species are shown in red, with blue cells showing areas of lower, but still significant irreplaceability. Irreplaceability is the sum of the inverse of the geographic range sizes of all threatened endemic species in the cell. A value of 0.1 means that on average a single cell represents one tenth of the global range of all the species present in the cell. The numbers are hotspots referred to in the text.
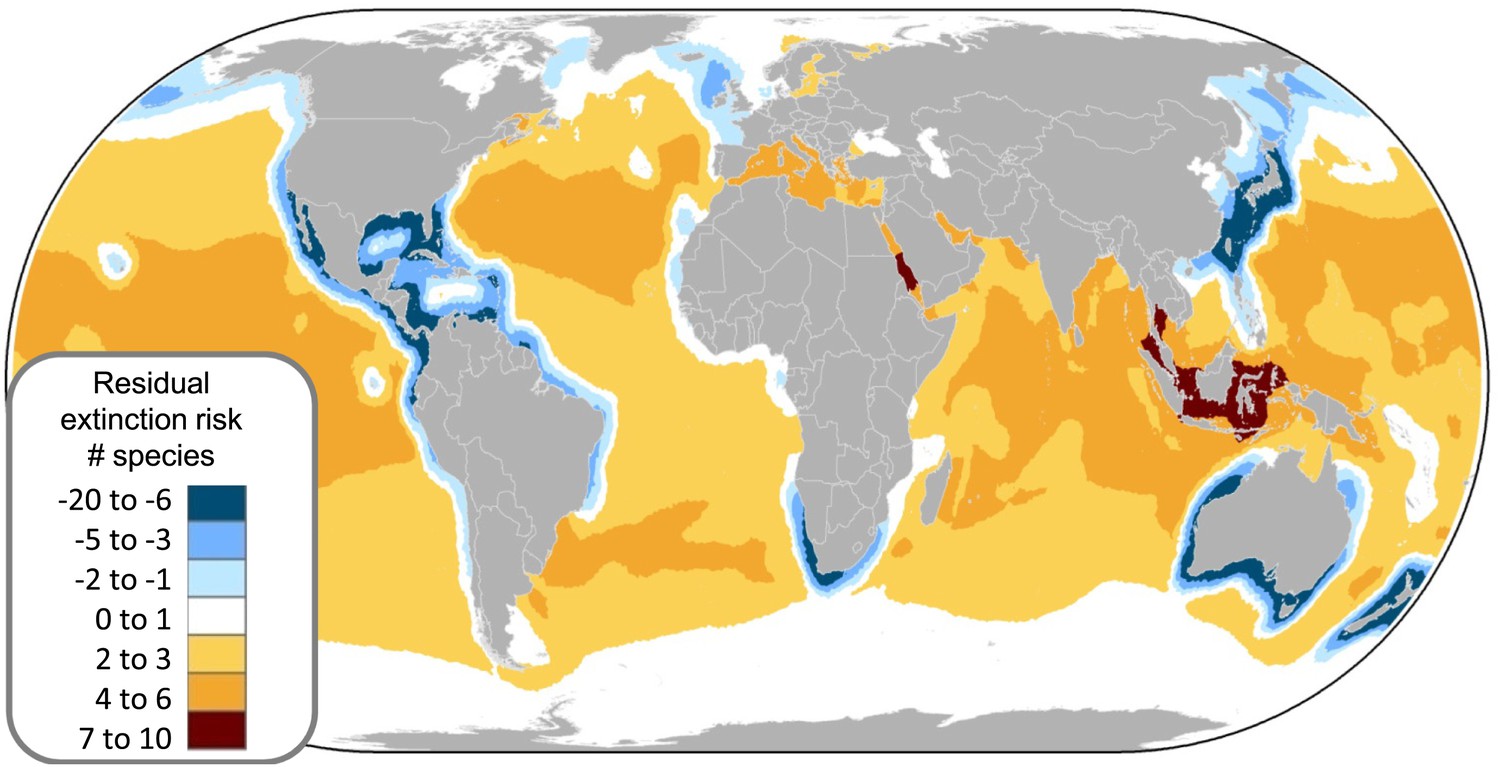
Figure 9
Spatial variation in the relative extinction risk of marine chondrichthyans.
Residuals of the relationship between total number of data sufficient chondrichthyans and total number of threatened species per cell, where positive values (orange to red) represent cells with higher threat than expected for their richness alone.
Figure 10
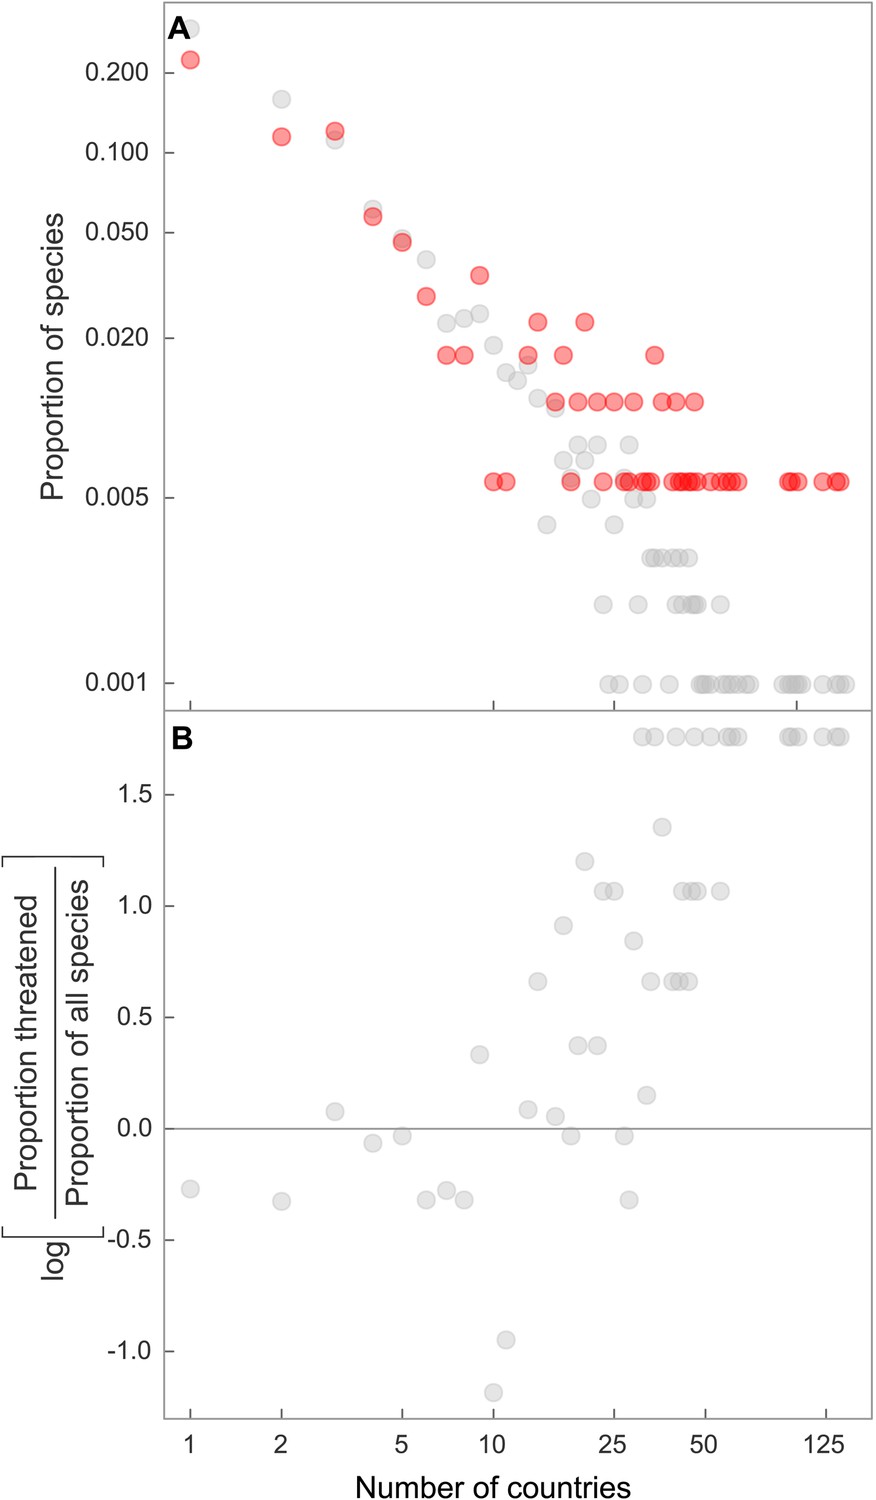
Elevated threat in chondrichthyans with the largest geographic ranges, spanning the greatest number of national jurisdictions.
Frequency distribution of number of jurisdictions spanned by all chondrichthyans (black, n = 1,041) and threatened species only (red, n = 174), for (A) country EEZs, and (B) the overrepresentation of threatened species spanning a large number of country EEZs, shown by the log ratio of proportion of threatened species over the proportion of all species. The proportion of threatened species is greater than the proportion of all species where the log ratio = 0, which corresponds to range spans of 16 and more countries.
Tables
Table 1
Observed and predicted number and percent of chondrichthyan species in IUCN Red List categories
| Taxon | Species number (%) | Threatened species number (%) | CR | EN | VU | NT | LC | DD |
|---|---|---|---|---|---|---|---|---|
| Skates and rays | 539 (51.8) | 107 (19.9) | 14 (1.3) | 28 (2.7) | 65 (6.2) | 62 (6.0) | 114 (11.0) | 256 (24.6) |
| Sharks | 465 (44.7) | 74 (15.9) | 11 (1.1) | 15 (1.4) | 48 (4.6) | 67 (6.4) | 115 (11.0) | 209 (20.1) |
| Chimaeras | 37 (3.6) | 0 | 0 | 0 | 0 | 3 (0.3) | 12 (1.2) | 22 (2.1) |
| All observed | 1041 | 181 (17.4) | 25 (2.4) | 43 (4.1) | 113 (10.9) | 132 (12.7) | 241 (23.2) | 487 (46.8) |
| All predicted | 249 (23.9) | – | – | – | 312 (29.9) | 389 (37.4) | 91 (8.7) |
-
CR, Critically Endangered; EN, Endangered; VU, Vulnerable; NT, Near Threatened; LC, Least Concern; DD, Data Deficient. Number threatened is the sum total of the categories CR, EN and VU. Species number and number threatened are expressed as percentage of the taxon, whereas the percentage of each species in IUCN categories is expressed relative to the total number of species.
Table 2
Number and percent of chondrichthyans in IUCN Red List categories by their main habitats
| Habitat | Species (%) | Threatened (%) | CR (%) | EN (%) | VU (%) | NT (%) | LC (%) | DD (%) |
|---|---|---|---|---|---|---|---|---|
| Coastal and continental shelf | 482 (46.3) | 127 (26.3) | 20 (4.1) | 26 (5.4) | 81 (16.8) | 73 (15.1) | 97 (20.1) | 185 (38.4) |
| Neritic and epipelagic | 39 (3.7) | 17 (43.6) | 0 | 3 (7.7) | 14 (35.9) | 13 (33.3) | 5 (12.8) | 4 (10.3) |
| Deepwater | 479 (46.0) | 25 (5.2) | 2 (0.4) | 6 (1.3) | 17 (3.5) | 45 (9.4) | 133 (27.8) | 276 (57.6) |
| Mesopelagic | 8 (0.8) | 0 | 0 | 0 | 0 | 0 | 4 (50.0) | 4 (50.0) |
| Freshwater (obligate species only) | 33 (3.2) | 12 (36.4) | 3 (9.1) | 8 (24.2) | 1 (3.0) | 1 (3.0) | 2 (6.1) | 18 (54.5) |
| Totals | 1041 | 181 (17.4) | 25 (2.4) | 43 (4.1) | 113 (10.9) | 132 (12.7) | 241 (23.2) | 487 (46.8) |
-
CR, Critically Endangered; EN, Endangered; VU, Vulnerable; NT, Near Threatened; LC, Least Concern; DD, Data Deficient.
Table 3
Summary of predictive Generalized Linear Models for life history and ecological correlates of IUCN status
| Model | Model structure and hypothesis | Degrees of freedom, k | Log likelihood | AICc | ΔAIC | AIC weight | Accuracy (AUC) | R2 |
|---|---|---|---|---|---|---|---|---|
| 1 | ∼maximum length | 2 | −227.479 | 459 | 43.67 | 0.000 | 0.678 | 0.139 |
| 2 | ∼ …+ minimum depth | 3 | −210.299 | 426.7 | 11.34 | 0.003 | 0.746 | 0.243 |
| 3 | ∼ …+…+ depth range | 4 | −204.703 | 417.5 | 2.19 | 0.25 | 0.762 | 0.276 |
| 4 | ∼ …+…+…+ geographic range | 5 | −202.578 | 415.3 | 0 | 0.748 | 0.772 | 0.298 |
-
Species were scored as threatened (CR, EN, VU) = 1 or Least Concern (LC) = 0 for n = 367 marine species. AICc is the Akaike information criterion corrected for small sample sizes and ΔAIC is the change in AICc. The models are ordered by increasing complexity and decreasing AIC weight (largest ΔAIC to lowest), coefficient of determination (R2), and prediction accuracy (measured using Area Under the Curve, AUC).
Table 4
Summary of explanatory Generalized Linear Mixed-effect Models of the life history and geographic distributional correlates of IUCN status
| Model structure and hypothesis | Degrees of freedom, k | Log likelihood | AICc | ΔAIC | AIC weight | R2GLMM(m) of fixed effects only | R2GLMM(c) of fixed and random effects |
|---|---|---|---|---|---|---|---|
| ∼ maximum length | 5 | −197.06 | 404.3 | 28.31 | 0.000 | 0.32 | 0.58 |
| ∼ …+ minimum depth | 6 | −187.013 | 386.3 | 10.29 | 0.005 | 0.48 | 0.65 |
| ∼ …+…+ depth range | 7 | −182.139 | 378.6 | 2.62 | 0.212 | 0.49 | 0.66 |
| ∼ …+…+…+ geographic range | 8 | −179.785 | 376.0 | 0 | 0.784 | 0.69 | 0.80 |
-
Species were scored as threatened (CR, EN, VU) = 1 or Least Concern (LC) = 0 for n = 367 marine species. AICc is the Akaike information criterion corrected for small sample sizes; ΔAIC is the change in AICc. The models are ordered by increasing complexity and decreasing AIC weight (largest ΔAIC to lowest). R2GLMM(m) is the marginal R2 of the fixed effects only and R2GLMM(c) is the conditional R2 of the fixed and random effects.
Table 5
Scientific and conservation priority according to threat, knowledge and endemicity by FAO Fishing Area
| FAO Fishing Area (ranked priority) | Threatened species (% of total, n = 181) | Data Deficient species (% of total, n = 487) | Number of endemic species (threatened endemics) | Threatened endemic species |
|---|---|---|---|---|
| (1) Indian, Eastern | 67 (37.0) | 69 (14.2) | 58 (5) | Atelomycterus baliensis, Himantura fluviatilis, Zearaja maugeana, Trygonorrhina melaleuca, Urolophus orarius |
| (2) Pacific, Western Central | 76 (42.0) | 81 (16.6) | 51 (14) | Glyphis glyphis, Aulohalaelurus kanakorum, Hemitriakis leucoperiptera, Brachaelurus colcloughi, Hemiscyllium hallstromi, H. strahani, Himantura hortlei, H. lobistoma, Pastinachus solocirostris, Aptychotrema timorensis, Rhinobatos jimbaranensis, Rhynchobatus sp. nov. A, Rhynchobatus springeri, Urolophus javanicus |
| (3) Pacific, Northwest | 48 (26.5) | 116 (23.8) | 80 (6) | Benthobatis yangi, Narke japonica, Raja pulchra, Squatina formosa, S. japonica, S. nebulosa |
| (4) Indian, Western | 61 (33.7) | 104 (21.4) | 62 (8) | Carcharhinus leiodon, Haploblepharus kistnasamyi, H. favus, H. punctatus, Pseudoginglymostoma brevicaudatum, Electrolux addisoni, Dipturus crosnieri, Okamejei pita |
| (5) Atlantic, Western Central | 32 (17.7) | 81 (16.6) | 62 (4) | Diplobatis colombiensis, D. guamachensis, D. ommata, D. pictus |
| (6) Pacific, Southwest | 34 (18.8) | 49 (10.1) | 28 | |
| (7) Atlantic, Southwest | 52 (28.7) | 52 (10.7) | 37 (19) | Galeus mincaronei, Schroederichthys saurisqualus, Mustelus fasciatus, M. schmitti, Atlantoraja castelnaui, A. cyclophora, A. platana, Rioraja agassizii, Sympterygia acuta, Benthobatis kreffti, Dipturus mennii, Gurgesiella dorsalifera, Rhinobatos horkelii, Zapteryx brevirostris, Rhinoptera brasiliensis, Squatina argentina, S. guggenheim, S. occulta, S. punctata |
| (8) Atlantic, Southeast | 37 (20.4) | 51 (10.5) | 13 | |
| (9) Atlantic, Eastern Central | 42 (23.2) | 44 (9.0) | 6 | |
| (10) Pacific, Southeast | 26 (14.4) | 67 (13.8) | 32 (3) | Mustelus whitneyi, Triakis acutipinna, T. maculata |
| (11) Pacific, Eastern Central | 20 (11.0) | 52 (10.7) | 19 (2) | Urotrygon reticulata, U. simulatrix |
| (12) Atlantic, Northeast | 33 (18.2) | 23 (4.7) | 8 | |
| (13) Atlantic, Northwest | 22 (12.2) | 17 (3.5) | 3 (1) | Malacoraja senta |
| (14) Mediterranean & Black Sea | 34 (18.8) | 16 (3.3) | 3 (1) | Leucoraja melitensis |
| (15) Pacific, Northeast | 9 (5.0) | 11 (2.3) | 0 | |
| (16) Indian, Antarctic | 1 (0.6) | 4 (0.8) | 2 | |
| (17) Atlantic, Antarctic | 1 (0.6) | 4 (0.8) | 2 | |
| (18) Pacific, Antarctic | 0 | 3 (0.6) | 0 | |
| (19) Arctic Sea | 0 | 0 | 0 |
-
Endemics were defined as those species found only within a single FAO Fishing Area. FAO Fishing Areas were ranked according to greatest species richness, percent threatened species, percent Data Deficient species, number of endemic species and number of threatened endemic species.
Table 6
Progress toward regional and international RFMO management measures for sharks and rays
| 1. Bans on ‘finning’ (the removal of a shark’s fins and discarding the carcass at sea) through most RFMOs (Fowler and Séret, 2010); |
| 2. North East Atlantic Fisheries Commission (NEAFC) bans on directed fishing for species not actually targeted within the relevant area (Spiny dogfish [Squalus acanthias], Basking shark [Cetorhinus maximus], Porbeagle shark [Lamna nasus]) (NEAFC, 2009); |
| 3. Convention on the Conservation of Antarctic Marine Living Resources bans on ‘directed’ fishing for skates and sharks and bycatch limits for skates (CCMLR, 2011); |
| 4. A Northwest Atlantic Fisheries Organization (NAFO) skate quota (note: this has consistently been set higher than the level advised by scientists since its establishment in 2004) (NAFO, 2011); |
| 5. International Commission for the Conservation of Atlantic Tunas (ICCAT) bans on retention, transshipment, storage, landing, and sale of Bigeye Thresher (Alopias superciliosus), and Oceanic whitetip shark (Carcharhinus longimanus), and partial bans (developing countries excepted under certain circumstances) on retention, transshipment, storage, landing, and sale of most hammerheads (Sphyrna spp.), and retention, transshipment, storage, and landing (but not sale) of Silky shark (Carcharhinus falciformis) (Kyne et al., 2012); |
| 6. An Inter-American Tropical Tuna Commission (IATTC) ban on retention, transshipment, storage, landing, and sale of Oceanic whitetip sharks (IATTC, 2011); |
| 7. An Indian Ocean Tuna Commission (IOTC) ban on retention, transshipment, storage, landing, and sale of thresher sharks-with exceptionally low compliance and reportedly low effectiveness (IOTC, 2011); and, |
| 8. A Western and Central Pacific Fisheries Commission ban on retention, transshipment, storage, and landing (but not sale) of Oceanic whitetip sharks (Clarke et al., 2013). |
Table 7
Management recommendations: the following actions would contribute to rebuilding threatened chondrichthyan populations and properly managing associated fisheries
| Fishing nations and regional fisheries management organizations (RFMOs) are urged to: |
| 1. Implement, as a matter of priority, scientific advice for protecting habitat and/or preventing overfishing of chondrichthyan populations; |
| 2. Draft and implement Plans of Action pursuant to the International Plan Of Action (IPOA–Sharks), which include, wherever possible, binding, science-based management measures for chondrichthyans and their essential habitats; |
| 3. Significantly increase observer coverage, monitoring, and enforcement in fisheries taking chondrichthyans; |
| 4. Require the collection and accessibility of species-specific chondrichthyan fisheries data, including discards, and penalize non-compliance; |
| 5. Conduct population assessments for chondrichthyans; |
| 6. Implement and enforce chondrichthyan fishing limits in accordance with scientific advice; when sustainable catch levels are uncertain, set limits based on the precautionary approach; |
| 7. Strictly protect chondrichthyans deemed exceptionally vulnerable through Ecological Risk Assessments and those classified by IUCN as Critically Endangered or Endangered; |
| 8. Prohibit the removal of shark fins while onboard fishing vessels and thereby require the landing of sharks with fins naturally attached; and, |
| 9. Promote research on gear modifications, fishing methods, and habitat identification aimed at mitigating chondrichthyan bycatch and discard mortality. |
| National governments are urged to: |
| 10. Propose and work to secure RFMO management measures based on scientific advice and the precautionary approach; |
| 11. Promptly and accurately report species-specific chondrichthyan landings to relevant national and international authorities; |
| 12. Take unilateral action to implement domestic management for fisheries taking chondrichthyans, including precautionary limits and/or protective status where necessary, particularly for species classified by IUCN as Vulnerable, Endangered or Critically Endangered, and encourage similar actions by other Range States; |
| 13. Adopt bilateral fishery management agreements for shared chondrichthyan populations; |
| 14. Ensure active membership in Convention on International Trade in Endangered Species (CITES), Convention for the Conservation of Migratory Species (CMS), RFMOs, and other relevant regional and international agreements; |
| 15. Fully implement and enforce CITES chondrichthyan listings based on solid non-detriment findings, if trade in listed species is allowed; |
| 16. Propose and support the listing of additional threatened chondrichthyan species under CITES and CMS and other relevant wildlife conventions; |
| 17. Collaborate on regional agreements and the CMS migratory shark Memorandum of Understanding (CMS, 2010), with a focus on securing concrete conservation actions; and, |
| 18. Strictly enforce chondrichthyan fishing and protection measures and impose meaningful penalties for violations. |
Table 8
The locations, dates, number of participants and the number of countries represented at each of the SSG Red List workshops, along with unique totals
| Red List workshop | Location | Date | Participants | Countries |
|---|---|---|---|---|
| Australia and Oceania | Queensland, Australia | March 2003 | 26 | 5 |
| South America | Manaus, Brazil | June 2003 | 25 | 8 |
| Sub-equatorial Africa | Durban, South Africa | September 2003 | 28 | 9 |
| Mediterranean | San Marino | October 2003 | 29 | 15 |
| Deep sea sharks | Otago Peninsula, New Zealand | November 2003 | 32 | 11 |
| North and Central America | Florida, USA | June 2004 | 55 | 13 |
| Batoids (skates and rays) | Cape Town, South Africa | September 2004 | 24 | 11 |
| Expert Panel Review | Newbury, UK | March 2005 | 12 | 5 |
| Northeast Atlantic | Peterborough, UK | February 2006 | 25 | 9 |
| West Africa | Dakar, Senegal | June 2006 | 25 | 12 |
| Expert Panel Review | Newbury, UK | July 2006 | 9 | 12 |
| Pelagic sharks | Oxford, UK | February 2007 | 18 | 11 |
| Northwest Pacific/Southeast Asia | Batangas, Philippines | June/July 2007 | 23 | 13 |
| Totals | 227 | 57 |
Table 9
Parameter estimates for General Linear Mixed-effects Models testing the probability that a species is threatened p(THR) given either categorical habitat class or continuous measure of depth distribution and maximum size
| (A) Habitat category | |||
|---|---|---|---|
| p(THR) = maximum length + habitat category, random effect = Order/Family/Genus | |||
| Fixed effects | Standardized coefficient | Standard error | p-value |
| Intercept (Coastal and continental shelf) | 0.27 | 0.33 | 0.4 |
| Deepwater | −2.01 | 0.39 | <0.001 |
| Pelagic | −0.46 | 0.94 | 0.62 |
| Maximum length | 2.59 | 0.69 | <0.001 |
| marginal R2GLMM(m) of fixed effects only = 0.40. | |||
| conditional R2GLMM(c) of fixed and random effects = 0.60. | |||
| ΔAIC without taxonomic inclusion = −18.7. | |||
| ΔAIC for differing threat metrics: binomial THR (CR + EN + VU + NT) = −165.7; categorical = −975.6. | |||
| (B) Minimum depth | |||
|---|---|---|---|
| p(THR) = maximum length + minimum depth, random effect = Order/Family/Genus | |||
| Fixed effects | Standardized coefficient | Standard error | p-value |
| Intercept | −0.74 | 0.31 | 0.015 |
| Minimum depth | −2.73 | 0.78 | <0.001 |
| Maximum length | 2.46 | 0.61 | 0.002 |
| marginal R2GLMM(m) of fixed effects only = 0.48. | |||
| conditional R2GLMM(c) of fixed and random effects = 0.64. | |||
| ΔAIC without taxonomic inclusion = −12.9. | |||
| ΔAIC for differing threat metrics: binomial THR (CR + EN + VU + NT) = −153.4; categorical = −985.8. | |||
| (C) Maximum depth | |||
|---|---|---|---|
| p(THR) = maximum depth + maximum length, random effect = Order/Family/Genus | |||
| Fixed effects | Standardized coefficient | Standard error | p-value |
| Intercept | −0.60 | 0.28 | <0.001 |
| Maximum depth | −2.35 | 0.54 | <0.001 |
| Maximum length | 3.03 | 0.63 | <0.001 |
| marginal R2GLMM(m) of fixed effects only = 0.45. | |||
| conditional R2GLMM(c) of fixed and random effects = 0.63. | |||
| ΔAIC without taxonomic inclusion = −17.2. | |||
| ΔAIC for differing threat metrics: binomial THR (CR + EN + VU + NT) = −156.7; categorical = −981.7. | |||
| (D) Depth range | |||
|---|---|---|---|
| P(THR) = median depth + maximum length, random effect = Order/Family/Genus | |||
| Fixed effects | Standardized coefficient | Standard error | p-value |
| Intercept | −0.51 | 0.26 | 0.002 |
| Depth range | −1.82 | 0.50 | <0.001 |
| Maximum length | 3.17 | 0.64 | <0.001 |
| marginal R2GLMM(m) of fixed effects only = 0.42. | |||
| conditional R2GLMM(c) = 0.62. | |||
| ΔAIC without taxonomic inclusion = −22.3. | |||
| ΔAIC for differing threat metrics: binomial THR (CR + EN + VU + NT) = −158.7; categorical = −982.3. | |||
| (E) Geographic range (Extent of Occurrence) | |||
|---|---|---|---|
| p(THR) = geographic range + maximum length, random effect = Order/Family/Genus | |||
| Fixed effects | Standardized coefficient | Standard error | p-value |
| Intercept | −0.50 | 0.52 | 0.33 |
| Geographic range | 5.22 | 3.7 | 0.12 |
| Maximum length | 2.16 | 0.75 | 0.004 |
| marginal R2GLMM(m) of fixed effects only = 0.65. | |||
| conditional R2GLMM(c) = 0.81. | |||
| ΔAIC without taxonomic inclusion = −25.8. | |||
| ΔAIC for differing threat metrics: binomial THR (CR + EN + VU + NT) = −156.5; categorical = −982.9. | |||
-
The improvement of model fit by inclusion of phylogenetic random effect was calculated as the difference in AIC (ΔAIC) between the GLMM (with phylogenetic random effect) and a GLM as ΔAIC = AIC(GLMM)-AIC(GLM). p(THR) was binomially distributed assuming species that were CR, EN or VU were threatened (1) and LC species were not (0). We present ΔAIC for two other threat classifications, assuming: THR also includes NT species, or THR was a continuous categorical variable ranging from LC = 0 to CR = 5.
Additional files
-
Supplementary file 1
The Data Deficient chondrichthyan species that are potentially threatened.
- https://doi.org/10.7554/eLife.00590.024
-
Supplementary file 2
(A) IUCN Red List status of chondrichthyans in the fin trade, including (i) families with the most-valued fins, and (ii) the most prevalent species utilized in the Hong Kong fin trade. (B) Chondrichthyan species threatened by (i) control measures, and (ii) habitat destruction and degradation, pollution or climate change with the corresponding IUCN threat classification (Salafsky et al., 2008). (C) Irreplaceable: the 66 threatened endemic sharks and rays ordered in decreasing irreplaceability.
- https://doi.org/10.7554/eLife.00590.025
Download links
A two-part list of links to download the article, or parts of the article, in various formats.
Downloads (link to download the article as PDF)
Open citations (links to open the citations from this article in various online reference manager services)
Cite this article (links to download the citations from this article in formats compatible with various reference manager tools)
Extinction risk and conservation of the world’s sharks and rays
eLife 3:e00590.
https://doi.org/10.7554/eLife.00590


