Deprivation-related and use-dependent plasticity go hand in hand
- University of Oxford, United Kingdom
- The Hospital for Sick Children, Canada
- Weizmann Institute of Science, Israel
- Nuffield Orthopaedic Centre, United Kingdom
Figures
Figure 1
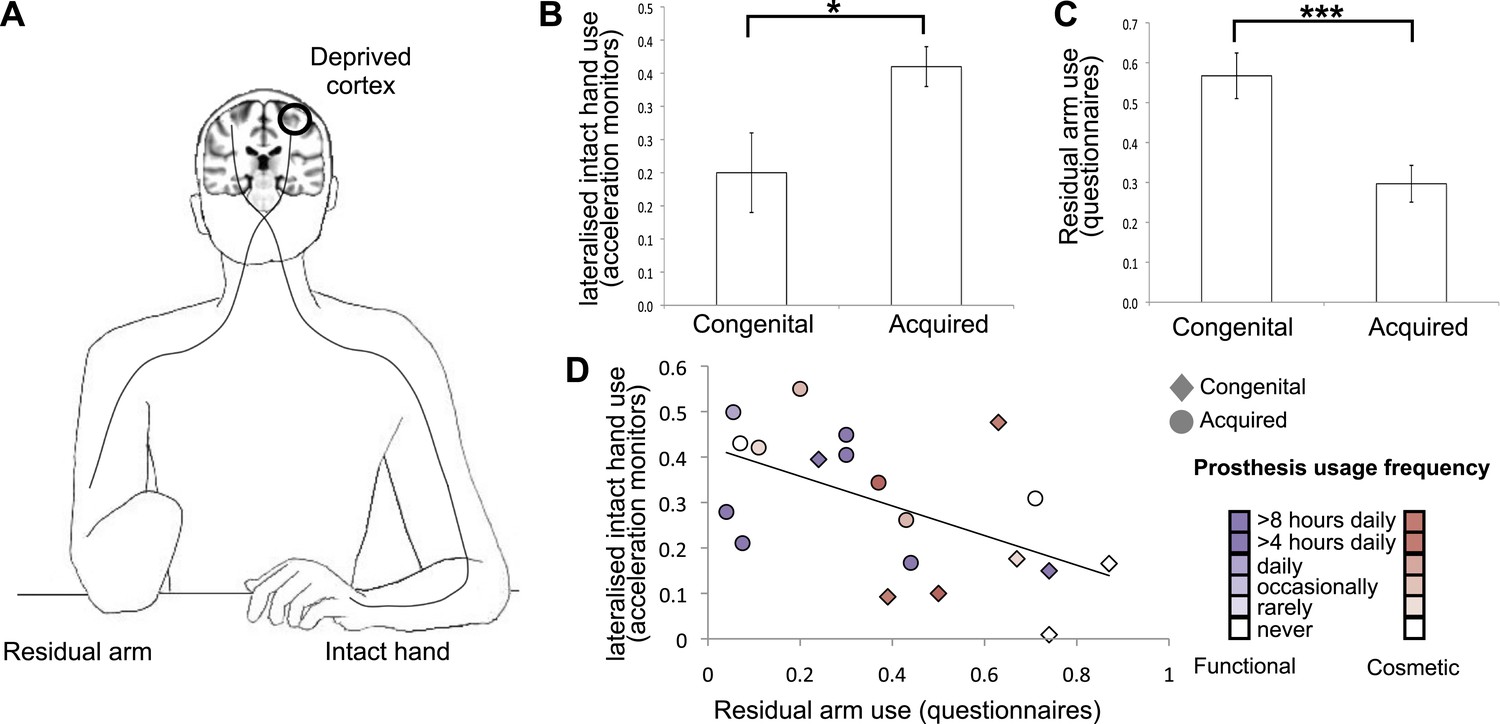
Dissociative limb usage strategies in 1-handed individuals with congenital and acquired hand loss.
(A) Schematic illustration of the residual and intact limbs. (B) Limb-use strategies, based on activity monitors for increased lateralised (intact hand) use. A laterality index, reflecting the relative number of movements performed by the intact hand vs the residual limb, was calculated using data from acceleration monitors (mean ± s.e.m.), worn by 20 1-handed individuals (8 congenital) while engaged in their normal routines. Positive values represent a tendency to use the intact hand more than the residual limb. Although both groups exhibit such a tendency (t(7) = 3.48, p=0.01; t(11) = 10.60, p=0.001, one-sample t-test compared to zero for the congenital and acquired groups, respectively), the acquired group shows a significantly greater preference for the intact hand compared to the congenital group (t(18) = −2.67, p=0.016). (C) Questionnaire ratings (mean ± s.e.m.) for residual arm usage in daily activities were significantly greater for the congenital group (t(1,27) = 3.65, p=0.001), suggesting they use their residual arm more frequently in daily activities, compared with the acquired group. (D) Questionnaire ratings for residual arm usage were negatively correlated with the laterality indices, measured based on acceleration monitoring (r(20) = −0.53, p=0.012), validating the questionnaires as a measurement of habitual usage strategies between the residual and intact limbs. Scatter plot shows data for 1-handed individuals with congenital and acquired hand loss, frequency of prosthetic hand usage is indicated in the index to the right. Asterisks denote significance levels of *p<0.05; ***p<0.005.
Figure 2
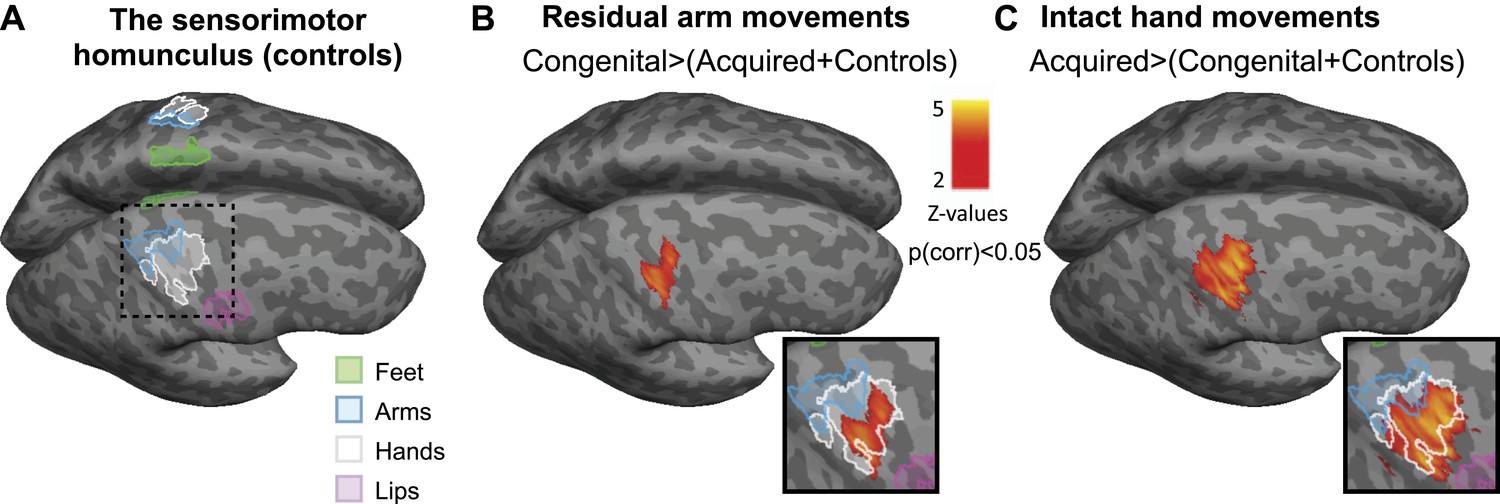
Limb-representation patterns in the deprived cortex reflect usage—whole brain contrasts.
(A) Coloured lines delineate the boundaries of clusters activated during execution of movements using the feet (green), arms (blue), hands (white), and lips (pink) in controls, projected on inflated hemispheres. (B) Whole-brain group comparisons for activation during residual/nondominant arm movements (in 1-handed/control participants, respectively; deprived hemisphere is in front. Note that participants with above elbow deprivation were excluded). During movements of the residual arm, the congenital group showed increased activation compared with the acquired and control groups. This whole-brain contrast resulted in a single cluster, centred on the hand knob of the central sulcus of the deprived cortex, spanning the pre- and post-central gyri (shown in orange). (C) Whole-brain group comparisons for activation during intact/dominant hand movements (in 1-handed/control participants, respectively). During movements of the intact hand, the acquired group showed increased activation compared with the conjunction of the congenital and control groups. This whole-brain contrast resulted in a single cluster centred on the hand knob of the deprived cortex spanning the pre- and post-central gyri (shown in orange). The square inserts in (B and C) show overlap between the clusters resulting from the whole brain group comparisons (orange) and the controls’ hand area (white), as shown in (A). No other significant clusters were identified here, or using the homologous contrasts between the other groups.
Figure 3
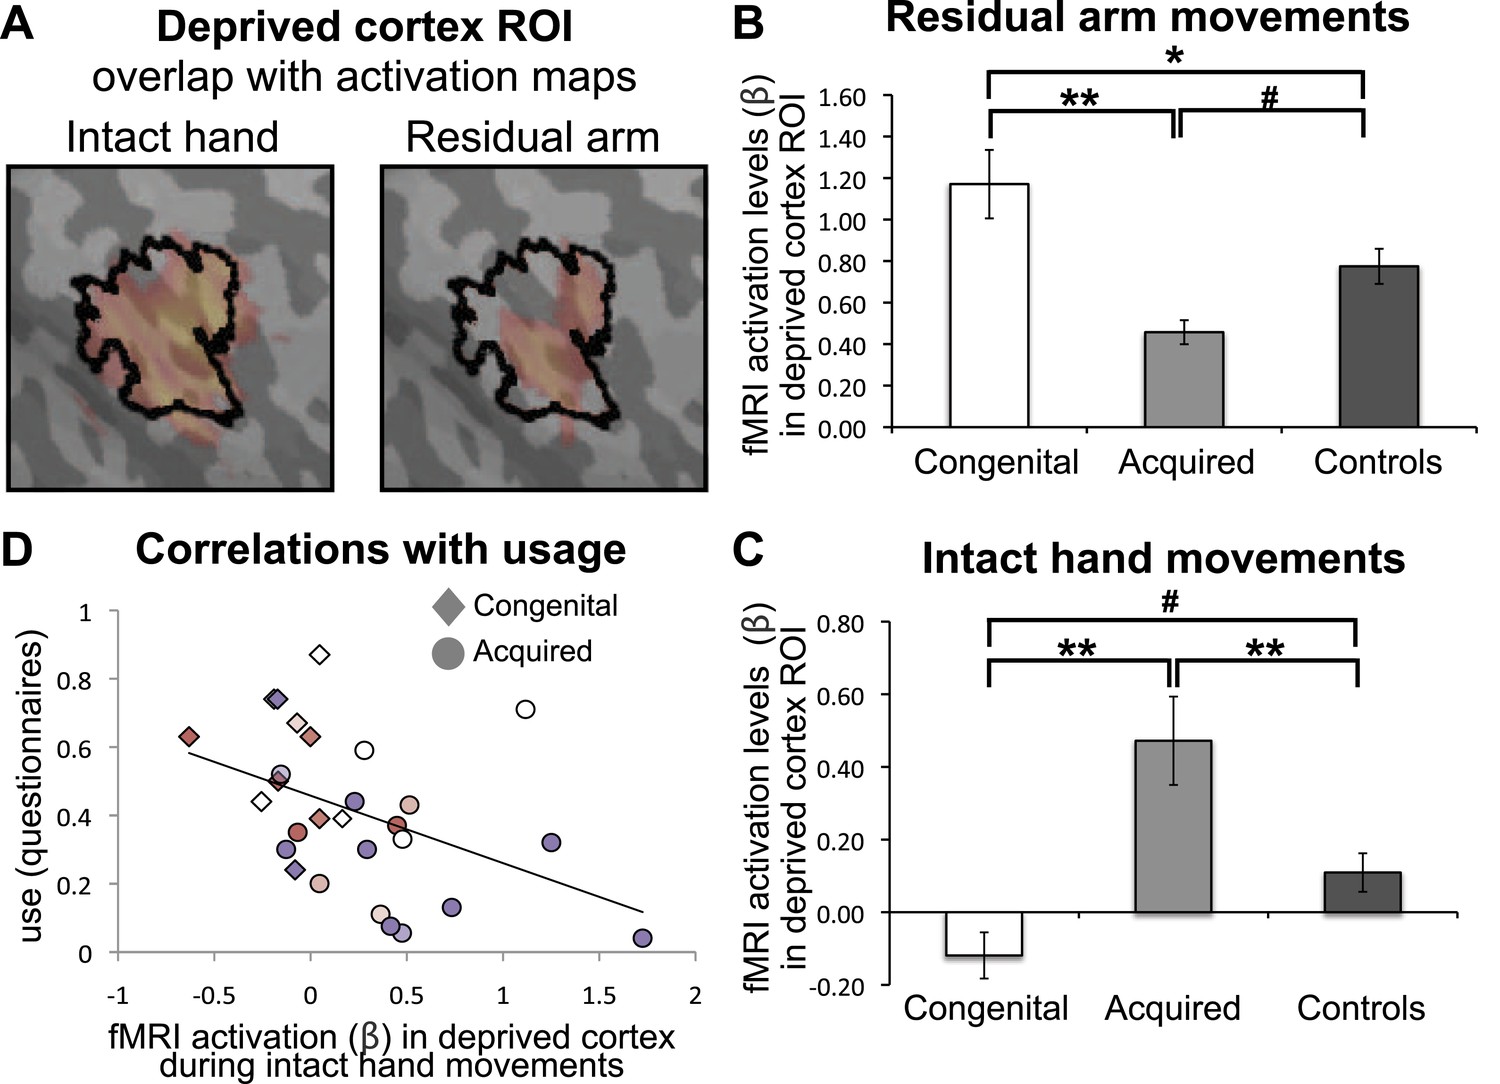
Limb-representation patterns in the deprived cortex reflect usage—ROI analysis.
(A) To define the deprived cortex, an independent ROI (outline shown in black) was derived from the conjunction between phantom/nondominant hand movements in acquired amputees/controls. For illustration purposes, the group contrast maps derived from the previous whole-brain analysis (shown in Figure 2) are also overlaid (in faded orange), highlighting the fact that whole-brain group differences are co-localised with the deprived cortex ROI. (B and C) In order to assess the degree to which the deprived cortex is used to represent other body parts, mean fMRI activation levels (β) for voxels within the deprived cortex ROI during residual arm (B) and intact hand (C) movements were calculated. Beta values were averaged (±s.e.m) across the congenital (white), acquired (light gray) and control (black) groups. Within-group comparisons confirmed greater representation of the relatively over-used limb in each group. Asterisks/Hashes denote significance levels of *p≤0.025; **p<0.005; #p<0.05 for corrected (planned)/and uncorrected (exploratory) comparisons, respectively. (D) Increased fMRI activation (β) in the deprived cortex during intact hand movements correlated negatively with questionnaire scores for residual arm usage (associated with increased intact hand usage, Figure 1D), across the congenital and acquired groups (r(28) = −0.43, p=0.021). Prostheses usage indices are shown in Figure 1.
Figure 4
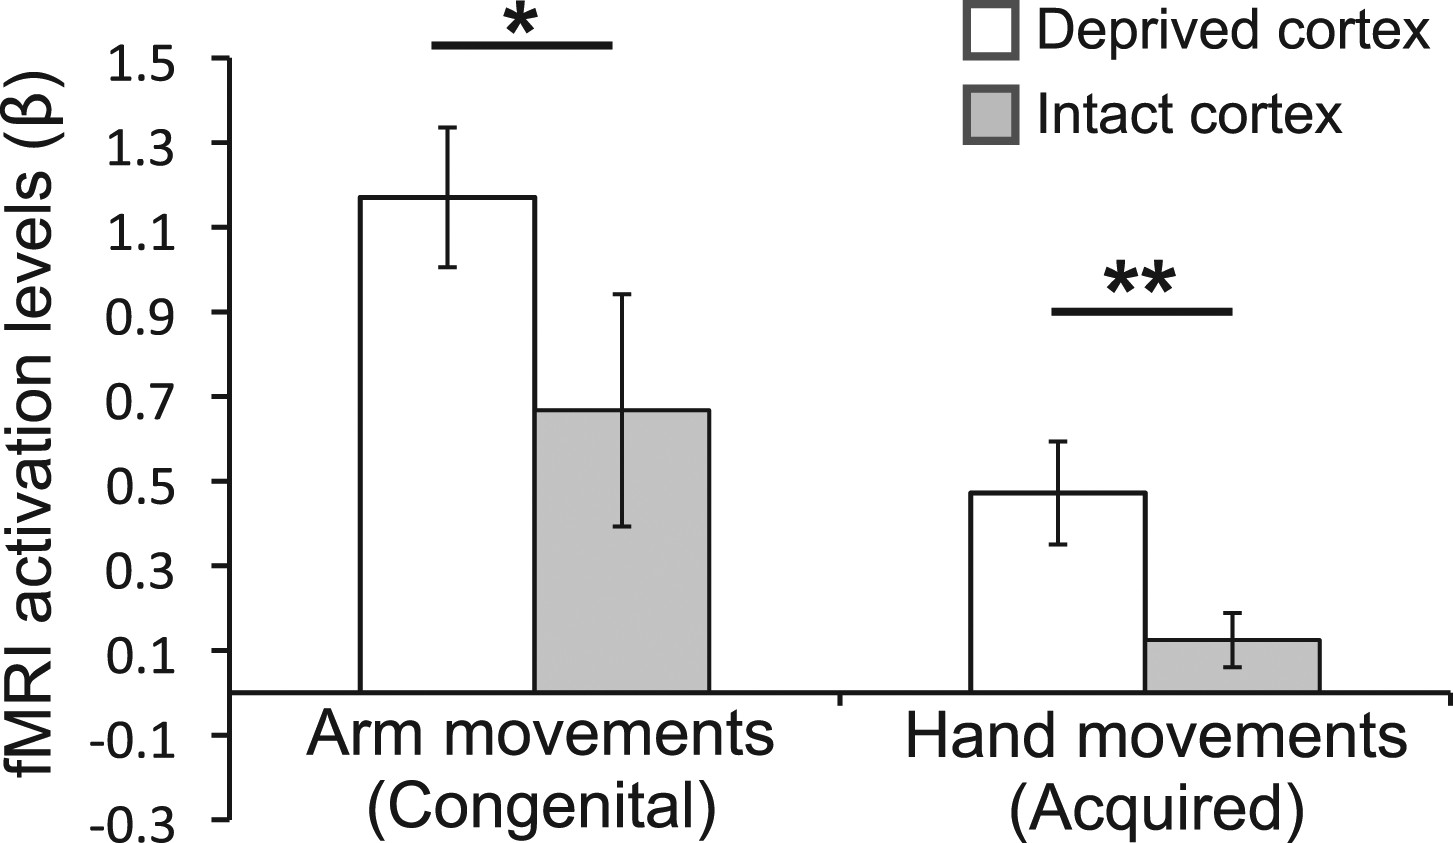
Over-representation of the favoured limb for adaptive use results in intra-subject assymetry.
Activation levels (mean ± s.e.m) during arm movements in the congenital group and during hand movements in the deprived cortex ROI (white), and a homologous ROI contralateral to the intact hand (gray). The congenital group showed increased contralateral activation (in the deprived cortex) during residual arm movements, compared to contralateral activation (in the homolgous intact cortex) during intact arm movements. The acquired group demonstrated significantly increased ipsilateral activation (in the deprived cortex) when moving their intact hand, compared with ipsilateral activation (in the intact cortex) during phantom hand movements. These results confirm adaptive changes in limb-representation in the deprived cortex in 1-handed individuals. Asterisks denote significance levels of *p<0.05; **p<0.01.
Figure 5

Higher FA is associated with greater intact hand plasticity in 1-handed participants.
Clusters in the corticospinal tract (top) and the inferior fronto-occipital fasciculus (bottom) (red-yellow, p<0.05, corrected) show positive correlations between FA and intact hand fMRI activation within the deprived cortex ROI (blue), while accounting for participants’ age and deprivation age. The bright/dark green lines denote the white matter skeleton/tracts (based on the John Hopkins University atlas), respectively. Clusters have been dilated for presentation purposes.
Author response image 1
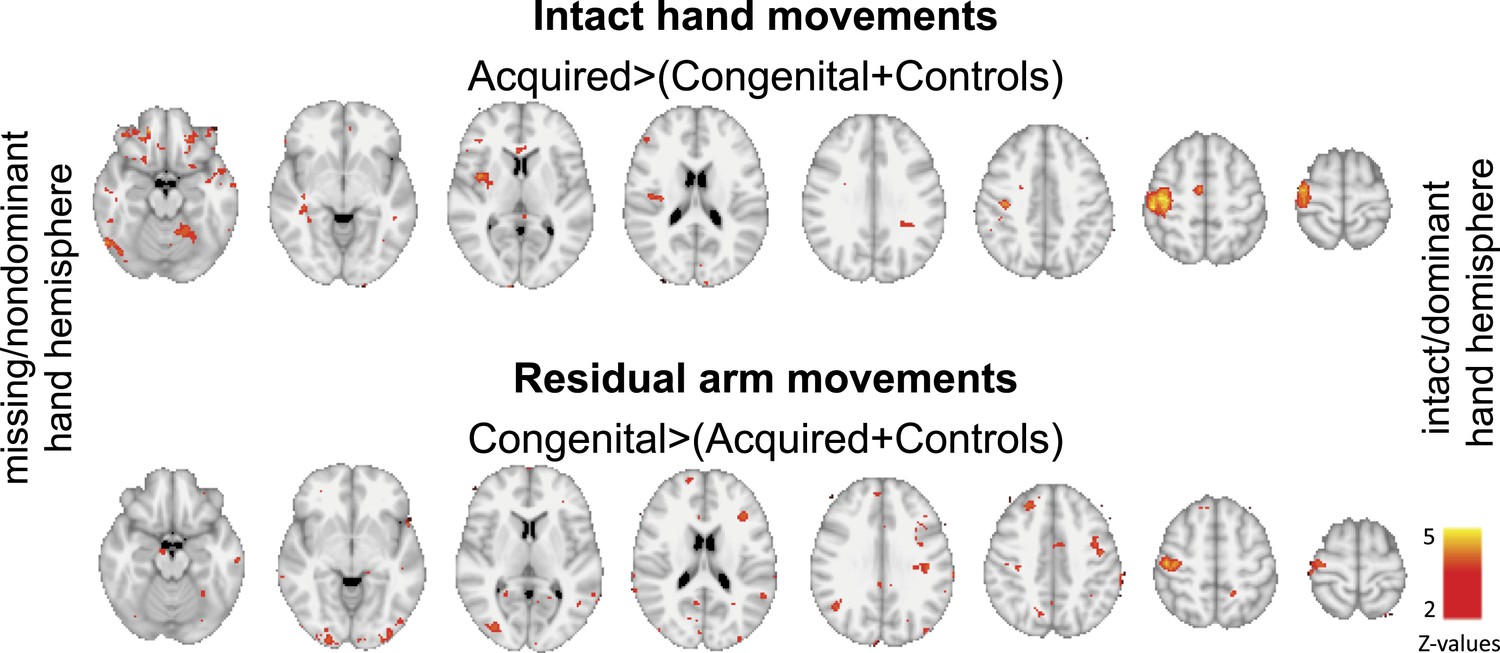
Group contrast maps (uncorrected for multiple comparisons) between activation patterns of intact/dominant hand (top) and residual/nondominant arm movements (bottom), as carried in Figure 2 of the main text. Thresholded clusters (Z>2, uncorrected) are presented on axial slices.
Author response image 2
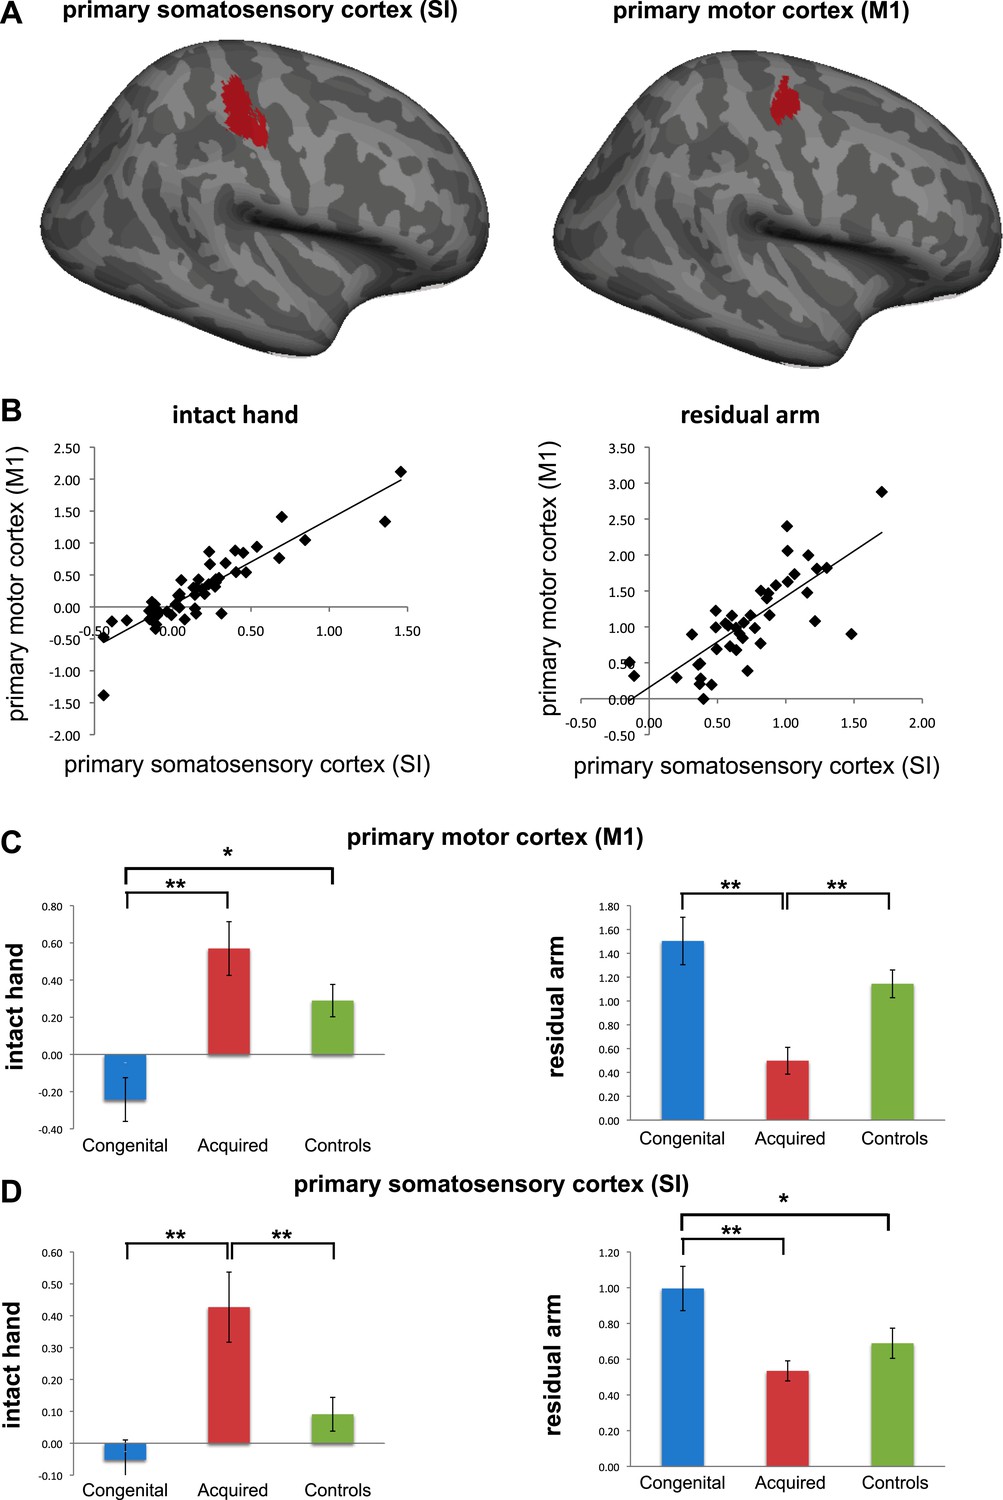
Separate analysis of M1 and SI. (a) To explore the contributions of SI and M1 to our ROI analysis, we constructed an expanded ROI (by thresholding the conjunction maps for phantom and nondominant hand movements, used to identify the deprived cortex, at Z>6 (cf. Z>7 used for the original ROI). This expansion was necessary to obtain a reasonable sampling of voxels on each side of the central sulcus). We considered voxels anterior to the central sulcus as belonging to M1, and those posterior as belonging to S1. Voxels along the central sulcus itself were excluded as it is not possible to know whether these should be assigned to M1 or to S1. The central sulcus exclusion zone was defined based on an anatomical landmark (approximately 2-4 mm wide, extending along the central sulcus), derived from the MNI 152 template brain. Note that due to these procedures, our original deprived cortex ROI only partially overlaps with these sub-regions. We then extracted individual participants’ fMRI activation values (β) from each of the sub-regions during intact/dominant hand (left) and residual/nondominant arm (right) movement execution. As seen in (b), beta values across participants showed similar patterns in SI and M1. When comparing the averaged fMRI activation values across groups (c-d), we found highly significant differences between the two limbless populations in both sub-regions. Asterisks denote significance levels of *p<0.05; **p<0.01.
Tables
Table 1
Demographic details of 1-handed individuals with acquired (A) and congenital (C) hand loss
| Age | Deprivation age (in years) | Amp. Level | Side/dominant | Cause of amputation | Cosmetic Pros. Usage | Functional Pros. Usage | |
|---|---|---|---|---|---|---|---|
| A01 | 43 | 38 | 4 | L/R | Trauma | 2 | 0 |
| A02 | 42 | 22 | 4 | R/L | Nerve I* | 2 | 0 |
| A03 | 21 | 18 | 4 | R/L | Trauma | 0 | 0 |
| A04 | 46 | 37 | 2 | L/R | Nerve I* | 1 | 0 |
| A05 | 48 | 20 | 1 | R/R | Trauma | 1 | 5 |
| A06 | 58 | 11 | 2 | R/R | Trauma | 1 | 5 |
| A07 | 31 | 2 | 2 | L/R | Trauma | 0 | 0 |
| A08 | 54 | 20 | 5 | L/L | Trauma | 5 | 0 |
| A09 | 47 | 45 | 2 | L/L | Tumour | 1 | 3 |
| A10 | 60 | 34 | 2 | R/R | Trauma | 0 | 5 |
| A11 | 51 | 35 | 4 | L/R | Infection | 1 | 5 |
| A12 | 47 | 19 | 2 | L/R | Trauma* | 0 | 5 |
| A13 | 57 | 48 | 4 | R/L | Infection | 0 | 2 |
| A14 | 56 | 40 | 2 | L/R | Trauma | 0 | 0 |
| A15 | 22 | 18 | 5 | L/R | Trauma | 0 | 0 |
| A16 | 43 | 33 | 4 | L/R | Trauma | 0 | 5 |
| A17 | 50 | 28 | 4 | L/R | Trauma | 5 | 0 |
| A18 | 52 | 45 | 4 | L/R | Trauma | 2 | 5 |
| C01 | 31 | 0 | 4 | R | Dysmelia | 5 | 0 |
| C02 | 24 | 0 | 4 | L | Dysmelia | 4 | 0 |
| C03 | 35 | 0 | 4 | L | Dysmelia | 5 | 0 |
| C04 | 31 | 0 | 5 | L | Dysmelia | 0 | 0 |
| C05 | 25 | 0 | 4 | L | Dysmelia | 0 | 0 |
| C06 | 54 | 0 | 4 | L | Dysmelia | 0 | 5 |
| C07 | 49 | 0 | 5 | L | Dysmelia | 0 | 0 |
| C08 | 22 | 0 | 4 | R | Dysmelia | 1 | 0 |
| C09 | 49 | 0 | 4 | R | Dysmelia | 4 | 0 |
| C10 | 18 | 0 | 4 | L | Dysmelia | 0 | 0 |
| C11 | 46 | 0 | 2 | L | Dysmelia | 2 | 5 |
-
Amputation levels: the level at which the residual arm ends. 1 = through shoulder, 2 = above elbow, 3 = through elbow, 4 = below elbow, 5 = through wrist; Side = side of amputation; dominant = hand dominance prior to hand loss (based on self report): L = left, R = right; NI=nerve injury.
-
*
indicates potential partial spinal damage. Pros. Usage = Prosthetic limb usage (frequency): 0 = never, 1 = rarely, 2 = occasionally, 3 = daily, 4 = more than 4 hr a day, 5 = more than 8 hr a day.
Download links
A two-part list of links to download the article, or parts of the article, in various formats.
Downloads (link to download the article as PDF)
Open citations (links to open the citations from this article in various online reference manager services)
Cite this article (links to download the citations from this article in formats compatible with various reference manager tools)
Deprivation-related and use-dependent plasticity go hand in hand
eLife 2:e01273.
https://doi.org/10.7554/eLife.01273


