Antibacterial gene transfer across the tree of life
- Vanderbilt University, United States
- Portland State University, United States
Figures
Figure 1 with 3 supplements
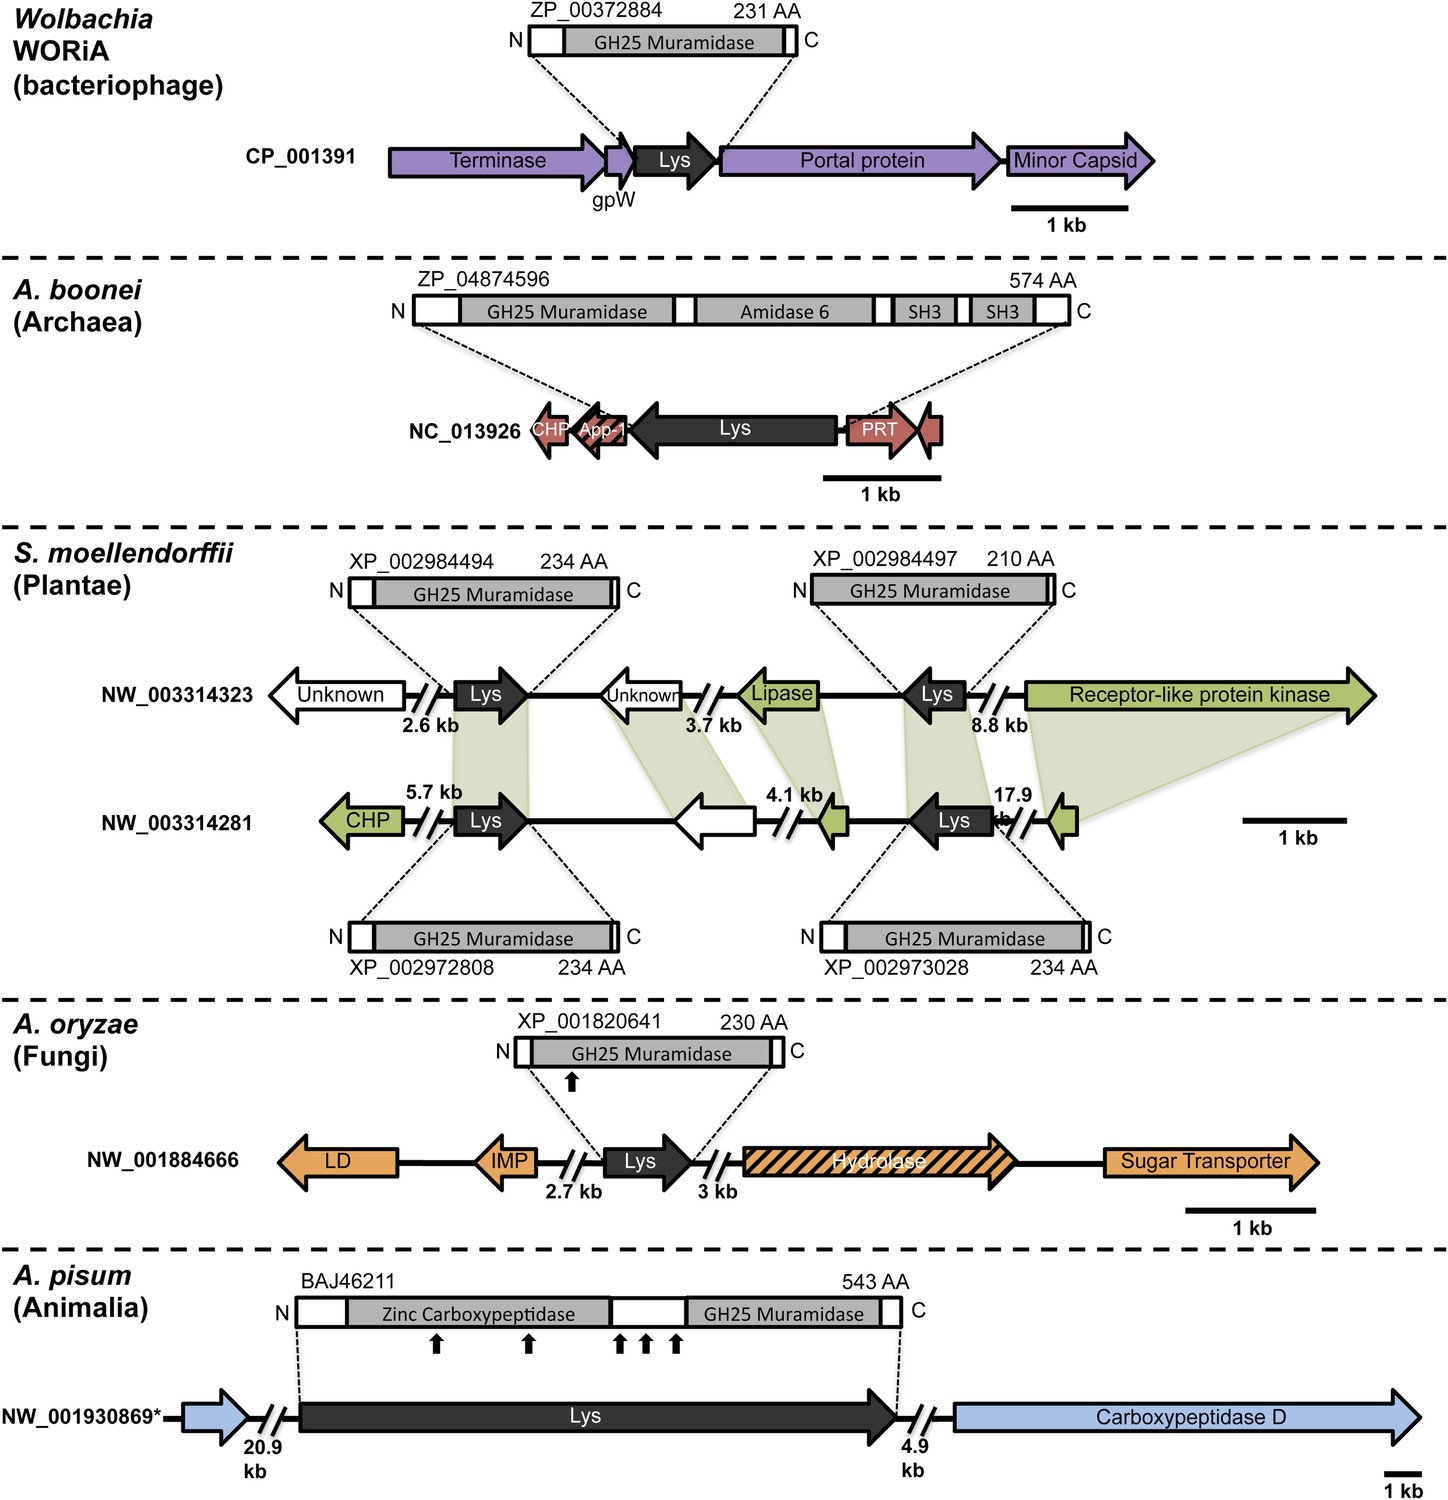
Architecture of HGT candidates and surrounding genes.
Each arrow represents an open reading frame transcribed from either the plus strand (arrow pointing right) or the minus strand (arrow pointing left). The color of the arrow indicates the taxa the gene is found in based on its closest homologs. Black = Eubacteria, purple = virus, red = Archaea, green = Plantae, Orange = Fungi, Blue = Insecta, white = no known homologs, dashed line = present in multiple domains. The length of the arrows and intergenic regions are drawn to scale except where indicated with broken lines. The four paralogs of the lysozyme in S. moellendorffii occur on two genomic scaffolds with light green bands connecting homologous genes. Vertical arrows indicate the location of introns in the A. oryzae and A. pisum lysozymes. Abbreviations: Lys: lysozyme, gpW = phage baseplate assembly protein W, SH3: Src homology domain 3, App-1 = ADP-ribose-1”-monophosphatase, PRT = phosphoribosyltransferase, LD = leucoanthocyanidin dioxygenase; IMP = integral membrane protein. A protein diagram for each lysozyme is drawn to scale with the light gray regions highlighting a conserved protein domain. *A. pisum diagram is based on Acyr_1.0 assembly and transcription data (Nikoh et al., 2010); the annotation in Acyr_2.0 is different.
Figure 1—figure supplement 1
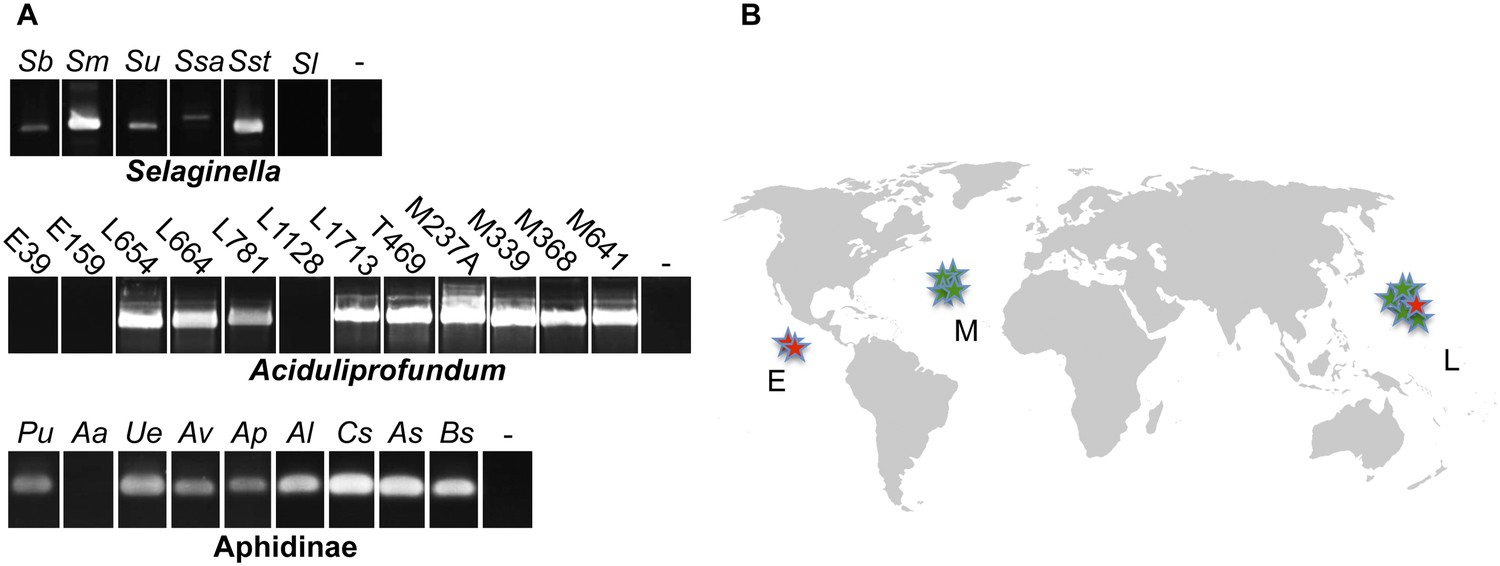
Presence of HGT lysozyme genes in field samples.
(A) PCR amplifications of portions of the GH25 muramidase domain in the indicated taxa. All amplifications were Sanger sequenced to confirm integration. Primers used are listed in Table S3. Abbreviations: Sb: S. braunii, Sm: S. moellendorffii, Su: S. uncinata, Ssa: S. sanguinolenta, Sst: S. stauntoniana, Sl: S. lepidophylla, E: East Pacific Rise, L: Lao Spreading Center, M: Mid-Atlantic Ridge, Pu: Pleotrichophorus utensis, Aa: Artemisaphis artemisicola, Ue: Uroleucon erigeronensis, Av: Aphis varians, Ap: Acyrthosiphon pisum, Al: Aphis lupini, Cs: Cedoaphis sp., As: Aphthargelia symphoricarpi, Bs: Braggia sp., - denotes water only control. (B) World map with approximate locations of A. boonei field samples. Those that tested positive for the GH25 muramidase domain are indicated by green stars and those that tested negative are indicated by red stars. Map is a public domain image from Wikimedia Commons.
Figure 1—figure supplement 2
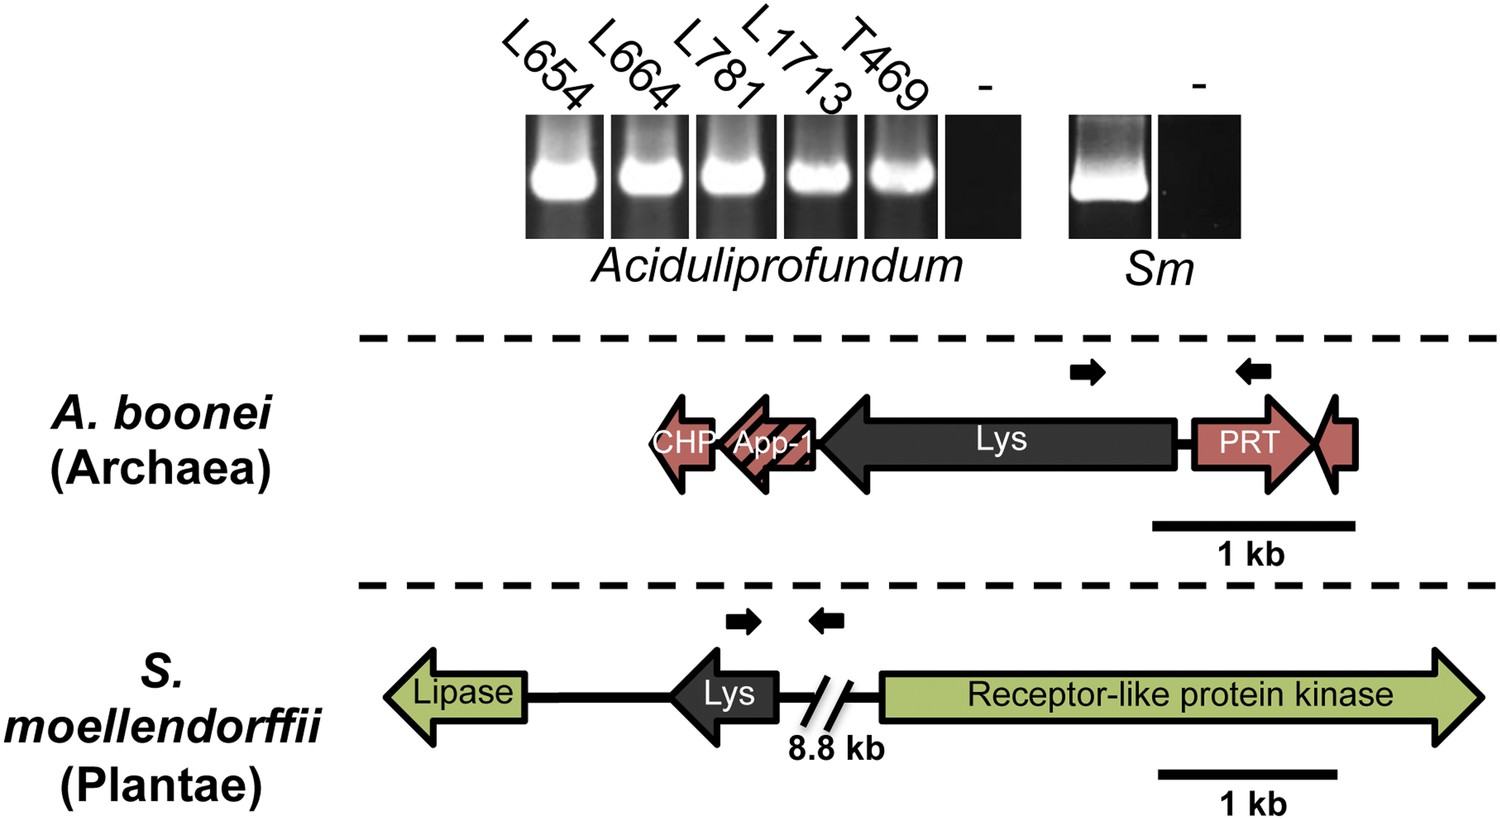
PCR amplifications testing genomic integration with primers within and outside of lysozyme genes.
Primers used are listed in Supplementary file 1 and binding sites are indicated in gene diagrams with small black arrows. All integrations were confirmed with Sanger sequencing. Abbreviations: Sm: S. moellendorffii, L: Lao Spreading Center, - denotes water only control, CHP = conserved hypothetical protein, App-1 = ADP-ribose-1”monophosphatase, PRT = phosphoribosyltransferase.
Figure 1—figure supplement 3
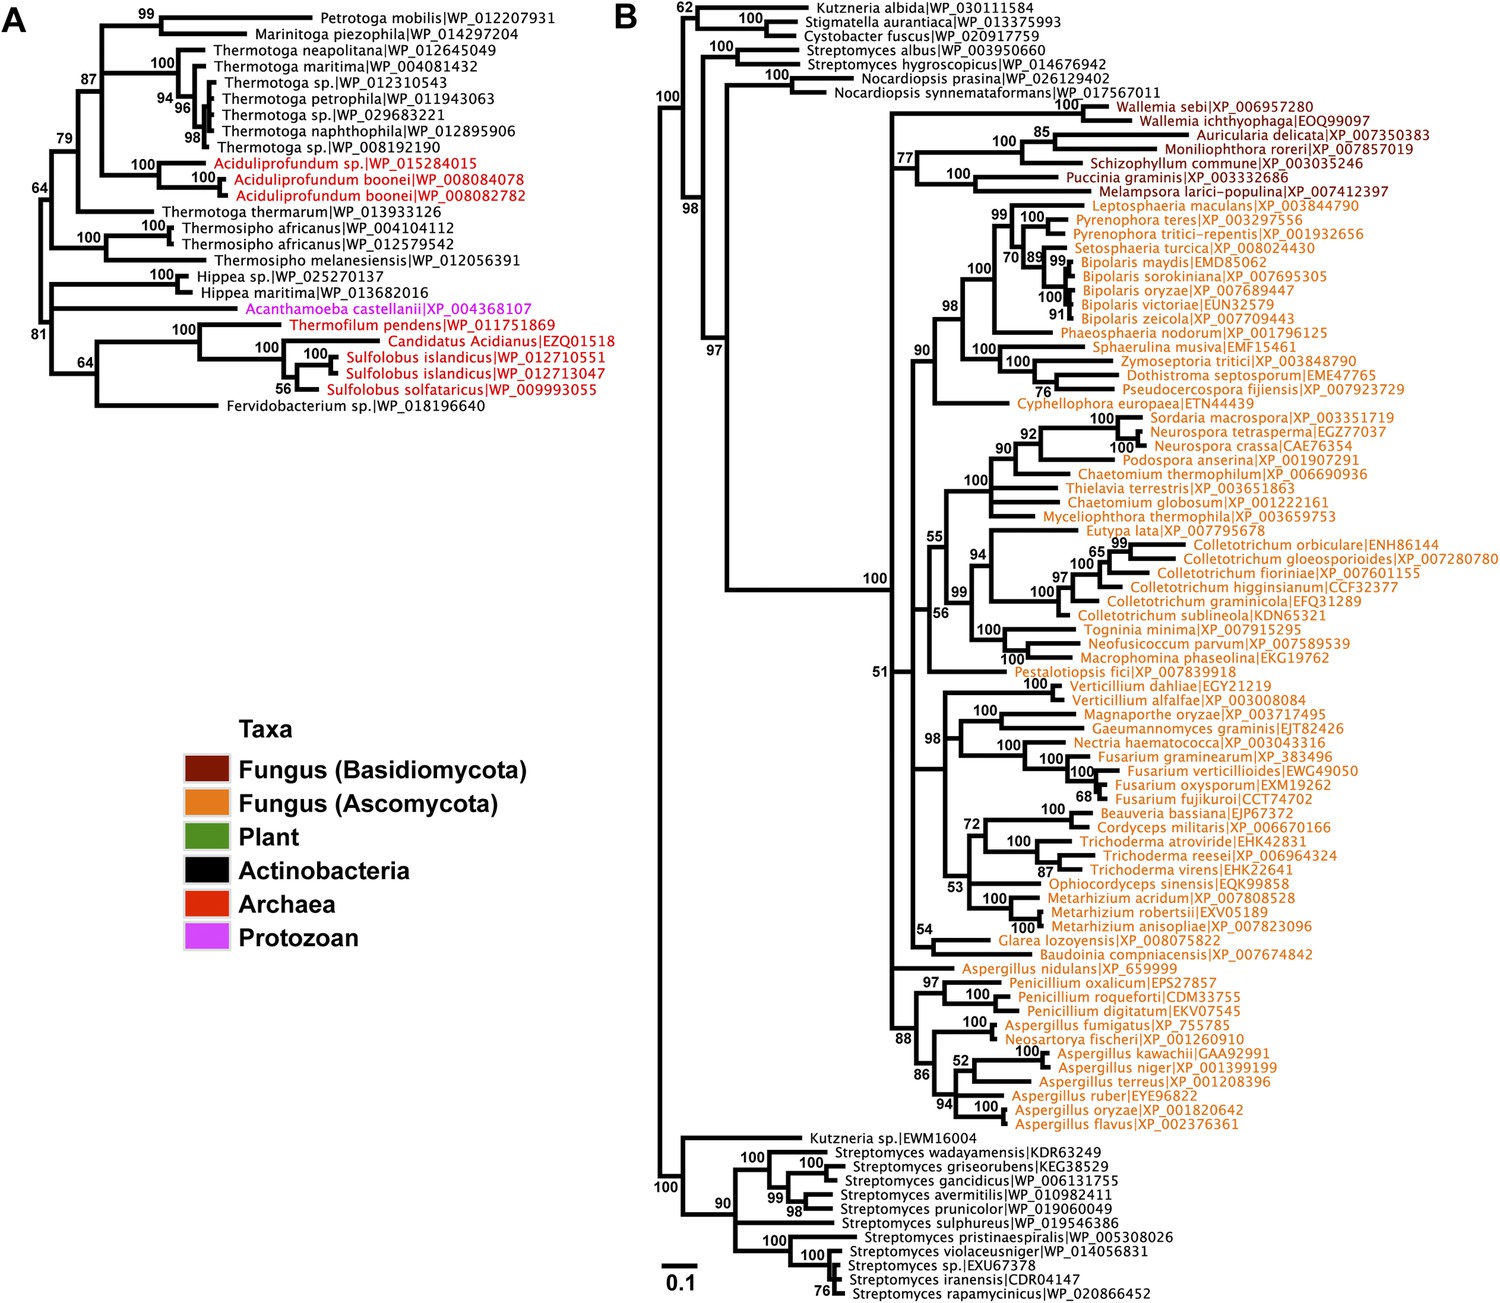
Protein phylogeny of neighboring genes to transferred lysozymes.
(A) App-1 phylogeny based on alignment of 141aa without indels consisting of top E-value hits to blastp using A. boonei App-1 as the query. Taxon of origin for each amino acid sequence is indicated by color. Posterior probability is indicated at all nodes with values above 50. Branch lengths represent number of substitutions per site as indicated by scale bar. Tree is arbitrarily rooted. (B) GH2 hydrolase phylogeny based on an alignment of 188aa without indels consisting of top E-value hits to blastp using A. oryzae hydrolase as the query.
Figure 2 with 3 supplements
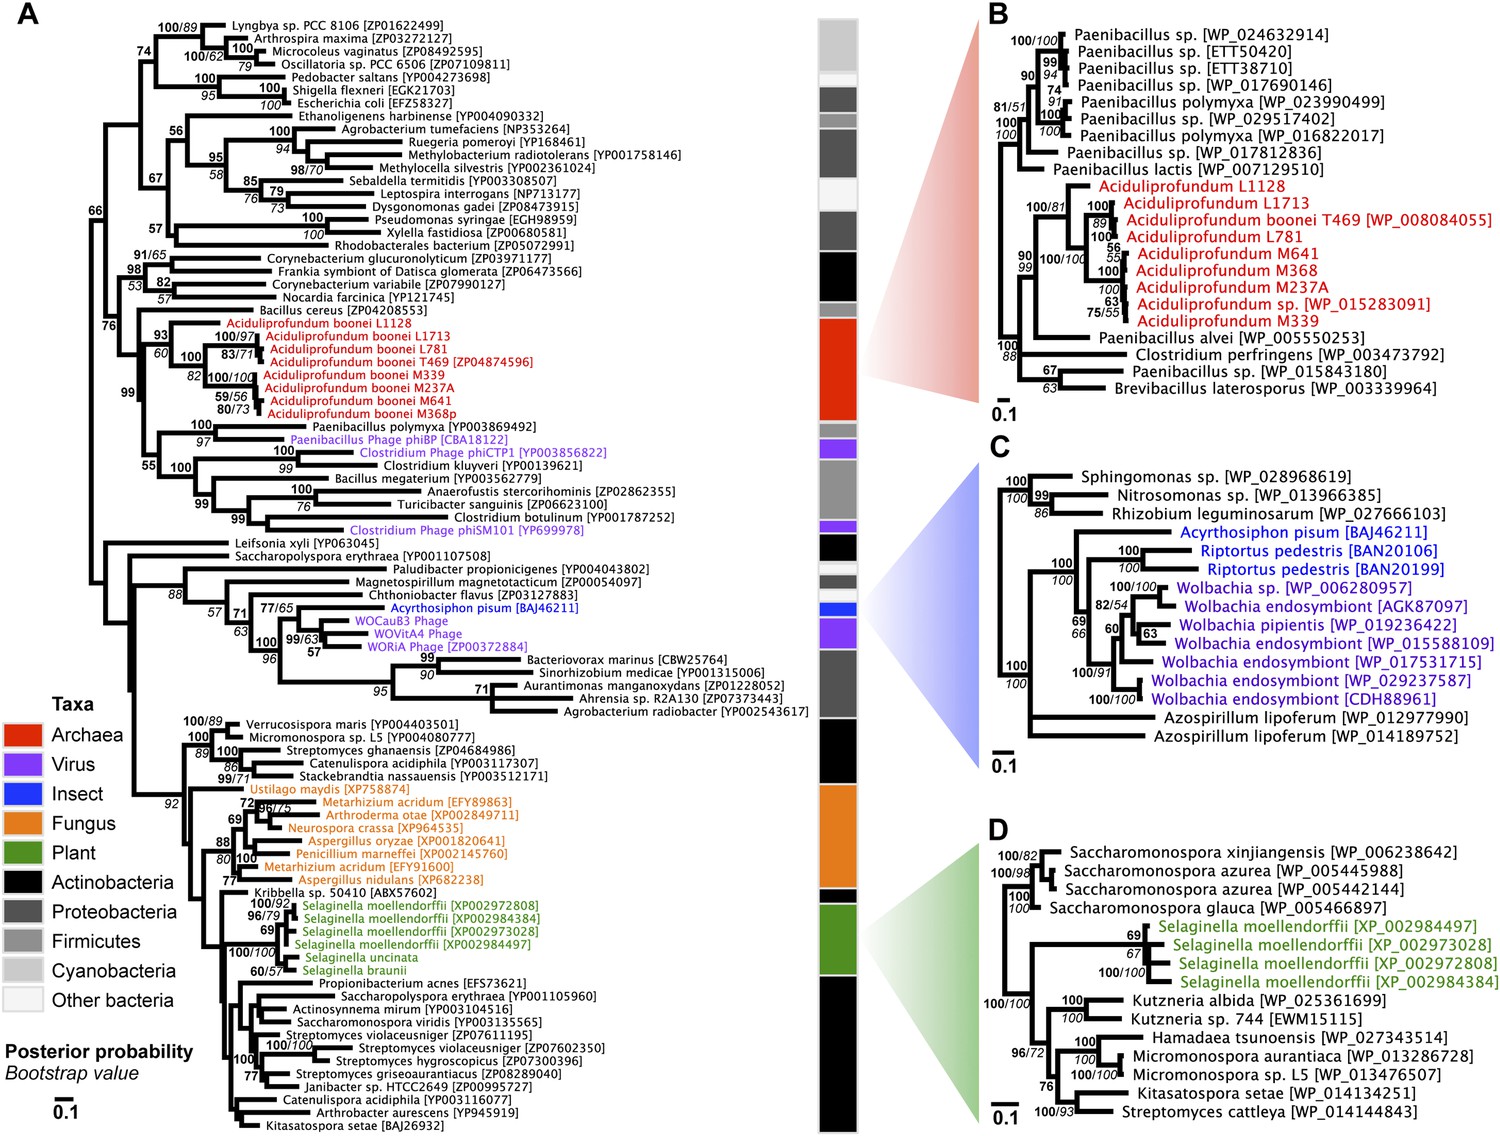
Phylogeny of GH25 muramidase.
(A) Phylogeny based on alignment of 113aa without indels consisting of top E-value hits to blastp using WORiA phage lysozyme as a query. Taxon of origin for each amino acid sequence is indicated by color. Posterior probability (Bayesian phylogeny) and bootstrap values (maximum likelihood phylogeny) are indicated at all nodes with values above 50. Branch lengths represent number of substitutions per site as indicated by scale bar. Tree is arbitrarily rooted. Iterative phylogenies based on top E-value blastp hits to A. boonei lysozyme (B), A. pisum lysozyme (C), and S. moellendorffii lysozyme (D) are also shown.
Figure 2—figure supplement 1
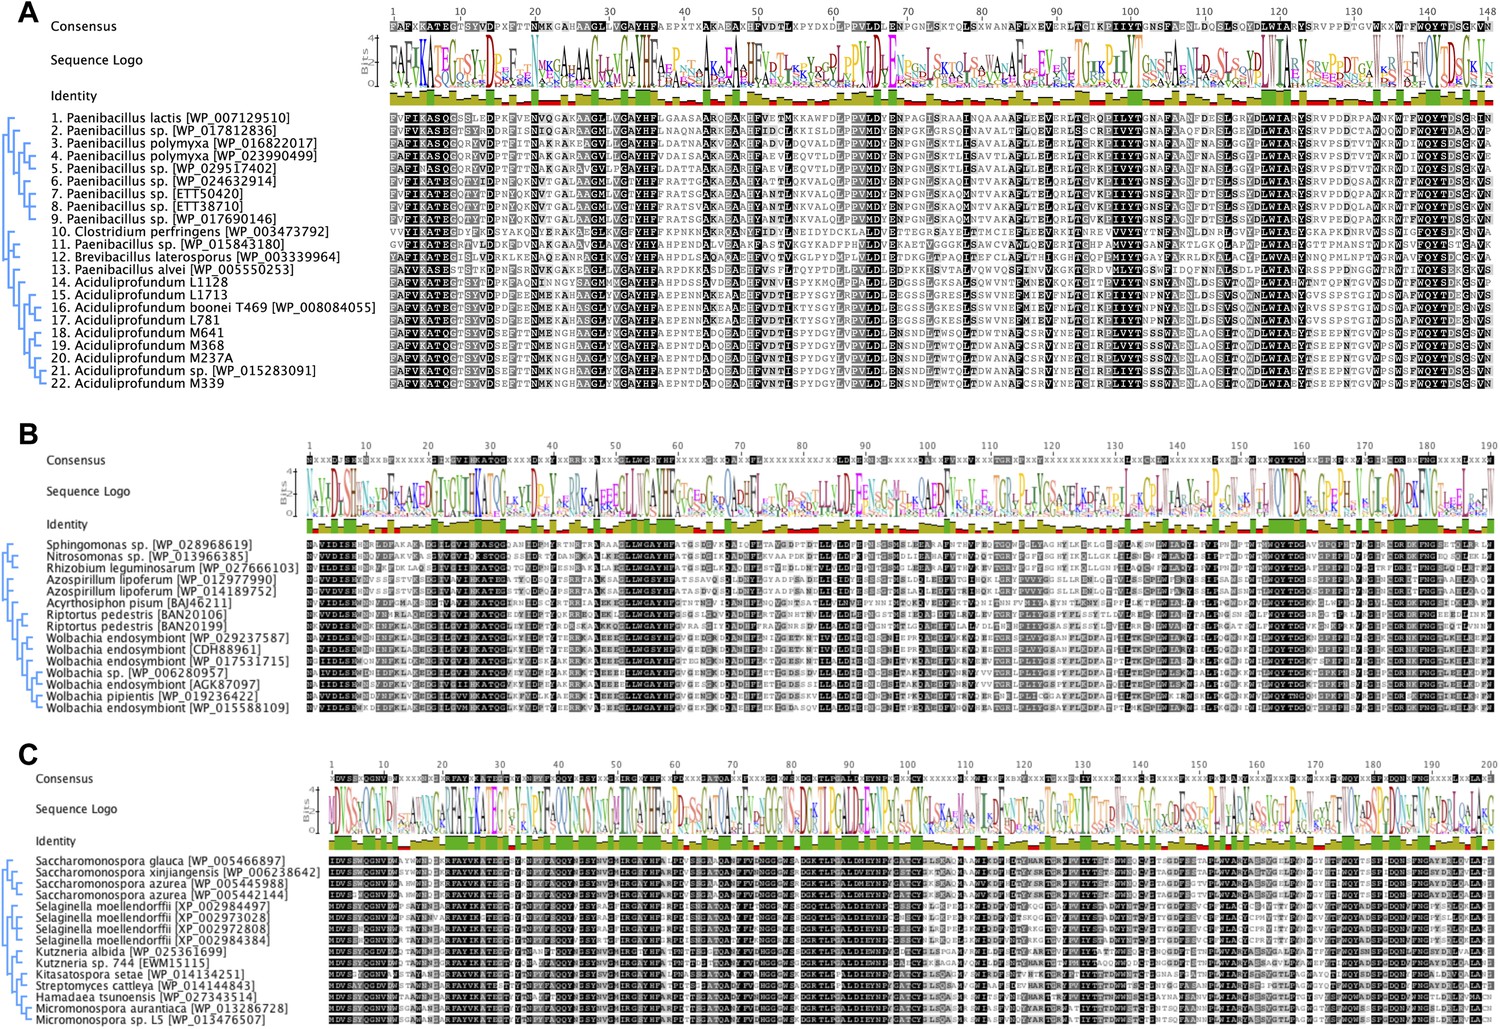
Iterative HGT analysis alignments.
Consensus alignment of GH25 muramidases without indels used in iterative phylogenies in Figure 2 is shown for (A) A. boonei, (B) A. pisum, and (C) S. moellendorffii. Conservation is indicated by amino acid symbol size and bar graphs below the consensus sequence.
Figure 2—figure supplement 2
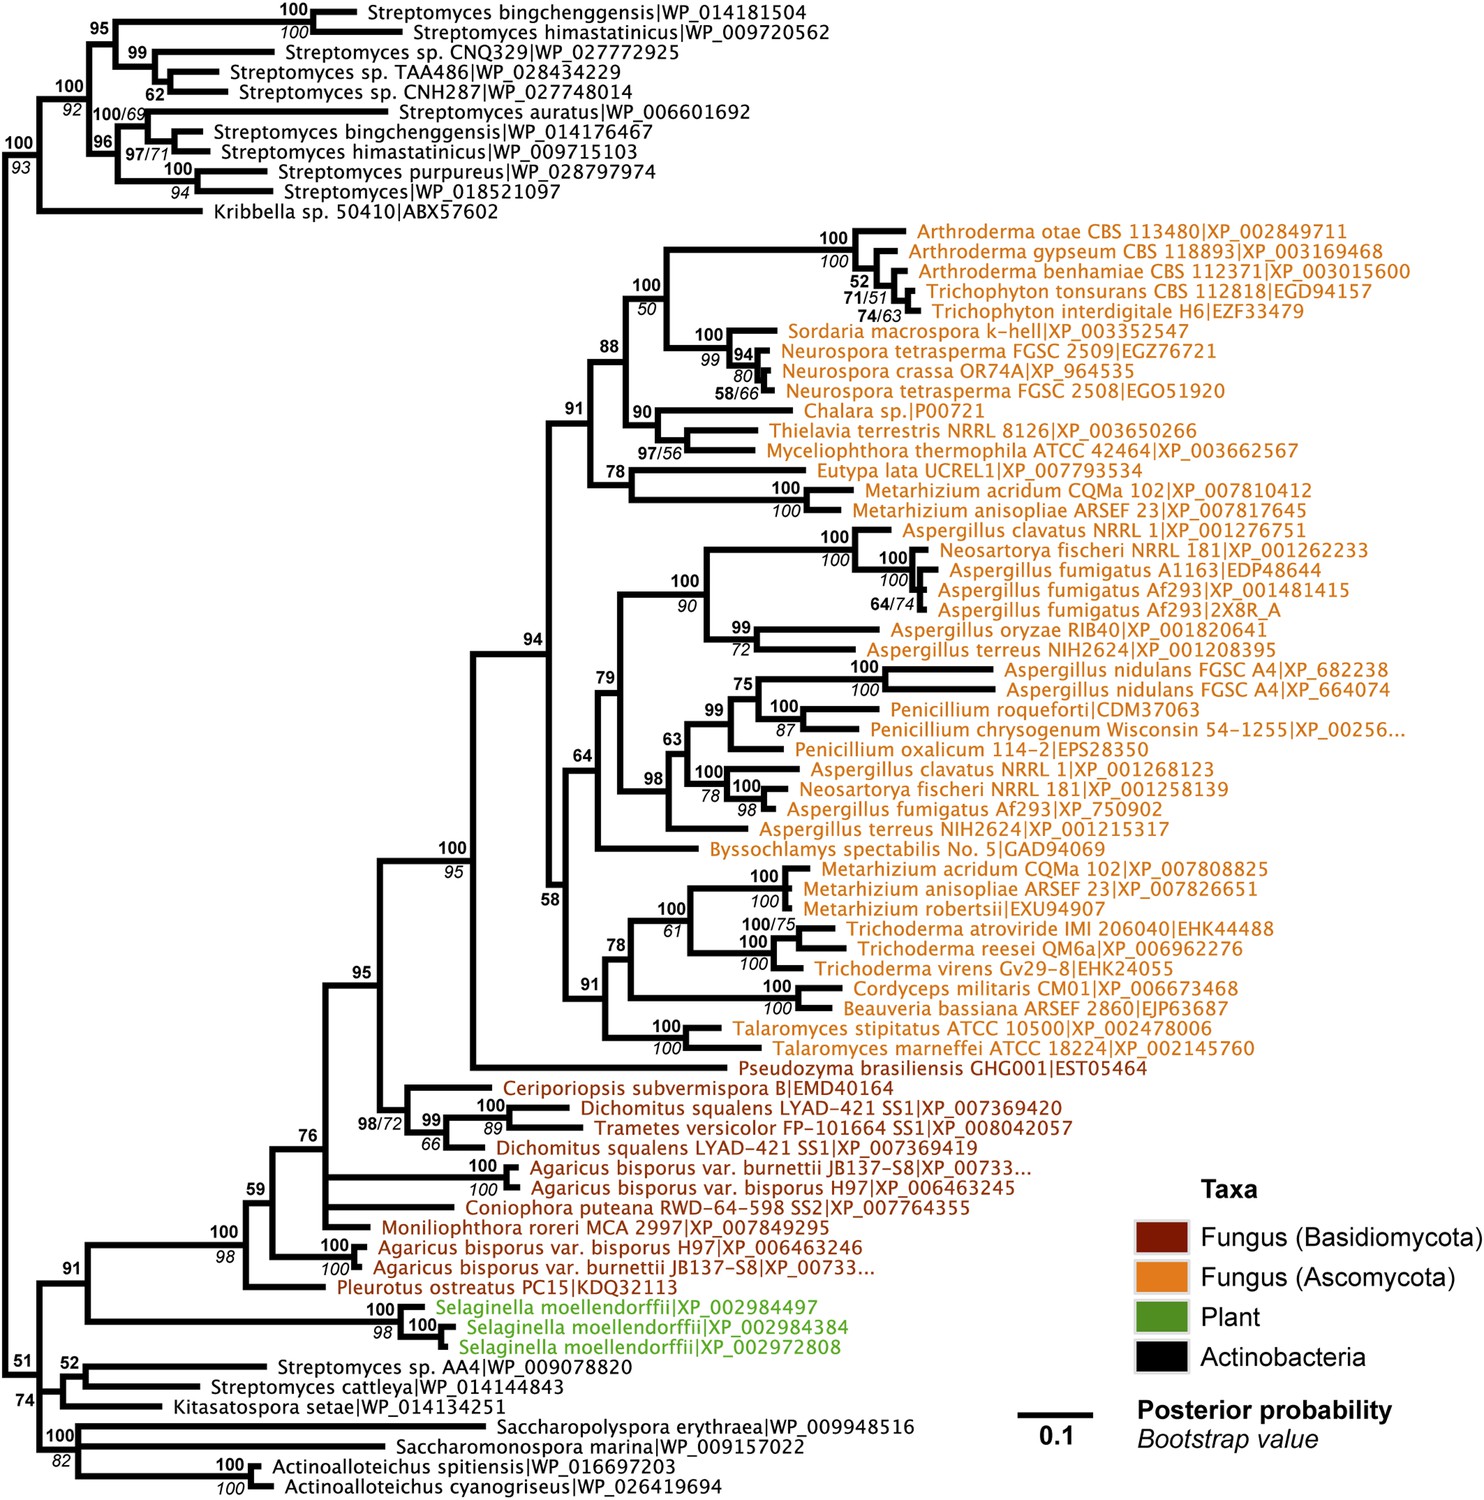
Protein phylogeny of A. oryzae GH25 muramidase and relatives.
Phylogeny based on alignment of 186aa without indels consisting of top E-value hits to blastp using A. oryzae lysozyme as a query. Taxon of origin for each amino acid sequence is indicated by color. Posterior probability (Bayesian phylogeny) and bootstrap values (maximum likelihood phylogeny) are indicated at all nodes with values above 50. Branch lengths represent number of substitutions per site as indicated by scale bar. Tree is arbitrarily rooted.
Figure 2—figure supplement 3
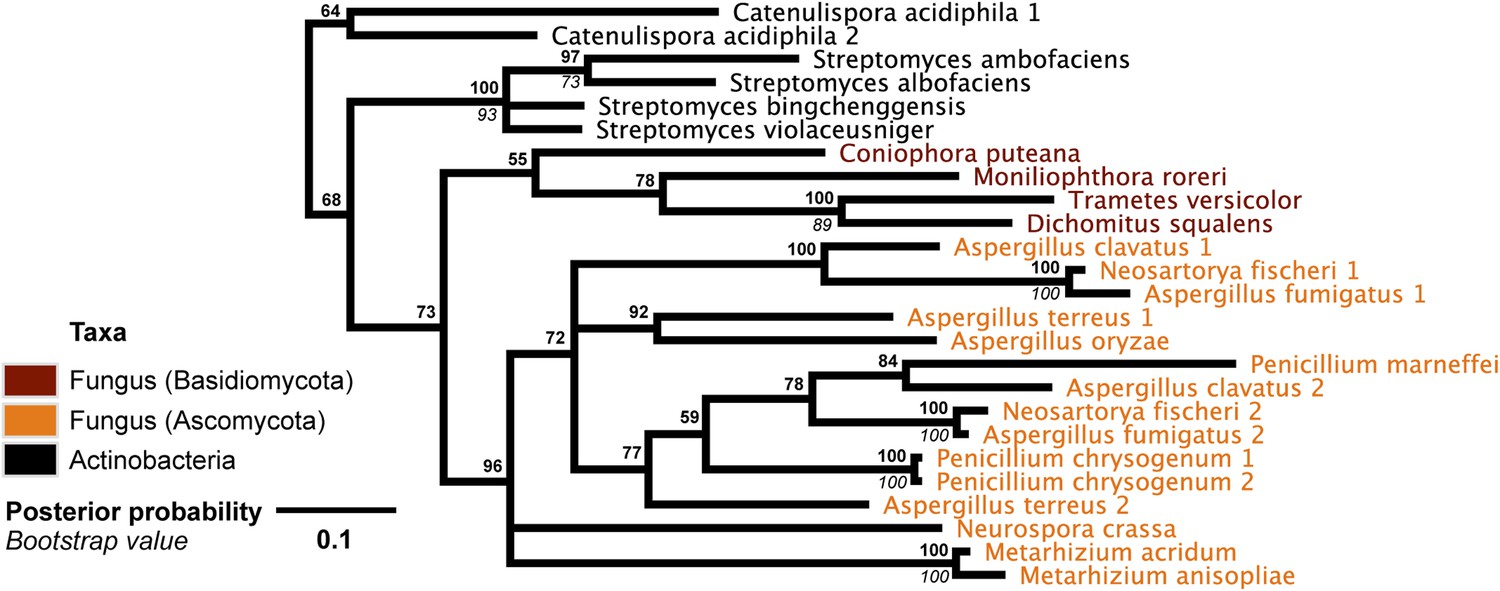
DNA phylogeny of A. oryzae GH25 muramidase and relatives.
Phylogeny based on alignment of 282 bp without indels consisting of top E-value hits to blastn using A. oryzae lysozyme exon 2 as a query. Taxon of origin for each nucleic acid sequence is indicated by color. Posterior probability (Bayesian phylogeny) and bootstrap values (maximum likelihood phylogeny) are indicated at all nodes with values above 50. Branch lengths represent number of substitutions per site as indicated by scale bar. Tree is arbitrarily rooted.
Figure 3
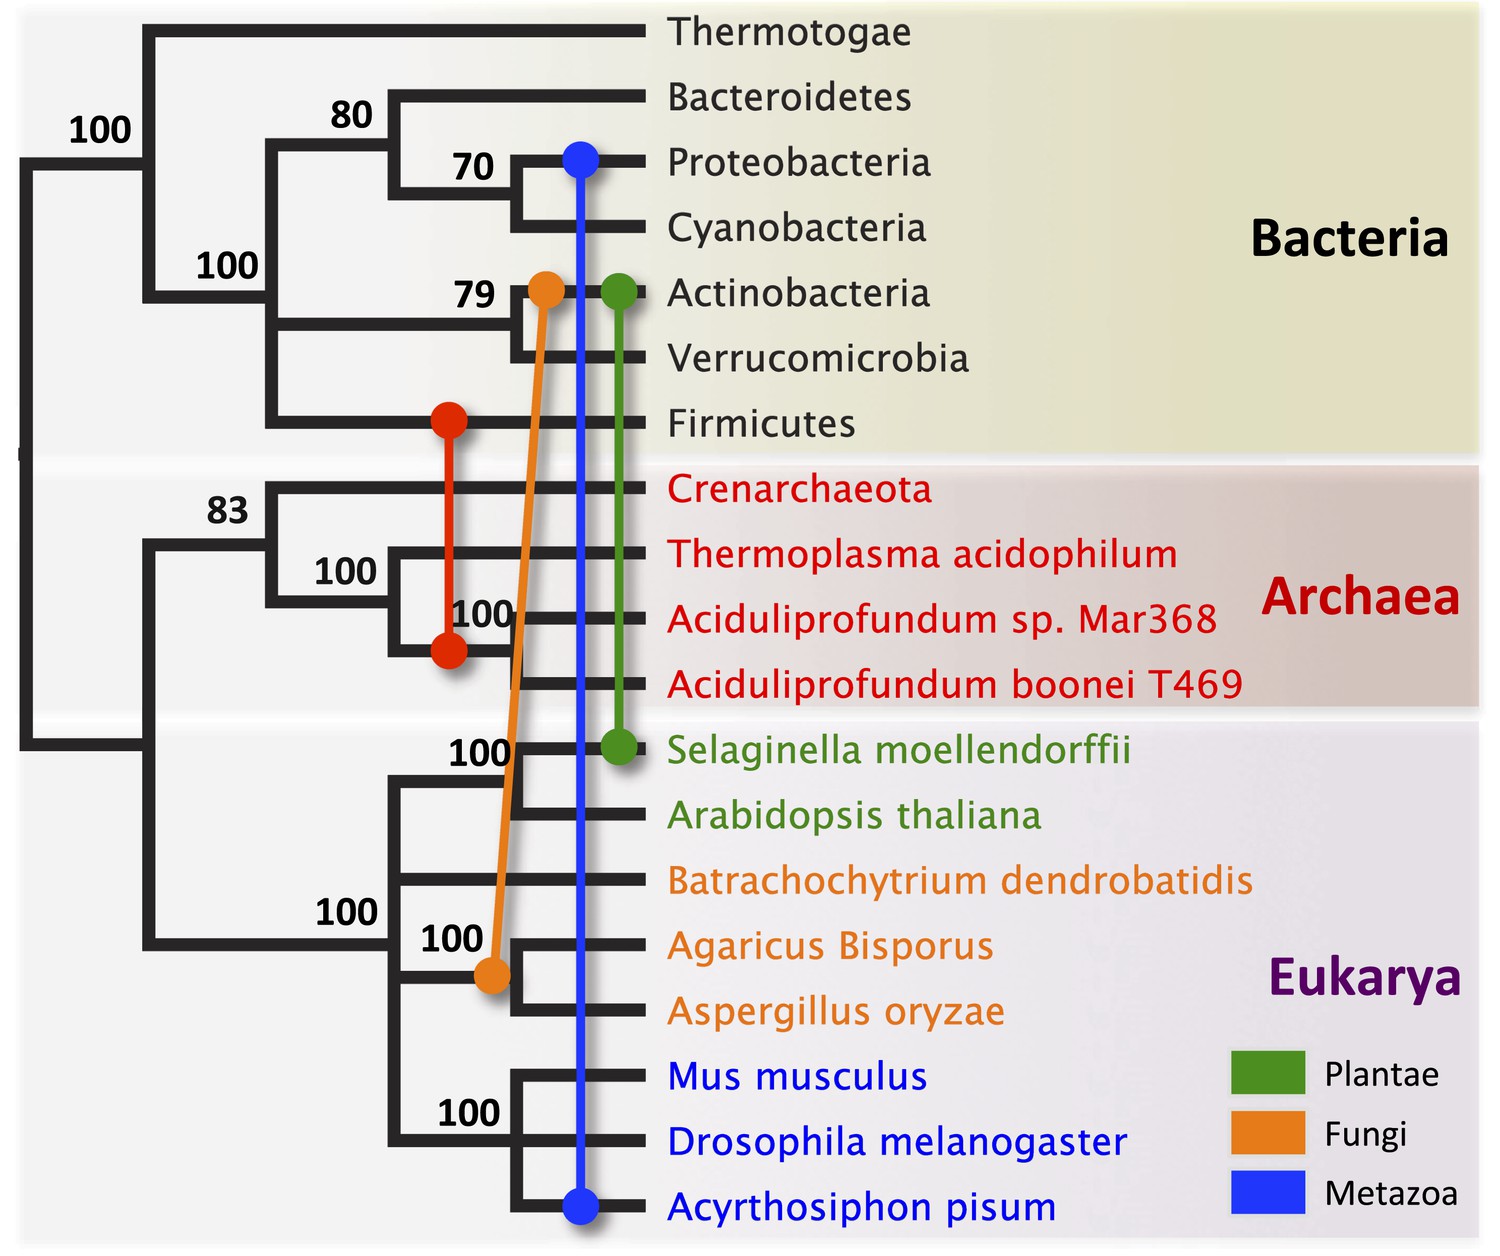
Schematic of HGT events.
Bayesian phylogeny based on the 16S rRNA gene from selected taxa is shown. Colored lines indicate putative horizontal gene transfer events, although other possible HGT patterns cannot be definitively excluded. Posterior probabilities are noted at each node.
Figure 4
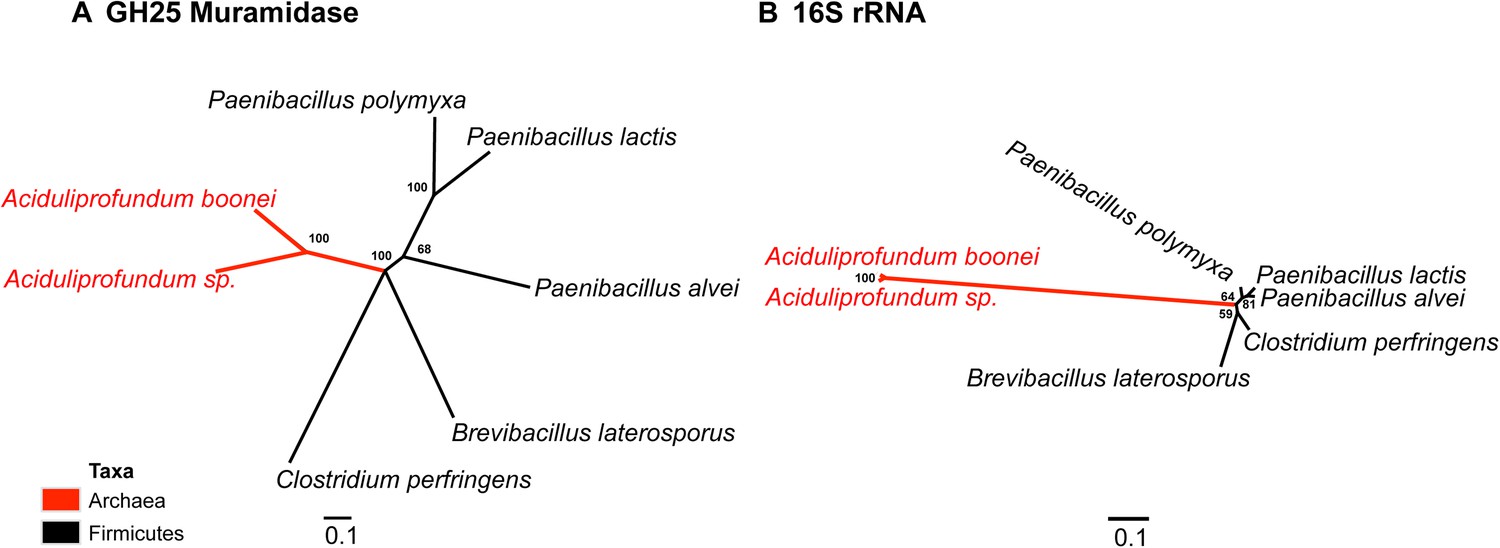
Comparison of GH25 muramidase and rRNA divergence.
(A) Unrooted Bayesian phylogeny of the GH25 muramidase from A. boonei and selected relatives, based on an alignment of 185aa without indels. Taxon of origin for each nucleic acid sequence is indicated by color. Posterior probability is indicated at all nodes with values above 50. Branch lengths represent number of substitutions per site as indicated by scale bar. (B) Unrooted Bayesian phylogeny of the 16S rRNA gene for the same taxa as in (A), based on an alignment of 1,156 bp without indels.
Figure 5
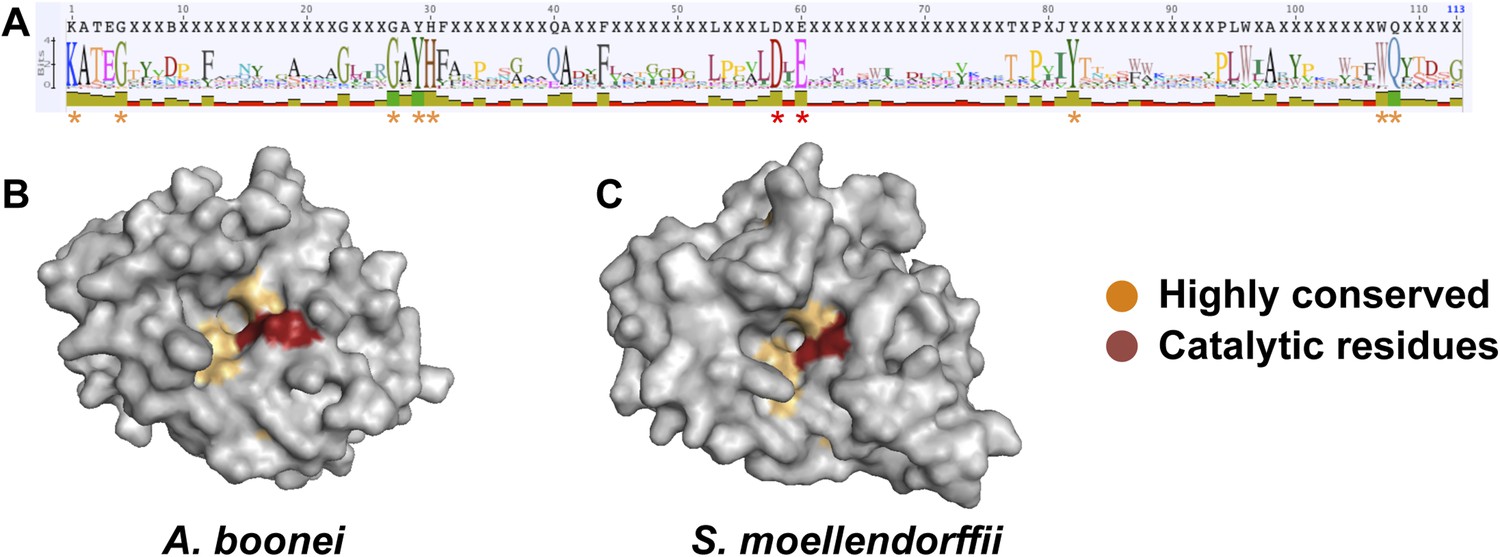
Conservation of A. boonei GH25 muramidase domain.
(A) Consensus alignment of 86 GH25 muramidases with insertions and deletions removed. Conservation is indicated by amino acid symbol size and bar graphs below the consensus sequence. Active site residues and highly conserved amino acids modeled below are indicated with red and orange asterisks, respectively. (B) Space-filling model of the active site face of the predicted structure of A. boonei GH25 muramidase domain and (C) S. moellendorffii GH25 muramidase domain. Active site residues are indicated in red and the eight additional residues most highly conserved across all 86 proteins are orange.
Figure 6 with 2 supplements

Antibacterial action of A. boonei GH25 muramidase domain against Firmicutes.
(A) Bacteria of the specified strain/species incubated overnight on tryptic soy agar after a 20-min liquid preincubation with the proteins indicated. Genera: B = Bacillus, P = Paenibacillus. Proteins: CEWL = chicken egg white lysozyme, P. poly = P. polymyxa lysozyme, PhiBP = bacteriophage PhiBP lysozyme, A. boo = GH25 domain of A. boonei lysozyme, CFP = cyan fluorescent protein. Images are representative of at least three independent experiments. (B) Dose-dependence of A. boonei GH25 muramidase antibacterial action. B. subtilis colony survival is shown after incubation with A. boonei GH25 muramidase at the indicated concentrations for 20 min at 37°C. N = 10 for each concentration. p < 0.001 for linear model fit. Error bars are ± SEM.
Figure 6—figure supplement 1
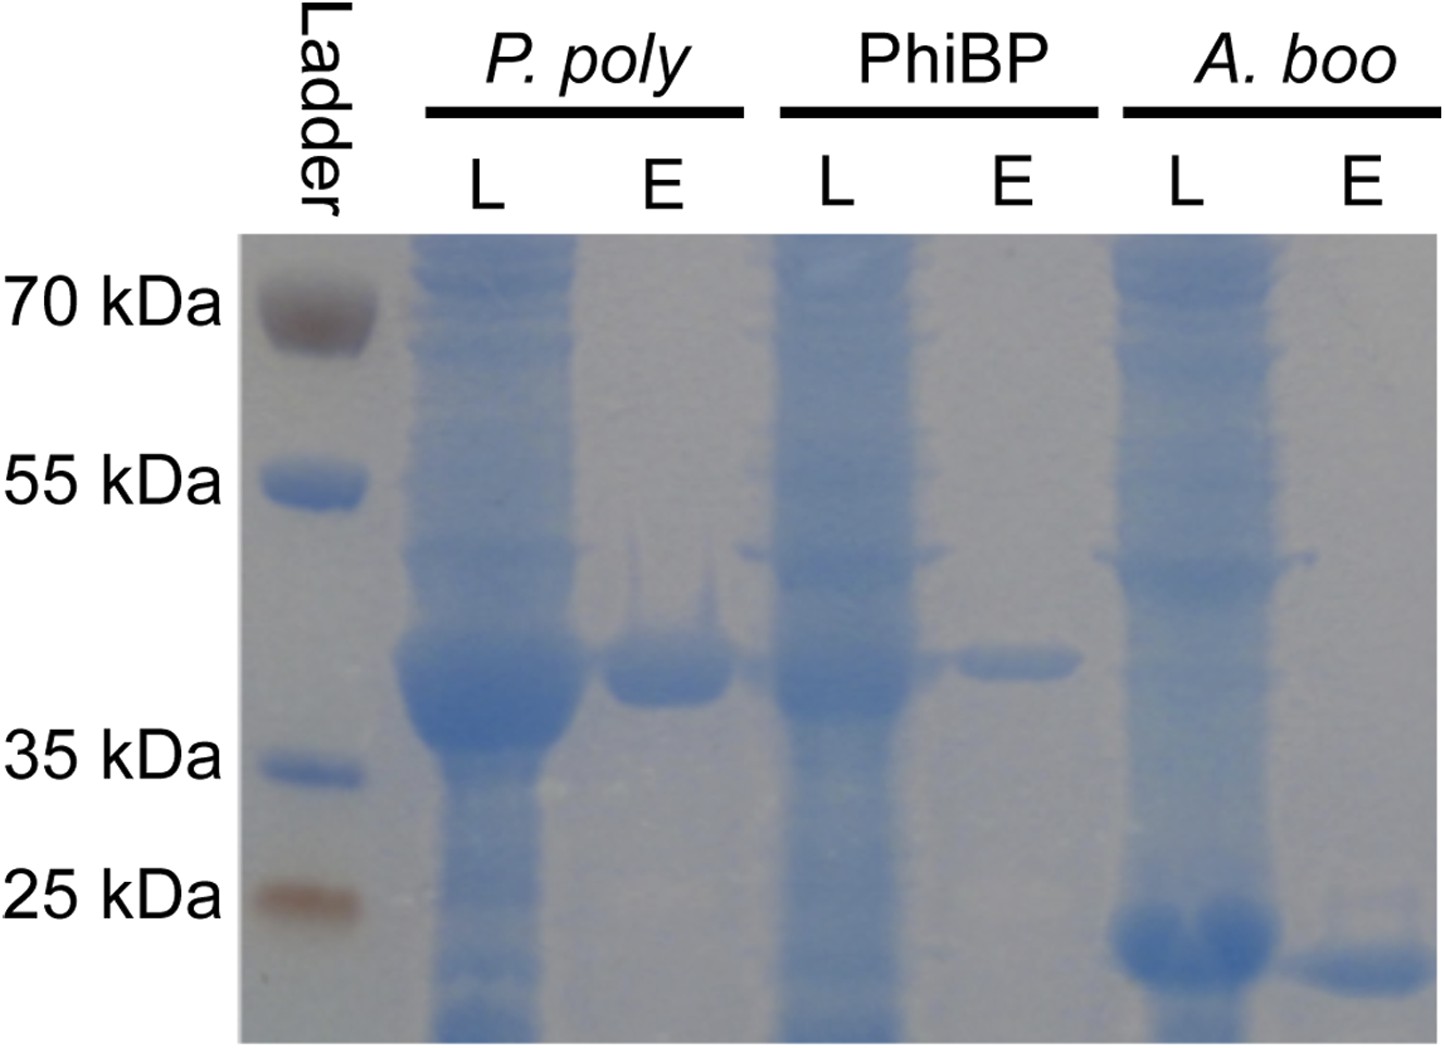
Lysozyme purifications.
PAGE gel stained with GelCode blue before and after purification of 6x-histidine tagged enzymes using nickel affinity chromatography. L = crude E. coli lysate expressing the indicated lysozyme, E = elution after lysozyme purification. P. poly = P. polymyxa lysozyme, PhiBP = bacteriophage PhiBP lysozyme, A. boo = A. boonei GH25 domain.
Figure 6—figure supplement 2
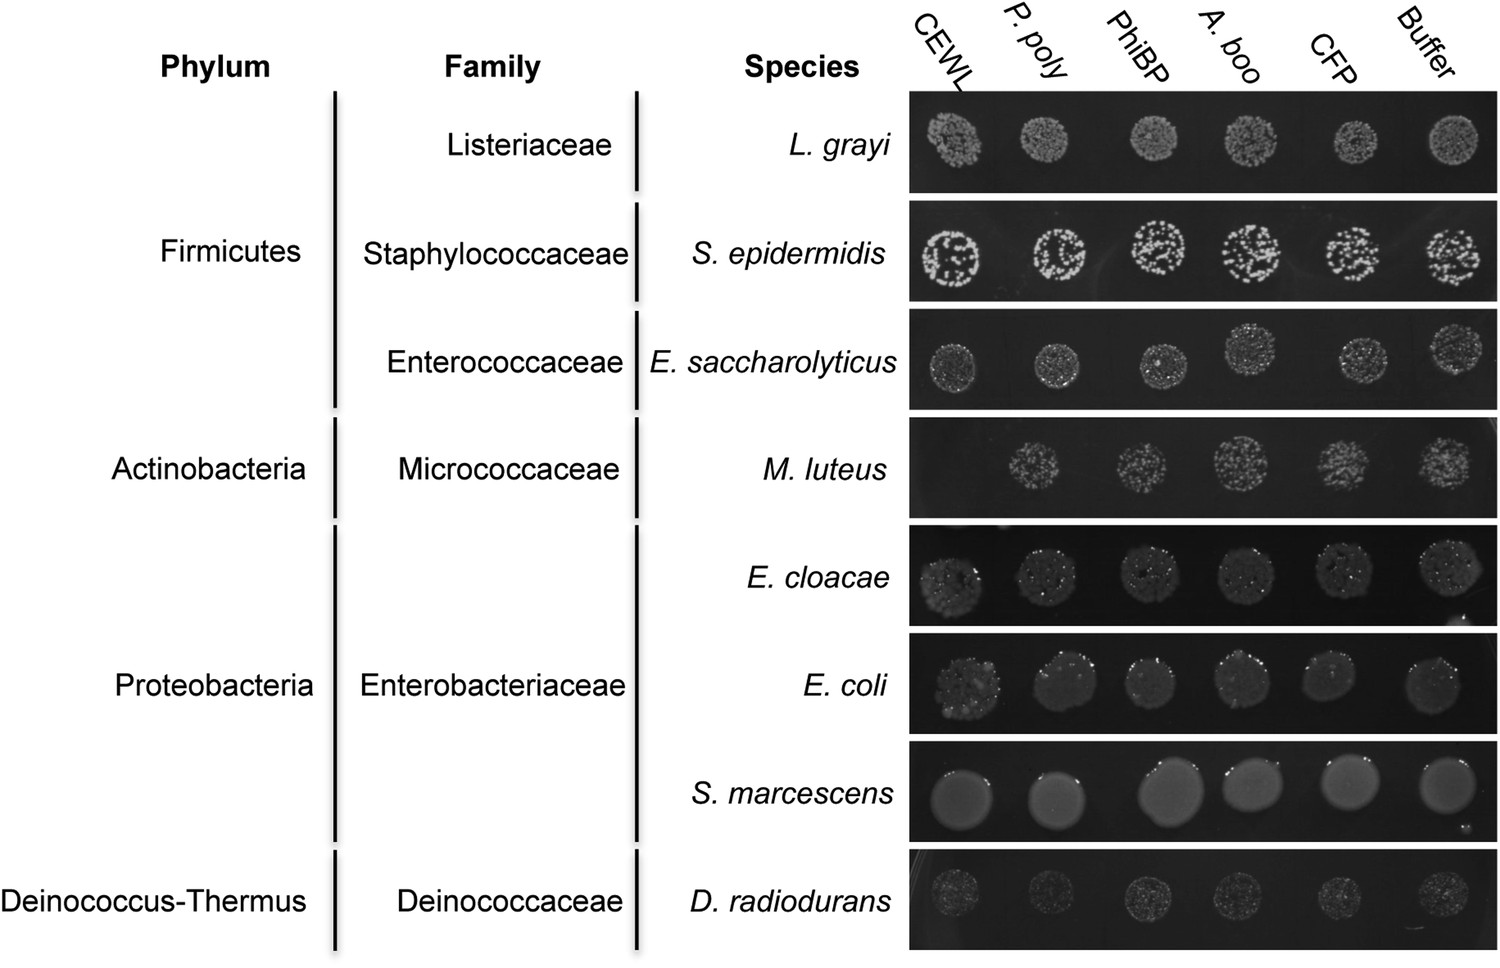
Antibacterial test of A. boonei GH25 muramidase on non-Firmicutes bacteria.
Bacteria of the specified strain/species incubated overnight on tryptic soy agar after a 20-min liquid preincubation with the proteins indicated. Genera: L = Listeria, S = Staphylococcus, E. saccharolyticus = Enterococcus, M = Micrococcus, E. cloacae = Enterobacter, E. coli = Escherichia, S = Serratia, D = Deinococcus. Proteins: CEWL = chicken egg white lysozyme, P. poly = P. polymyxa lysozyme, PhiBP = bacteriophage PhiBP lysozyme, A. boo = GH25 domain of A. boonei lysozyme, CFP = cyan fluorescent protein. Images are representative of at least three independent experiments.
Figure 7

E. coli death following full-length A. boonei lysozyme expression.
(A) Live/dead stain of BL21 (DE3) E. coli transformed with expression constructs for the full-length lysozyme from A. boonei or a control lysozyme WORiA, a bacteriophage infecting Wolbachia pipientis strain wRi, after overnight growth without induction. PAGE gels of crude E. coli lysates from E. coli expressing the indicated lysozyme after 6 hr of induction are also shown with the expected sizes of lysozymes indicated with arrows. (B) Structure of original full-length A. boonei lysozyme expression plasmid and two spontaneous knockout mutants caused by insertion of 774 bp (mutant 1) and 768 bp (mutant 2) of IS1 transposase sequences. These insertions also resulted in a number of stop codons in the reading frame of the lysozyme. Knockout mutants grew to normal colony size, while all wild type colonies had intact expression plasmids, grew poorly, and died over time in liquid culture.
Figure 8
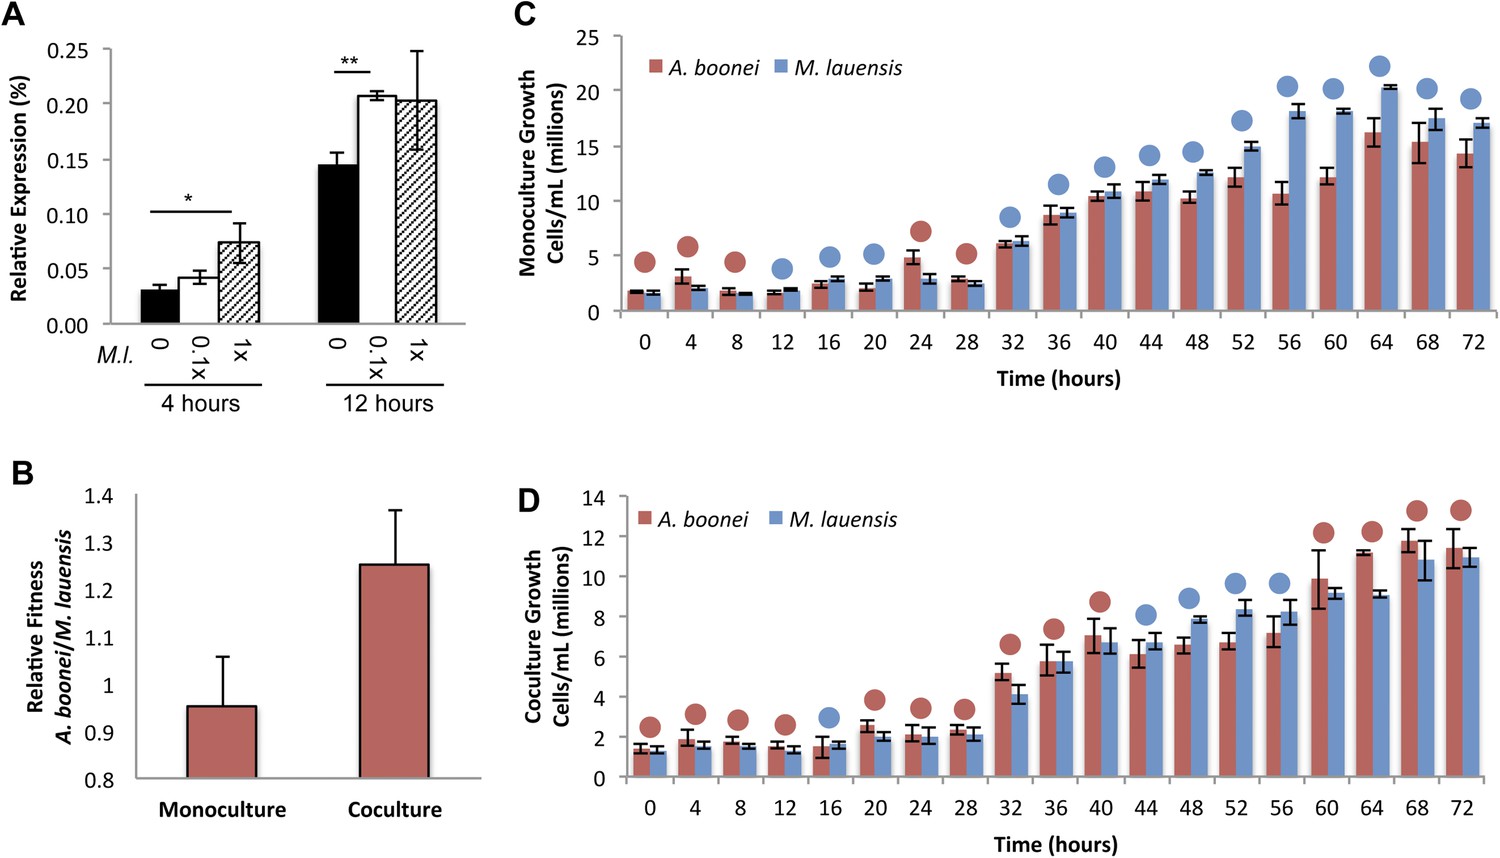
Lysozyme expression and relative fitness during A. boonei and M. lauensis coculture.
(A) Expression of A. boonei GH25 muramidase relative to the control gene elongation factor 1α, after the indicated time of coculture with M. lauensis (M.l) at the specified ratio relative to A. boonei. *p < 0.05, **p < 0.01, by Mann–Whitney U pairwise comparisons. N = 6 for all samples. Primers are listed in Supplementary file 1. (B) Relative fitness of A. boonei vs M. lauensis in monoculture (N = 5) and coculture (N = 4). (C) Growth of A. boonei (red) and M. lauensis (blue) monocultures over time. Significant differences in cell abundance occur at 24, 52, and 64 hr (p < 0.05), and 56 and 60 hr (p < 0.01) based on pairwise Wilcoxon tests. (D) Growth of A. boonei and M. lauensis in coculture over time. Significant differences in cell abundance occur at 48, 52, and 64 hr (p < 0.05) based on pairwise Wilcoxon tests. Error bars are ±SEM for all panels.
Additional files
-
Supplementary file 1
Primers, field samples, and bacterial strains used in this study.
- https://doi.org/10.7554/eLife.04266.019
-
Supplementary file 2
Identity matrix of GH25 muramidases.
- https://doi.org/10.7554/eLife.04266.020
-
Supplementary file 3
Bordering gene BLAST results.
- https://doi.org/10.7554/eLife.04266.021
-
Supplementary file 4
Iterative HGT analysis BLAST results.
- https://doi.org/10.7554/eLife.04266.022
Download links
A two-part list of links to download the article, or parts of the article, in various formats.
Downloads (link to download the article as PDF)
Open citations (links to open the citations from this article in various online reference manager services)
Cite this article (links to download the citations from this article in formats compatible with various reference manager tools)
Antibacterial gene transfer across the tree of life
eLife 3:e04266.
https://doi.org/10.7554/eLife.04266


