A nap to recap or how reward regulates hippocampal-prefrontal memory networks during daytime sleep in humans
- University of Geneva, Switzerland
Figures
Figure 1 with 1 supplement
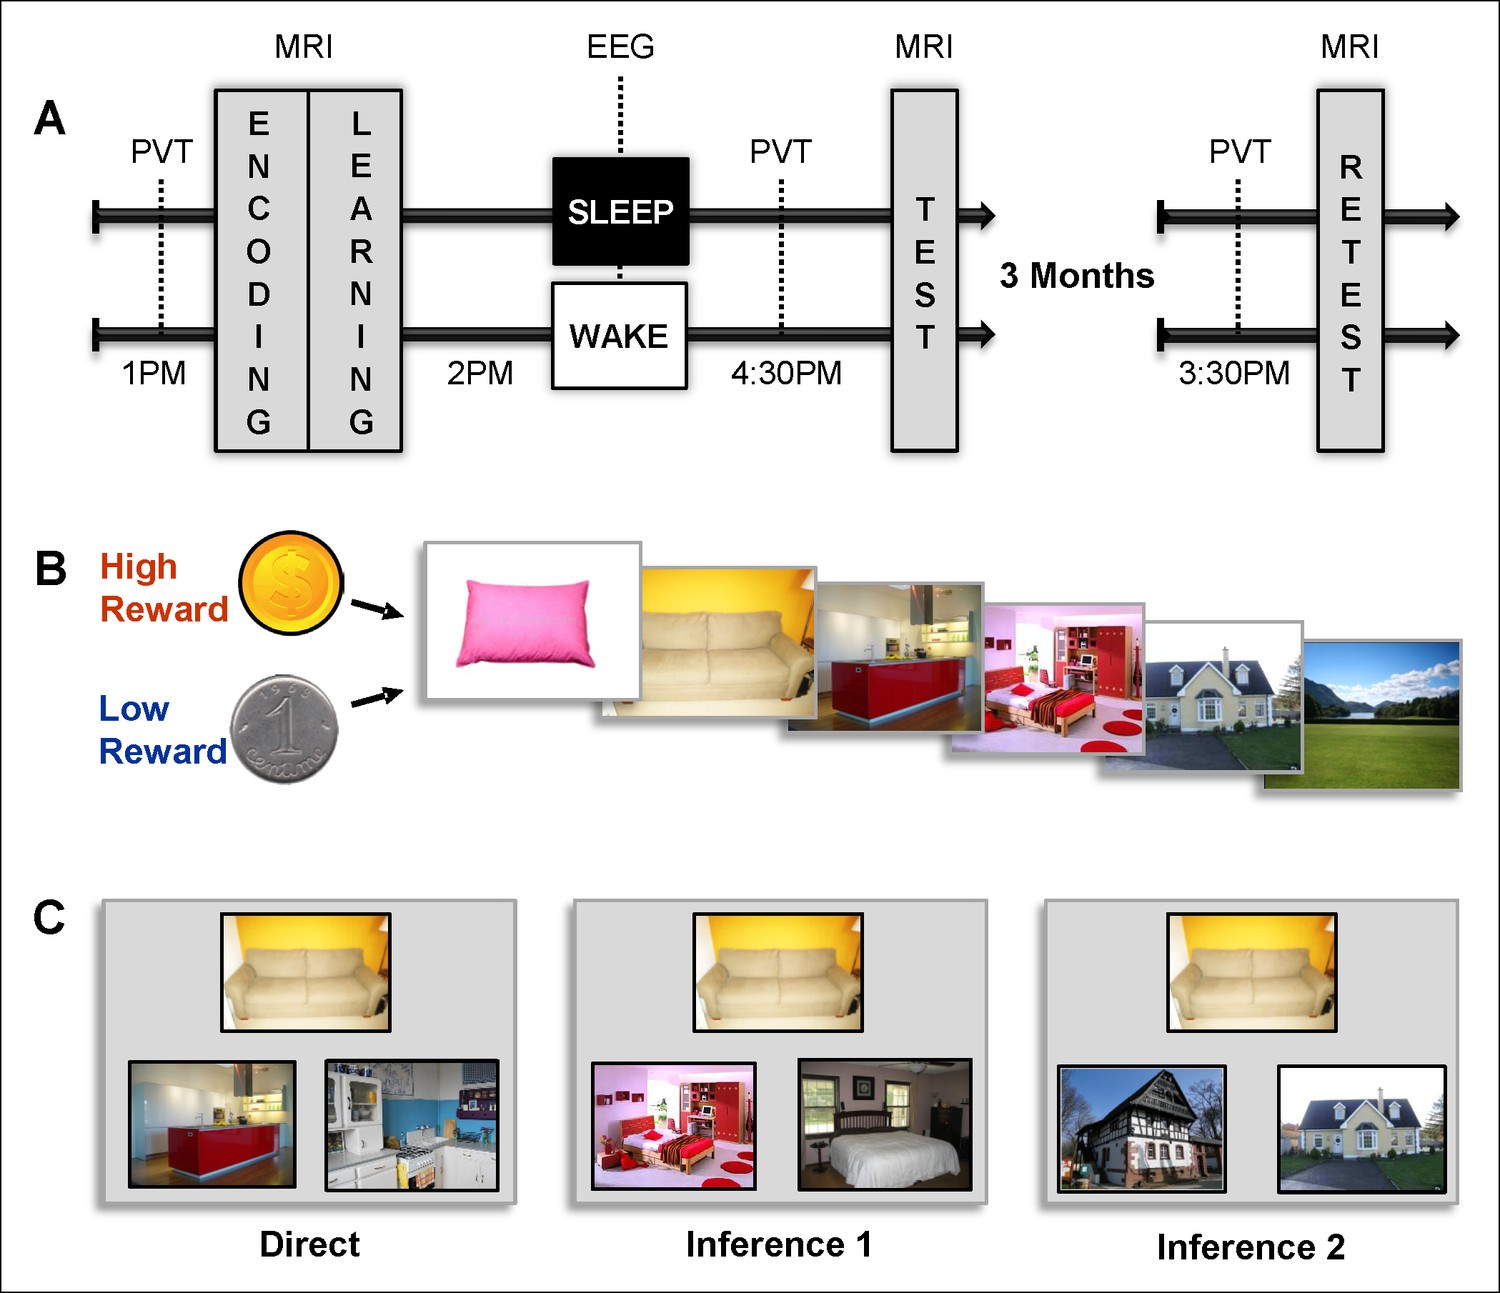
Experimental design.
(A) Overview of the experimental protocol for the Sleep group (upper line) and the Wake group (lower line), composed of three main MRI sessions, each preceded by PVT.Learning and test sessions were performed during one afternoon and separated by a nap (Sleep group) or rest (Wake group) interval monitored by EEG. The retest session occurred three months later. (B) Each series of pictures started by a high (dollar symbol) or low (cent symbol) reward cue and was composed of the following series of pictures: pillow, sofa, kitchen, bedroom, house, and landscape. (C) Examples of direct trials (left), inference of order 1 trials (middle) and inference of order 2 trials (right). Direct trials were used during the learning, test, and retest sessions, while inference 1 and 2 trials were only used during the test and retest sessions.
Figure 1—figure supplement 1
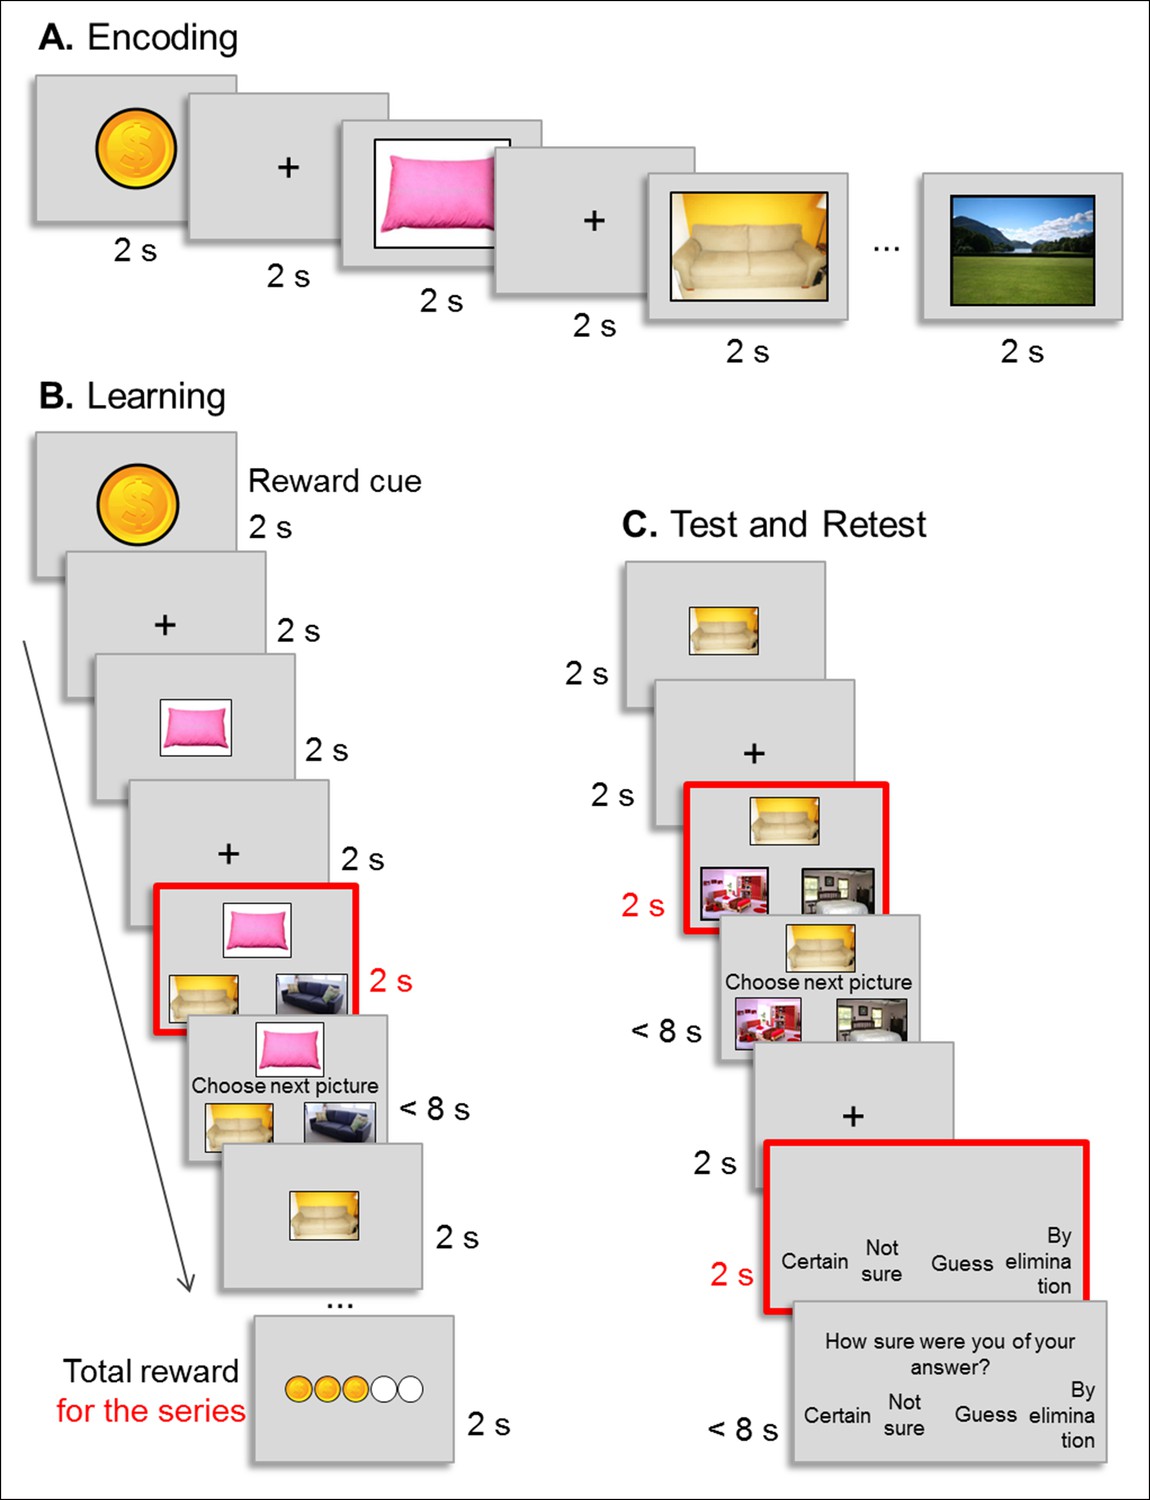
Experimental procedure.
(A) Encoding: example of the presentation of the successive pictures of a high reward outcome series. Each picture was presented for 2 s followed by a 2 s fixation cross. (B) Learning: example of the presentation of the successive pictures of a high reward outcome series yielding three good responses out of five. Each picture was presented for 2 s followed by a 2 s fixation cross and by the choice screen (red). For 2 s participants could not answer, they just examined the choice screen before the question screen (‘choose the next picture’) appeared, prompting them to press the left or right button on the button box. Participants had a maximum of 8 s to answer before the next picture appeared. We used the choice screen (red) as onset times for all reported fMRI analyses to minimize motion-related artifacts. (C) Test and retest: example of an inference of order 1 trial. The picture was presented for 2 s followed by a 2 s fixation cross and by the 2 s choice screen (red). Participants answered after the ‘choose the next picture’ sentence appeared on the screen. Then, a confidence choice screen was displayed for 2 s, during which participants were invited to think about how they answered the trial. After the ‘how did you answer the trial’ sentence appeared on the screen, participants selected one of the four response options proposed by pressing the corresponding button on the button box. For all choices, participants had a maximum of 8 s to answer.
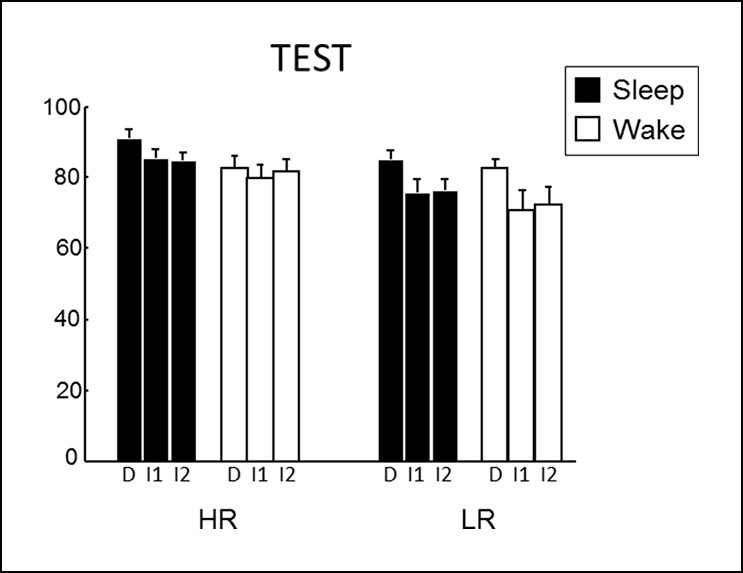
Figure 2 with 2 supplements
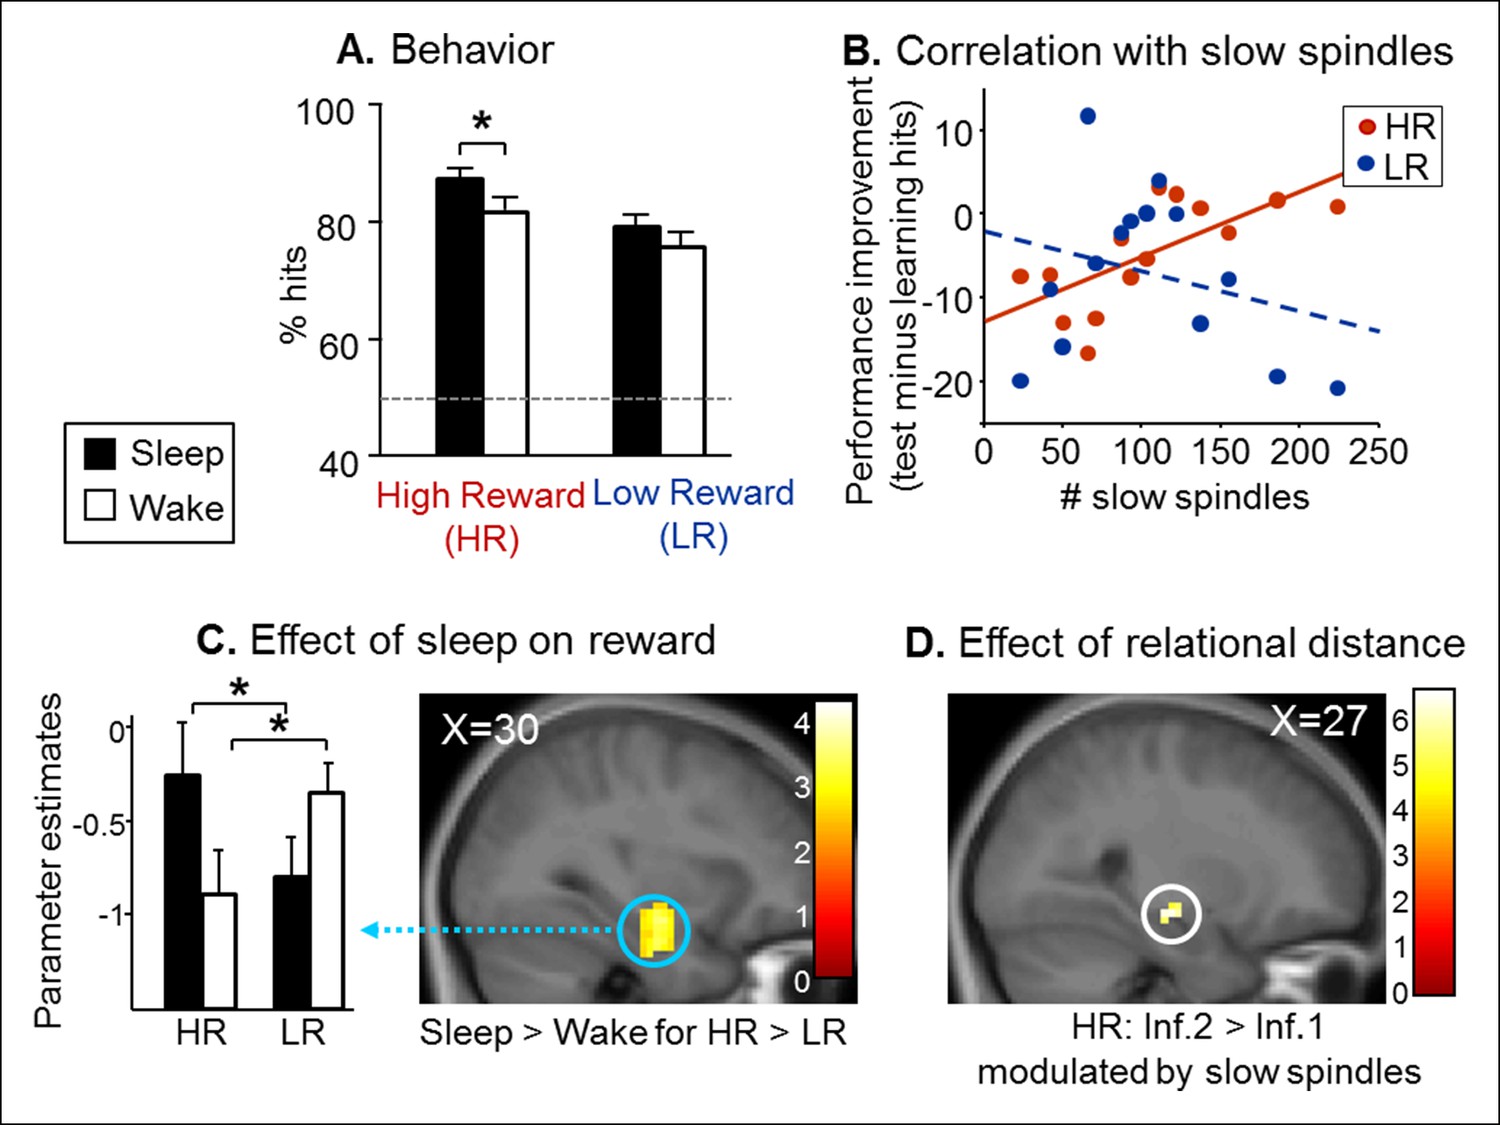
Test results.
(A) Better performance for the Sleep group than the Wake group and also for High than Low reward trials. (B) Memory improvement for HR series correlated with the number of slow spindles. (C) Increased right hippocampal activity for HR than LR for the Sleep compared to the Wake group. (D) Increased right hippocampal response for HR inference of order 2 compared to inferences of order 1 correlated with the number of slow spindles for the Sleep group. All activation maps are displayed on the mean T1 anatomical scan of the whole population. For display purposes, hippocampal activations are thresholded at p<0.005.
Figure 2—figure supplement 1
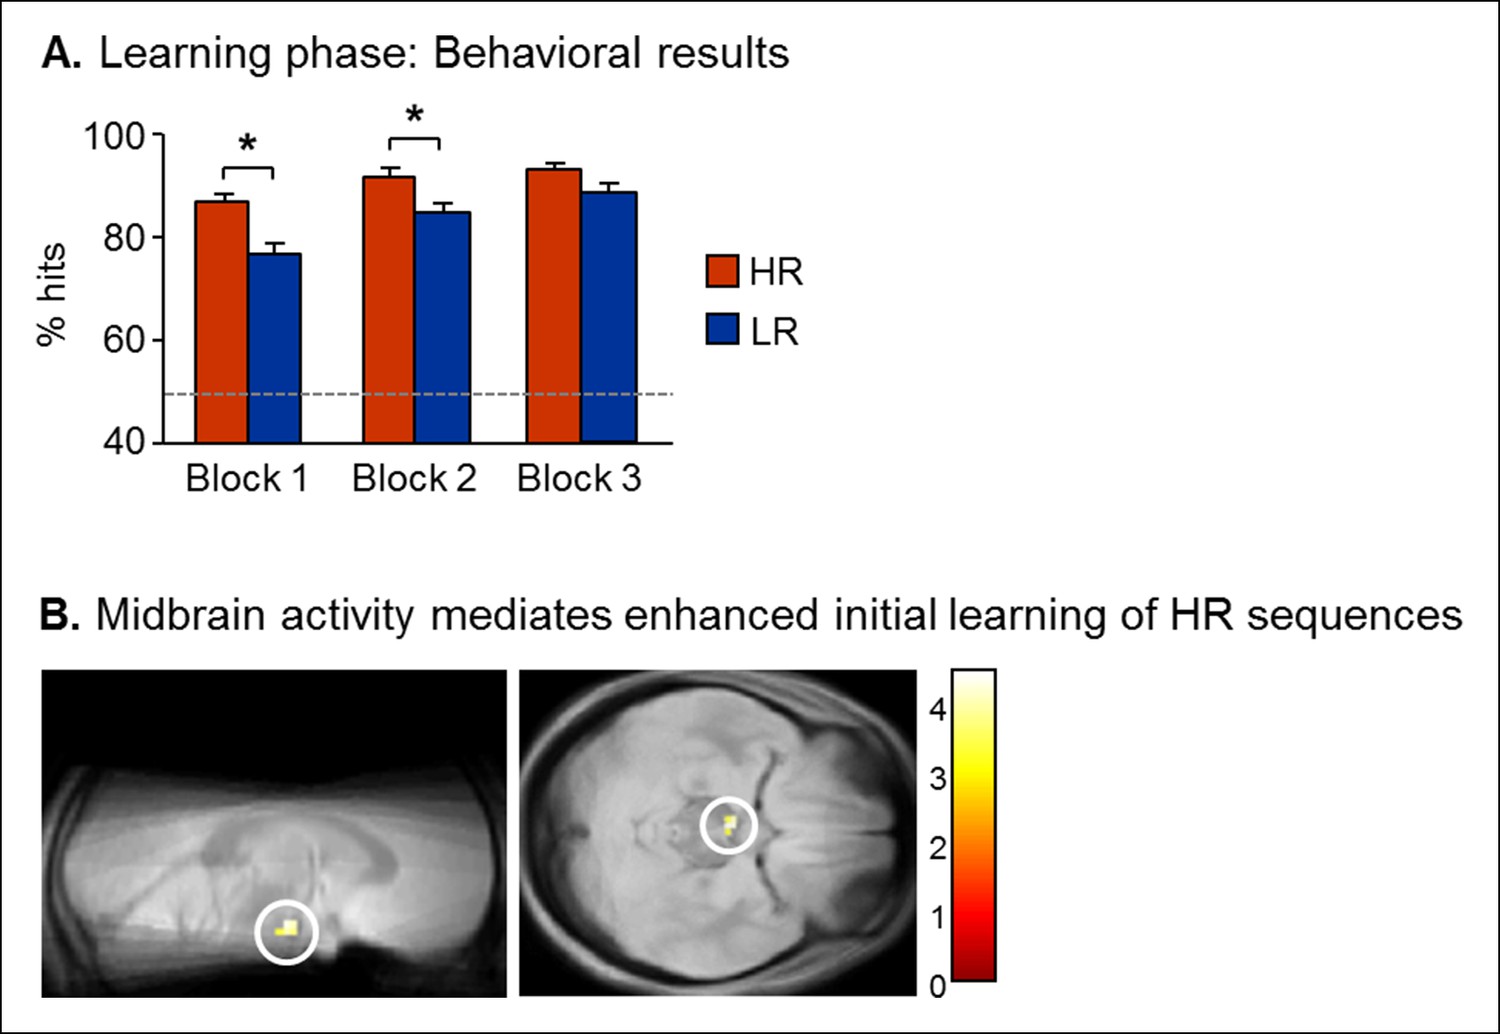
Learning results.
(A) Performance increased along the three blocks, better results for HR than for LR trials in Block 1 and 2, but not 3, leading to same baseline for future consolidation. (B) Midbrain activity mediated reward-related learning enhancement. Activity in a midbrain region compatible with the VTA (-3x, -13y, -20z) showed a selective increase for HR versus LR trials, correlating with individual increase in performance between HR and LR trials. Activation map displayed on the mean proton-density weighted scan computed over the whole population.
Figure 2—figure supplement 2
Behavioral results at test.
https://doi.org/10.7554/eLife.07903.007
Figure 3 with 1 supplement
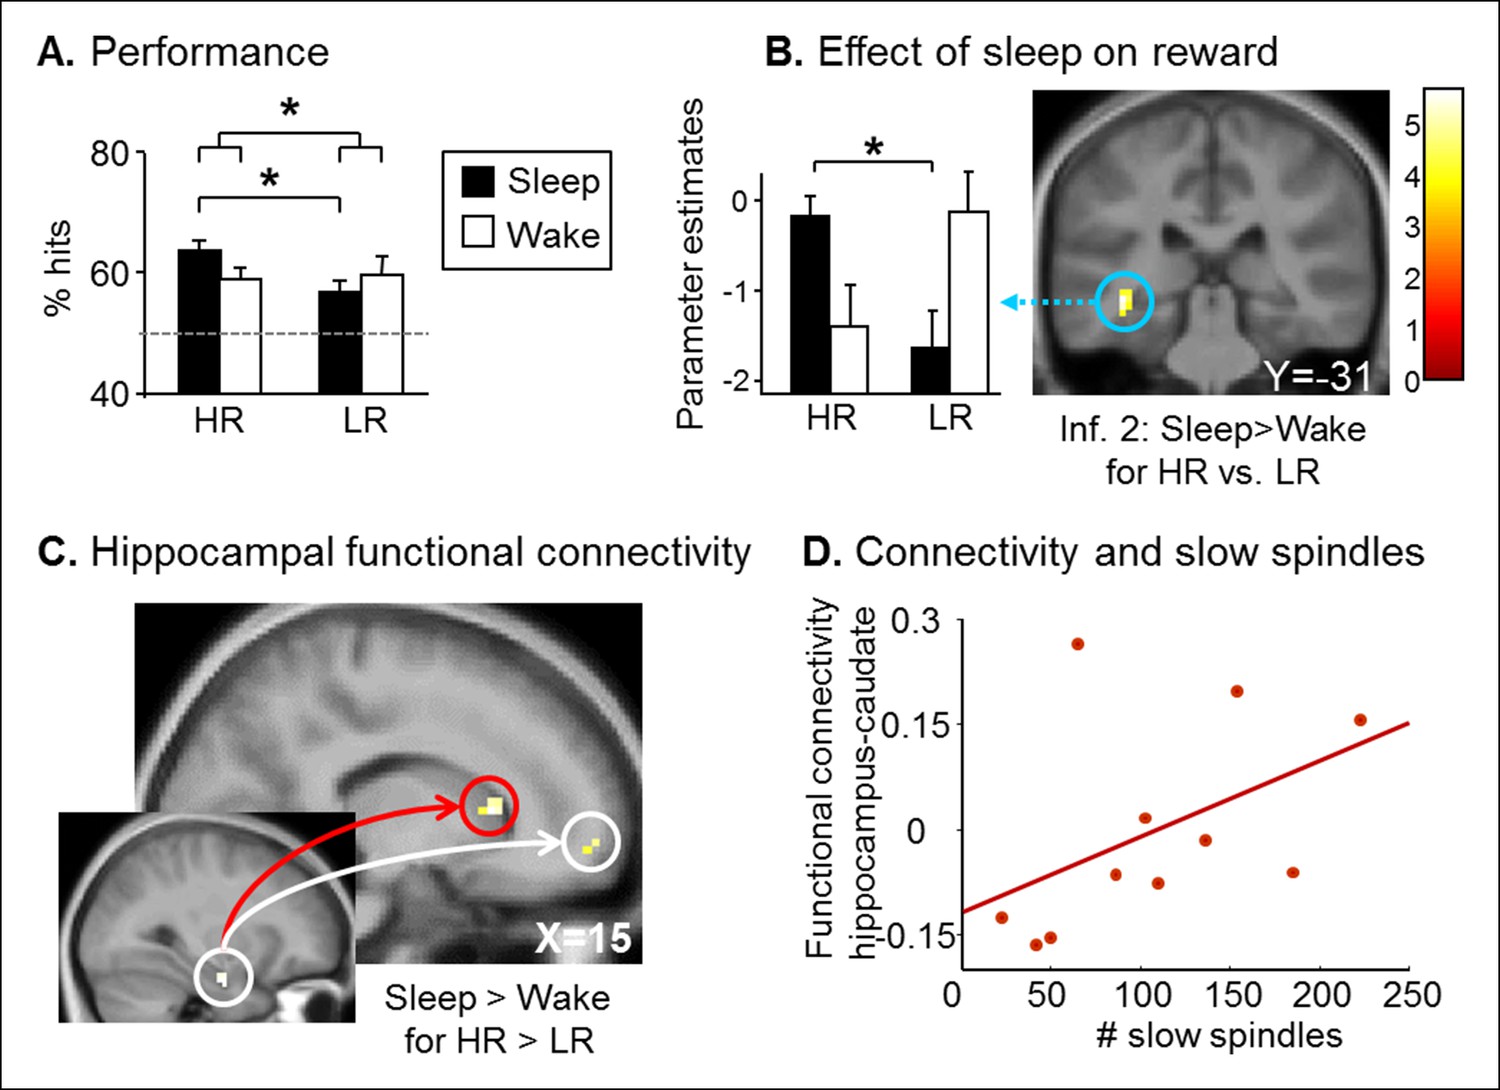
Retest results.
(A) The Sleep group performed better for HR trials than for LR trials. (B) Increased left hippocampus activity during the retest session for HR vs. LR for the Sleep compared to the Wake group, selectively during inference 2 trials. (C) PPI for the retest session, using the seed in the right hippocampus from Figure 2C. Increased functional coupling with the caudate nucleus and the medial prefrontal cortex during HR vs. LR trials, selectively for the Sleep group compared to the Wake group. (D) Beta values of the PPI around the caudate nucleus peak correlated with the number of slow sleep spindles. Activation map displayed on the mean T1 anatomical scan of the population. For display purposes, hippocampal activations are thresholded at p<0.005.
Figure 3—figure supplement 1
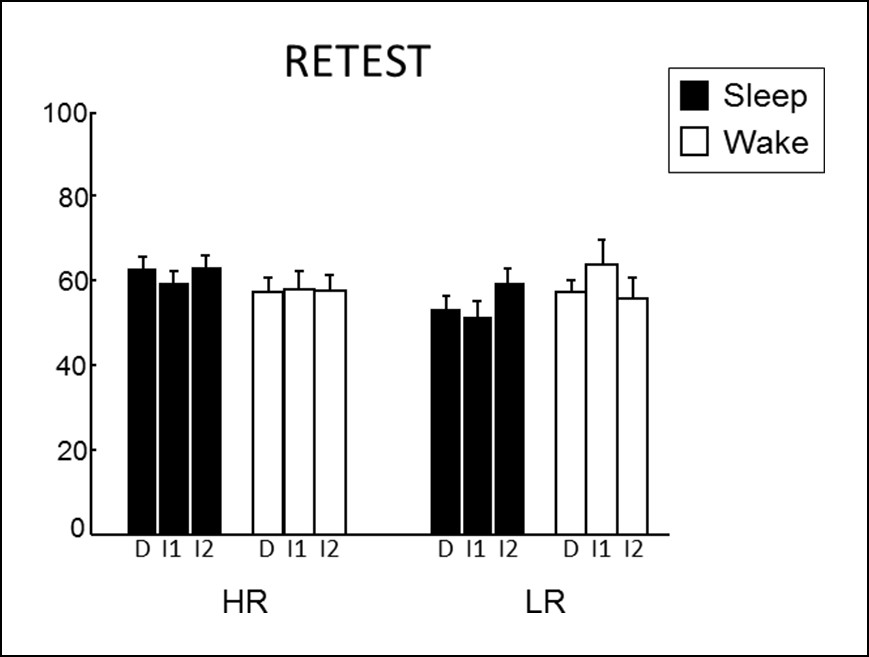
Detailed retest behavioral results.
https://doi.org/10.7554/eLife.07903.009
Figure 4
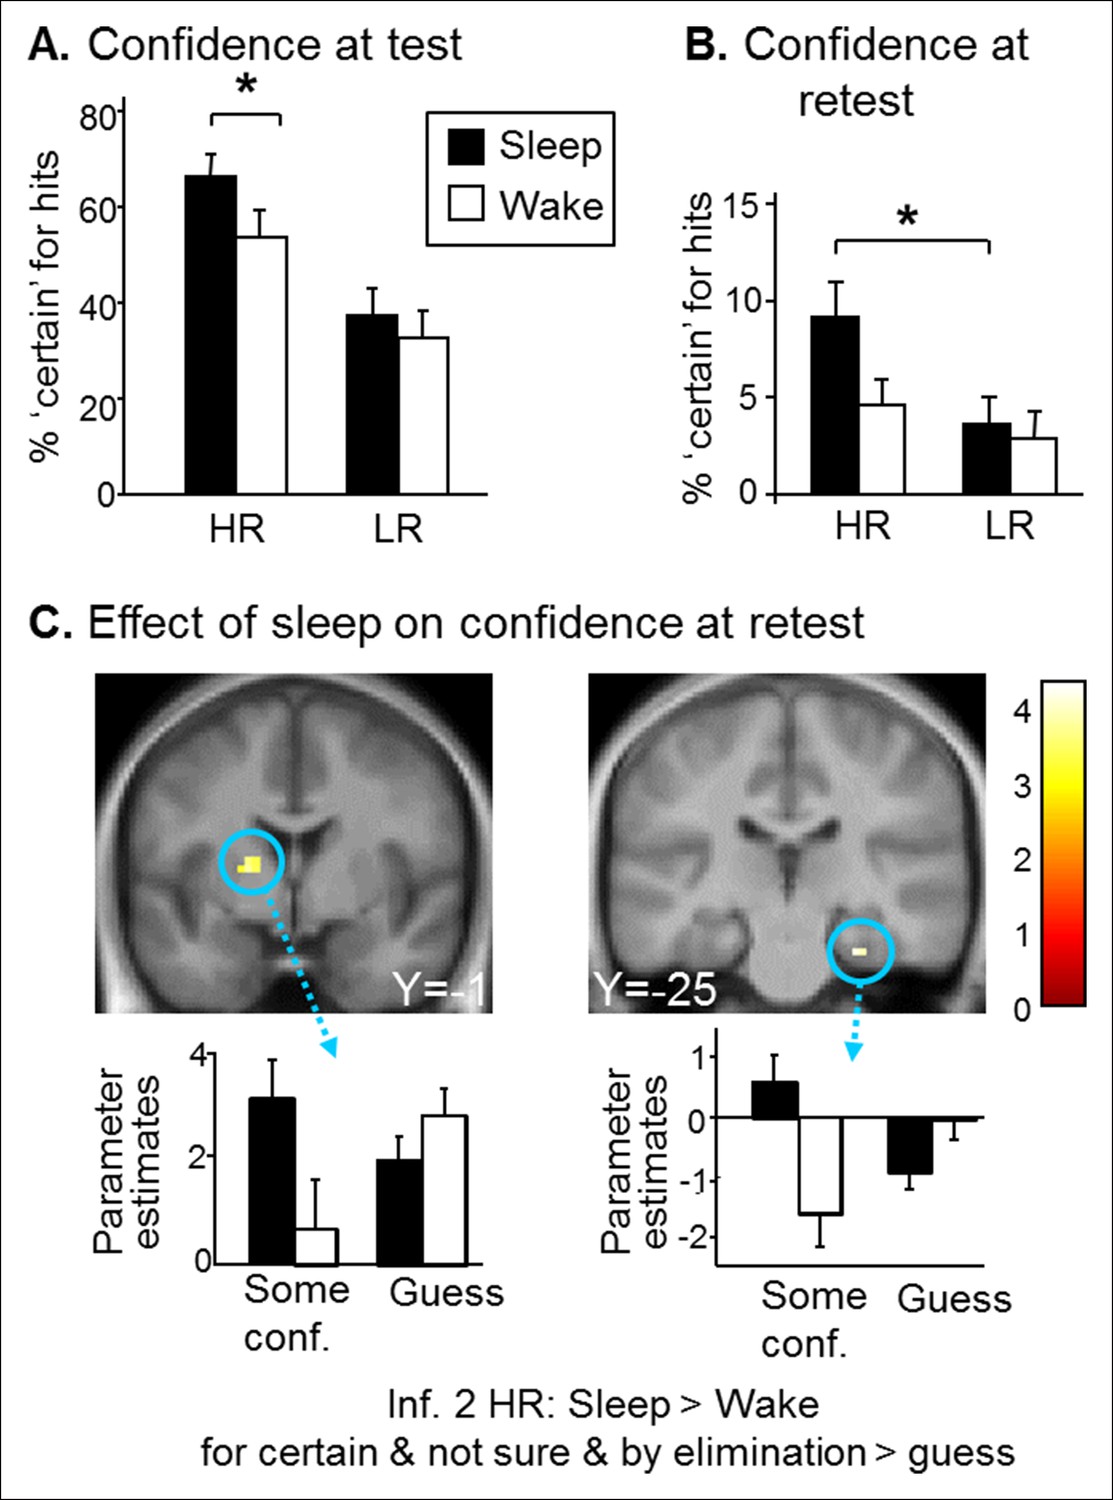
Confidence results.
(A) Higher confidence on hits for the Sleep group than the Wake group and for HR vs. LR trials during the test session. (B) Higher confidence on HR vs. LR hits for the Sleep group during the retest session. (C) Greater activation of the left caudate and right hippocampus for the ‘certain & by elimination & not sure’ vs ‘guess’ confidence judgments for inference 2 HR trials in the Sleep compared to the Wake group during the retest session. Activation map displayed on the mean T1 anatomical scan of the population.
Tables
Table 1
Reaction times (mean ± SEM) for the test phase.
| HR | LR | ||||||
|---|---|---|---|---|---|---|---|
| Direct | Inference 1 | Inference 2 | Direct | Inference 1 | Inference 2 | ||
| Sleep | Mean | 939.83 ± 19.16 | 1144.29 ± 21.51 | 1167.24 ± 22.35 | 1207.46 ± 21.36 | 1434.43 ± 22.69 | 1318.69 ± 22.61 |
| Median | 752.07 ± 18.59 | 1006.20 ± 21.39 | 1024.83 ± 21.86 | 1066.83 ± 20.12 | 1385.43 ± 23.82 | 1132.13 ± 22.21 | |
| Wake | Mean | 1164.14 ± 19.18 | 1353 ± 27.81 | 1405.74 ± 21.91 | 1220.55 ± 20.87 | 1305.55 ± 21.74 | 1290.21 ± 26.50 |
| Median | 994.17 ± 20.83 | 1226.83 ± 29.18 | 1261.27 ± 22.99 | 1067.90 ± 21.86 | 1197.50 ± 23.13 | 1231.40 ± 27.78 | |
Table 2
Psychomotor vigilance task results (mean ± SEM).
| PVT 1 | PVT 2 Sleep group | PVT 2 Wake group | PVT 3 | |
|---|---|---|---|---|
| Mean RT | 264.92 ± 4.42 | 263.29 ± 4.45 | 256.44 ± 4.74 | 267.67 ± 4.37 |
| Median RT | 255.02 ±3.95 | 250.81 ± 3.64 | 249.38 ± 4.30 | 258.12 ± 4.21 |
| False alarms | 0.42 ± 0.95 | 0.55 ± 0.94 | 1.15 ± 1.41 | 0.4 ± 0.89 |
| Lapses | 0.42 ± 0.8 | 0.72 ± 1.02 | 0.38 ± 0.70 | 0.4 ± 0.7 |
| Mean RT fastest 10% | 215 ± 3.59 | 204.93 ± 4.48 | 208.69 ± 4.80 | 213.50 ± 4.63 |
Table 3
Number of correct responses during the three learning blocks (mean ± SEM). Only pairs that were selected correctly 2 or 3 times were considered learnt.
| HR (20 direct pairs) | LR (20 direct pairs) | |
|---|---|---|
| 3 correct | 15.60 ± 0.48 | 12.93 ± 0.55 |
| 2 correct | 3.37 ± 0.39 | 5.00 ± 0.45 |
| 1 correct | 0.83 ± 0.17 | 1.57 ± 0.29 |
| 0 correct | 0.20 ± 0.09 | 0.50 ± 0.14 |
Table 4
Reaction times (mean ± SEM) for the certain answers of the test phase.
HR | LR | ||||||
|---|---|---|---|---|---|---|---|
Direct | Inference 1 | Inference 2 | Direct | Inference 1 | Inference 2 | ||
Sleep | Mean | 727.98 ± 18.52 | 876.96 ± 19.29 | 882.20 ± 20.68 | 609.91 ± 21.69 | 952.90 ± 21.21 | 721.28 ± 23.30 |
| Median | 665.43 ± 17.20 | 792.3 ± 18.77 | 770.67 ± 19.71 | 553.5 ± 21.06 | 861.167 ± 21.05 | 682.93 ± 22.71 | |
Wake | Mean | 844.88 ± 18.21 | 1064.95 ± 24.45 | 1095.13 ± 27.81 | 686.73 ± 24.63 | 881.59 ± 21.59 | 767.54 ± 22.88 |
| Median | 743.23 ± 18.11 | 1086.60 ± 28.67 | 1068.27 ± 27.28 | 637.33 ± 23.90 | 712.17 ± 20.62 | 651.80 ± 22.05 | |
Additional files
-
Supplementary file 1
Characteristics of the nap period for participants in the Sleep group.
- https://doi.org/10.7554/eLife.07903.015
-
Supplementary file 2
Whole brain activation table for all reported results.
- https://doi.org/10.7554/eLife.07903.016
Download links
A two-part list of links to download the article, or parts of the article, in various formats.
Downloads (link to download the article as PDF)
Open citations (links to open the citations from this article in various online reference manager services)
Cite this article (links to download the citations from this article in formats compatible with various reference manager tools)
A nap to recap or how reward regulates hippocampal-prefrontal memory networks during daytime sleep in humans
eLife 4:e07903.
https://doi.org/10.7554/eLife.07903


