Network structure of brain atrophy in de novo Parkinson's disease
- McGill University, Canada
- CHU Clermont-Ferrand, France
Figures
Figure 1 with 4 supplements
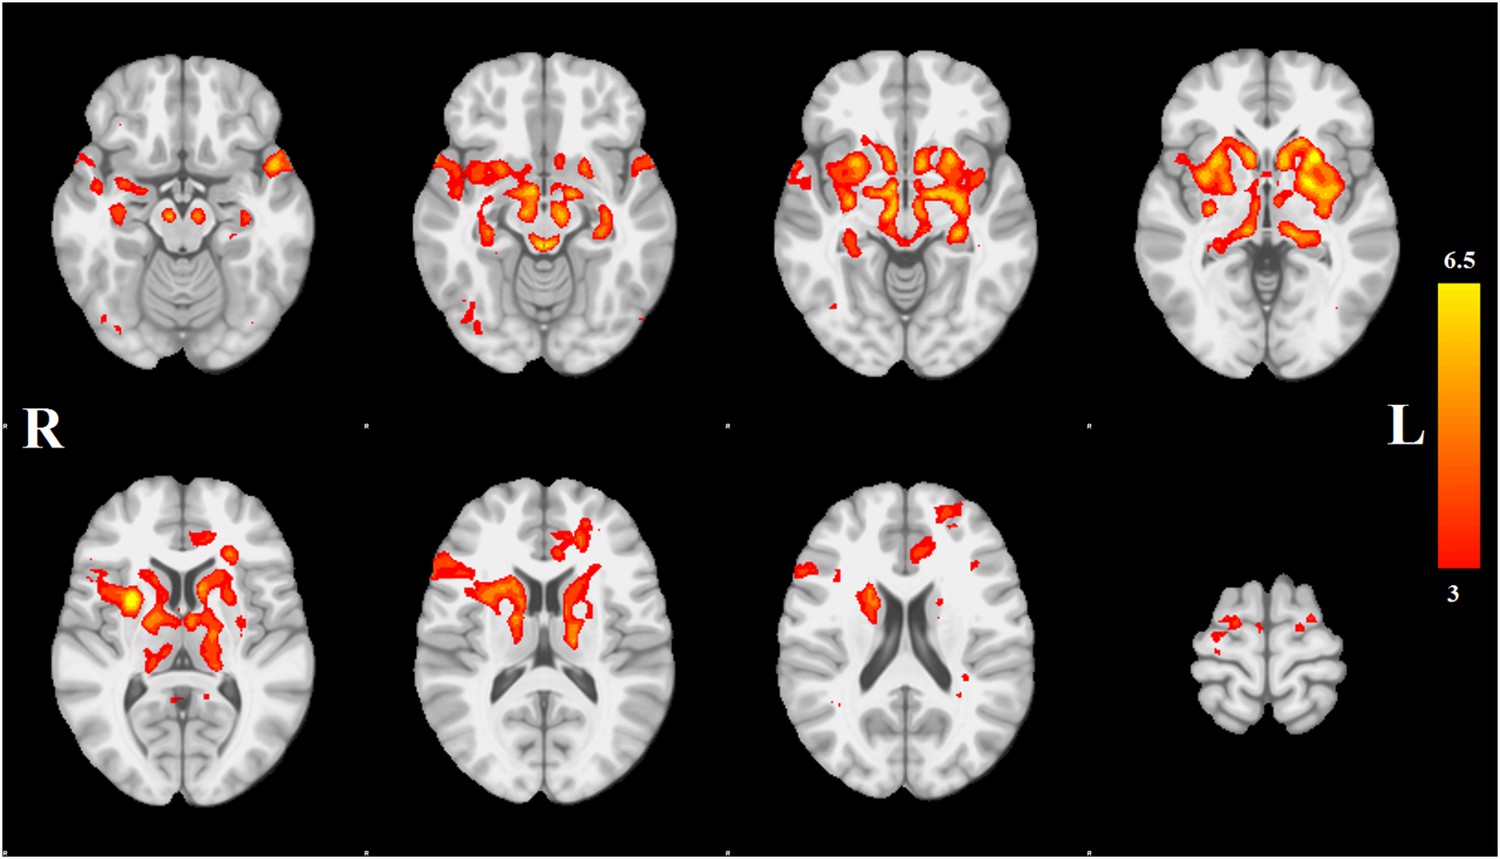
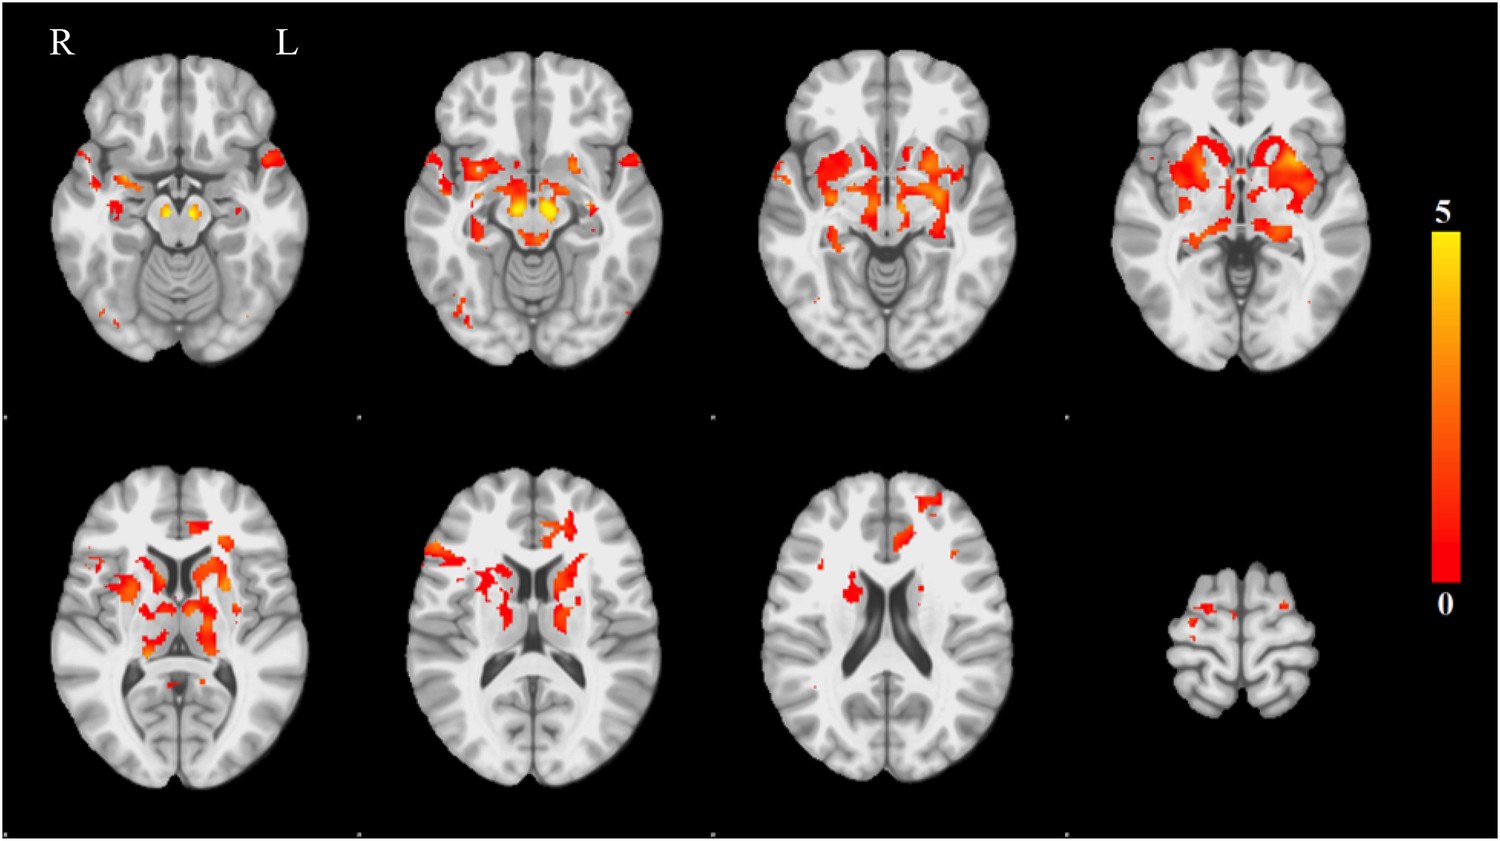
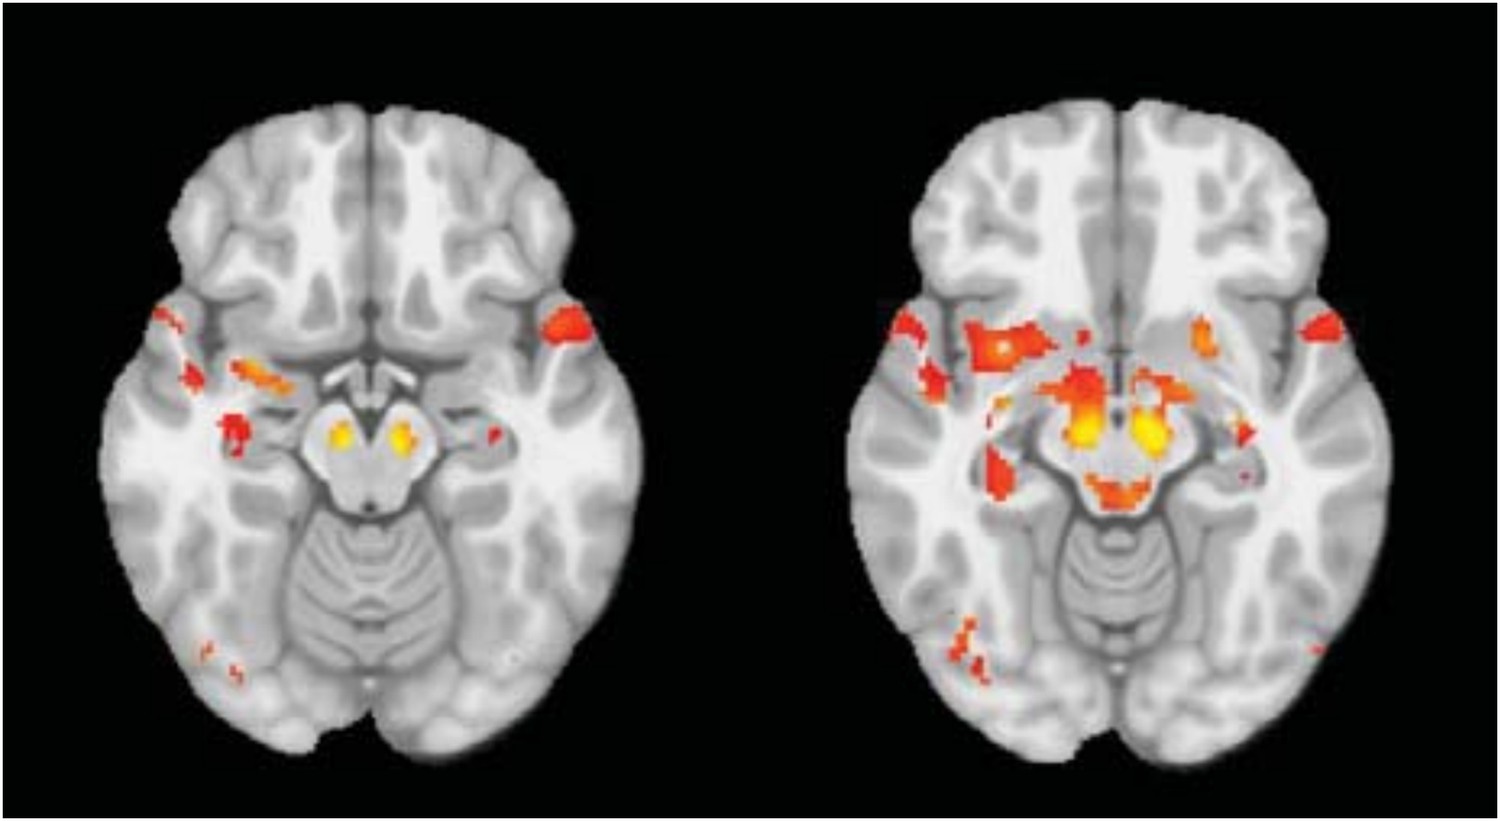
Distribution of atrophy in Parkinson's disease.
This image displays the only one of the 30 independent component analysis (ICA) networks showing a significant difference between Parkinson's disease (PD) and Controls (p = 0.003 after correction for multiple comparison). The ICA spatial map was converted to a z-statistic image via a normalized mixture–model fit and then thresholded at z = 3. Selected sections in Montreal Neurological Institute (MNI) space at coordinates z = −16, z = −12, z = −7, z = −2, z = 8, z = 14, z = 20, z = 70. See Tables 1, 2 for anatomical localization. Note that the value at each voxel is the z-score of the ICA component, not the group difference.
Figure 1—figure supplement 1
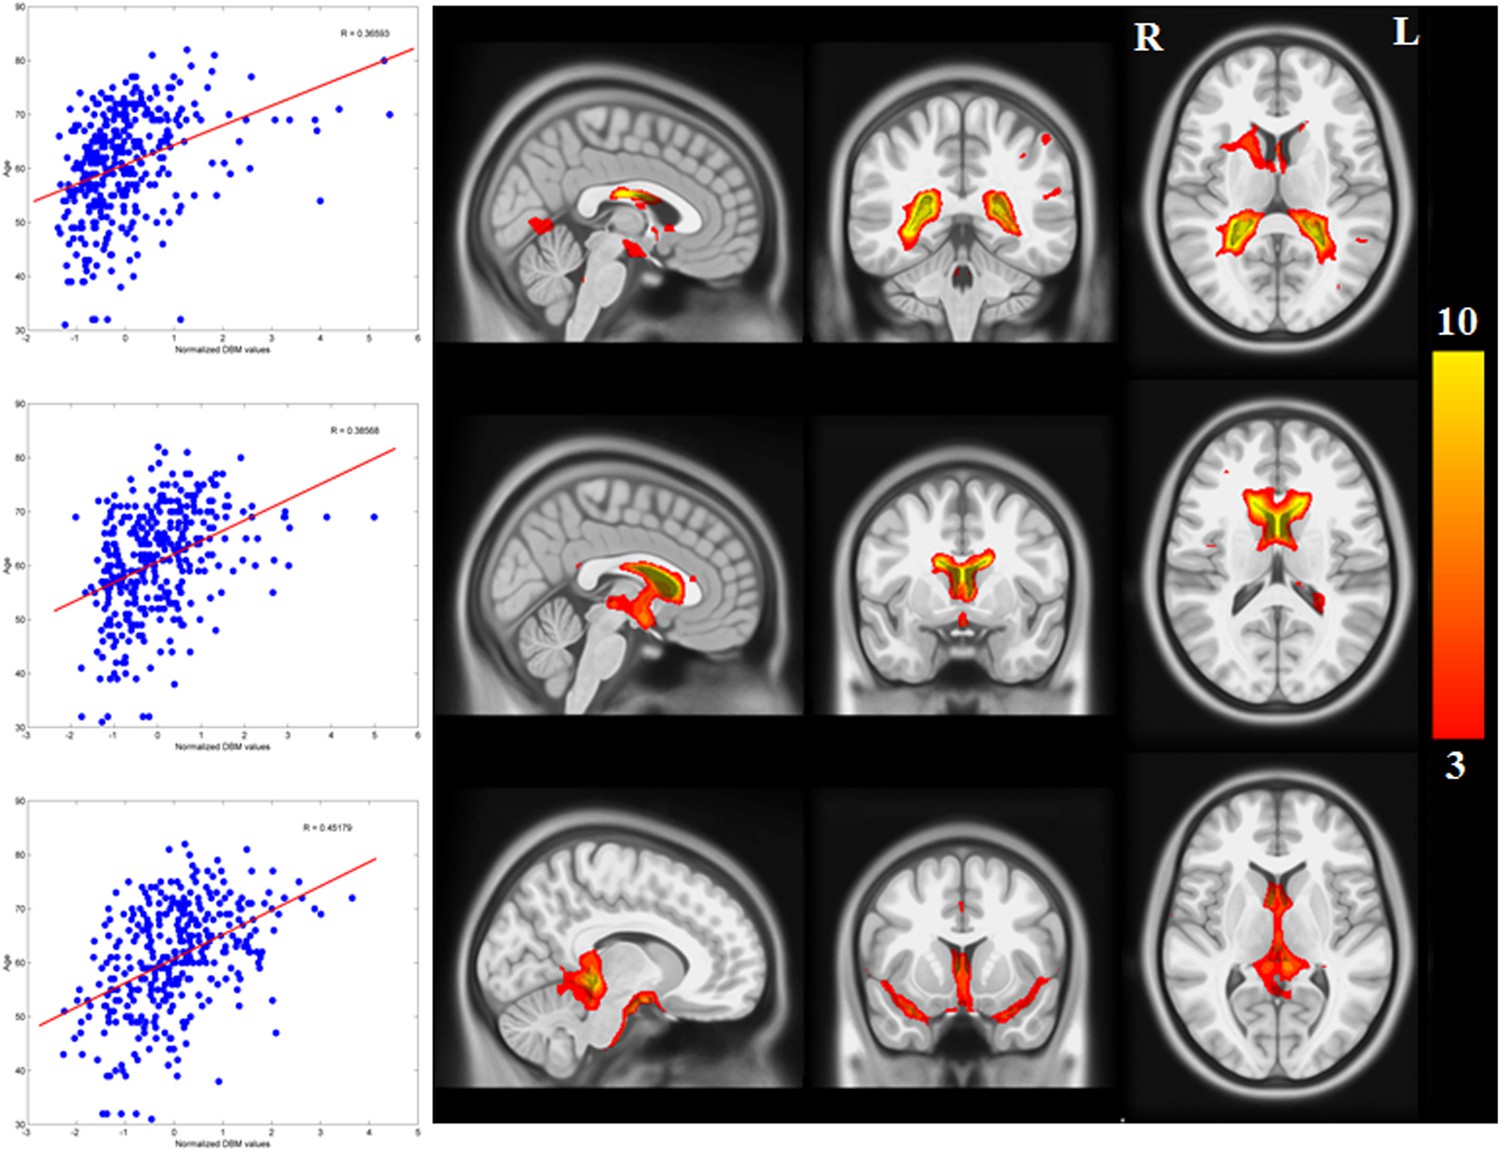
Networks with positive correlation between average deformation and age.
The average deformation for each subject in all 30 ICA networks was correlated with age. 10 networks showed a significant correlation after Bonferroni correction. The three components depicted here show a significant positive effect of age (expansion). They represent cerebrospinal fluid spaces.
Figure 1—figure supplement 2
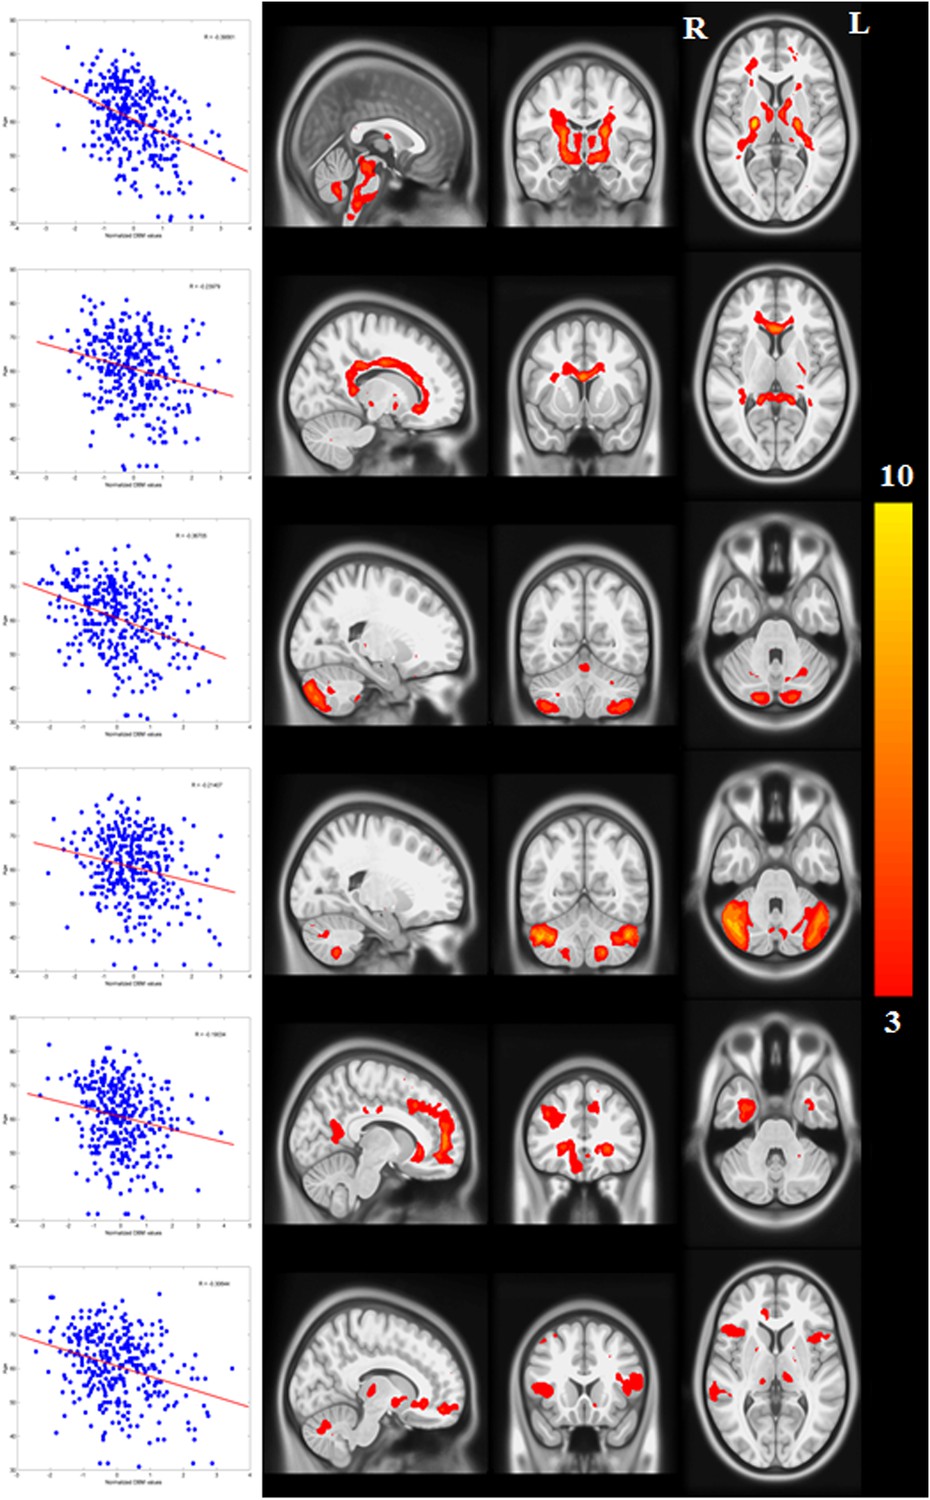
Networks with negative correlation between average deformation and age.
(The PD-ICA network is not shown here, but it also displays a correlation with age.)
Figure 1—figure supplement 3
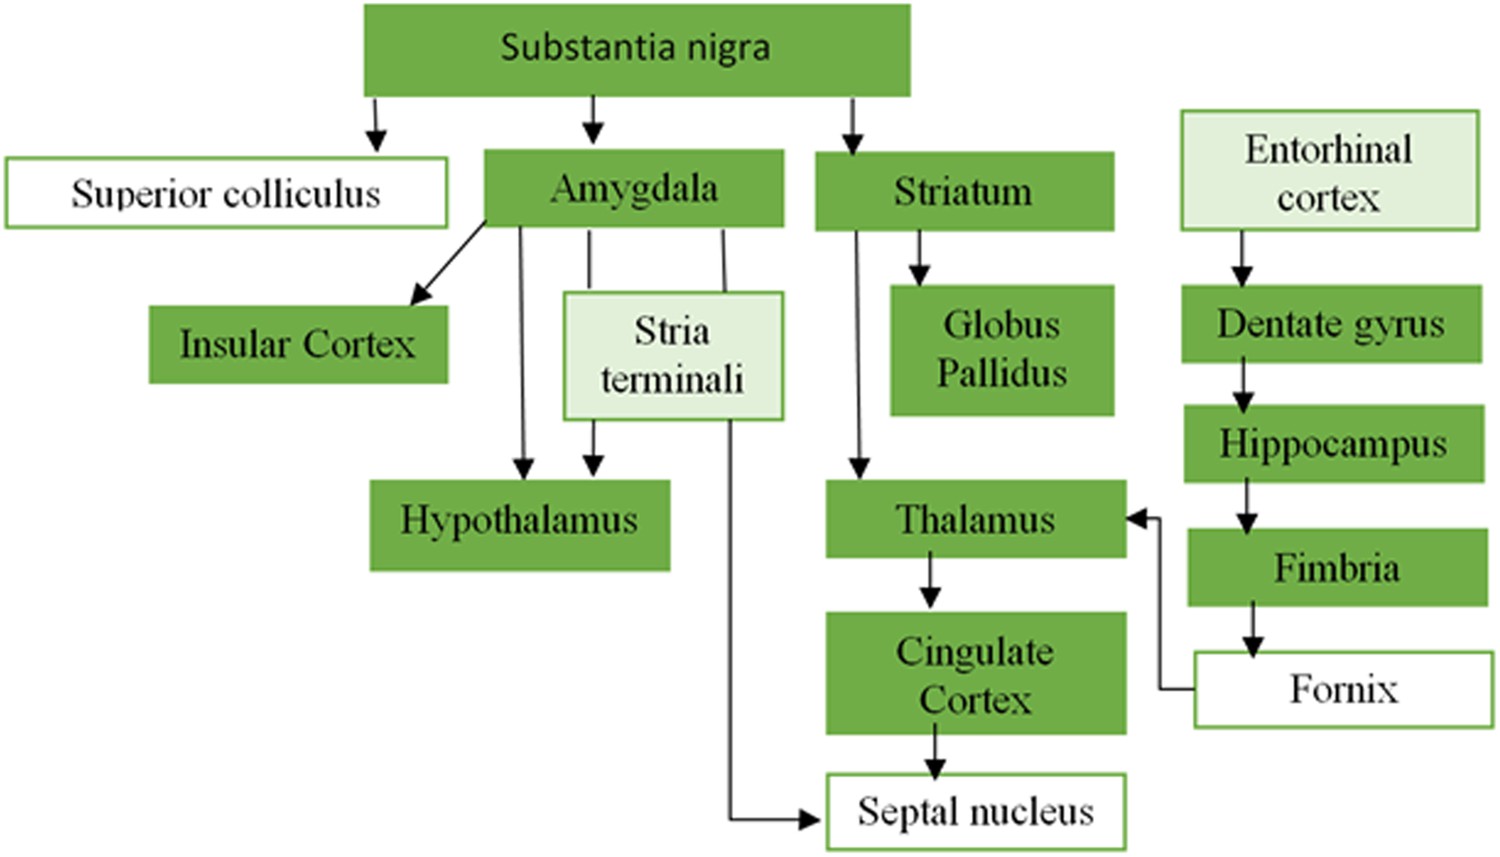
Overlapping areas between the PD-ICA network obtained from the PPMI data set and regions from Masuda-Suzukake et al. (2013).
Plot of the regions from Masuda-Suzukake et al. (2013) that demonstrated synucleinopathy after injection of pathogenic synuclein fibrils in the substantia nigra, and their anatomical connectivity. The dark green regions were present in the PD-ICA network in the current analysis after thresholding with z > 3. Entorhinal cortex and stria terminali depicted with light green were marginally outside the map 2.7 < z < 3.
Figure 1—figure supplement 4
Voxel-wise difference in atrophy between PD and controls.
This map displays the univariate z-score of the group difference in atrophy at each voxel within the PD-ICA.
Figure 2
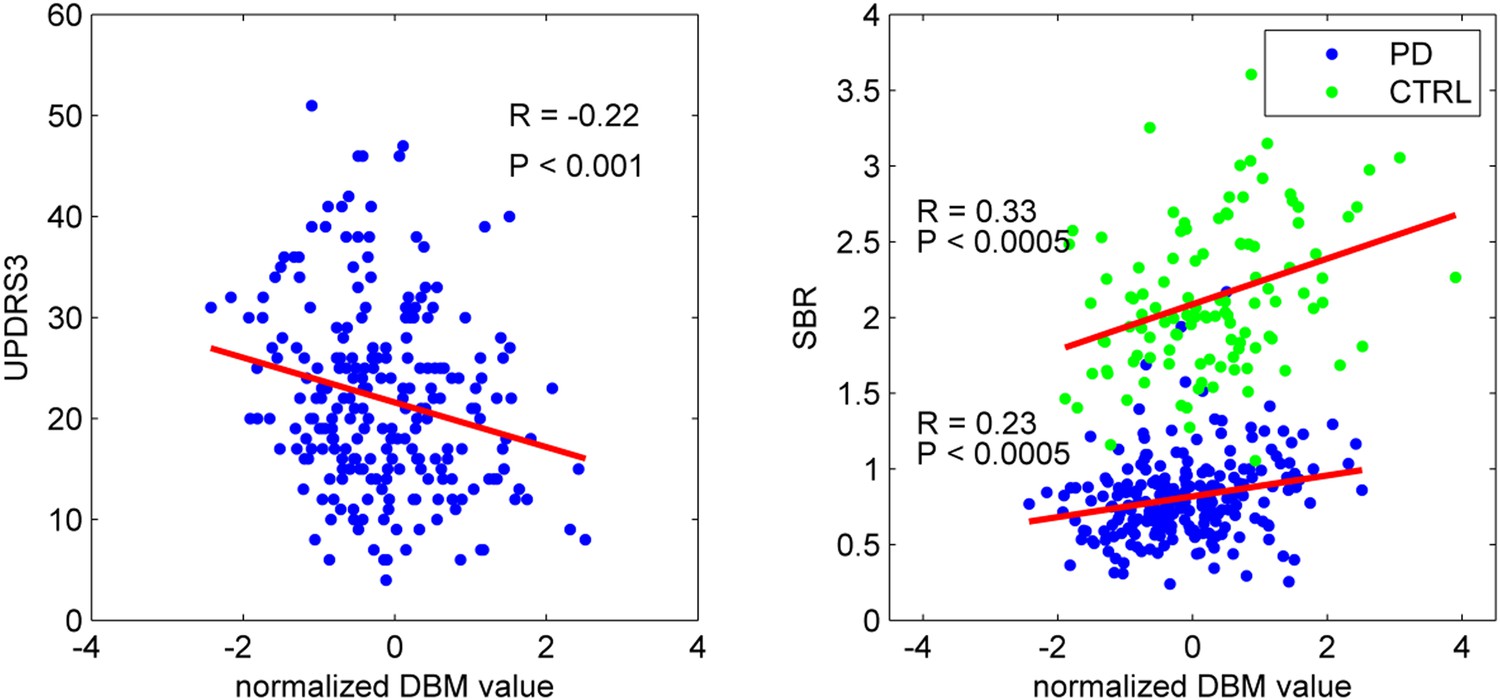
PD-ICA network, dopamine denervation, and severity of disease.
Left: Unified Parkinson's Disease Rating Scale (UPDRS) part III (a measure of motor function and disease severity—higher value means more severe disease) was significantly correlated with the degree of atrophy in the network (r = −0.22, p < 0.001). Right: plot of [123I]FP-CIT striatum binding ratio (SBR) vs deformation value in the PD-ICA (Figure 1). Correlation: r = 0.23, p < 0.0005 for PD patients, and r = 0.33, p < 0.0005 for age-matched controls.
Figure 3 with 3 supplements
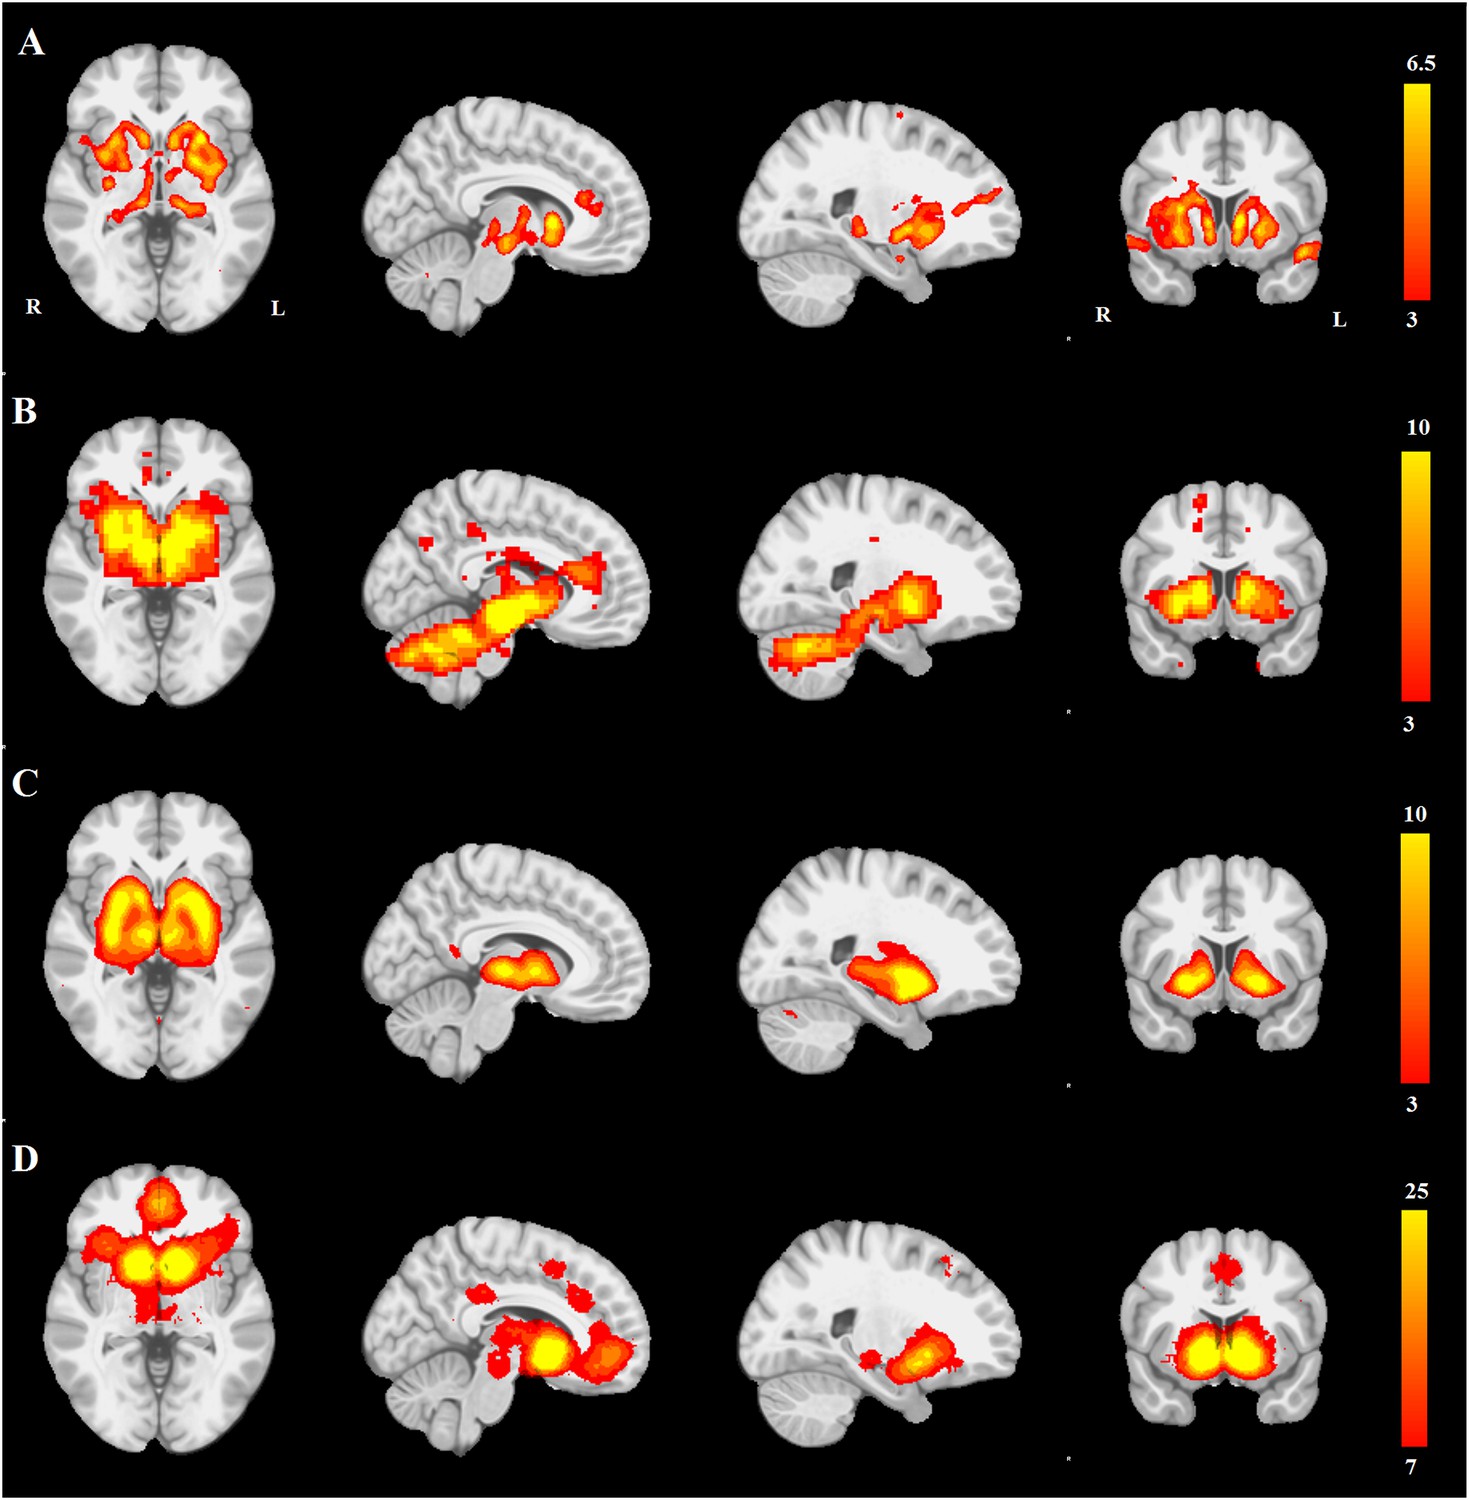
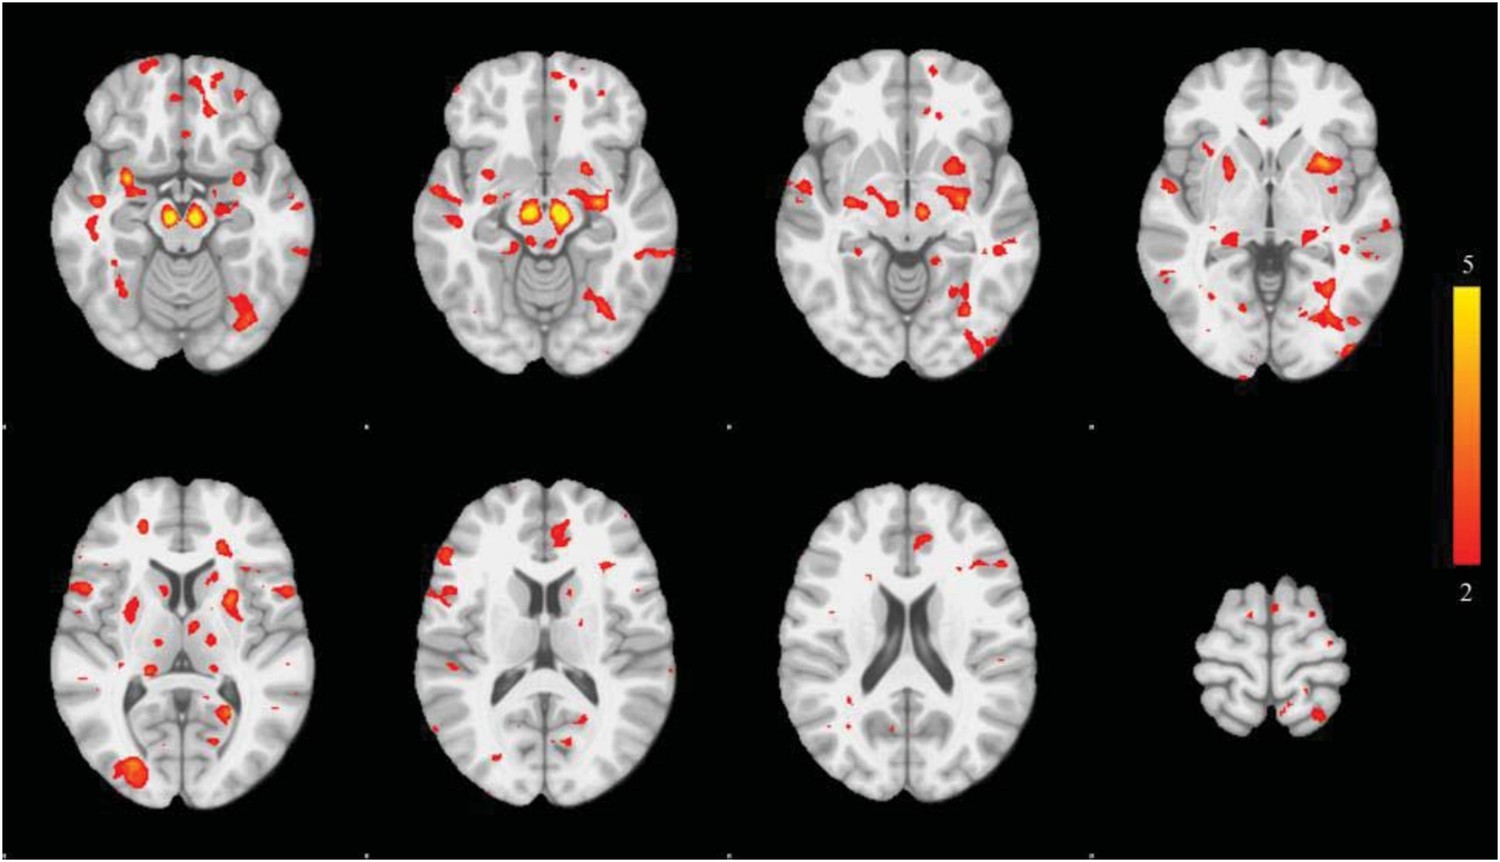
PD atrophy resembles normal intrinsic connectivity networks.
Selected sections for (A) PD-ICA network from the Parkinson's Progression Markers Initiative (PPMI) data set thresholded at z = 3. (B) Seed-based resting-state functional MRI (fMRI) connectivity with substantia nigra as a priori seed. (C) Intrinsic connectivity network (ICN) correlated with PD-ICA from Smith et al. (2009). (D) Regions responding to stimulus value during fMRI (meta-analysis of Bartra et al., 2013) (Selected slices in MNI space z = −2, x = −8, x = −23, y = 10.)
Figure 3—figure supplement 1
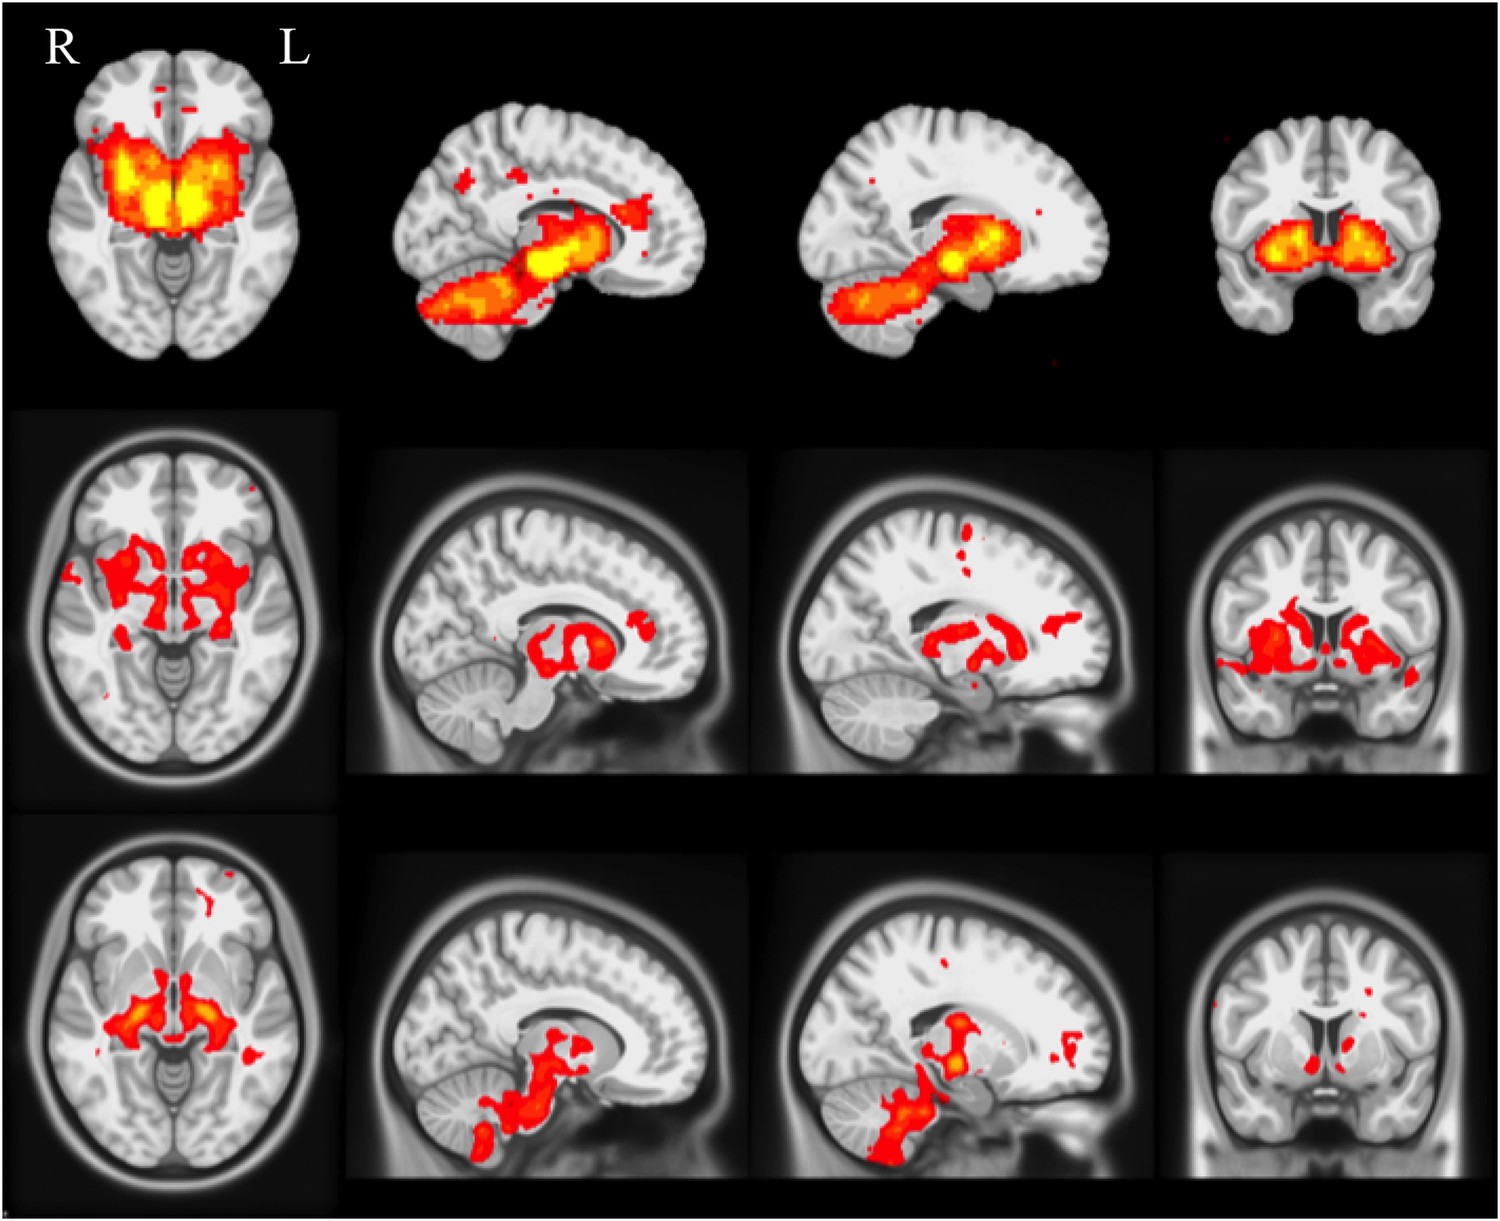
Selected slices for seed-based resting-state fMRI analysis results with SN as a priori seed (top), PD-ICA network from the PPMI data set (middle), ICA network consisting of white matter areas in basal ganglia and cerebellum (bottom).
(Selected slices in MNI space z = −2, x = −8, x = −23, y = 10).
Figure 3—figure supplement 2

The correlation between the PD-ICA network and the 70 ICNs from Smith et al. (2009) is displayed in red.
The highest correlation ICN is depicted in Figure 3A. We generated random ICNs by reassigning the voxel coordinates of each of the 70 ICNs and measured the spatial correlation of each permutated ICN with the PD-ICA network. This was repeated 1000 times to generate a mean correlation and confidence interval, depicted in blue.
Figure 3—figure supplement 3
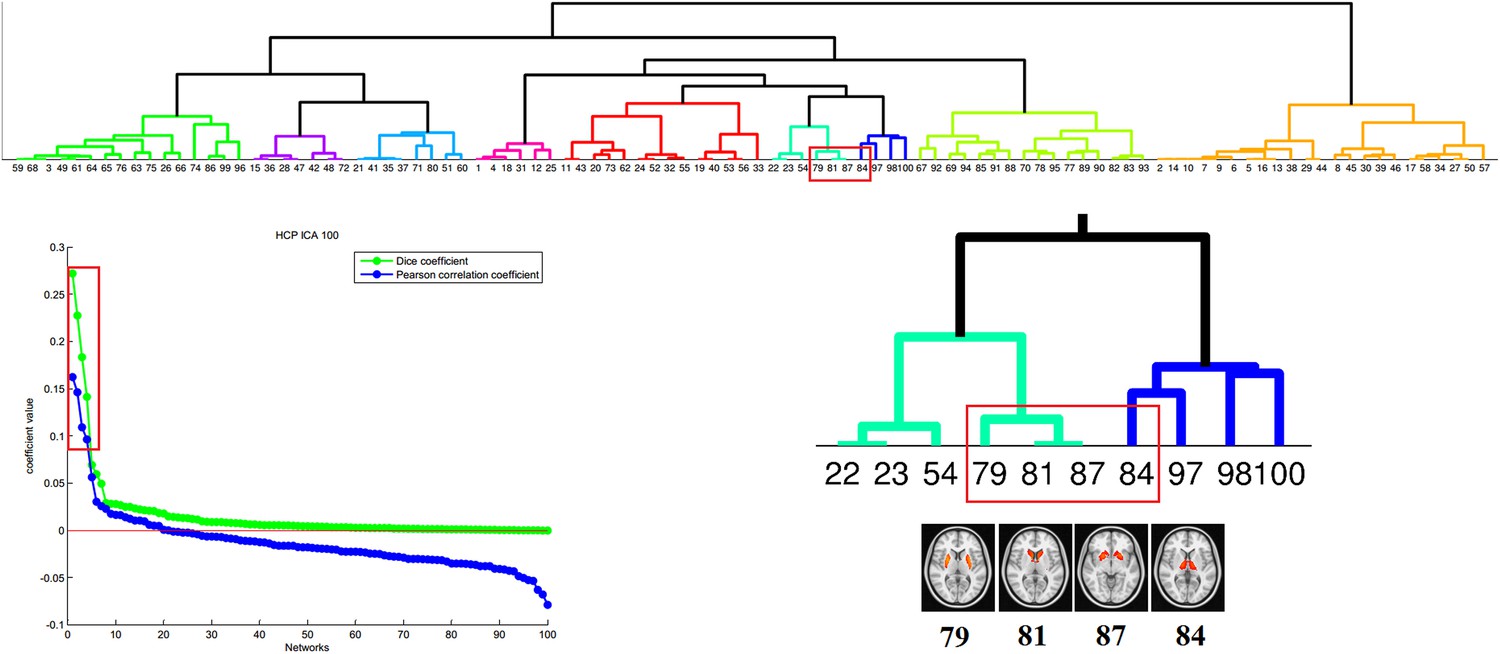
Correspondence between the PD-ICA network and resting-state networks (RSN) from the Human Connectome Project (HCP).
We used the 100 component parcellation of RSNs available at db.humanconnectome.org (https://db.humanconnectome.org/megatrawl/index.html) generated using MELODIC software. The bottom left panel shows the overlap/similarity between the PD-ICA network and each of the 100 RSNs. The top 4 RSNs in terms of both correlation and Dice coefficient are displayed in the bottom right panel along with a hierarchical clustering of all 100 components (top panel) based on correlation of fMRI time series from each RSN. This shows that the four RSNs belong to the same cluster, supporting the notion that they form an intrinsically connected network. Moreover, permutation testing among the 100 RSNs demonstrated that the fMRI time series from the 4 RSNs of interest were significantly correlated with each other (p < 0.0016).
Figure 4 with 1 supplement
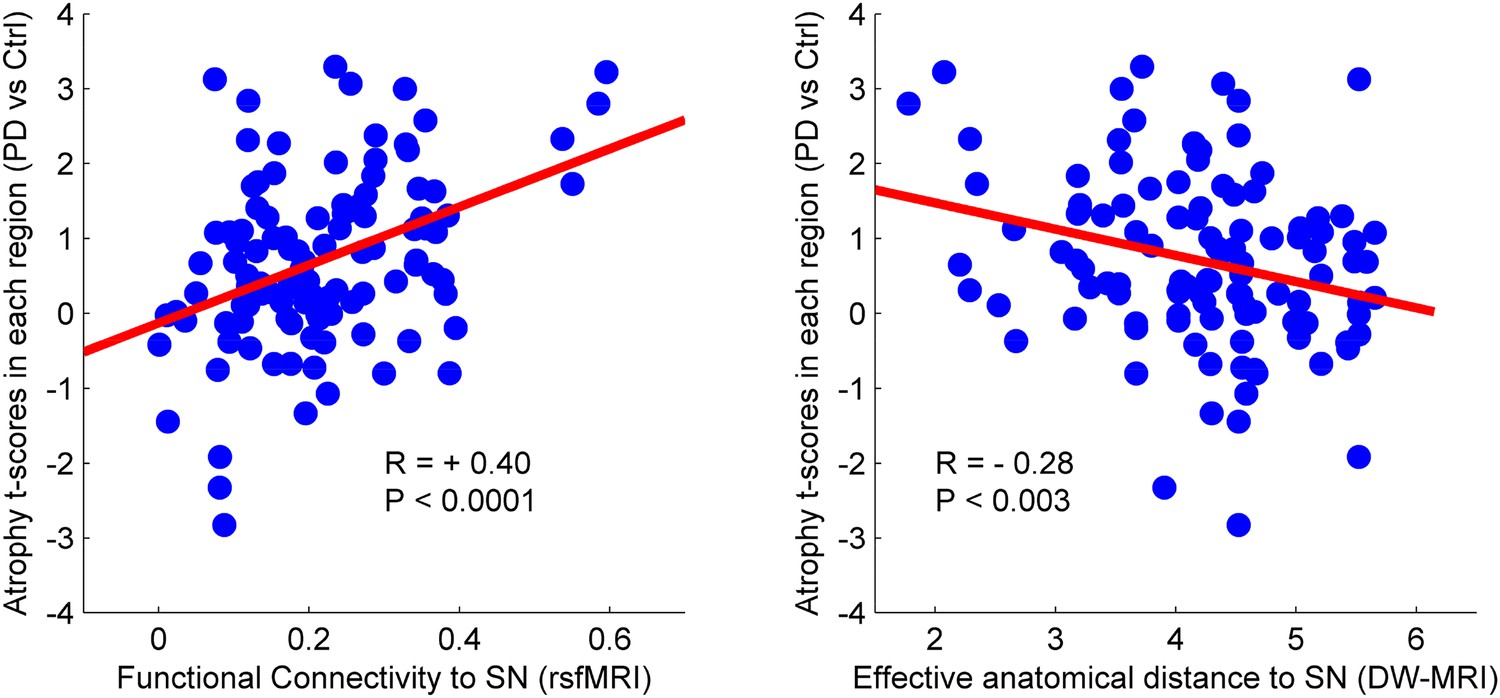
Relationship between atrophy in different brain regions and functional and structural connectivity with SN.
The brain was parcellated into 112 regions (Figure 4—figure supplement 1). SN was chosen a priori as the region of interest, and the functional and structural connectivities between each given region and SN were calculated. The statistical difference (t-score) between the average deformation in PD and controls in each region was used as an atrophy measure. Using correlation, the relationship between regional atrophy and both regional functional connectivity with SN using resting-state fMRI (rsfMRI) (left) and regional anatomical distance using diffusion-weighted imaging (DW-MRI) (right) was examined. There was significantly greater atrophy with proximity to the SN determined functionally (r = 0.4, p < 0.0001) and anatomically (r = −0.28, p < 0.003). Note that the connectivity measure in rsfMRI is correlation, resulting in greater values for more connected regions, whereas the connectivity measure in DW-MRI is distance, resulting in smaller values for more connected regions.
-
Figure 4—source data 1
Atlas labels and their anatomical coordinates.
- https://doi.org/10.7554/eLife.08440.016
-
Figure 4—source data 2
Best propagators (DW-MRI connectome).
Each brain region from the atlas was used as a potential propagator. The statistical difference (t-value) between the average deformation in PD and controls in each region was used as an atrophy measure. The correlation between this atrophy measure and the anatomical (or geodesic) distance to the potential propagator was used as a measure of propagation strength. The potential propagator regions are sorted by correlation values.
- https://doi.org/10.7554/eLife.08440.017
Figure 4—figure supplement 1
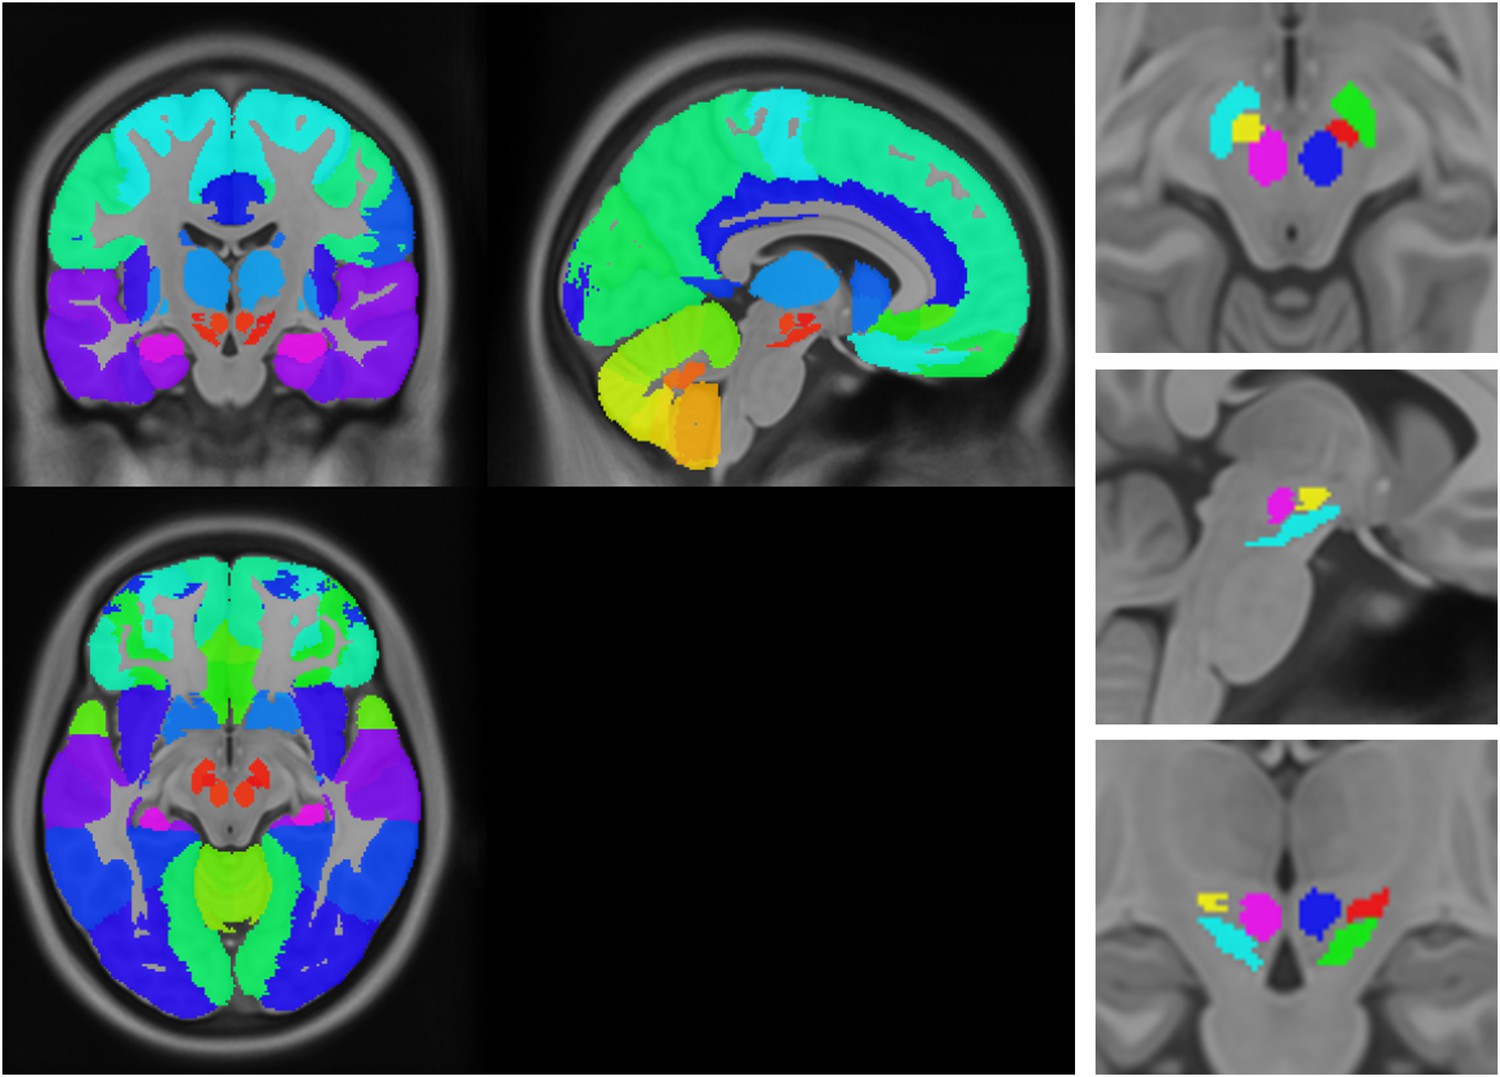
Anatomical atlas used for regional analysis.
https://doi.org/10.7554/eLife.08440.018
Author response image 1

Author response image 2

Author response image 3
Author response image 4
Author response image 5
Tables
Table 1
PD-ICA subcortical anatomical areas
| Brain area | Sub-areas | Z-score L/R | Peak coordinate L/R |
|---|---|---|---|
| Entorhinal cortex | – | na (2.94)/3.1 | −20, −7, −32/19, −4, −34 |
| Claustrum | – | na/4.3 | na/36, 0, −21 |
| Amygdala | Basolateral | 3.8/4.1 | −23, −5, −21/22, −4, −20 |
| Hippocampus | Dentate Gyrus | 4.7/4.2 | −34, −18, −14/34, −15, −17 |
| Substantia nigra | – | 5/4.9 | −8, −18, −15/7, −17, −15 |
| Periaqueductal gray | – | 5.6/5.4 | −3, −34, −12/3, −33, −12 |
| Pedunculopontine nucleus | – | 4.7/4.6 | −6, −30, −11/6, −29, −11 |
| Hypothalamus | – | 3.4/4.2 | −5, −3, −11/4, −3, −11 |
| Hippocampus | CA1, CA2, CA3 | 5.3/4.5 | −30, −27, −10/31, −27, −11 |
| Subthalamic nucleus | – | 5.2/5.2 | −8, −16, −10/9, −16, −10 |
| Nucleus accumbens | – | 5/4.9 | −9, 11, −9/8, 11, −8 |
| Basal forebrain | BNST | 3.3/3.6 | −6, 4, −8/9, 3, −10 |
| Basal forebrain | Extended amygdala | 6/5.8 | −16, −6, −8/10, −6, −8 |
| Basal forebrain | Substantia innominata | 3.6/5.1 | −8, 0, −8/8, 0, −8 |
| Putamen | Anterior putamen | 5.6/4.8 | −25, 11, −5/25, 11, −5 |
| Putamen | Posterior putamen | 6.1/4.8 | −30, −12, −6/31, −15, −2 |
| Globus pallidus | Internal + external | 5.7/4.7 | −20, 1, −1/21, −3, −3 |
| Caudate nucleus | Head | 8.2/6.2 | −10, 12, 4/10, 10, 2 |
| Pulvinar | Medial/Lateral | 5.3/4.5 | −19, −31, 5/11, −26, −4 |
| Thalamus | Ventrolateral/Ventroanterior | 5.3/3.6 | −17, −14, 11/14, −14, 12 |
| Caudate | Body | 4/4.8 | −15, 11, 12/17, 10, 15 |
-
List of subcortical regions belonging to the PD-ICA network and their peak z-scores. (BA: Brodmann area, na: not applicable, BNST: bed nucleus of the stria terminalis, ICA: independent component analysis, PD: Parkinson's disease).
Table 2
PD-ICA cortical anatomical areas
| Brain area | Sub-areas | Z-score L/R | Peak coordinate L/R |
|---|---|---|---|
| Superior temporal gyrus | Temporal pole BA 38 | 5.6/3.6 | −50, 11, −18/50, 10, −12 |
| Occipital lobe | BA 19 | 3.1/3.4 | −39, −77, −18/35, −79, −14 |
| Insula | Mid-insula | 4.5/4.6 | −39, 0, −5/38, 5, −2 |
| Inferior frontal gyrus | BA 45 | 3.4/4.4 | −38, 26, 19/53, 26, 15 |
| Anterior cingulate cortex | Rostral ACC | 4.3/na | −6, 31, 18/na |
| Middle frontal gyrus | DLPFC BA 9/46 | 4.1/na | −22, 51, 19/na |
| Superior frontal gyrus | BA 6 | 4/3.7 | −18, −10, 66/23, −10, 54 |
| Supplementary motor area | – | na/3.4 | na/5, −12, 67 |
-
List of cortical regions belonging to the PD-ICA network and their peak z-scores. (BA: Brodmann area, na: not applicable, ACC: anterior cingulate cortex, DLPFC: dorsolateral prefrontal cortex, ICA: independent component analysis, PD: Parkinson's disease).
Table 3
Best propagators (resting-state fMRI connectome)
| Seed region | r | Seed region | r |
|---|---|---|---|
| Substantia nigra | 0.40 | Cerebellum VIIIb | 0.05 |
| Subthalamic nucleus | 0.28 | Insula | 0.04 |
| Red nucleus | 0.28 | Anterior temporal lobe (lateral part) | 0.02 |
| Cerebellum dentate | 0.27 | Cerebellum CrusI | 0.01 |
| Pallidum | 0.23 | Superior temporal gyrus (anterior part) | 0.01 |
| Hippocampus | 0.22 | Caudate nucleus | −0.06 |
| Cerebellum vermis X | 0.21 | Superior temporal gyrus (posterior part) | −0.07 |
| Cerebellum vermis VIIIa | 0.20 | Middle and inferior temporal gyrus | −0.07 |
| Cerebellum interposed | 0.20 | Lingual gyrus | −0.08 |
| Cerebellum fastigial | 0.20 | Postcentral gyrus | −0.08 |
| Cerebellum vermis IX | 0.20 | Precentral gyrus | −0.09 |
| Cerebellum vermis VIIIb | 0.18 | Posterior temporal lobe | −0.09 |
| Cerebellum I IV | 0.18 | Inferior frontal gyrus | −0.10 |
| Cerebellum vermis VIIb | 0.17 | Middle frontal gyrus | −0.10 |
| Parahippocampal gyrus | 0.16 | Cuneus | −0.10 |
| Cerebellum V | 0.16 | Anterior cingulate gyrus | −0.12 |
| Anterior temporal lobe (medial part) | 0.15 | Occipital lobe (lateral part) | −0.12 |
| Cerebellum vermis CrusII | 0.14 | Lateral orbital gyrus | −0.16 |
| Occipitotemporal gyrus (lateral part) | 0.14 | Superior frontal gyrus | −0.16 |
| Cerebellum VIIb | 0.13 | Parietal lobe (Inferiolateral) | −0.16 |
| Cerebellum CrusII | 0.13 | Superior parietal gyrus | −0.20 |
| Cerebellum IX | 0.12 | Pre-subgenual frontal cortex | −0.20 |
| Cerebellum VI | 0.12 | Posterior orbital gyrus | −0.23 |
| Amygdala | 0.12 | Posterior cingulate gyrus | −0.23 |
| Cerebellum X | 0.11 | Medial orbital gyrus | −0.27 |
| Cerebellum vermis CrusI | 0.10 | Straight gyrus | −0.31 |
| Putamen | 0.10 | Anterior orbital gyrus | −0.33 |
| Cerebellum vermis VI | 0.08 | Subgenual frontal cortex | −0.34 |
| Cerebellum VIIIa | 0.07 | Nucleus accumbens | −0.38 |
| Thalamus | 0.06 | Subcallosal area | −0.42 |
-
Each brain region from the atlas was used as a potential propagator. The statistical difference (t-value) between the average deformation in PD and controls in each region was used as an atrophy measure. The correlation between this atrophy measure and the functional connectivity to the potential propagator was used as a measure of propagation strength. The potential propagator regions are sorted by correlation values.
-
fMRI: functional MRI, PD: Parkinson's disease.
Table 4
Clinical characteristics of subjects
| Control (n = 117) | PD (n = 232) | p value | |
|---|---|---|---|
| Age (years) | 59.7 ± 11.3 | 61.2 ± 9.1 | 0.1 |
| Years of education (years) | 15.7 ± 2.91 | 15.4 ± 2.8 | NS |
| Sex (M/F/% males) | 74/43/63.2 | 155/77/66.8 | NS |
| Handedness–R/L/A | 98/11/8 | 210/17/5 | NS |
| Striatum binding ratio | 2.6 ± 0.6 | 1.4 ± 0.4 | <0.0001 |
| MoCA | 28.2 ± 1.2 | 27.3 ± 2.2 | <0.0001 |
| Disease duration (months) | – | 6.9 ± 7.1 | – |
| MDS UPDRS part III | – | 21.9 ± 9.1 | – |
| H&Y stage | – | 1.6 ± 0.5 | – |
-
M = male, F = female, NS = not significant, H&Y: Hoehn and Yahr, PD: Parkinson's disease, MoCA, Montreal Cognitive Assessment, UPDRS, Unified Parkinson's Disease Rating Scale. Statistical differences analyzed through an unpaired t-test or chi square test. Listed values are the mean ± standard deviation.
Download links
A two-part list of links to download the article, or parts of the article, in various formats.
Downloads (link to download the article as PDF)
Open citations (links to open the citations from this article in various online reference manager services)
Cite this article (links to download the citations from this article in formats compatible with various reference manager tools)
Network structure of brain atrophy in de novo Parkinson's disease
eLife 4:e08440.
https://doi.org/10.7554/eLife.08440


