Ventral tegmental area interneurons revisited: GABA and glutamate projection neurons make local synapses
- Department of Neurosciences, University of California, San Diego, United States
- Institute of Pharmacology, Center for Physiology and Pharmacology, Medical University of Vienna, Austria
- Research Service VA San Diego Healthcare System, United States
Figures
Figure 1
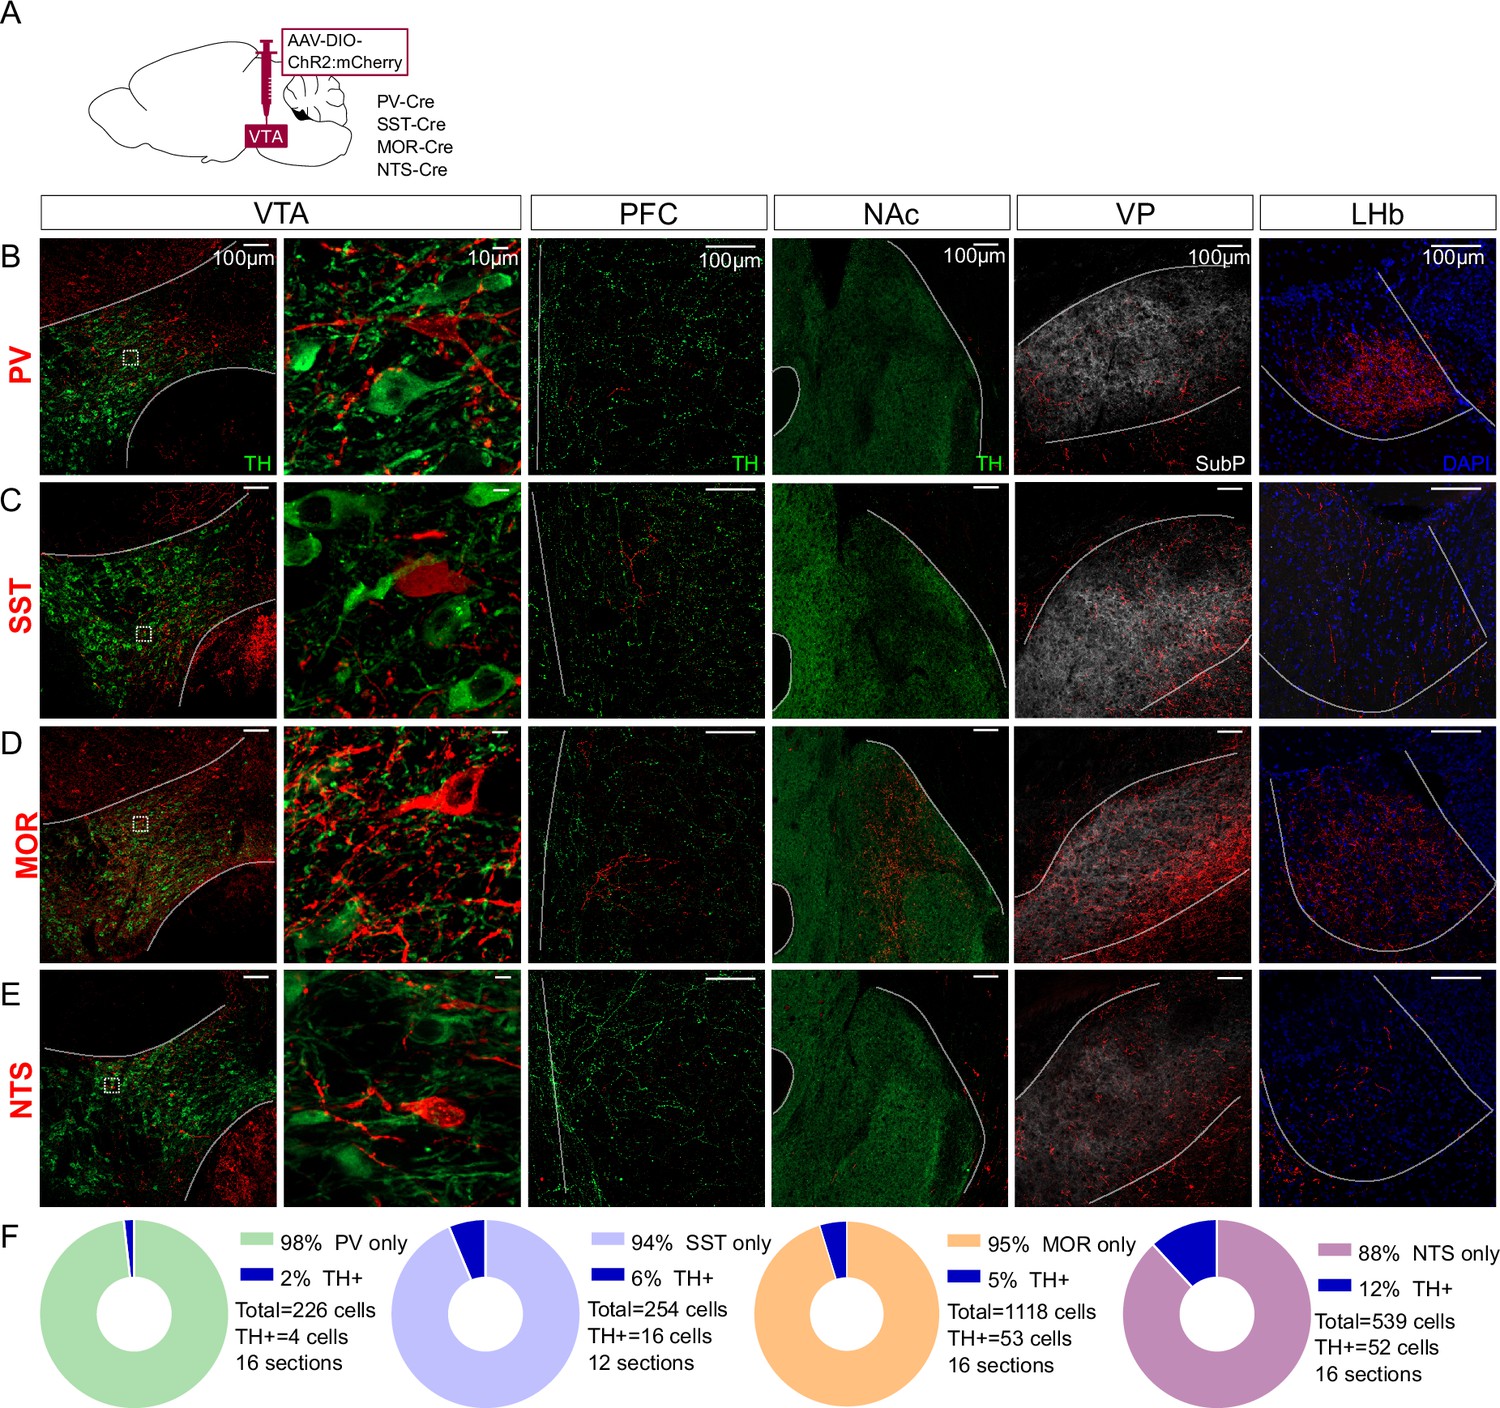
Distal projections of putative ventral tegmental area (VTA) interneuron markers.
(A) Cre-dependent expression of ChR2:mCherry in VTA cell bodies but also distal axonal process in (B) PV-Cre, (C) SST-Cre, (D) MOR-Cre, and (E) NTS-Cre mice. First column is an overview of the expression in VTA (bregma –3.3), followed by a high magnification inset of the boxed region in the second column. The third column shows expression patterns in prefrontal cortex (PFC) (bregma +1.7), the fourth in nucleus accumbens (NAc) (bregma +1.3), the fifth in ventral pallidum (VP) (bregma +0.5), and the sixth in lateral habenula (LHb) (bregma –1.8). Scale bars are 100 µm, except 10 µm in the second column. ChR2:mCherry is shown in red; with TH in green, Substance P in white, or DAPI in blue. (F) Donut charts show the fraction of mCherry+ VTA cells counted that label for TH.
Figure 2
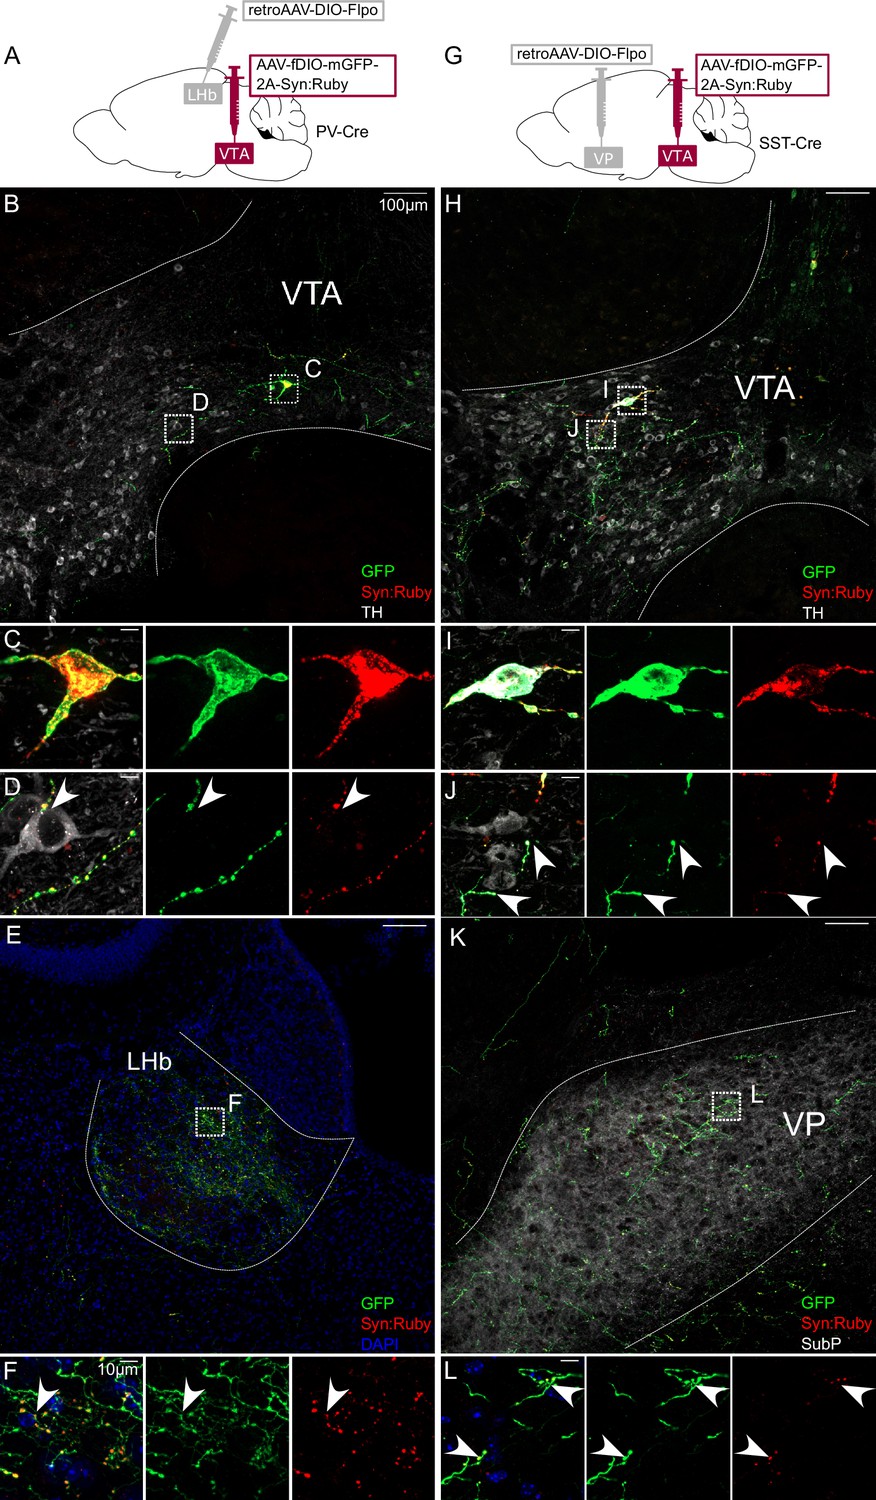
Intersectional approach to label projections of PV- and SST-expressing ventral tegmental area (VTA) neurons.
(A) Dual adeno-associated virus (AAV) approach for Cre-dependent expression of Flp injected in lateral habenula (LHb) plus Flp-dependent expression of GFP and Syn:Ruby in VTA of PV-Cre mice. (B) LHb-projecting PV-Cre neurons in VTA with (C, D) high magnification insets showing putative release sites proximal to TH+ DA neurons. (E) VTA axons in LHb with (F) high magnification insets. (G) Dual AAV approach for Cre-dependent expression of Flp injected in ventral pallidum (VP) plus Flp-dependent expression of GFP and Syn:Ruby in VTA of SST-Cre mice. (H) VP-projecting SST-Cre neurons in VTA with (I,J) high magnification insets showing putative release sites proximal to TH +DA neurons. (K) VTA axons in VP with (L) high magnification insets. Scale bars: 100 or 10 µm for high magnification insets.
Figure 3 with 1 supplement
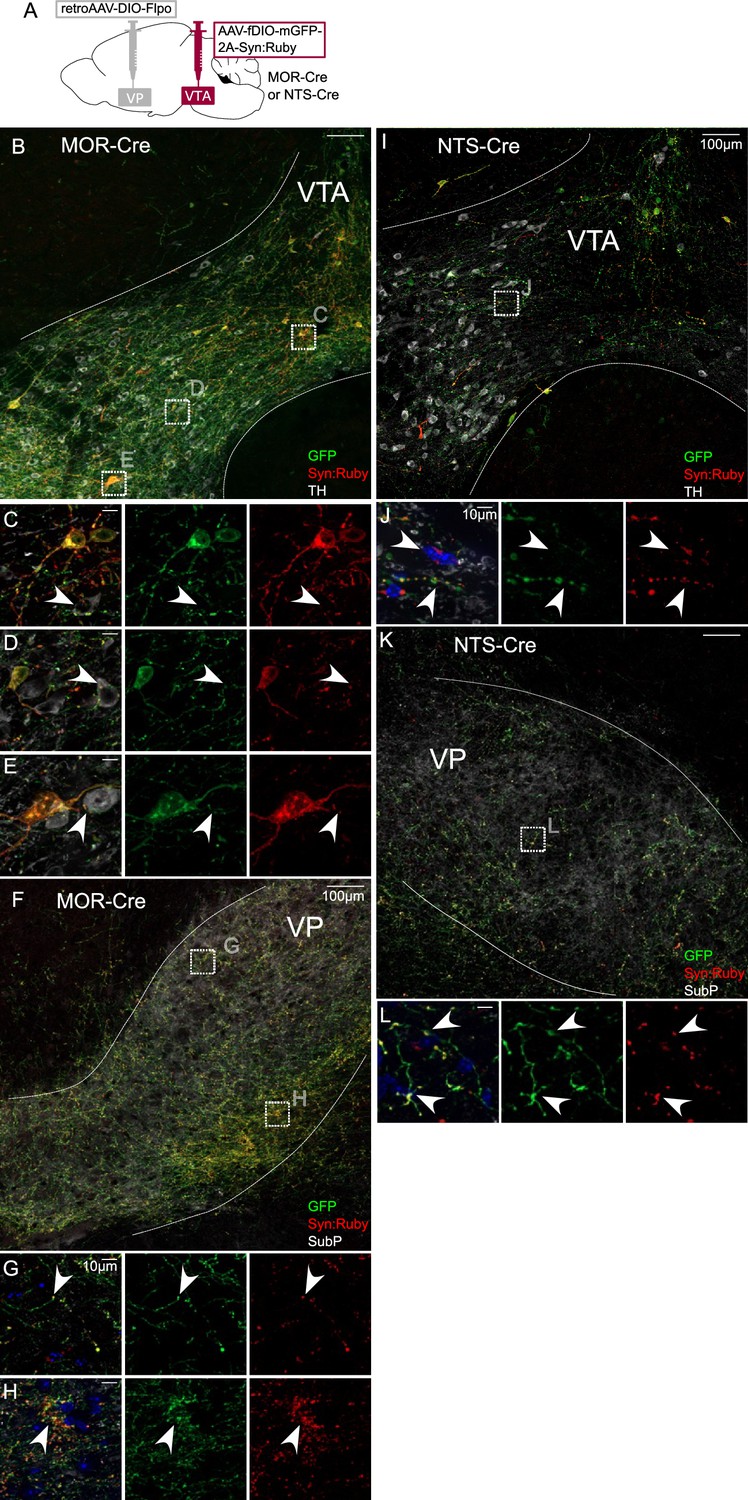
Intersectional approach to label projections of Mu-opioid receptor (MOR)- and neurotensin (NTS)-expressing ventral tegmental area (VTA) neurons.
(A) Dual adeno-associated virus (AAV) approach for Cre-dependent expression of Flp injected in ventral pallidum (VP) plus Flp-dependent expression of GFP and Syn:Ruby in VTA of MOR-Cre and NTS-Cre mice. (B) VP-projecting MOR-Cre neurons in VTA with (C–E) high magnification insets showing putative release sites proximal to TH+ DA neurons. (F) VTA axons in VP with (G, H) high magnification insets. (I) VP-projecting NTS-Cre neurons in VTA with (J) high magnification insets showing putative release sites. (K) VTA axons in VP with (L) high magnification insets. Scale bars: 100 or 10 µm for high magnification insets.
Figure 3—figure supplement 1
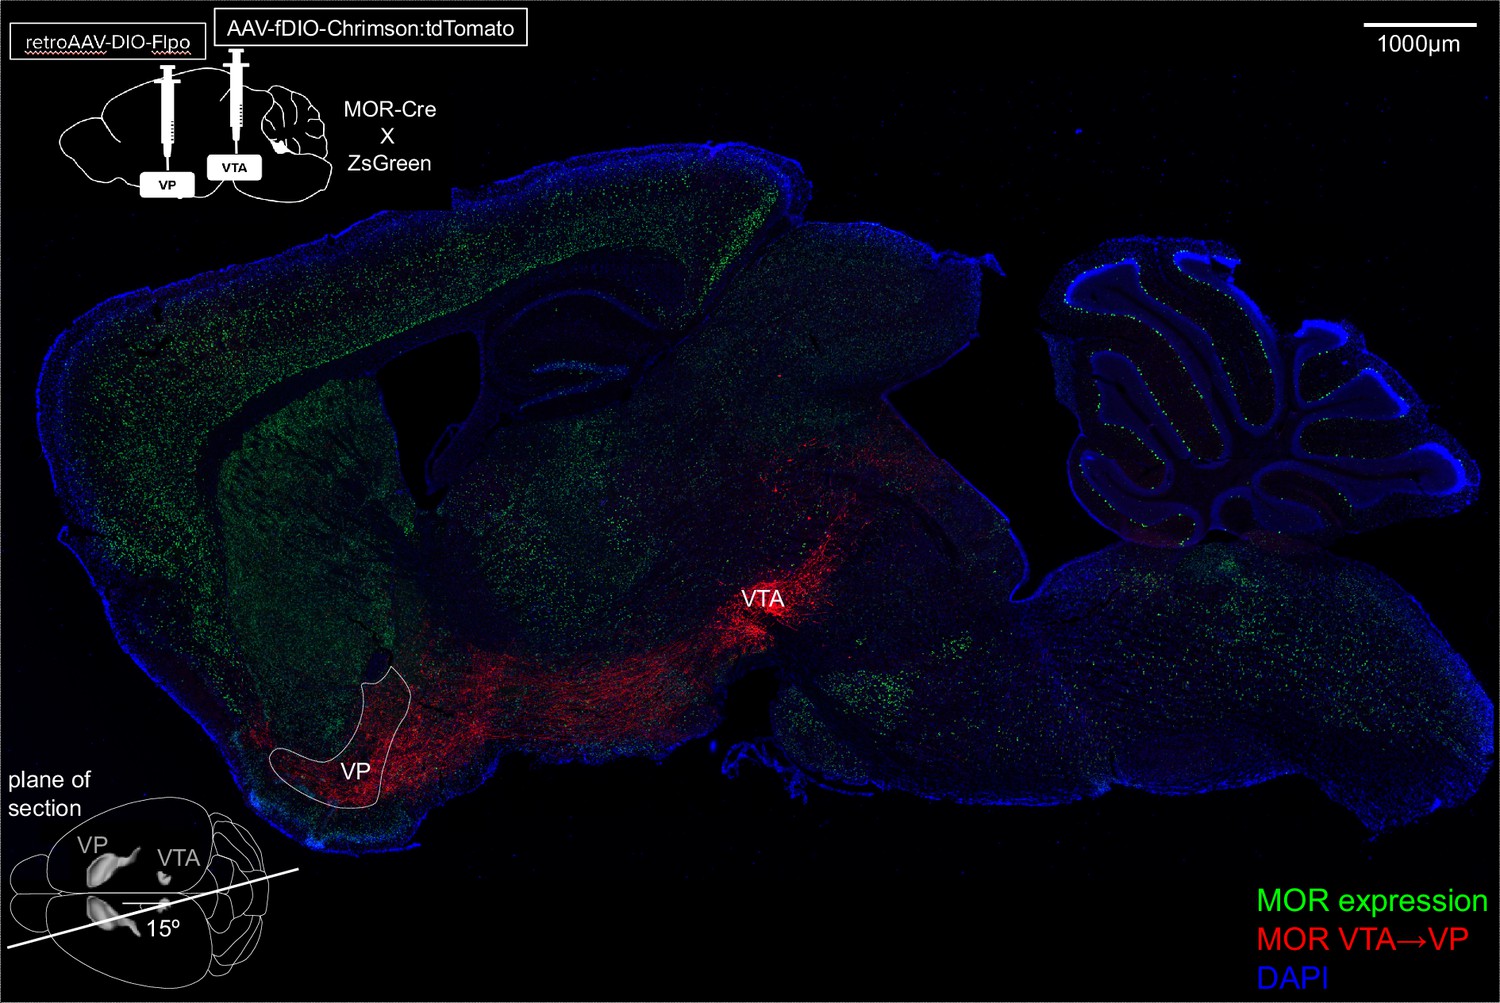
Projection of MOR-Cre-expressing ventral tegmental area (VTA) neurons to ventral pallidum (VP).
Sagittal image, genotypes, and schematics of dual adeno-associated virus (AAV) approach and approximate location and sectioning angle of the cut. ZsGreen (green) labels all cells that have expressed MOR-Cre, Chrimson:tdTomato (red) labels cells/fibers from MOR-Cre VTA neurons projecting to VP, DAPI (blue) labels nuclei.
Figure 4
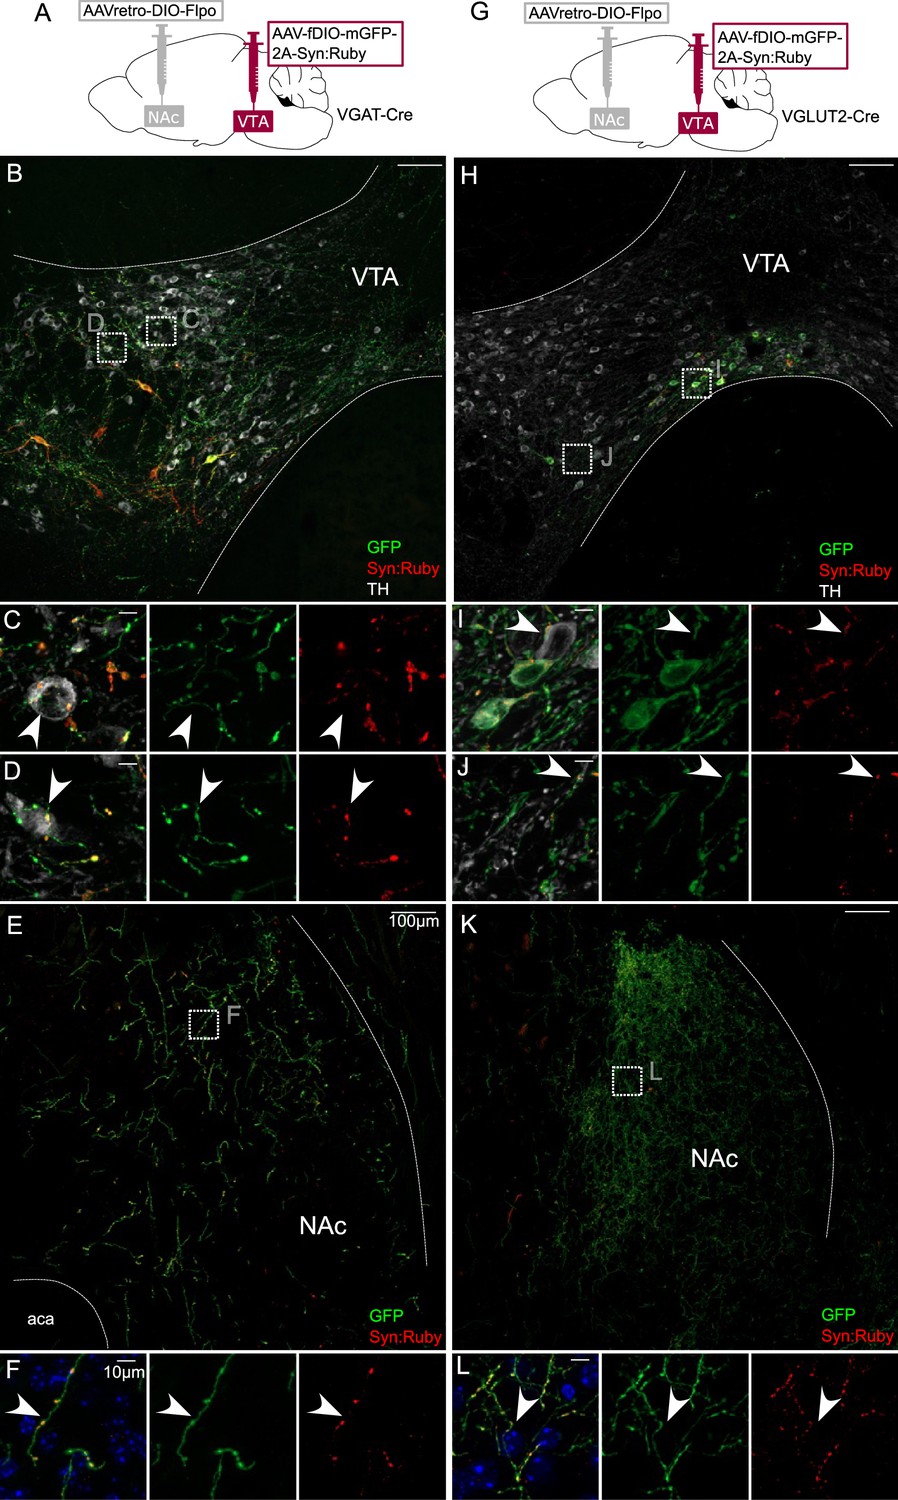
Intersectional labeling of ventral tegmental area (VTA) GABA and glutamate projection neurons suggests intra-VTA collaterals.
(A) Dual adeno-associated virus (AAV) approach for Cre-dependent expression of Flp injected in nucleus accumbens (NAc) plus Flp-dependent expression of GFP and Syn:Ruby in VTA of VGAT-Cre mice. (B) NAc-projecting VGAT-Cre neurons in VTA with (C, D) high magnification insets showing putative release sites proximal to TH+ DA neurons. (E) VTA axons in NAc of VGAT-Cre mice, with (F) high magnification insets. (G) Dual AAV approach for Cre-dependent expression of Flp injected in NAc plus Flp-dependent expression of GFP and Syn:Ruby in VTA of VGLUT2-Cre mice. (H) NAc-projecting VGLUT2-Cre neurons in VTA with (I, J) high magnification insets showing putative release sites proximal to TH+ DA neurons. (K) VTA axons in NAc of VGLUT2-Cre mice with (L) high magnification insets. Scale bars: 100 or 10 µm for high magnification insets.
Figure 5 with 1 supplement
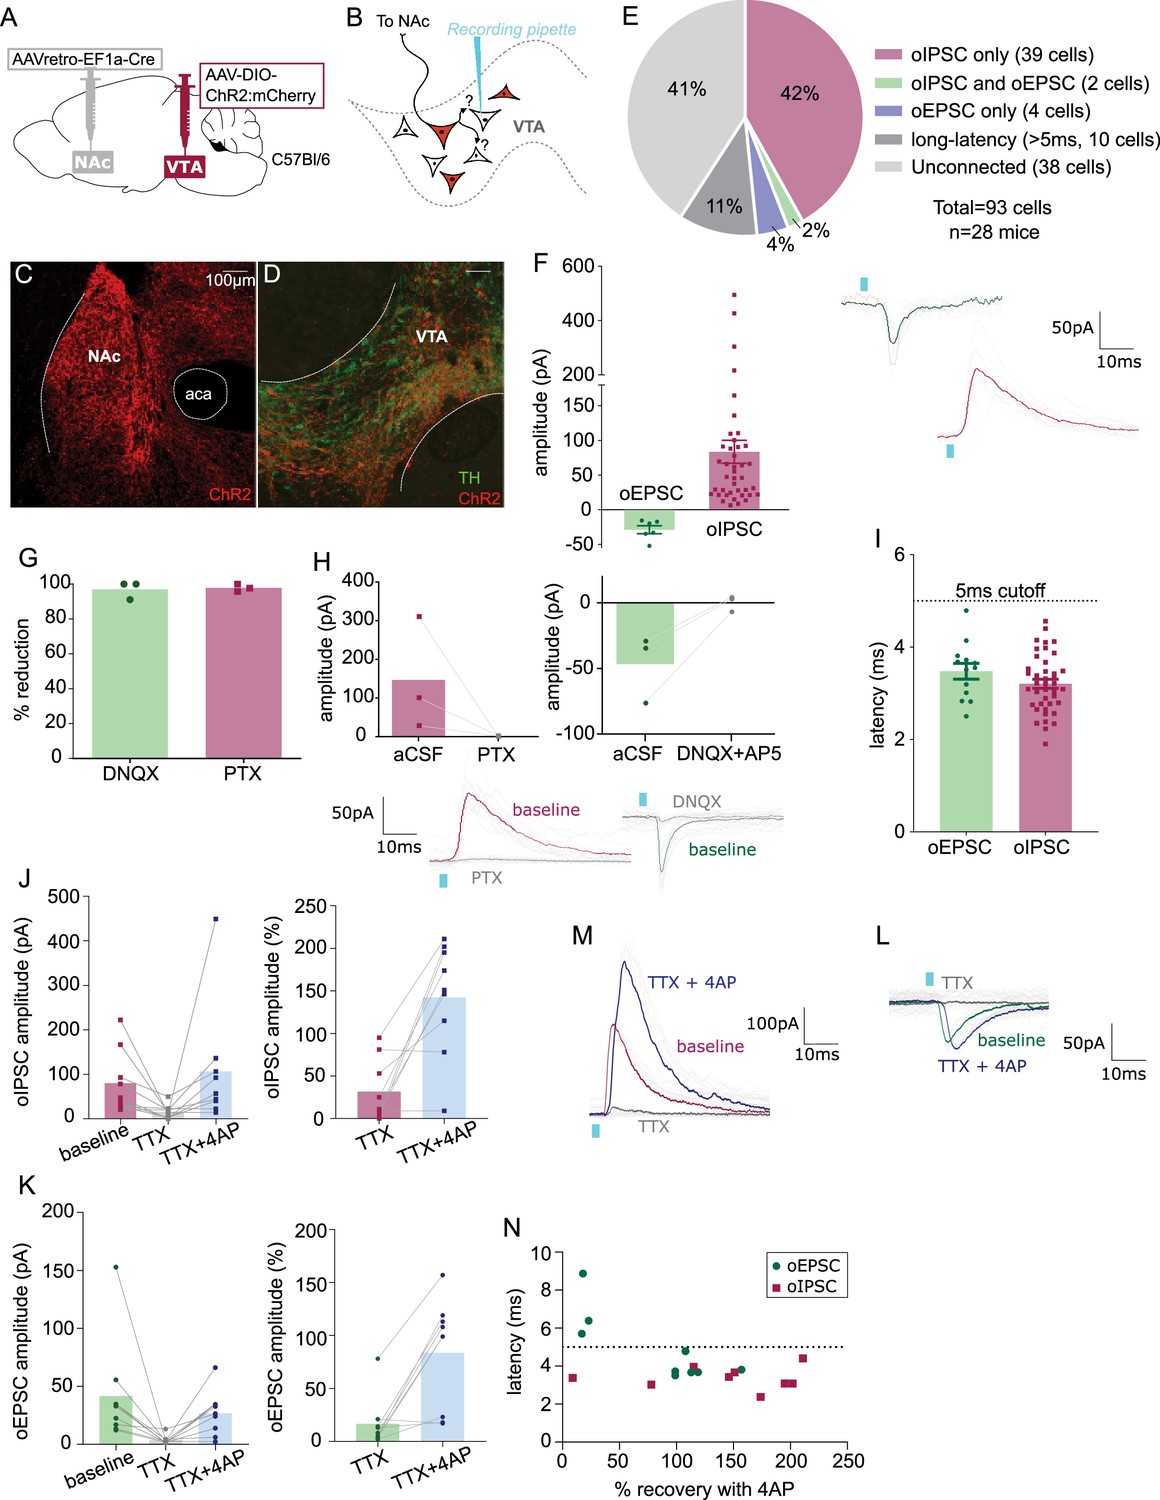
Nucleus accumbens (NAc)-projecting ventral tegmental area (VTA) GABA and glutamate neurons make intra-VTA synapses.
(A) Dual adeno-associated virus (AAV) approach to express ChR2:mCherry in NAc-projecting VTA neurons in wild-type mice. (B) Patch-clamp recordings from ChR2:mCherry-negative neurons of VTA to test for collateralizing synapses made by NAc-projectors. (C) Coronal images showing ChR2:mCherry expression in NAc and (D) VTA; scale bars: 100 µm. (E) ChR2:mCherry-negative VTA neuron responses to optogenetic stimulation of NAc-projectors. (F) Peak amplitude of connected cells that displayed an oEPSC and/or oIPSC (excluding long-latency), with example traces. (G) Percent reduction in oEPSC or oIPSC by DNQX or picrotoxin (PTX), respectively. (H) Peak amplitude of oIPSCs before and after bath application of PTX, or of oEPSCs before and after bath application of DNQX, with example traces. (I) Latency to optogenetic-evoked postsynaptic current (oPSC) onset (excluding long latency). (J) Peak oIPSC amplitude before and after bath application of tetrodotoxin (TTX) and recovery with 4-aminopyridine (4AP) (Friedman’s test Chi-square = 10.9, p = 0.0029) and (K) example traces. (L) Peak oEPSC amplitude before and after bath application of TTX and recovery with 4AP (Friedman’s test Chi-square = 11.6, p = 0.0013) and (M) example traces. (N) Scatter plot showing relationship between initial (pre-treatment) latency to oPSC onset and 4AP recovery. Green dots represent oEPSCs and red squares oIPSCs.
Figure 5—figure supplement 1
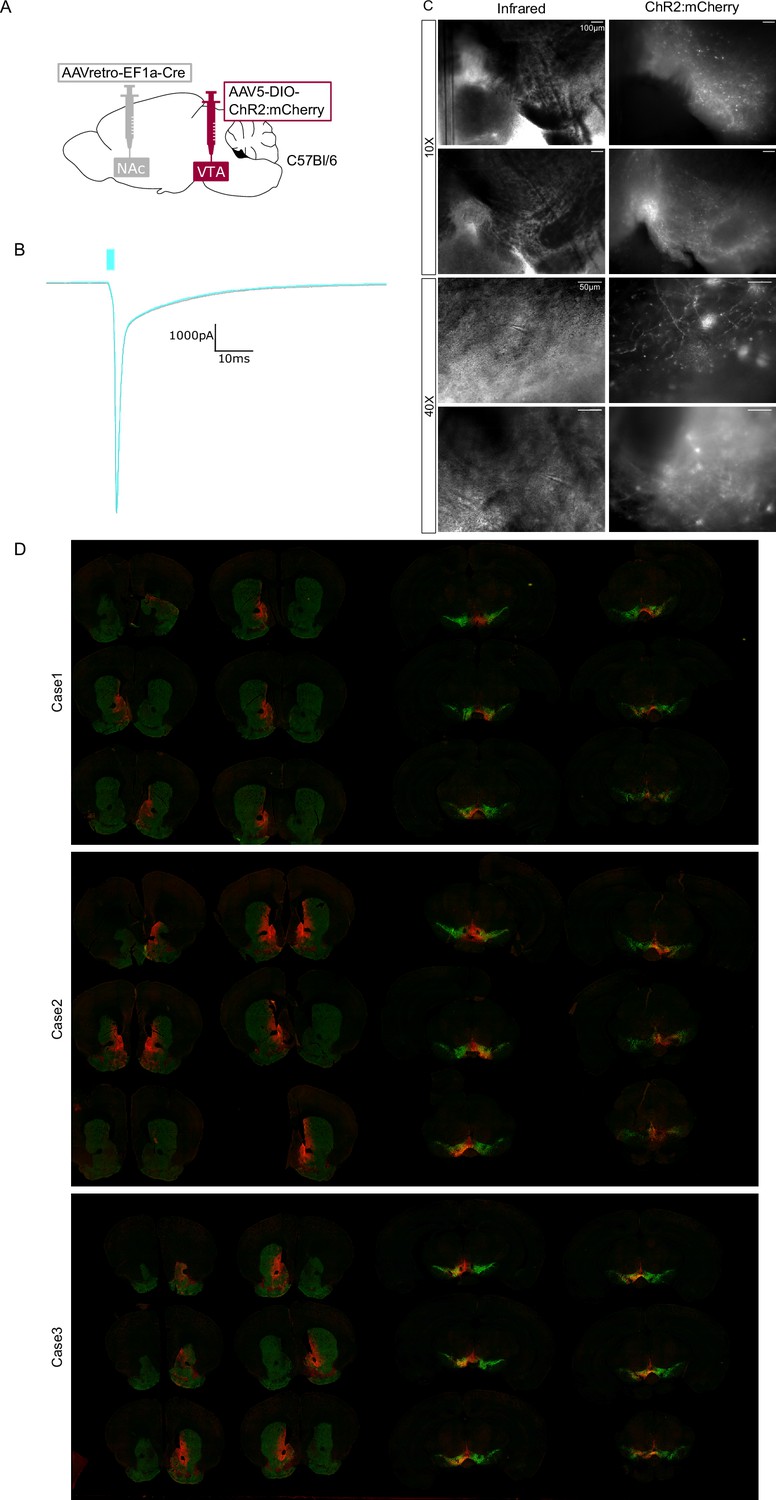
Photocurrent and histological validation of approach used in Figure 5.
(A) Dual adeno-associated virus (AAV) approach to express ChR2:mCherry in nucleus accumbens (NAc)-projecting ventral tegmental area (VTA) neurons in wild-type mice. (B) Example opsin-mediated photocurrent from ChR2:mCherry-positive neuron of VTA. (C) Example images under DIC IR light and mCherry expression around patch-clamp pipettes. (D) Additional cases of histology.
Figure 6 with 1 supplement
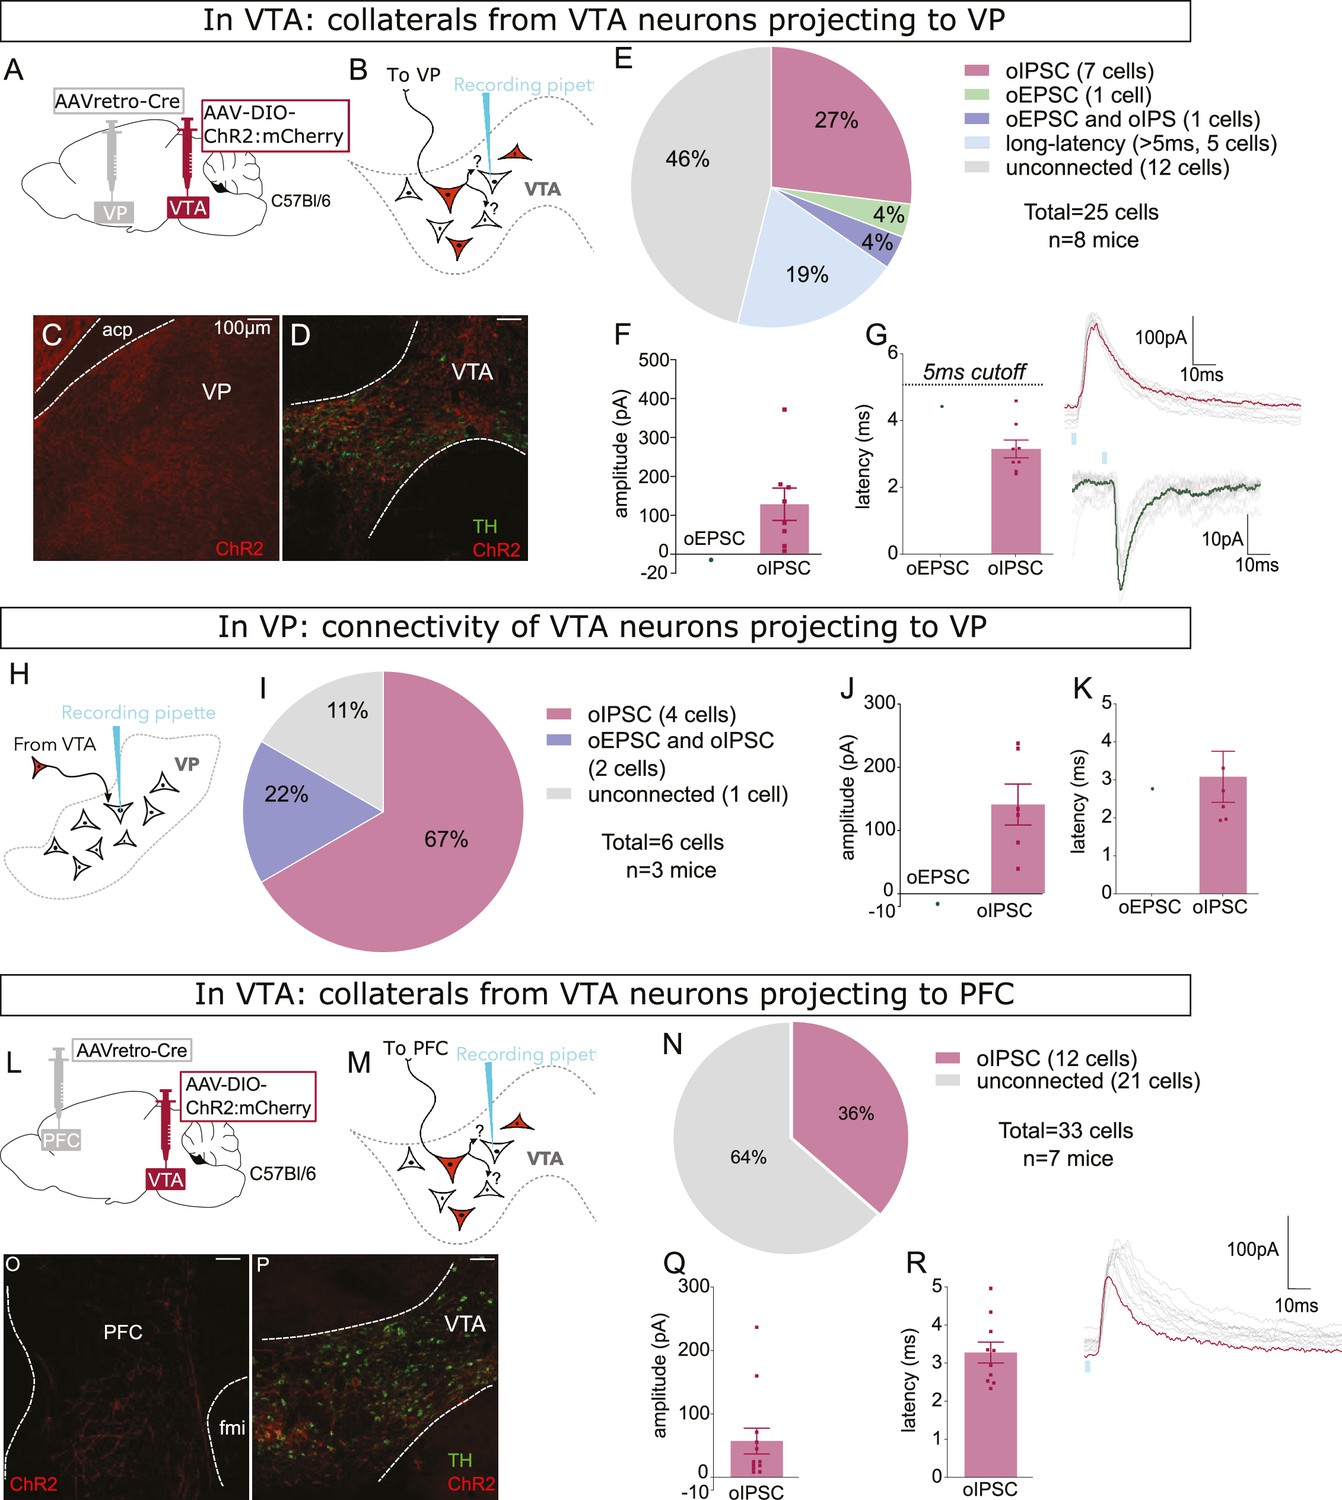
Ventral pallidum (VP)- and prefrontal cortex (PFC)-projecting ventral tegmental area (VTA) GABA and glutamate neurons make intra-VTA synapses.
(A) Dual adeno-associated virus (AAV) approach to express ChR2:mCherry in VP-projecting VTA neurons in wild-type mice. (B) Patch-clamp recordings from ChR2:mCherry-negative neurons of VTA to test for collateralizing synapses made by VP-projectors. (C) Coronal images showing ChR2:mCherry expression in VP and (D) VTA; scale bars: 100 µm. (E) ChR2:mCherry-negative VTA neuron responses to optogenetic stimulation of VP-projectors. (F) Peak amplitude and (G) onset latency of connected cells that displayed an oEPSC and/or oIPSC (excluding long latency), with example traces. (H) Recordings of optogenetic-evoked postsynaptic currents (oPSCs) from neurons in VP and (I) VP responses to optogenetic stimulation of VP-projecting VTA neurons from approach described in panel A. (J) Peak amplitude and (K) onset latency of connected VP neurons that displayed an oEPSC and/or oIPSC, with example traces. (L) Dual AAV approach to express ChR2:mCherry in PFC-projecting VTA neurons in wild-type mice. (M) Patch-clamp recordings from ChR2:mCherry-negative neurons of VTA to test for collateralizing synapses made by PFC-projectors. (N) Coronal images showing ChR2:mCherry expression in PFC and (O) VTA; scale bars: 100 µm. (P) ChR2:mCherry-negative VTA neuron responses to optogenetic stimulation of PFC-projectors. (Q) Peak amplitude and (R) onset latency of connected cells that displayed an oEPSC and/or oIPSC, with example trace.
Figure 6—figure supplement 1
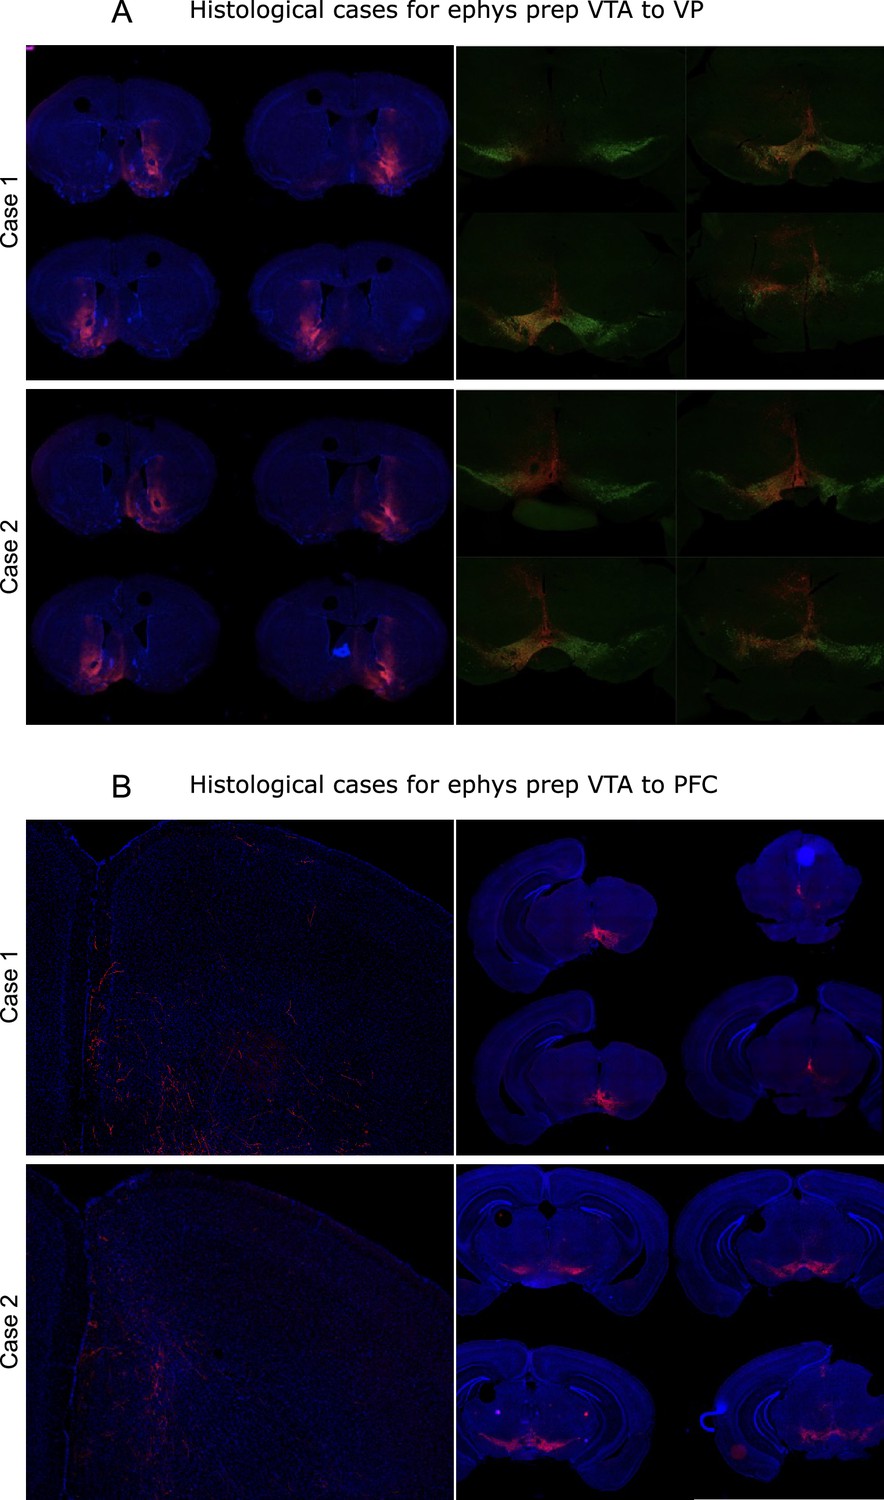
Histological validation of approach used in Figure 6.
(A) Additional cases of histology with expression of ChR2:mCherry in ventral pallidum (VP)-projecting ventral tegmental area (VTA) neurons in wild-type mice. (B) Additional cases of histology with expression of ChR2:mCherry in prefrontal cortex (PFC)-projecting VTA neurons in wild-type mice.
Figure 7
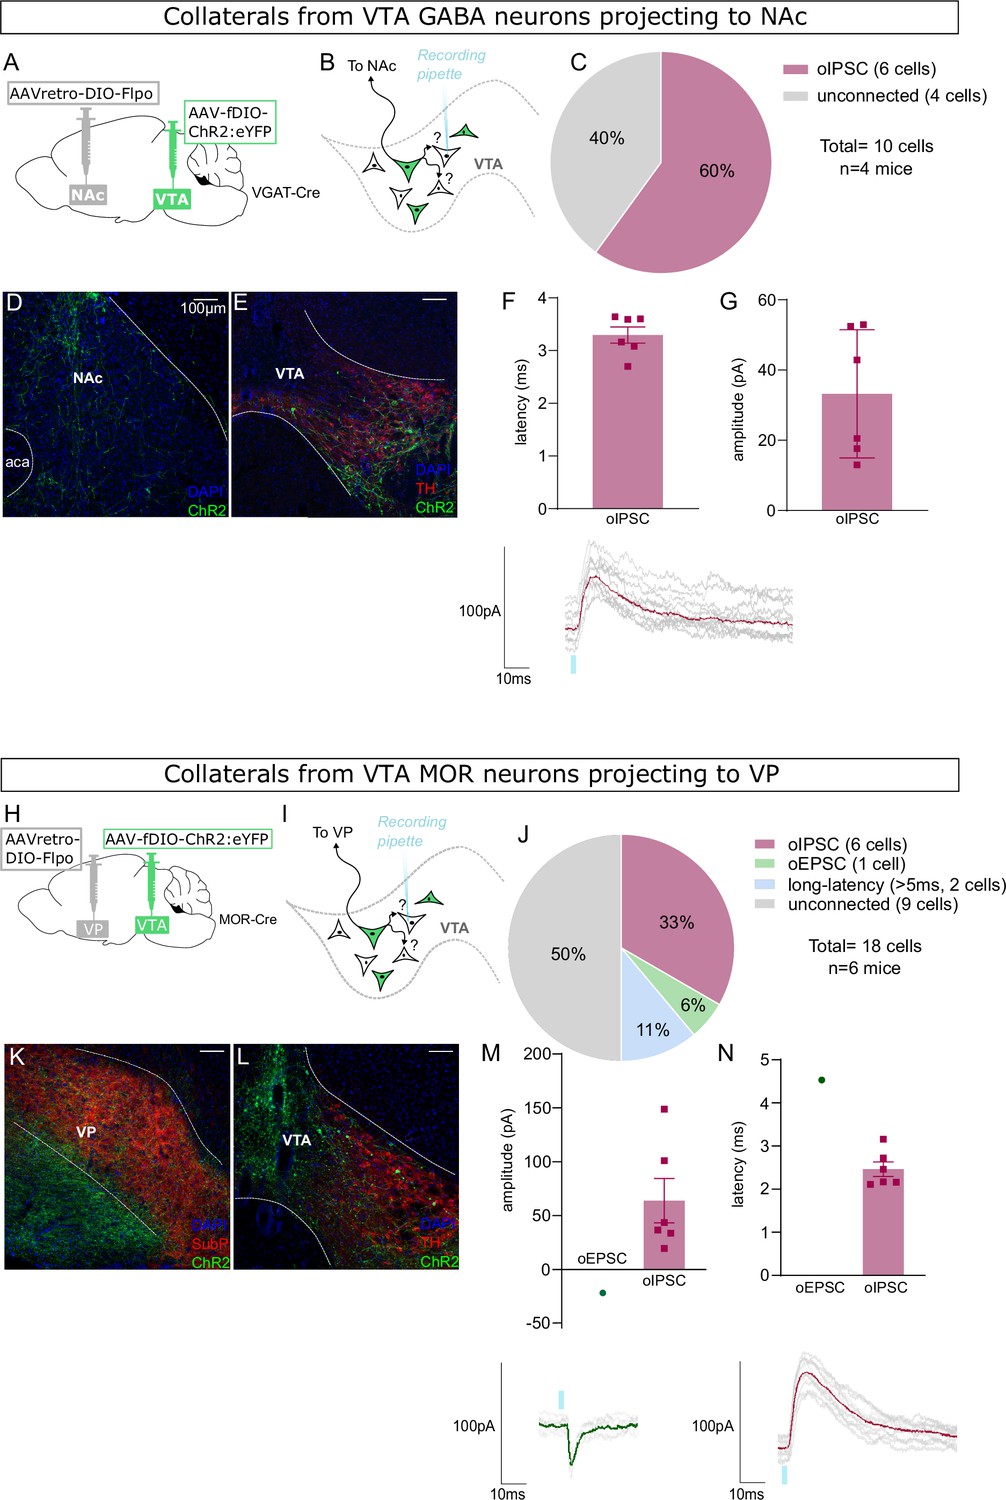
Nucleus accumbens (NAc)-projecting ventral tegmental area (VTA) GABA neurons, and ventral pallidum (VP)-projecting VTA Mu-opioid receptor (MOR) neurons, make intra-VTA synapses.
(A) Dual adeno-associated virus (AAV) approach to express ChR2:eYFP in NAc-projecting VTA neurons in VGAT-Cre mice. (B) Patch-clamp recordings from ChR2:eYFP-negative neurons of VTA to test for collateralizing synapses made by NAc-projectors. (C) Coronal images showing ChR2:eYFP expression in NAc and (D) VTA; scale bars: 100 µm. (E) ChR2:eYFP-negative VTA neuron responses to optogenetic stimulation of NAc-projectors. (F) Peak amplitude of connected cells that displayed an oIPSC, with example trace. (G) Latency to oIPSC onset. (H) Dual AAV approach to express ChR2:eYFP in VP-projecting VTA neurons in MOR-Cre mice. (I) Patch-clamp recordings from ChR2:eYFP-negative neurons of VTA to test for collateralizing synapses made by VP-projectors. (J) Coronal images showing ChR2:eYFP expression in VP and (K) VTA; scale bars: 100 µm. (L) ChR2:eYFP-negative VTA neuron responses to optogenetic stimulation of VP-projectors. (M) Peak amplitude of connected cells that displayed an oEPSC and/or oIPSC (excluding long latency), with example traces. (N) Latency to optogenetic-evoked postsynaptic current (oPSC) onset (excluding long latency).
Tables
Table 1
Mouse lines.
| Gene | Abbreviation | Mouse line | Jackson Labs # |
|---|---|---|---|
| Slc32a1 | VGAT-Cre | B6J.129S6(FVB)-Slc32a1tm2(cre)Lowl/MwarJ | 028862 |
| Slc17a6 | VGLUT2-Cre | STOCK Slc17a6tm2(cre)Lowl/J | 016963 |
| Pvalb | PV-Cre | B6.129P2-Pvalbtm1(cre)Arbr/J | 017320 |
| Nts | NTS-Cre | B6;129-Ntstm1(cre)Mgmj/J | 017525 |
| Sst | SST-Cre | B6N.Cg-Ssttm2.1(cre)Zjh/J | 018973 |
| Gt(Rosa)26Sor | R26-ZsGreen | B6.Cg-Gt(ROSA)26Sortm6(CAG-ZsGreen1)Hze/J | 007906 |
Table 2
Stereotaxic coordinates.
| Injection site | ML | AP | DV |
|---|---|---|---|
| VTA | –0.35 | –3.35 | –4.3 |
| NAc | –0.8 | 1.34 | –4.5 |
| PFC | –0.4 | +1.9 | –1.7 |
| VP | –1.45 | +0.55 | –5.35 |
| VTA (MOR-Cre) | –0.6 | –3.4 | –4.4 |
Table 3
AAV vectors.
| AAV | Titer | Packaged by | Volume | Addgene # |
|---|---|---|---|---|
| AAVretro-EF1a-Cre | 3 × 10¹³ | Salk GT3 | 150 nl | 55636 |
| AAV5-EF1α-DIO-hChR2(H134R)-mCherry | 2 × 10¹³ | Addgene | 150 nl for ephys 100 nl for histology | 20297 |
| AAVDJ-hSyn1-FLExFRT mGFP-2A-Synaptophysin:mRuby | 2 × 10¹³ | Addgene | 150 nl | 71761 |
| AAVretro-hSyn1-DIO-Flpo | 2 × 10¹² | Salk GT3 | 150 nl | NA |
Table 4
Antibodies.
| Primary antibody | Species | Catalog # | Company | Dilution |
|---|---|---|---|---|
| TH | Sheep | P60101 | Pel-Freez | 1:2000 |
| DsRed | Rabbit | 632496 | Clontech | 1:2000 |
| GFP | Chicken | A10262 | Invitrogen | 1:2000 |
| Substance P | Rat | MAB356 | Millipore | 1:200 |
| Chat | Goat | AB144P | Millipore | 1:400 |
| Donkey secondary antibody | Alexa Fluor conjugate | Catalog # | Company | Concentration |
| anti-Sheep | 488 | 713-545-003 | Jackson Immuno Research | 3 µg/ml |
| anti-Sheep | 594 | 713-585-147 | ||
| anti-Sheep | 647 | 713-605-147 | ||
| anti-Rabbit | 594 | 711-585-152 | ||
| anti-Chicken | 488 | 703-546-155 | ||
| anti-Rat | 647 | 712-605-153 | ||
| anti-Goat | 647 | 705-605-147 |
Table 5
Cases included/excluded for Figure 1.
| Surgeries (n) | Tracing cases (M/F) | Excluded: spread | Excluded: technical failure | TH counting cases (M/F) | |
|---|---|---|---|---|---|
| PV | 9 | 2/1 | 4 | 2 | 3/1 |
| SST | 5 | 0/3 | 2 | 0 | 0/3 |
| MOR | 13 | 3/0 | 8 | 2 | 3/1 |
| NTS | 5 | 0/4 | 1 | 3 | 0/4 |
Table 6
Drugs and physiology reagents.
| Reagent | Catalog # | Company |
|---|---|---|
| 4AP | 0940 | Tocris |
| CaCl2·2H2O | BP510 | Fisher Bioreagents |
| Ces met | 2550-61-0 | Sigma-Aldrich |
| D-Glucose | G8270 | Sigma |
| DNQX | D0540 | Sigma |
| EGTA | E3889 | Sigma |
| HEPES | H3375 | Sigma |
| KCl | BP366 | Fisher Bioreagents |
| MgSO4·7H2O | M80 | Fisher Bioreagents |
| Na-GTP | G8877 | Sigma |
| Na2-ATP | A2383 | Sigma |
| NaCl | BP358 | Fisher Bioreagents |
| NaH2PO4 | BP329 | Fisher Bioreagents |
| NaHCO3 | BP328 | Fisher Bioreagents |
| NMDG | M2004 | Sigma-Aldrich |
| PTX | P1675 | Sigma |
| Sodium ascorbate | A7631 | Sigma |
| Sodium pyruvate | P2256 | Sigma-Aldrich |
| TEA chloride | 86616 | Fluka |
| Thiourea | T8656 | Sigma-Aldrich |
| TTX | 1069 | Tocris |
Additional files
Download links
A two-part list of links to download the article, or parts of the article, in various formats.
Downloads (link to download the article as PDF)
Open citations (links to open the citations from this article in various online reference manager services)
Cite this article (links to download the citations from this article in formats compatible with various reference manager tools)
Ventral tegmental area interneurons revisited: GABA and glutamate projection neurons make local synapses
eLife 13:RP100085.
https://doi.org/10.7554/eLife.100085.3


