Stimulus representation in human frontal cortex supports flexible control in working memory
- Institute of Neuroscience, State Key Laboratory of Brain Cognition and Brain-inspired Intelligence Technology, Center for Excellence in Brain Science and Intelligence Technology, Chinese Academy of Sciences, China
- University of Chinese Academy of Sciences, China
Figures
Figure 1 with 1 supplement

Experimental design and behavioral performance in Experiment 1.
(A) Main task procedure. Each block started with a rule cue indicating the categorization rule for this block. On each trial, participants saw two orientations consecutively and were then cued to remember one of the orientations. In the maintenance task (cued by letter ‘P’), participants needed to maintain the remembered orientation as precisely as possible. In the categorization task (cued by letter ‘C’), participants needed to categorize the remembered orientation following the categorization rule of the current block. Maintenance and categorization trials were interleaved within an experimental block of nine trials. Categorization rule (Rule A or Rule B) switched randomly on a block-by-block basis. Response keys (‘F’ and ‘J’) for the categorization task were randomly assigned to the two categories. Each pair of keys displayed at random locations within the category to eliminate information on rule boundaries. (B) Illustration of the two orthogonal categorization rules (Rule A and Rule B). (C) Rule learning performance during learning session (n = 24) for Rule A (purple) and Rule B (pink). (D) Errors in participants’ self-reported rule boundaries. Errors were calculated as the average distance from reported boundaries to ground truth boundaries. (E) Accuracy compared between tasks. Boxplots show the median and the 25th and 75th percentiles. Whiskers extend to 1.5 Inter quartile range (IQR) from the quartiles. Asterisks denote significant results, n.s.: not significant; **p<0.01. (F) Reaction time compared between tasks. Same conventions as (E). (G) Upper panel: accuracy in relation to distance from categorization boundaries. Lower panel: reaction time in relation to distance from categorization boundaries. Shaded areas represent ± SEM.
Figure 1—figure supplement 1
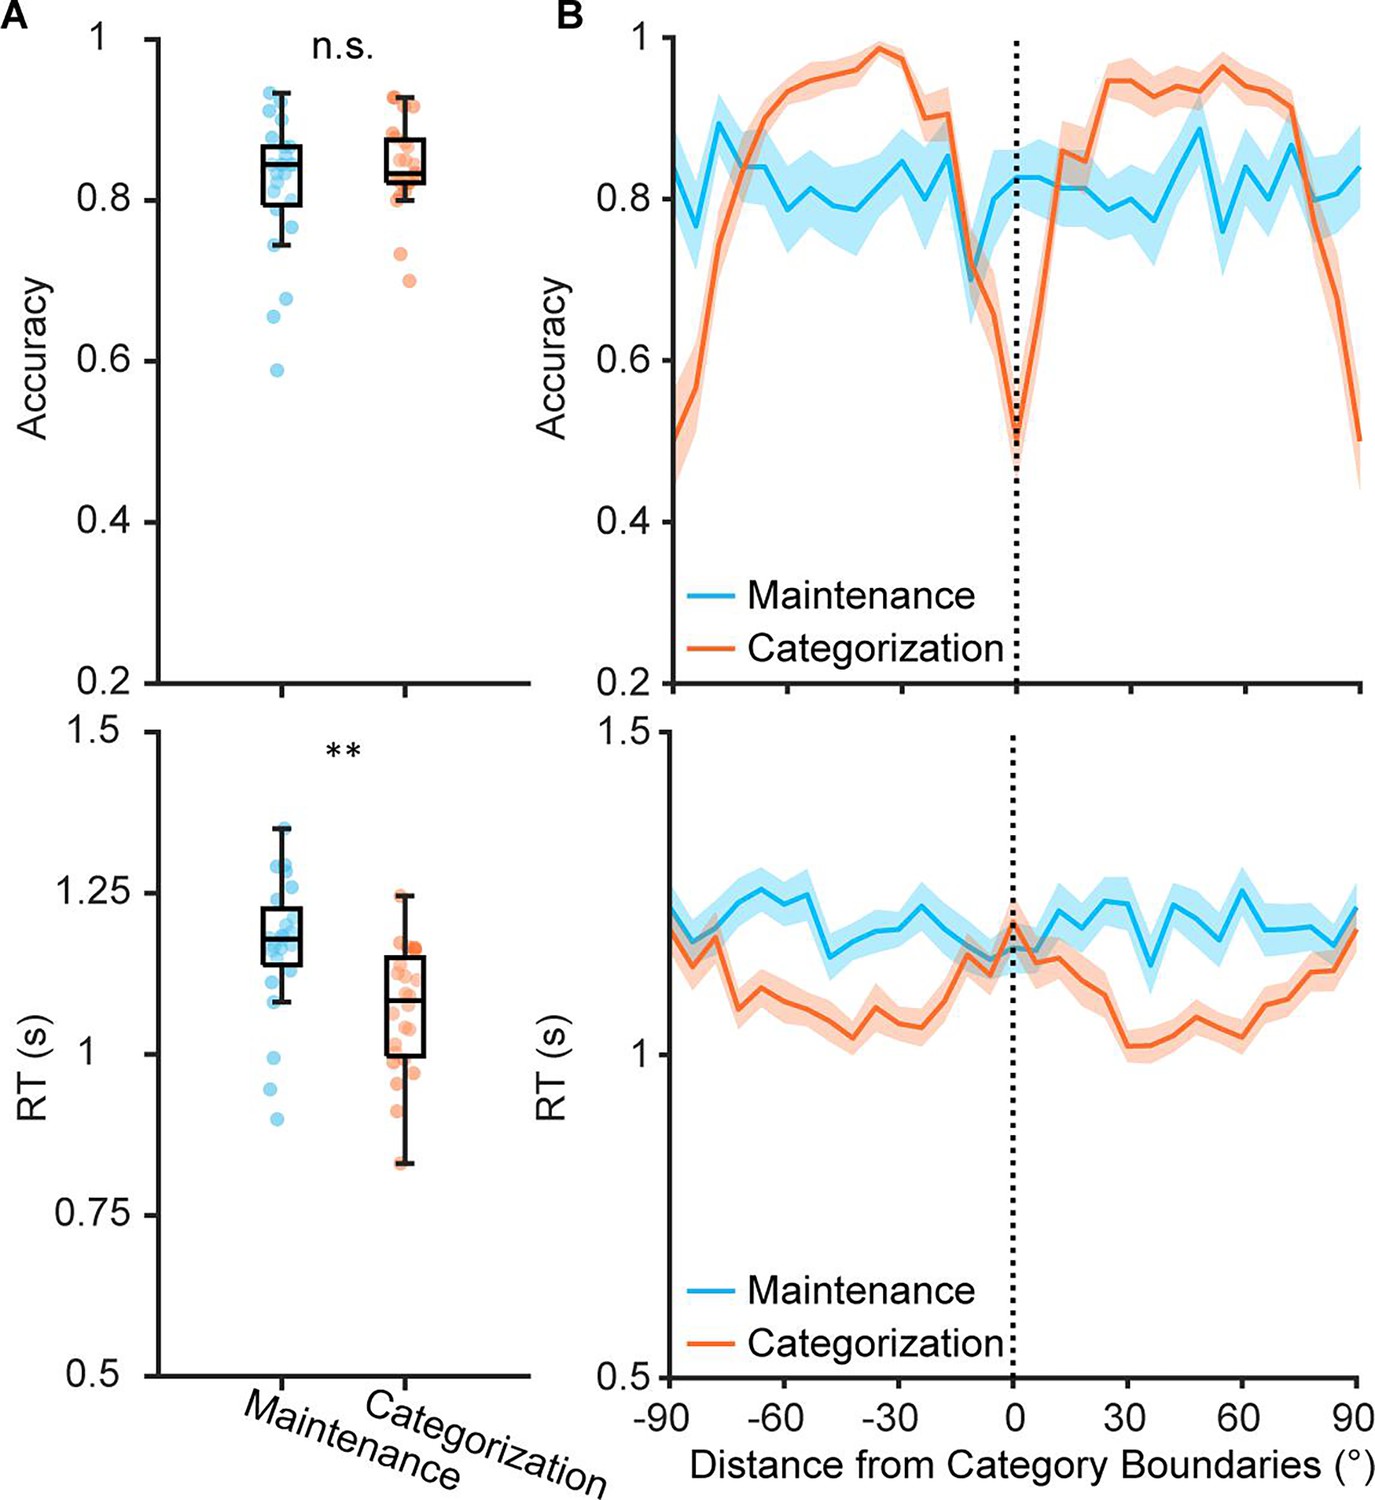
Behavioral performance of Experiment 2.
(A) Accuracy (upper) and reaction time (lower) of maintenance (blue) and categorization (orange) tasks in Experiment 2 (n = 24). Boxplots show the median and the 25th and 75th percentiles. Whiskers extend to 1.5 Inter quartile range (IQR) from the quartiles. Asterisks denote significant results, n.s.: not significant; **p<0.01. (B) Accuracy (upper) and reaction time (lower) for orientations based on their distances from category center for Categorization task. Shaded areas represent ± SEM. Vertical dashed line represents category center.
Figure 2 with 3 supplements
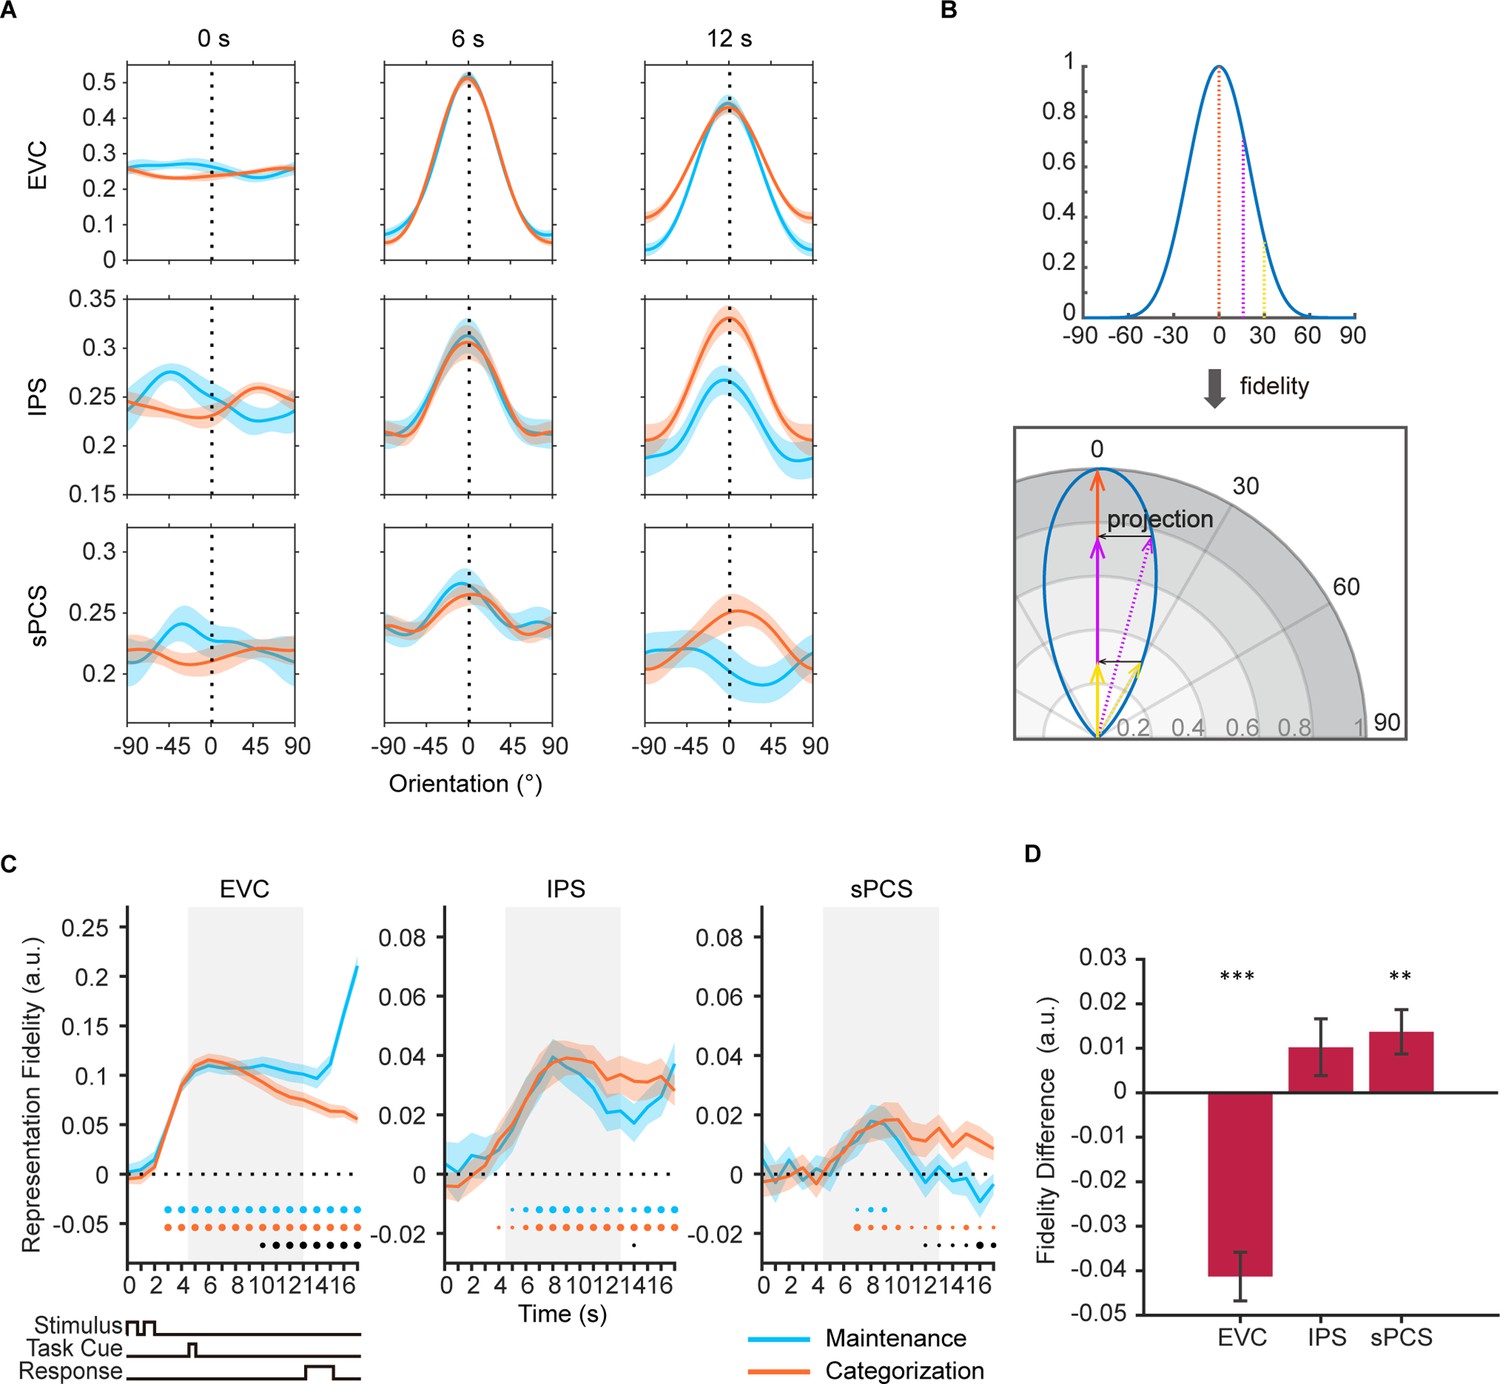
Orientation reconstructions at the population level using inverted encoding models (IEMs) in Experiment 1.
(A) Reconstructed population-level orientation representations from selected time points in early visual cortex (EVC), intraparietal sulcus (IPS), and superior precentral sulcus (sPCS) for maintenance (blue) and categorization (orange) tasks, respectively (n = 24). X-axis represents distance from the cued orientation (at 0°), and y-axis represents reconstructed channel responses in arbitrary units. Significant orientation representation was observed at 6 s and 12 s but not at 0 s. Shaded areas represent ± SEM. (B) To quantify the strength of orientation reconstructions, we calculated the reconstruction fidelity by first projecting the channel response at each orientation onto a vector at the cued orientation and then averaging the projected vectors. (C) Time course of representational fidelity of orientations in EVC, IPS, and sPCS. In this and all subsequent figures with time course data, the time axis reflects raw time points without accounting for the hemodynamic response delay. Gray shaded areas indicate the entire memory delay following task cue. Blue and orange dots at the bottom indicate the FDR-corrected significance of representational fidelity at each time point of the corresponding task at p<0.05 (small), p<0.01 (medium), and p<0.001 (large). The bottom black dots indicate significant difference in representational fidelity between tasks (uncorrected). Horizontal dashed lines represent a baseline of 0. Shaded areas represent ± SEM. (D) Average difference of representational fidelity across 11–16 s in each region of interest (ROI) (from EVC to sPCS: p<0.00001, p=0.063, p=0.007, respectively). Positive difference indicates higher representational fidelity for the categorization task, and vice versa for negative difference. Black asterisks denote FDR-corrected significance, *p<0.05; **p<0.01; ***p<0.001. Error bars represent ± SEM.
-
Figure 2—source data 1
p-values for the time course of inverted encoding model (IEM) results in Figure 2.
Underline denotes significant results (p<0.05).
- https://cdn.elifesciences.org/articles/100287/elife-100287-fig2-data1-v1.xlsx
Figure 2—figure supplement 1
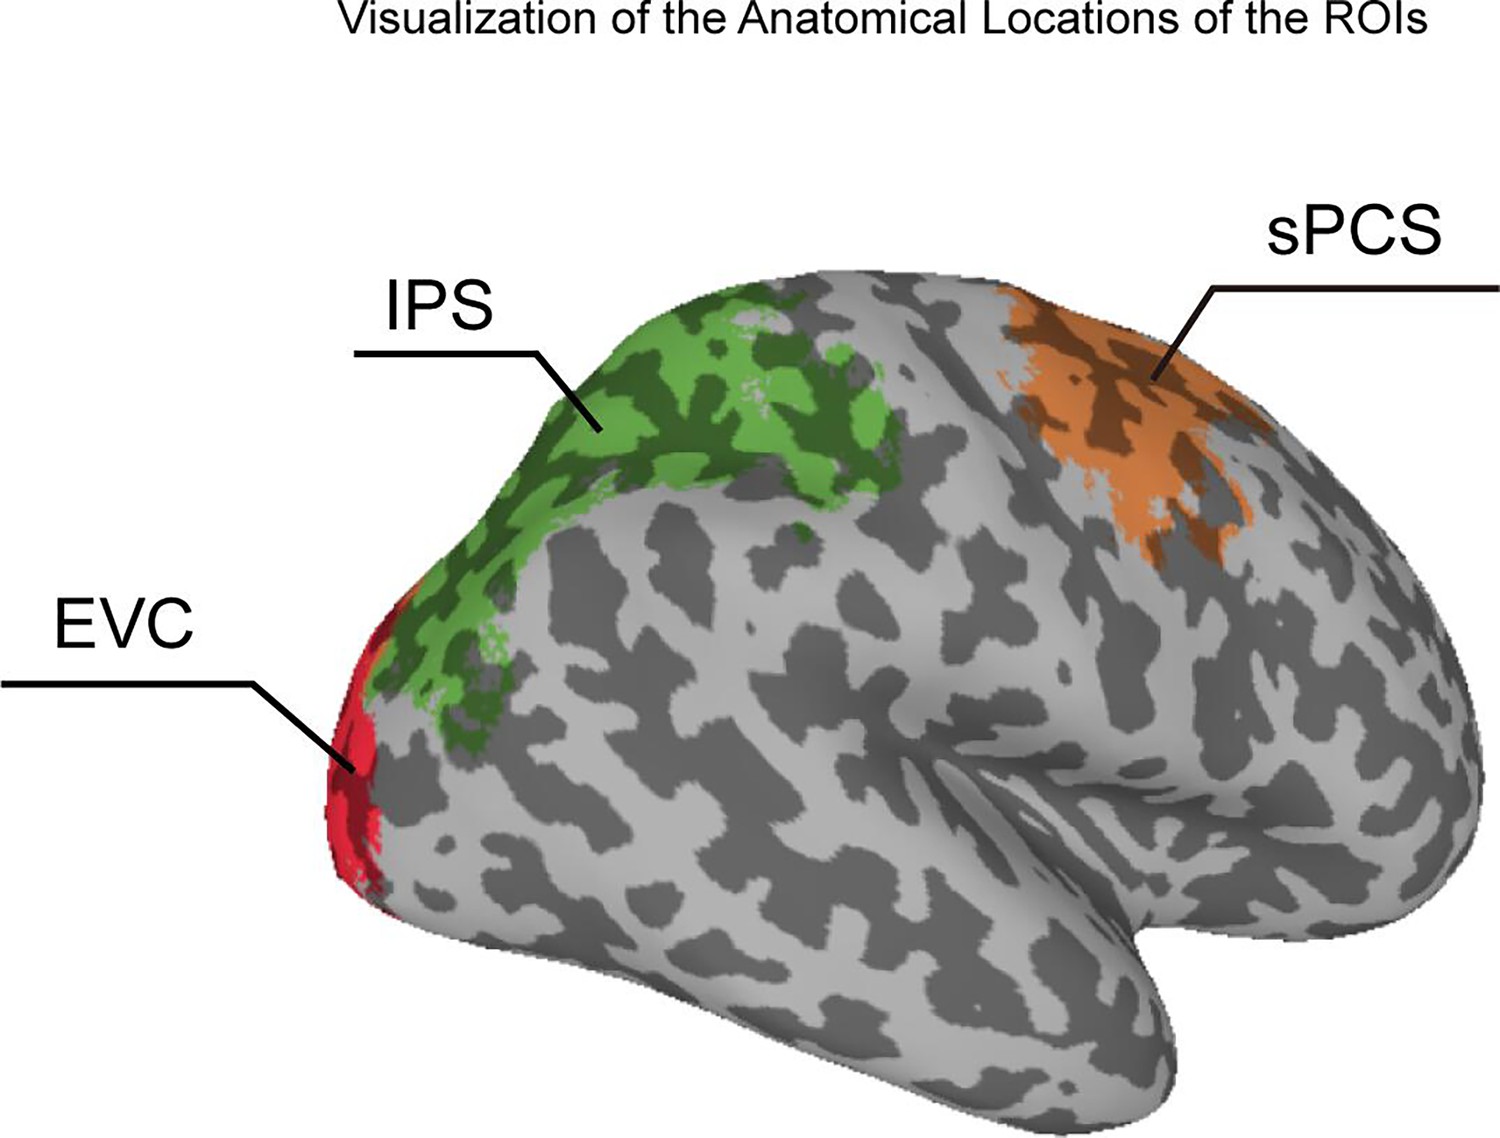
Visualization of the anatomical locations of the regions of interest (ROIs) on the MNI brain.
Figure 2—figure supplement 2
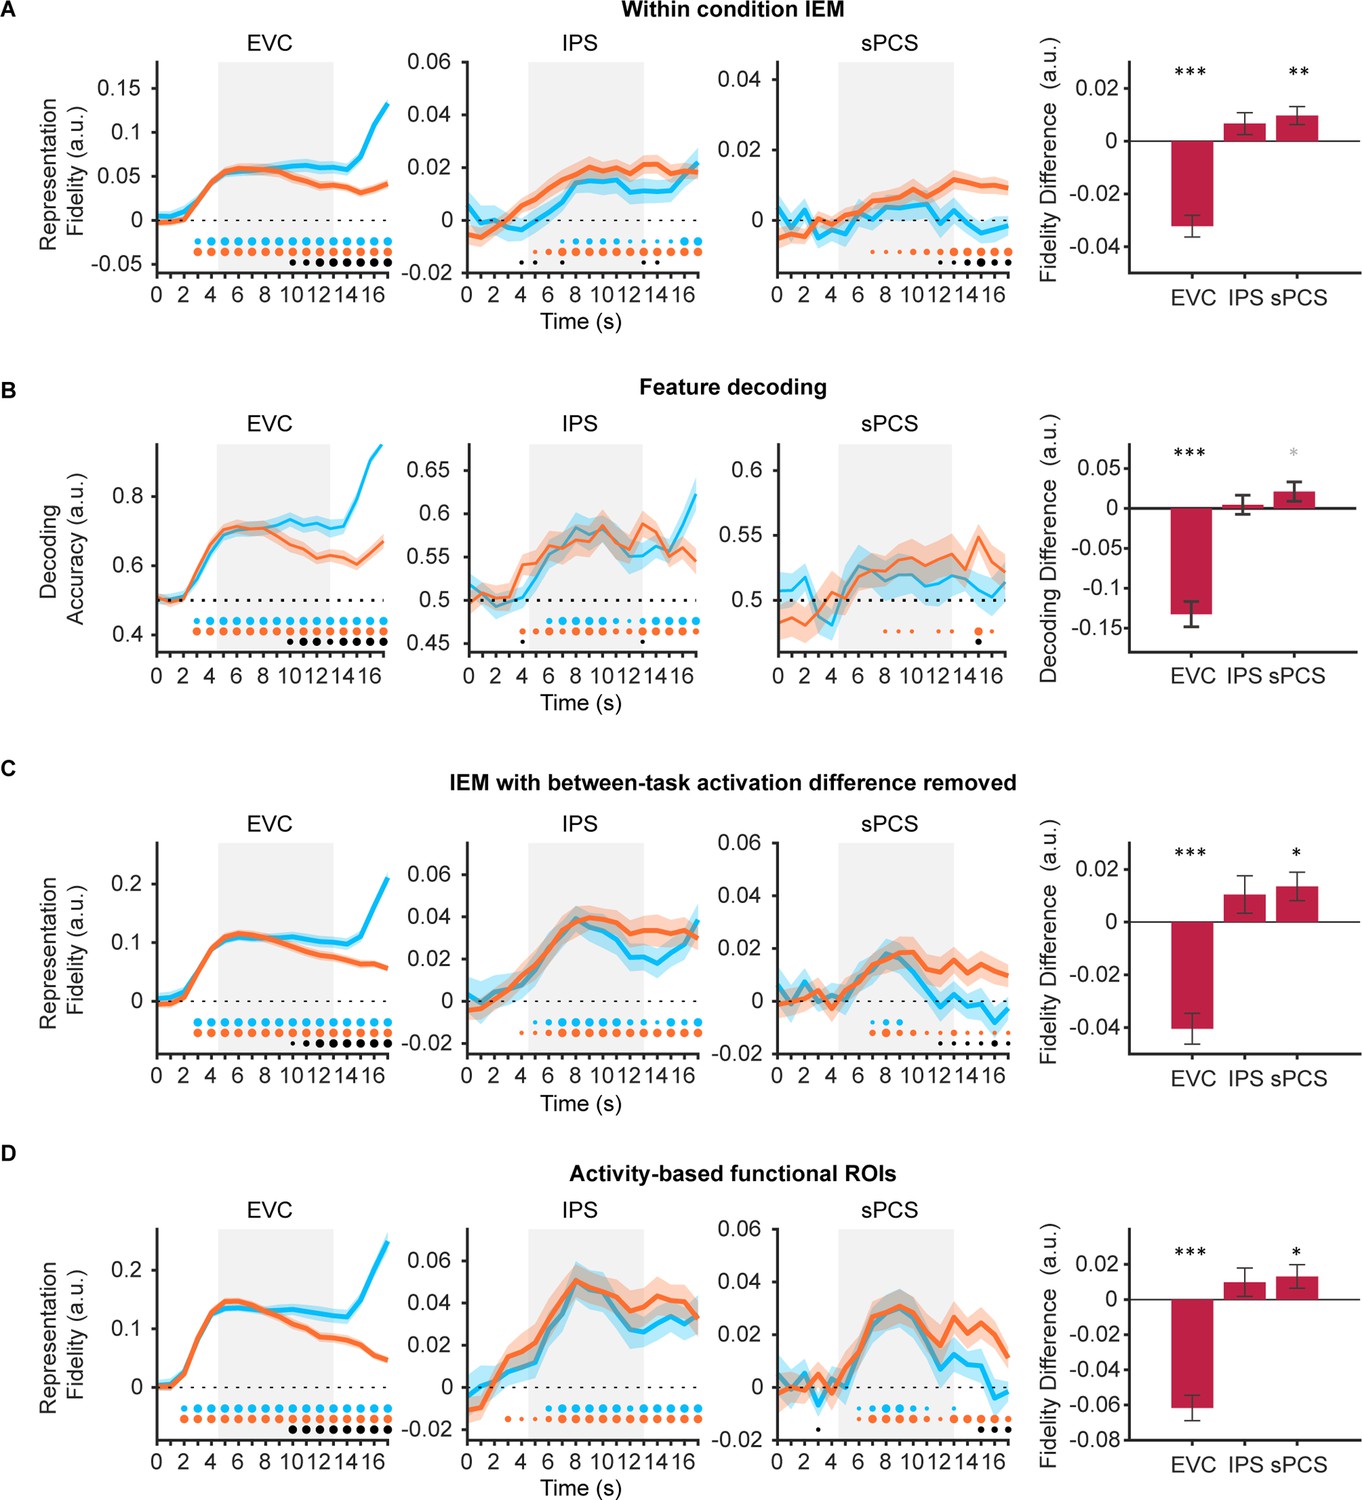
Control analyses for stimulus representation results in Experiment 1.
(A) Time course of representational fidelity of orientations in early visual cortex (EVC), intraparietal sulcus (IPS), and superior precentral sulcus (sPCS) using inverted encoding models (IEMs) trained separately for each condition (n = 24). Gray shaded areas indicate the entire memory delay following task cue. Horizontal dashed lines represent a baseline of 0 or 0.5. Blue and orange dots at the bottom indicate the significance of representational fidelity at each time point of the corresponding task at p<0.05 (small), p<0.01 (medium), and p<0.001 (large). The bottom black dots indicate significant difference in representational fidelity between tasks. Shaded areas represent ± SEM. Bar plot on the right shows corresponding averaged difference between tasks across the late task epoch (11–16 s) in each region of interest (ROI). Positive difference indicates higher representational fidelity for the categorization task, and vice versa for negative difference. Black asterisks denote significance, *p<0.05; **p<0.01; ***p<0.001. Gray asterisk denotes marginal significance p<0.1. Error bars represent ± SEM. (B) Time course of stimulus decoding accuracy. Same conventions as (A). (C) Time course of representational fidelity of orientations after removing voxel-wise mean activation for each condition at each time point. Same conventions as (A). (D) Time course of representational fidelity of orientations in functional ROIs defined by top 500 most selective voxels during sample or delay period. Same conventions as (A).
Figure 2—figure supplement 3
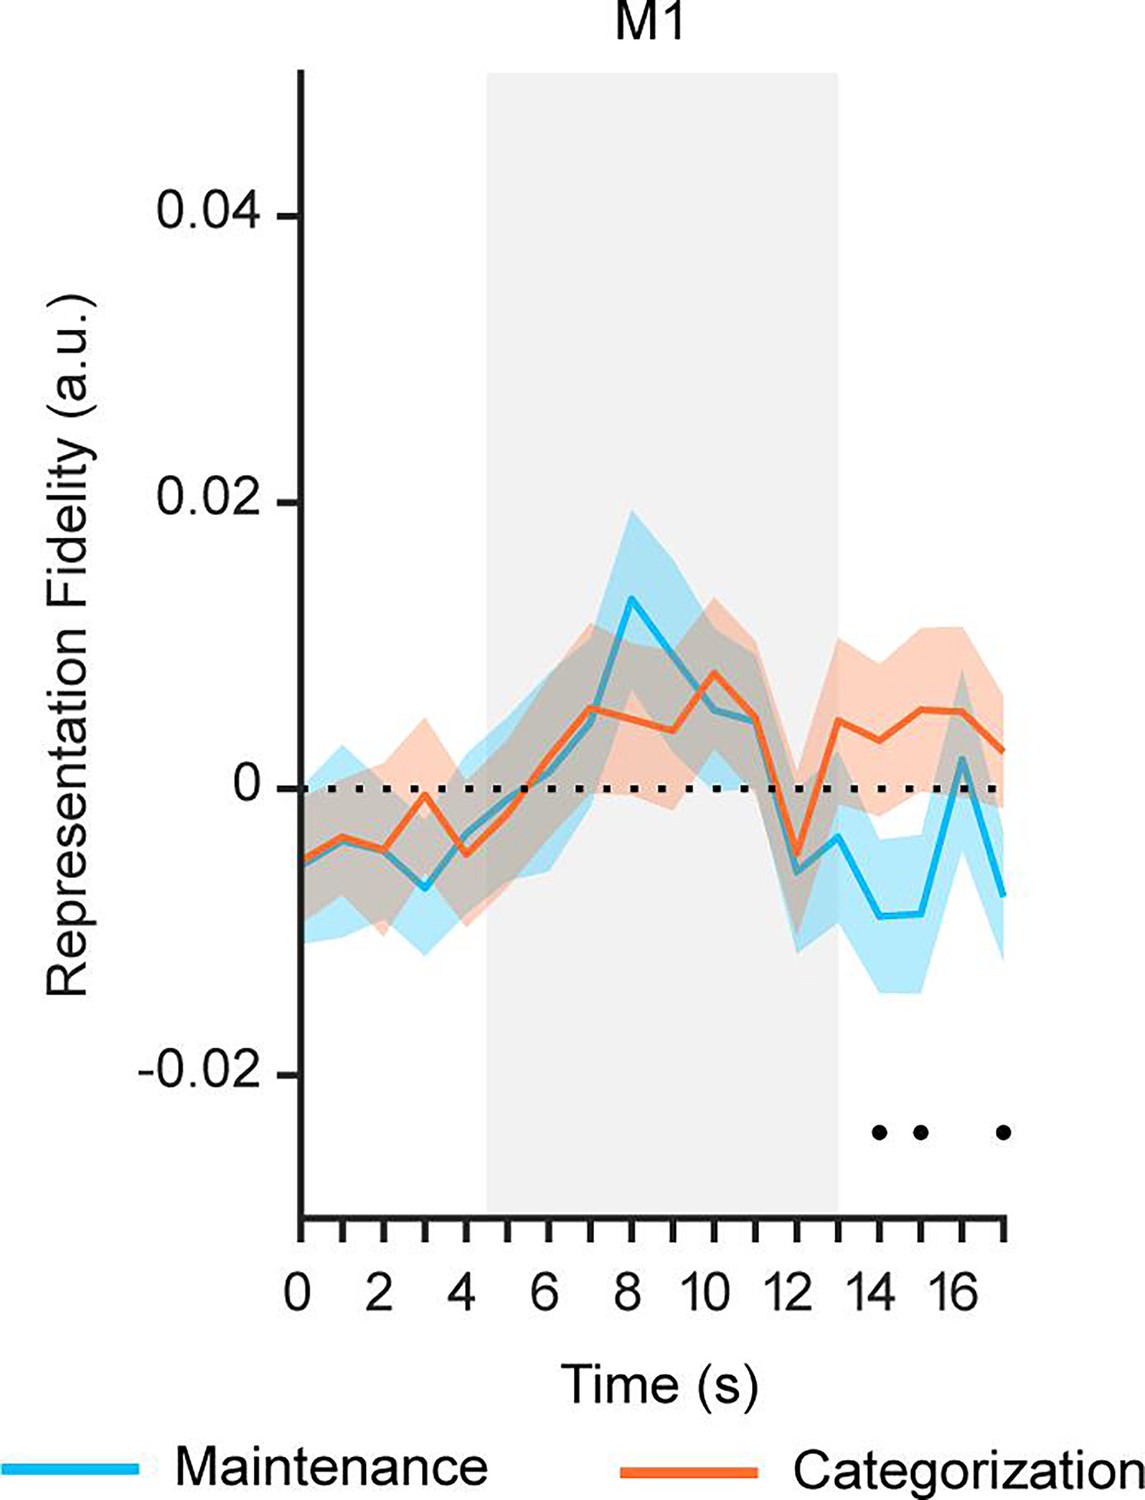
Orientation reconstructions in primary motor cortex (M1) at the population level using IEMs.
Time course of representational fidelity of orientations in M1 in Experiment 1 (n = 24). Gray shaded areas indicate the entire memory delay following task cue. The bottom black dots indicate significant difference in representational fidelity between tasks (uncorrected) at p<0.05. Horizontal dashed lines represent a baseline of 0. Shaded areas represent ± SEM.
Figure 3 with 1 supplement
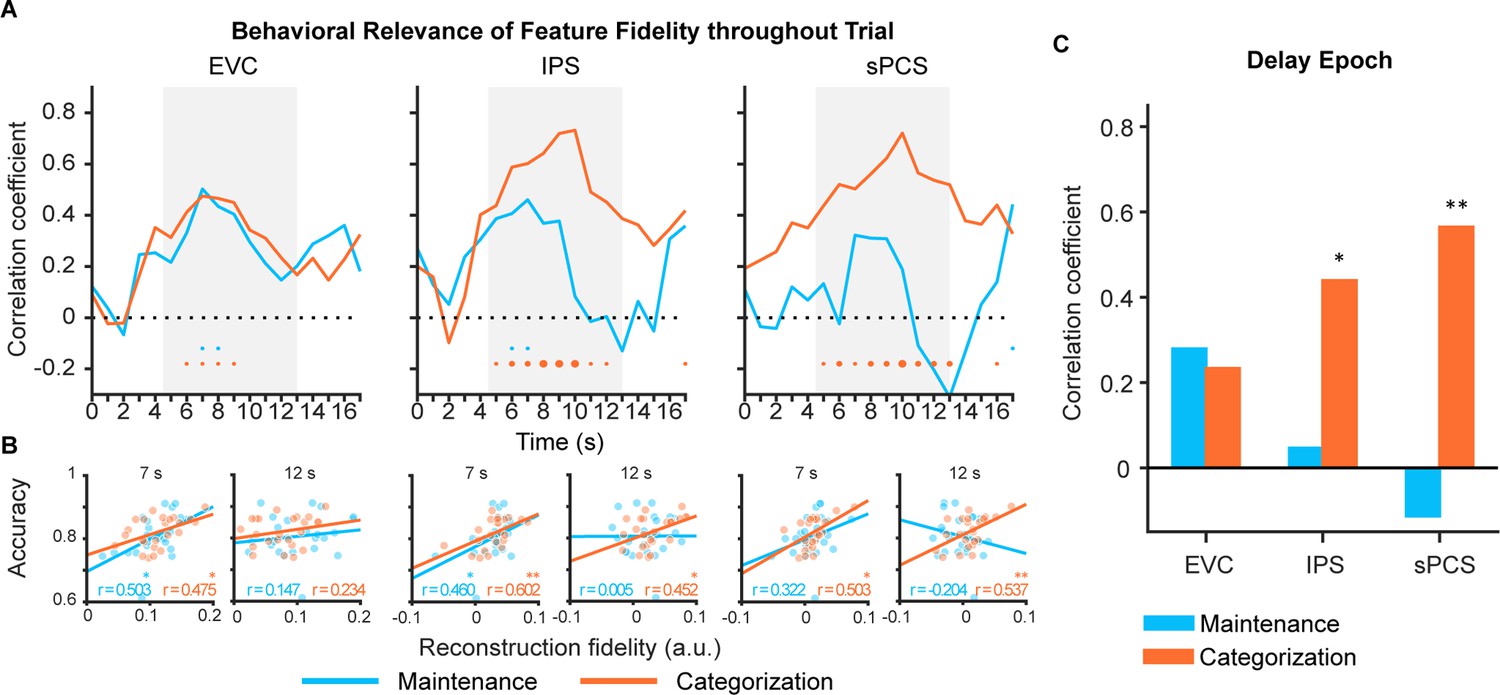
Behavioral correlation of stimulus representation for maintenance (blue) and categorization (orange) tasks in Experiment 1.
(A) Time course of correlation coefficients between behavioral performance and orientation representational fidelity (n = 24) in early visual cortex (EVC), intraparietal sulcus (IPS), and superior precentral sulcus (sPCS). Gray shaded areas indicate the entire memory delay following task cue. Blue and orange dots at the bottom indicate significance of correlation (uncorrected) at each time point at p<0.05 (small), p<0.01 (medium), and p<0.001 (large). (B) Correlation scatter plots at representative time points (7 s and at 12 s) in EVC, IPS, and sPCS. R denotes Pearson correlation coefficients. (C) Correlation between behavioral performance and orientation representational fidelity collapsed across the late epoch (11–16 s). Asterisks denote significant results, *p<0.05; **p<0.01.
-
Figure 3—source data 1
p-values for the time course of correlation results in Figure 3.
Underline denotes significant results (p<0.05).
- https://cdn.elifesciences.org/articles/100287/elife-100287-fig3-data1-v1.xlsx
Figure 3—figure supplement 1
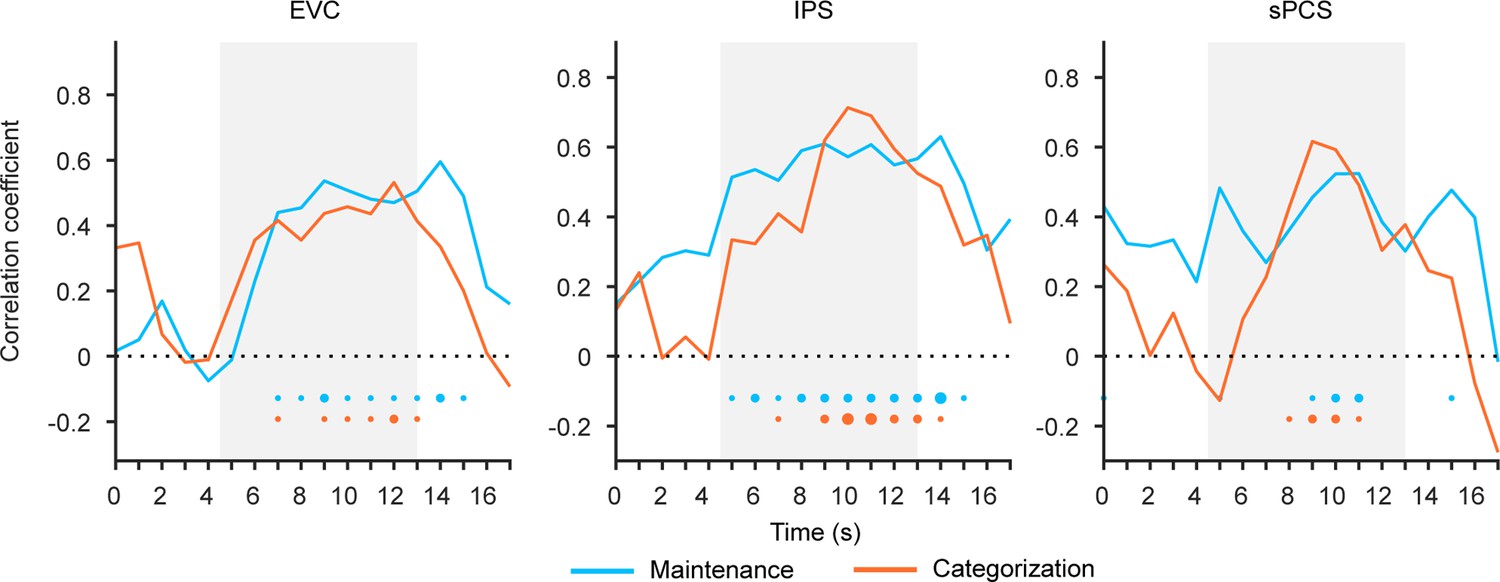
Behavioral correlation of stimulus representation in Experiment 2.
Time course of correlation coefficients (n = 24) in early visual cortex (EVC), intraparietal sulcus (IPS), and superior precentral sulcus (sPCS). Correlation was performed between strength of stimulus representations and behavioral performance (accuracy) for maintenance (blue) and categorization (orange) tasks. Gray shaded areas indicate the entire memory delay following task cue. Horizontal dashed lines represent a baseline of 0. Bottom dots indicate the significance of corresponding analyses at each time point of the corresponding task at p<0.05 (small), p<0.01 (medium), and p<0.001 (large).
Figure 4
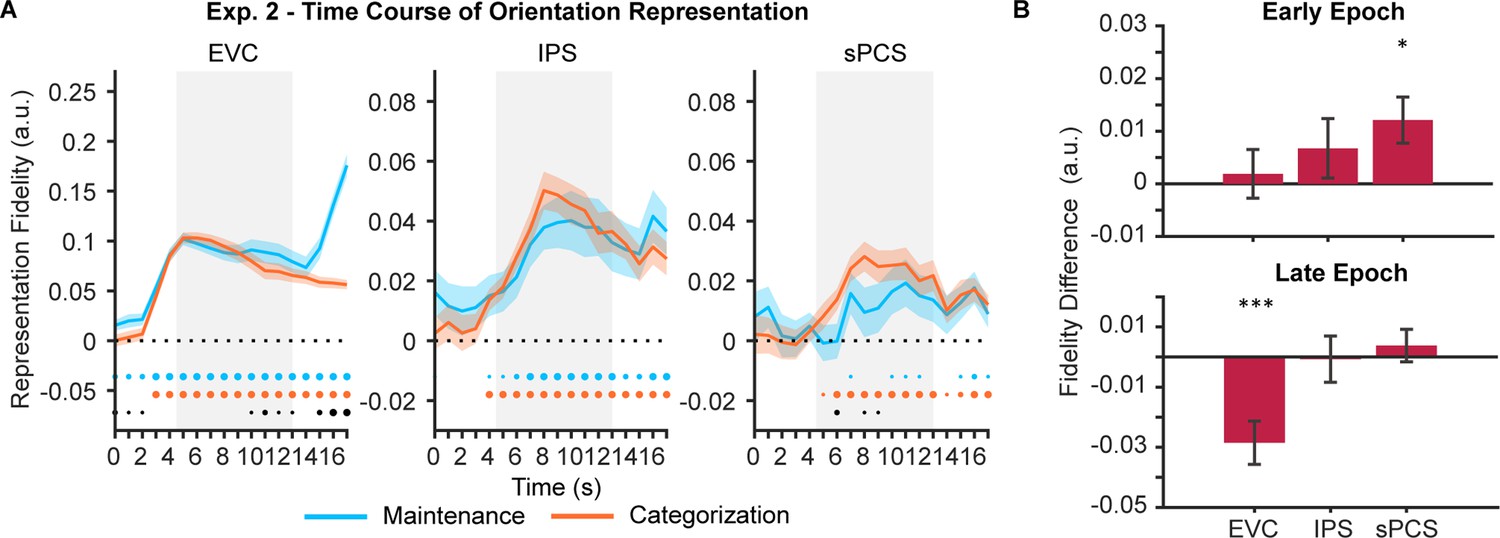
Orientation reconstructions at the population level using inverted encoding models (IEMs) in Experiment 2.
(A) Time course of representational fidelity of orientations (n = 24) in early visual cortex (EVC), intraparietal sulcus (IPS), and superior precentral sulcus (sPCS). Gray shaded areas indicate the entire memory delay following task cue. Blue and orange dots at the bottom indicate the FDR-corrected significance of representational fidelity at each time point of the corresponding task at p<0.05 (small), p<0.01 (medium), and p<0.001 (large). The bottom black dots indicate significant difference in representational fidelity between tasks (uncorrected). Horizontal dashed lines represent a baseline of 0. Shaded areas represent ± SEM. (B) Average difference of representational fidelity across an early (top, 5–10 s) and a late (bottom, 11–16 s) task epoch in each region of interest (ROI). Positive difference indicates higher representational fidelity for the categorization task, and vice versa for negative difference (FDR-corrected). Error bars represent ± SEM. *p<0.05; ***p<0.001.
-
Figure 4—source data 1
p-values for the time course of inverted encoding model (IEM) results in Figure 4.
Underline denotes significant results (p<0.05).
- https://cdn.elifesciences.org/articles/100287/elife-100287-fig4-data1-v1.xlsx
Figure 5 with 3 supplements
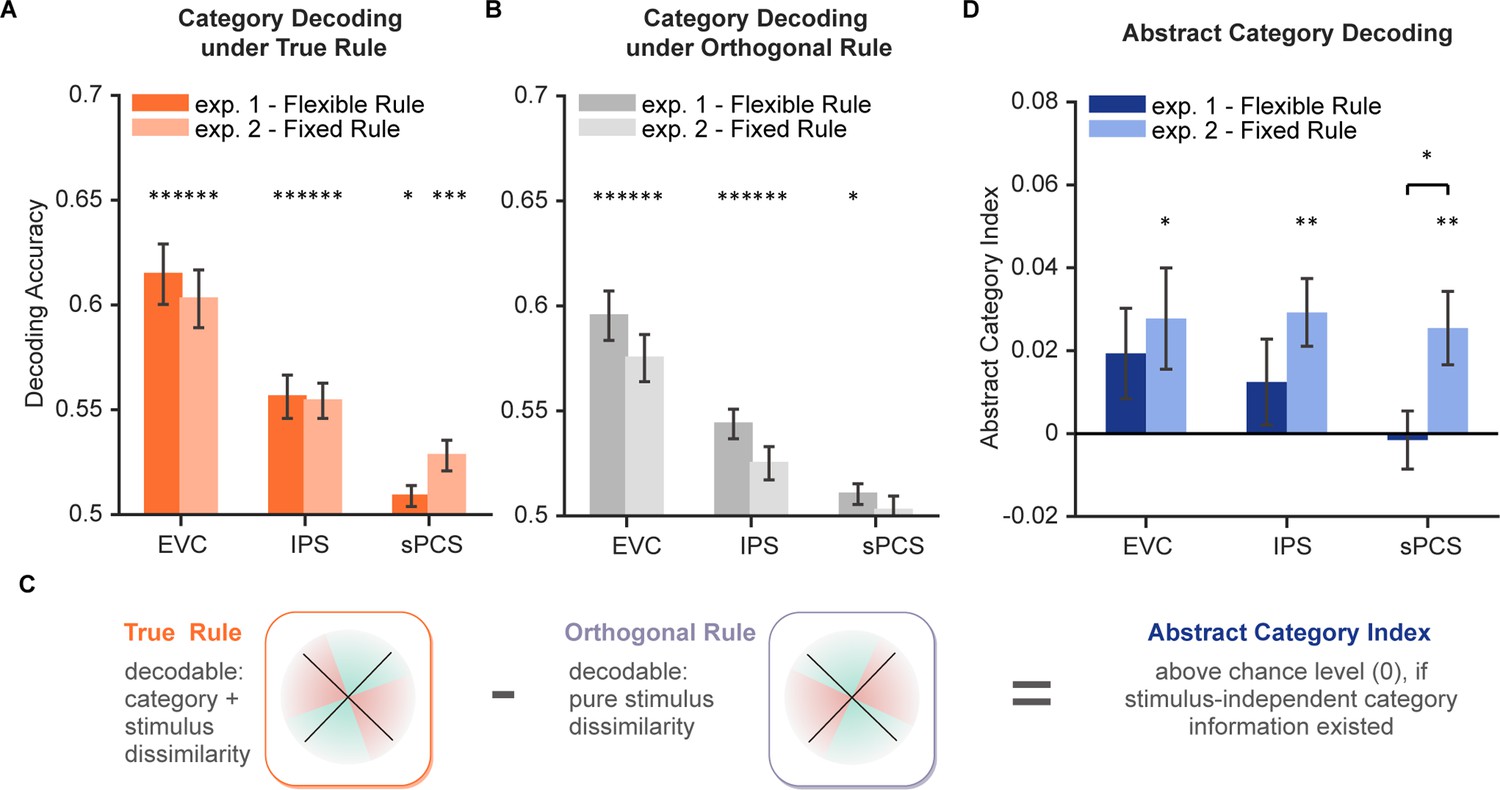
Decoding performance for category and abstract category information.
(A) Average category decoding accuracy using category labels under true rule across the late task epoch (11–16 s) in each region of interest (ROI) of both experiments (n = 24 for each experiment). (B) Average category decoding accuracy using category labels under orthogonal rule across the late task epoch (11–16 s) in each ROI of both experiments. (C) Schematic illustration of abstract category decoding. In the categorization task, category information can be decoded using category labels according to the true categorization rule. On the other hand, category can also be decoded due to stimulus similarity. Thus, to remove stimulus-dependent categorical information, we calculated an abstract category index by removing decoding accuracy using orthogonal category boundaries (assuming comparable stimulus-dependent effect) from that using true rule boundaries. (D) Average abstract category decoding index across the late task epoch (11–16 s) in each ROI of both experiments. Black asterisks denote FDR-corrected significance, *p<0.05; **p<0.01; ***p<0.001. Error bars represent ± SEM.
Figure 5—figure supplement 1
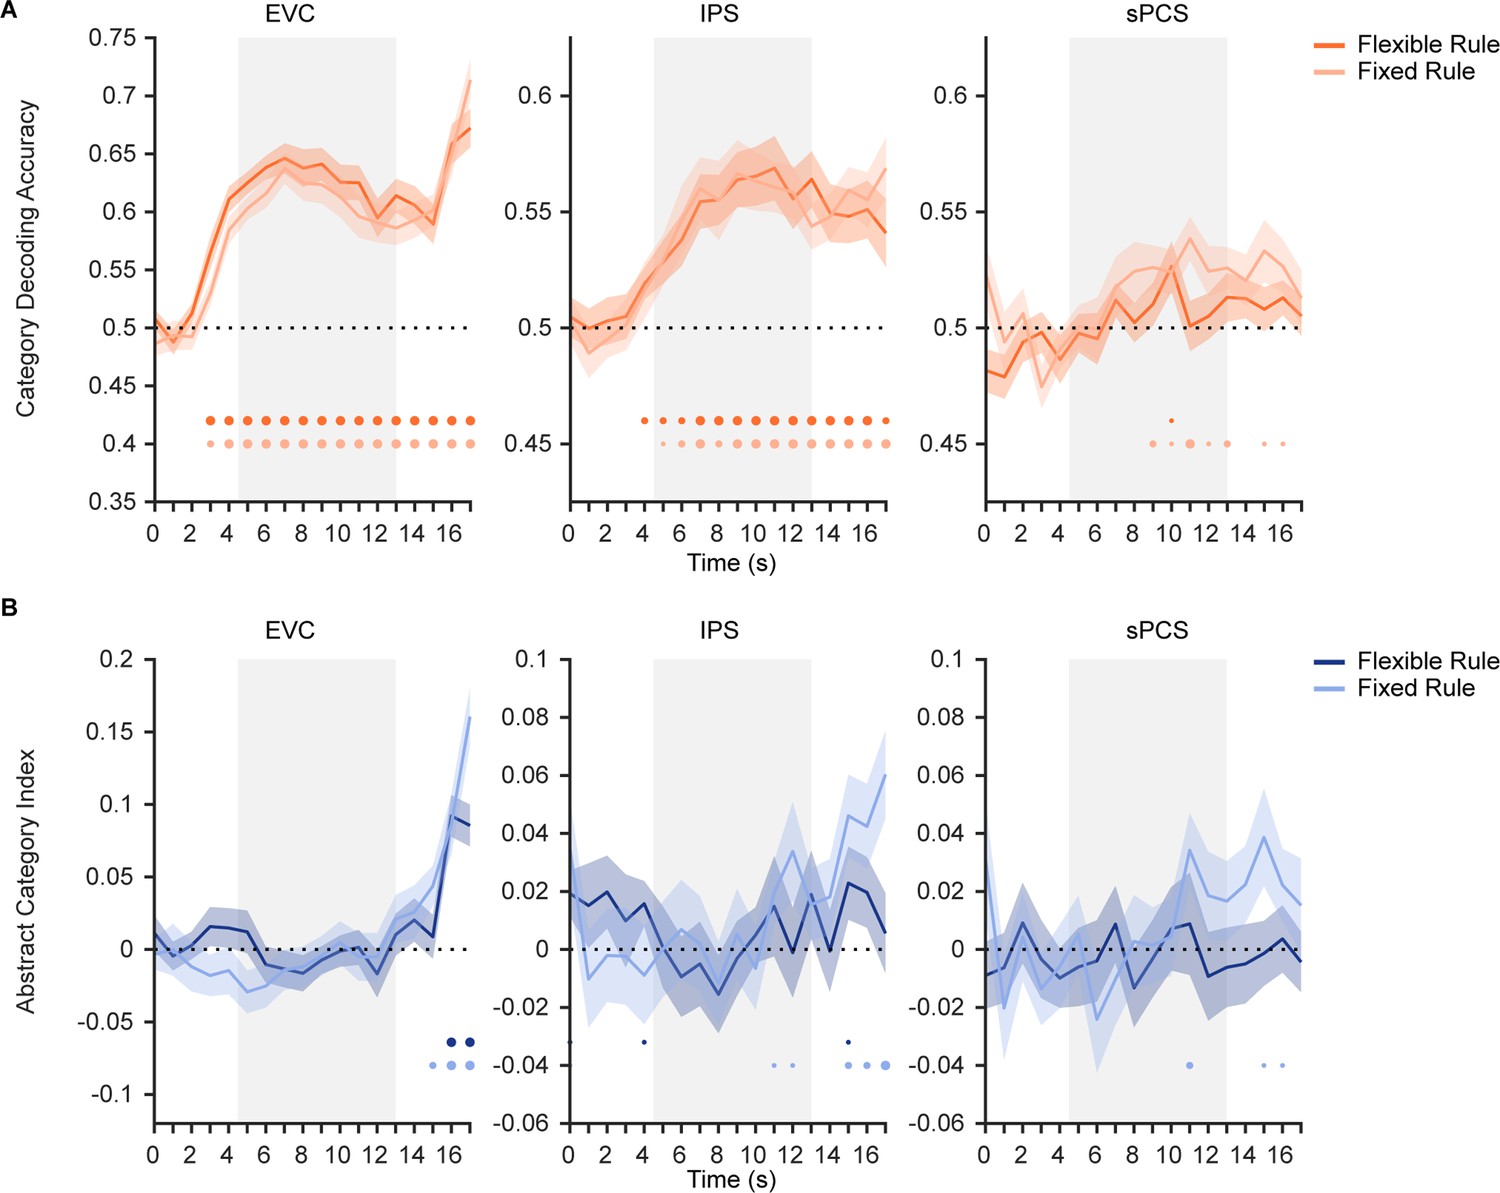
Time course of category and abstract category decoding performance in Experiment 1 and 2.
(A) Time course of category decoding strength in Experiment 1 with flexible rule (orange; n = 24) and in Experiment 2 with fixed rule (light orange; n = 24). Horizontal dashed lines represent the chance level of 0.5. Gray shaded areas indicate the entire memory delay following task cue. Bottom dots indicate uncorrected significance of decoding accuracy at each time point at p<0.05 (small), p<0.01 (medium), and p<0.001 (large). Shaded areas represent ± SEM. (B) Time course of abstract category decoding strength in Experiment 1 (dark blue) and in Experiment 2 (light blue). Horizontal dashed lines represent a baseline of 0.
Figure 5—figure supplement 2
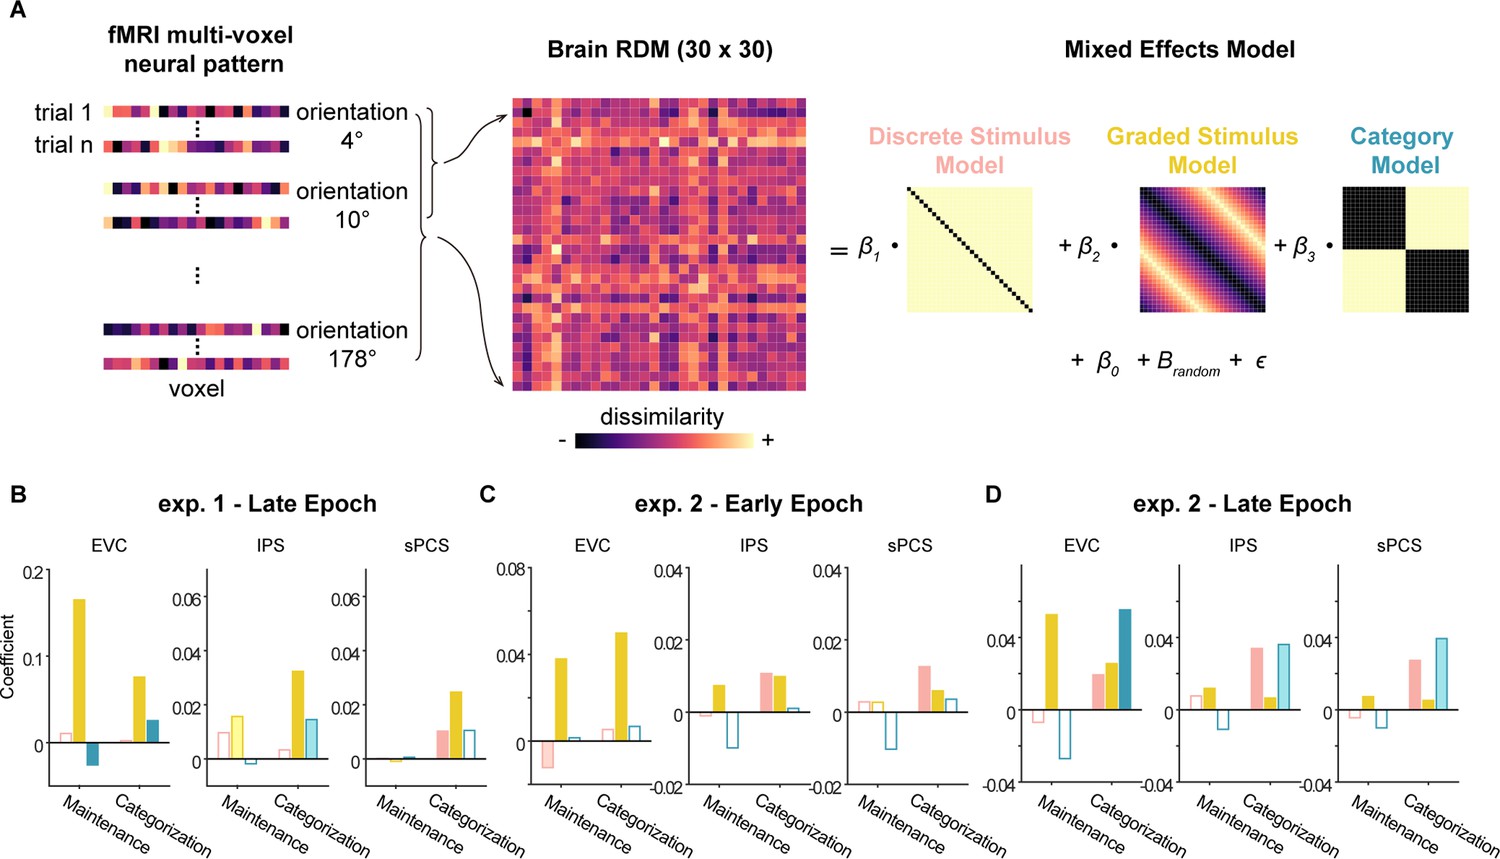
Delineating stimulus and category effects using linear mixed-effects modeling.
(A) To dissociate the contribution of stimulus and abstract category representations to neural activities, we fitted neural representational dissimilarity matrices (RDMs) with three model RDMs. To construct individual neural RDMs between orientations, we first averaged all trials for each orientation within the same condition and then calculated the distance between each pair of orientations. Separately calculated for maintenance and categorization tasks, we then fitted neural RDMs with linear mixed-effects models to estimate the contribution of each model (discrete stimulus model, graded stimulus model, and category model) to the neural RDM over delay periods. (B) Fit of discrete stimulus model (pink), graded stimulus model (yellow), and category model (green) in early visual cortex (EVC), intraparietal sulcus (IPS), and superior precentral sulcus (sPCS) for the maintenance and categorization tasks in the late epoch of Experiment 1 (n = 24). Darker bars indicate significant main effect of specific models (p<0.05), lighter bars indicate marginally significance (p<0.1), and hollow bars indicate no significance. (C) Results for early epoch in Experiment 2. Same conventions as (B). (D) Results for late epoch in Experiment 2. Same conventions as (B).
Figure 5—figure supplement 3
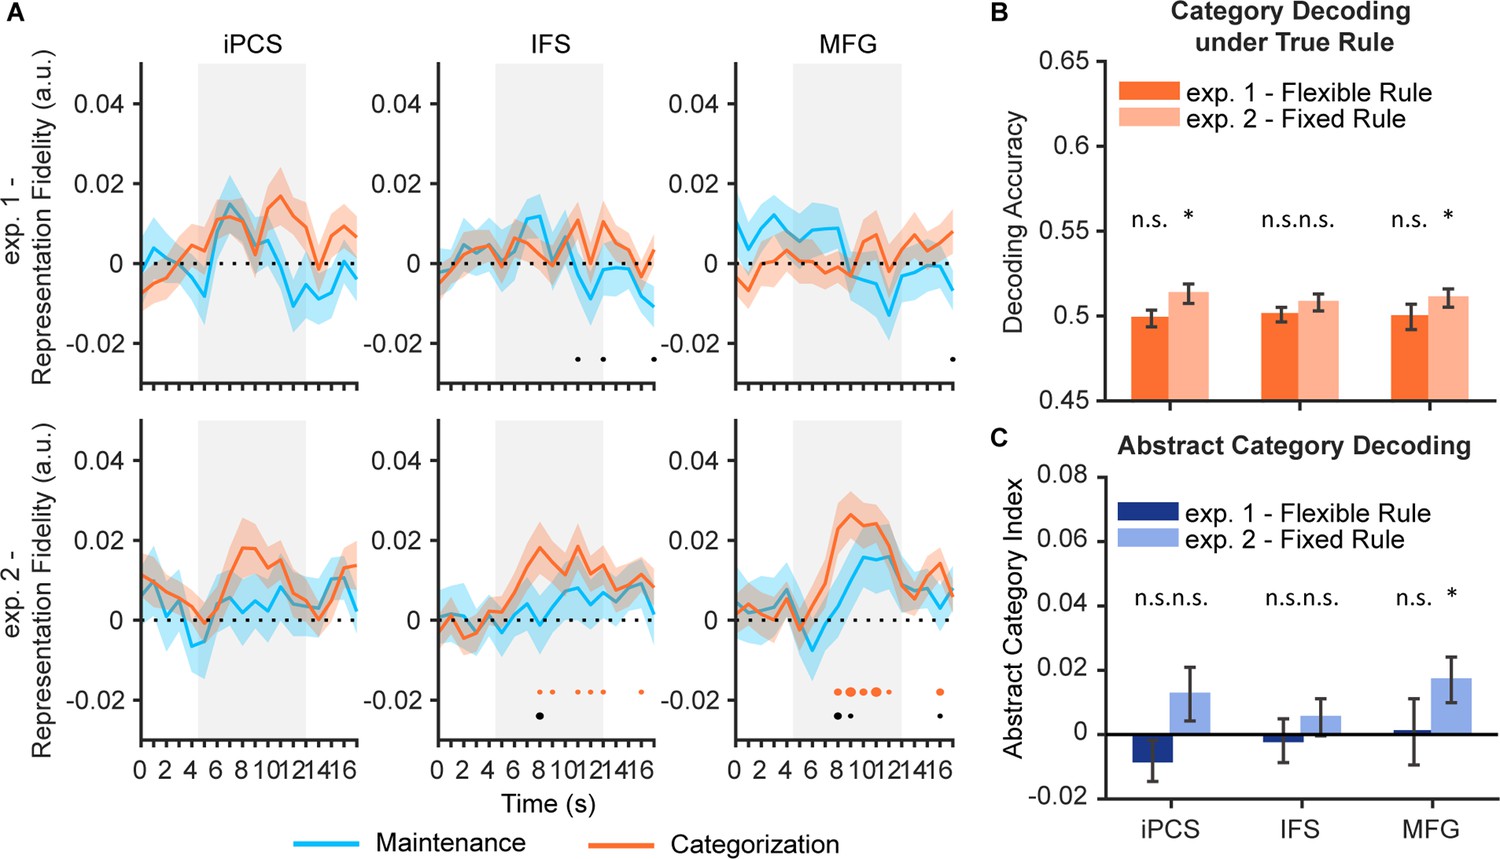
Stimulus, category, and abstract category results in additional frontal regions in Experiment 1 and 2.
(A) Time course of representational fidelity of orientations in inferior precentral sulcus (iPCS), inferior frontal sulcus (IFS), and middle frontal gyrus (MFG) in Experiment 1 (top panel; n = 24) and Experiment 2 (bottom panel; n = 24). Gray shaded areas indicate the entire memory delay following task cue. Blue and orange dots at the bottom indicate the FDR-corrected significance of representational fidelity at each time point of the corresponding task at p<0.05 (small), p<0.01 (medium), and p<0.001 (large). The bottom black dots indicate significant difference in representational fidelity between tasks (uncorrected). Horizontal dashed lines represent a baseline of 0. Shaded areas represent ± SEM. (B) Average category decoding accuracy across the late task epoch (11–16 s) in iPCS, IFS, and MFG of both experiments. (C) Average abstract category decoding index across the late task epoch (11–16 s) in the same regions of both experiments, black asterisks denote FDR-corrected significance, n.s.: not significant; *p<0.05. Error bars represent ± SEM.
Figure 6 with 1 supplement
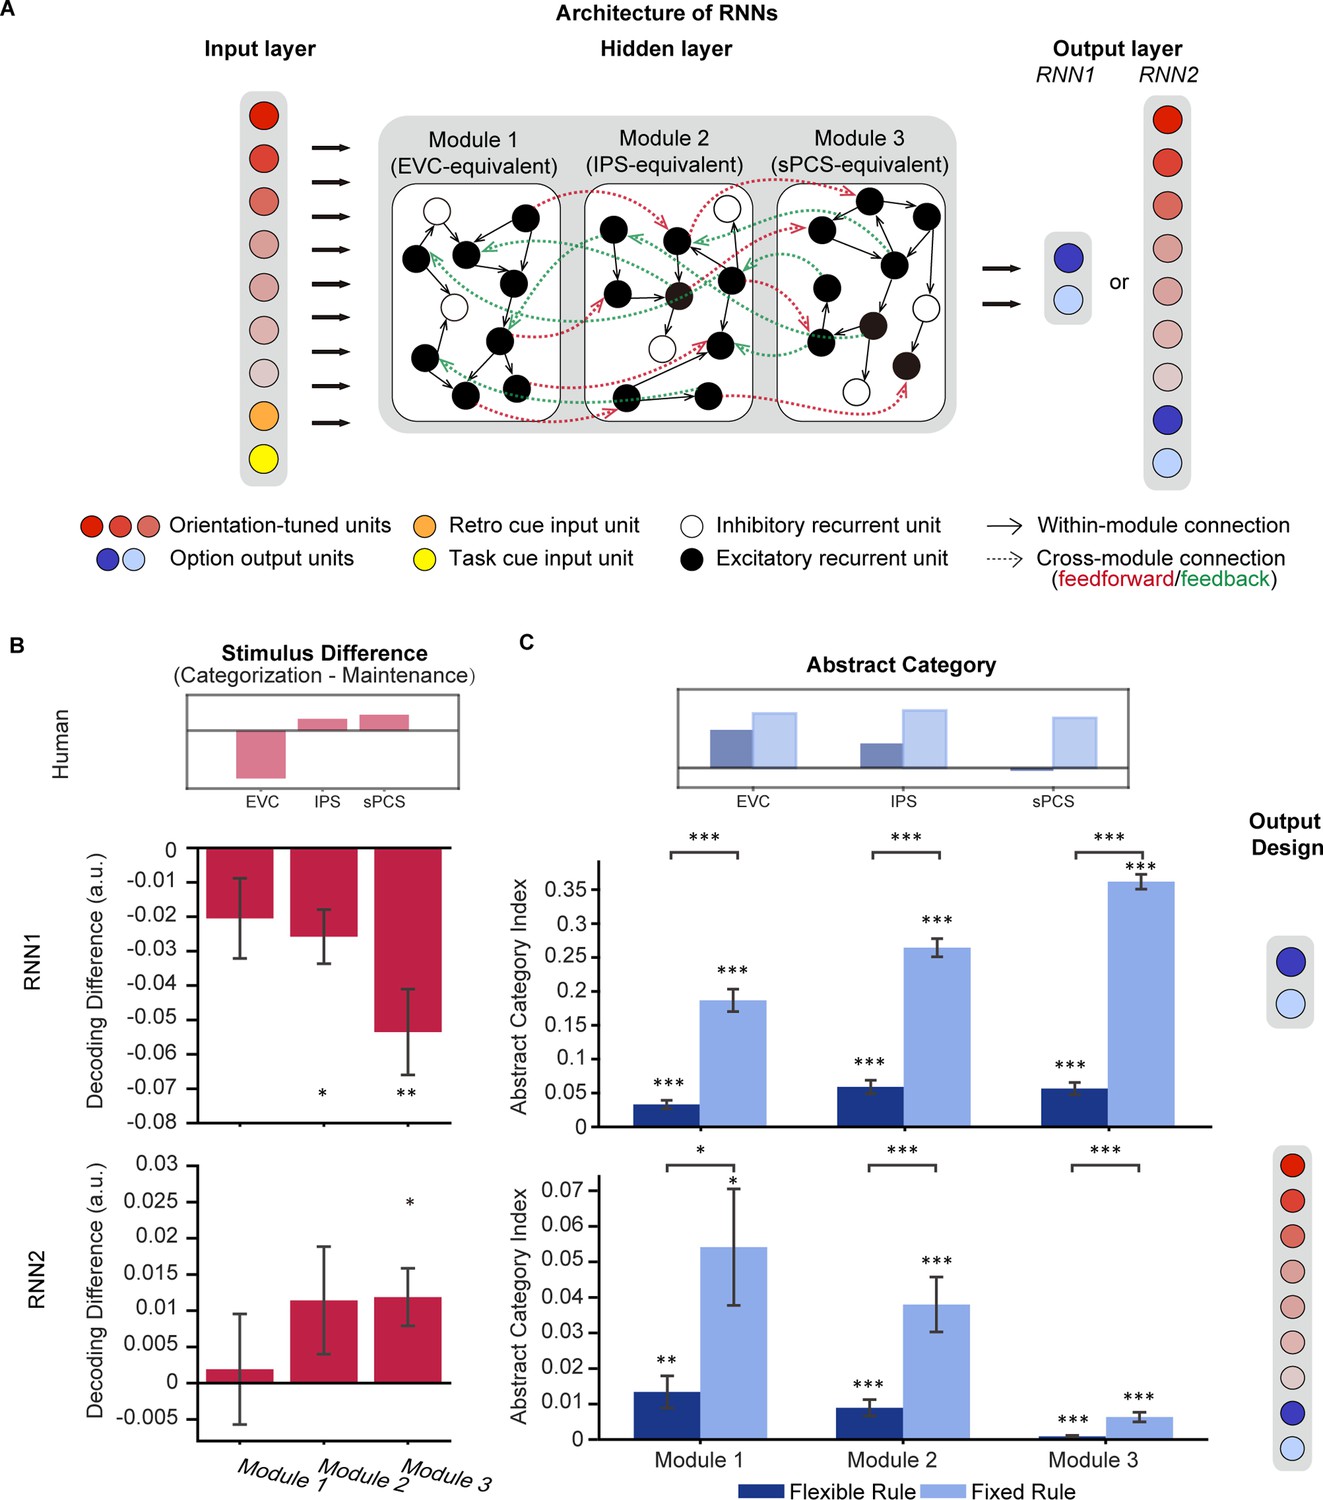
Architecture of recurrent neural networks (RNNs) and simulation results.
(A) All networks consist of three layers of artificial units: the input, hidden, and output layers. For both RNN1 and RNN2, the input layer contains 20 units including 15 orientation-tuned, red units and 5 cue units (retro-cue and task cue, orange and yellow). The hidden layer consists of three modules of 200 recurrent units with short-term synaptic plasticity (STSP), further divided into 80% excitatory (black) and 20% inhibitory (white). Connectivity within each module (black arrow) is denser compared to between modules (red and green arrows), which only occur between excitatory units. Only excitatory units in module 1 receive projections from the input layer and only excitatory units in module 3 project to the output units. For RNN1, networks output (0,1) or (1,0) through the 2 units in the output layer to indicate responses. For RNN2, the network output (0,1) or (1,0) to report the category to which the cued orientation belonged in the categorization task, or (0,0) in the maintenance task (blue units). Importantly, the models also output the orientation itself through 15 additional orientation-tuned units (red). (B) Difference in stimulus decoding between tasks in RNN1 (upper panel; n = 20) and RNN2 (lower panel; n = 20). Results were averaged across the delay period. Positive difference indicates higher decoding accuracy for the categorization task, and negative difference indicates higher decoding accuracy for maintenance. The inset above illustrates stimulus difference in human fMRI results during late epoch in Experiment 1 to provide a reference for expected patterns in RNNs. (C) Average abstract category information across the delay period for RNN1 (upper panel) and RNN2 (lower panel). The inset above illustrates abstract category representation in human fMRI. Error bars represent ± SEM. Black asterisks denote FDR-corrected significance, *p<0.05; **p<0.01; ***p<0.001.
Figure 6—figure supplement 1
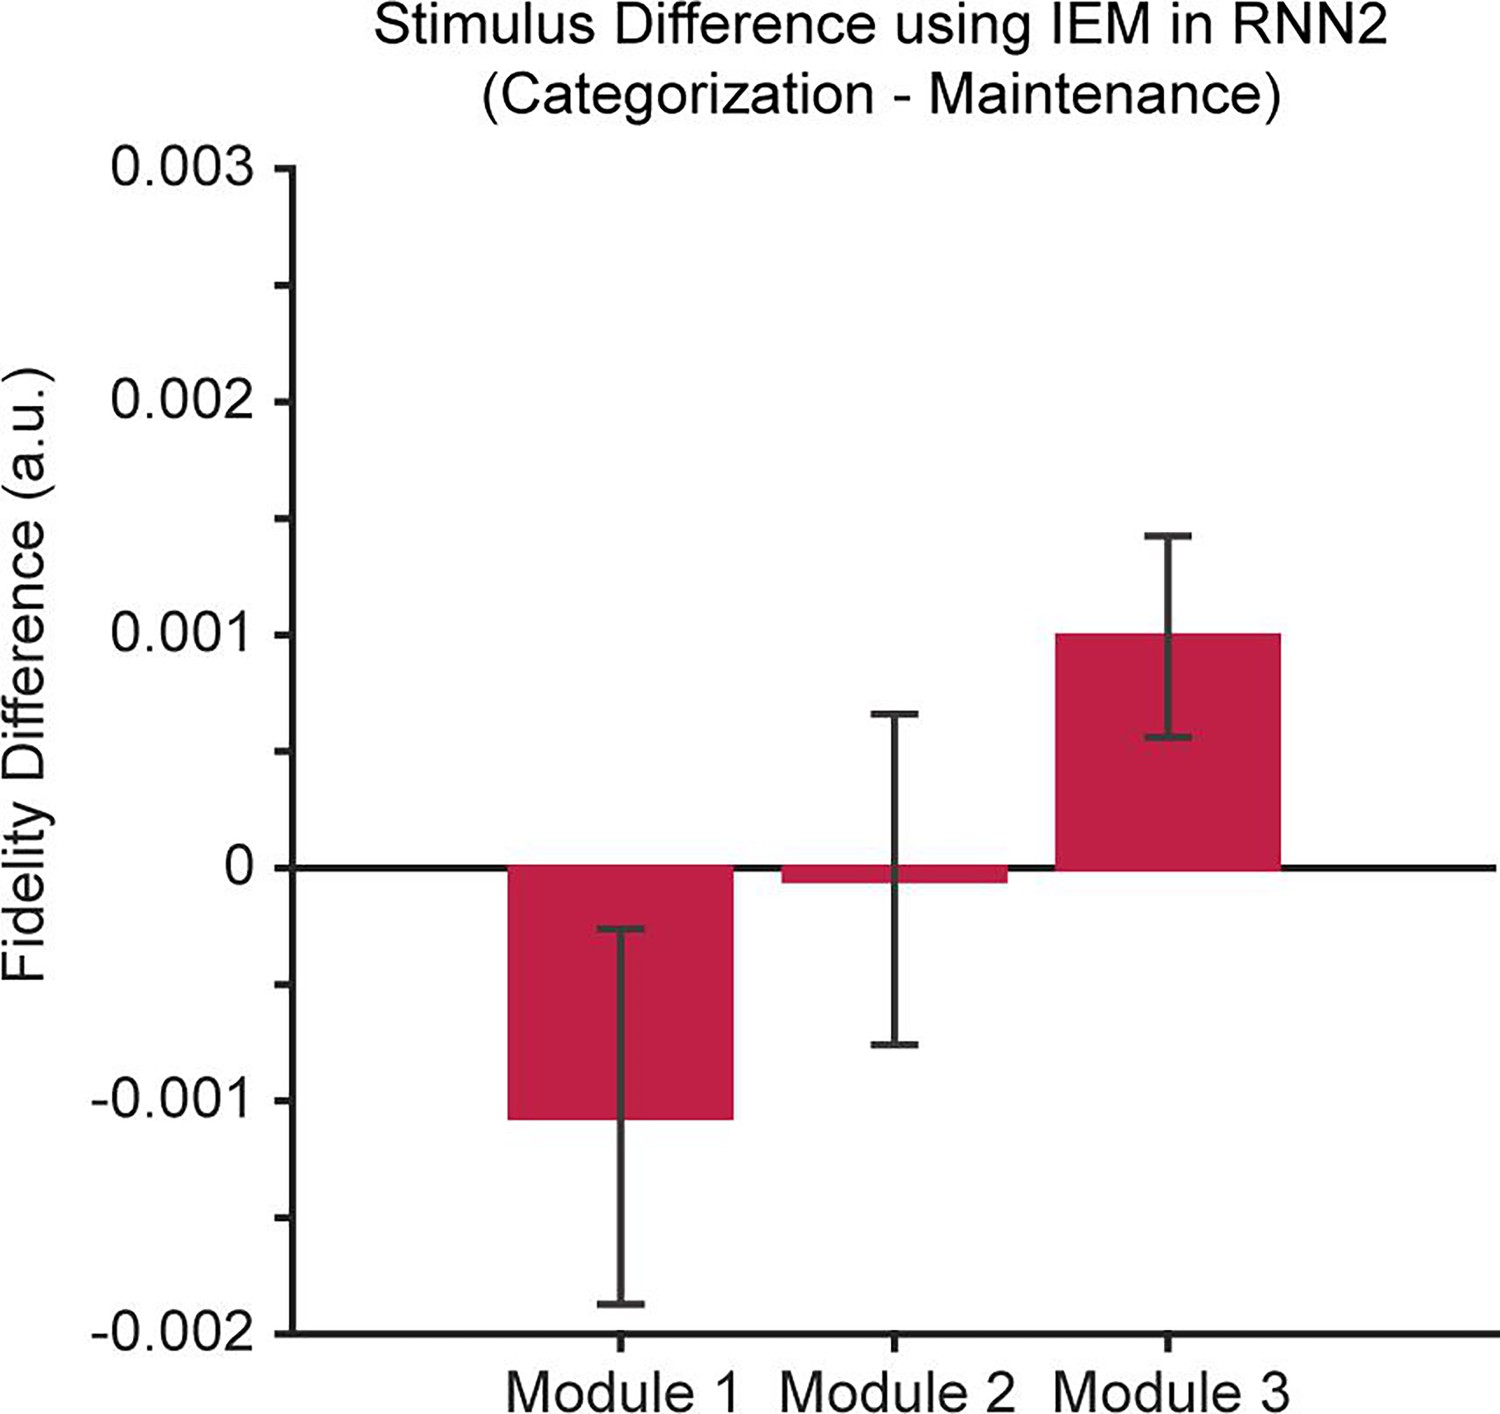
Recurrent neural network (RNN) results using inverted encoding models (IEMs).
Difference in the IEM fidelity of orientation representations between tasks in RNN2 (n = 20). Results were averaged across the delay period. Uncorrected p-values from Module 1–3: 0.10, 0.48, 0.01. Positive difference indicates higher fidelity for the categorization task, and negative difference indicates higher fidelity for the maintenance task. Error bars represent ± SEM.
Figure 7
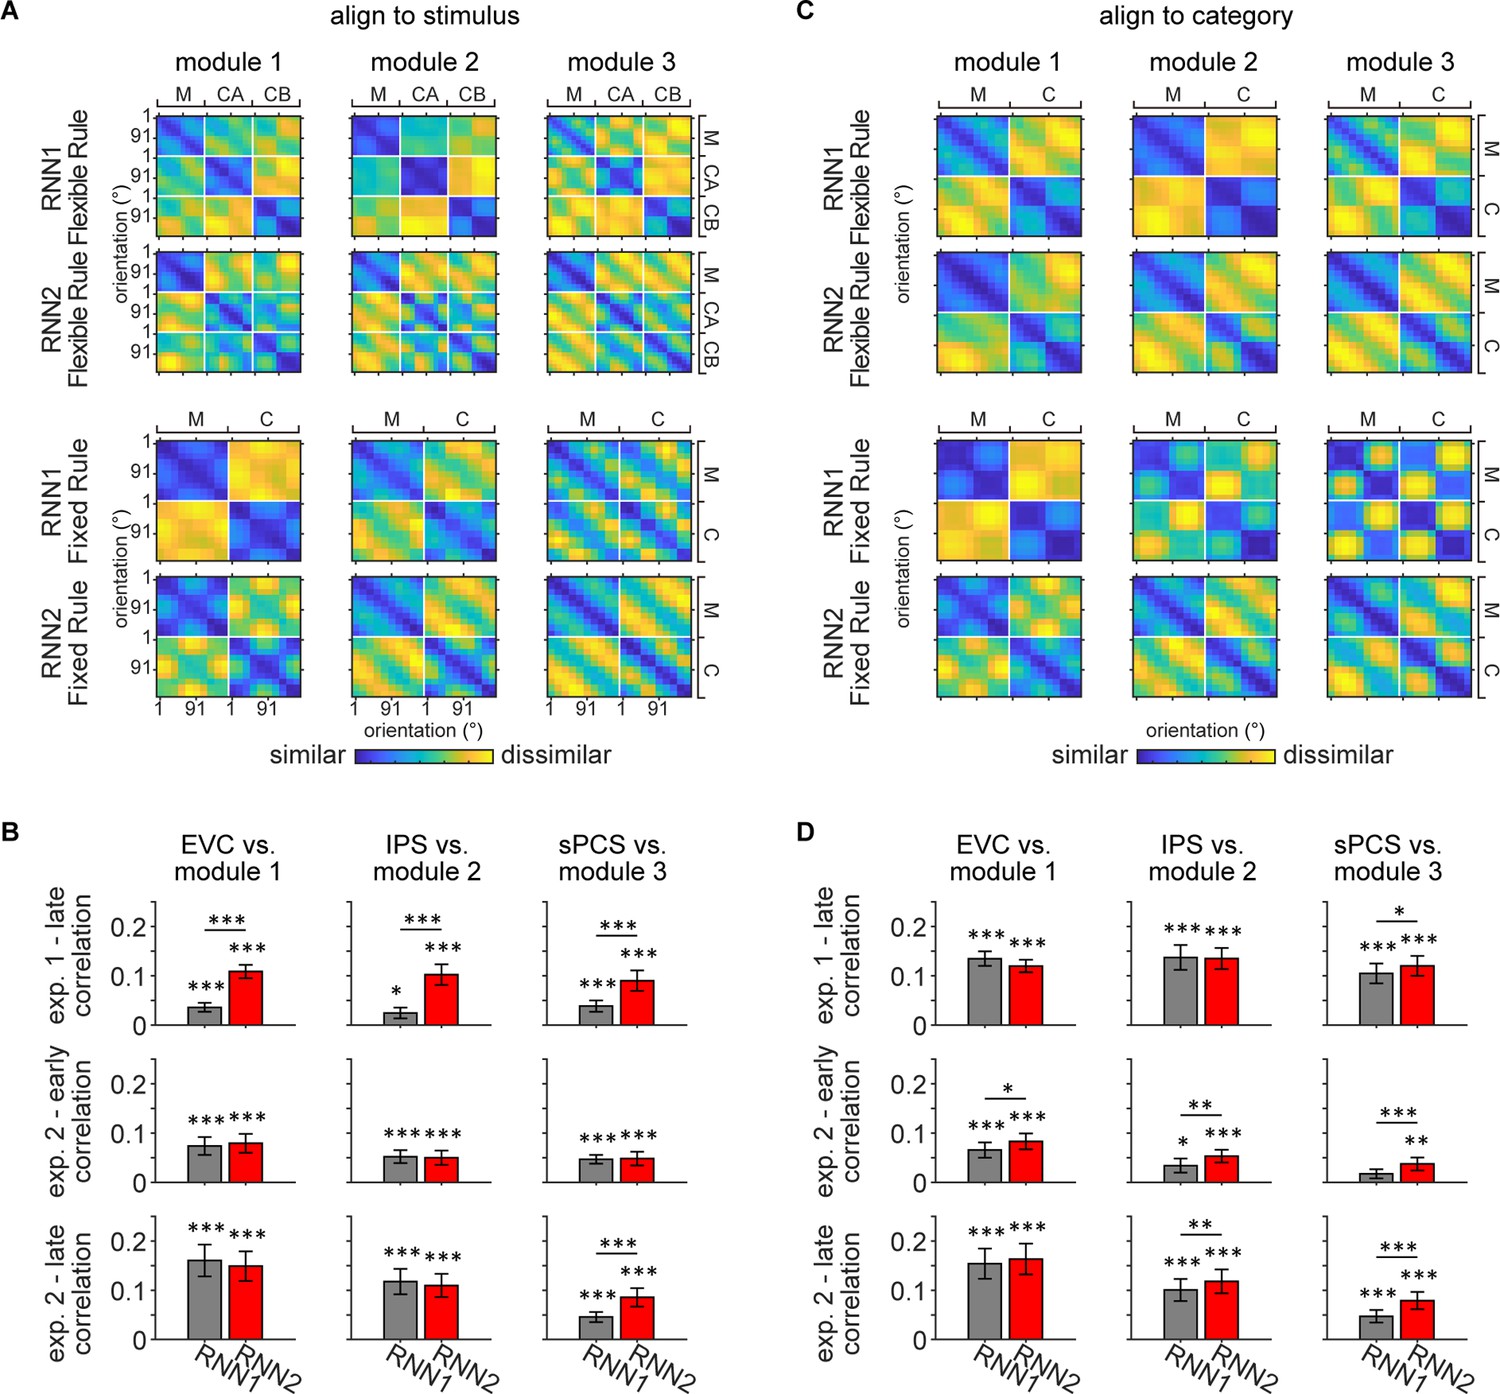
Representational similarity between recurrent neural network (RNN) and human data.
(A) Averaged representational dissimilarity matrices (RDMs) for RNN1 and RNN2 under flexible rule (upper panel; n = 20) and fixed rule (lower panel; n = 20), with data aligned to stimulus. Individual RDM was constructed by calculating the Pearson correlation distance between activation across trials and averaging across the delay period for each orientation and task. Before averaging, each RDM was aligned to stimulus, with orientations sorted from 1° to 180° and ordered by tasks (maintenance [M], categorization-Rule A [CA], and categorization-Rule B [CB] for flexible rule; maintenance and categorization [C] for fixed rule). (B) To quantify the similarity between RNN and human data, Kendall’s Tau correlation coefficients were computed between the RDMs of RNN and human data. Comparisons were performed between flexible-rule RNN and human data from Experiment 1 (top row), and between fixed-rule RNN and human data from early and late epochs of Experiment 2 (middle and bottom rows), for each module and corresponding ROI. Significance of correlation was evaluated using one-sided signed-rank tests. Difference between RNN1 and RNN2 was calculated using Z-transformed correlation coefficient and permutation tests. Black asterisks denote uncorrected significance, *p<0.05; **p<0.01; ***p<0.001. Error bars represent ± SEM. (C) Same as (A) but with data aligned to category. RDMs for each task were aligned to category and rules, with the first half of rows and columns corresponding to one category and the other half to the other category. RDMs for the two categorization rules were further averaged, resulting in two tasks (M and C). (D) Same conventions as (B).
Figure 8
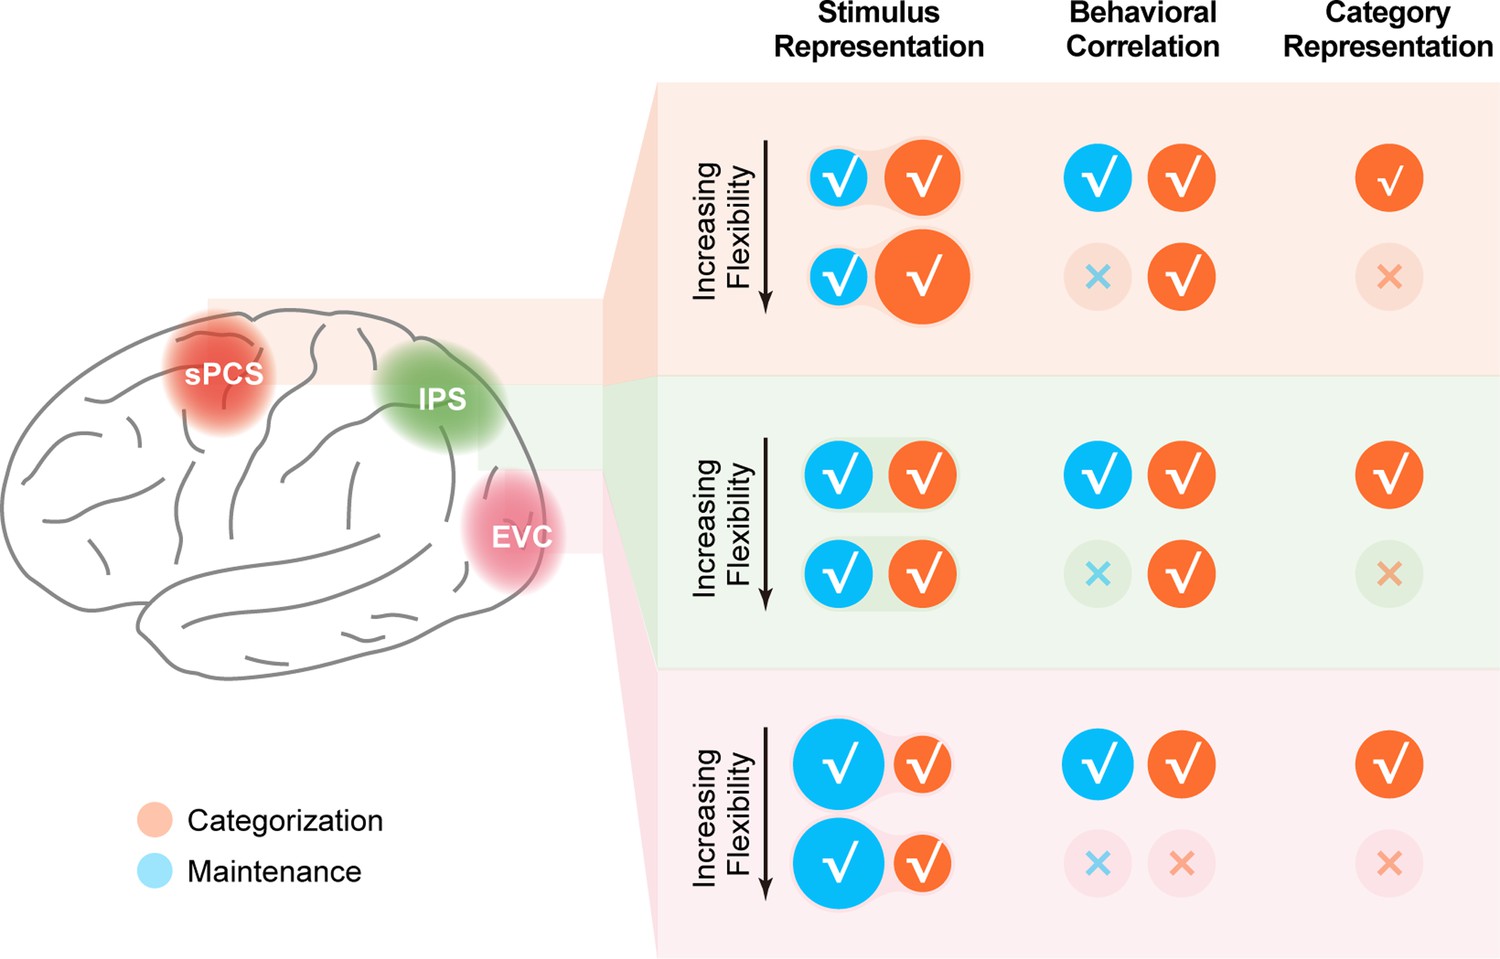
Schematic summary of the involvement of different cortical regions in the current study.
Schematic summary of stimulus representation and corresponding behavioral correlation, as well as category representation in early visual cortex (EVC), intraparietal sulcus (IPS), and superior precentral sulcus (sPCS) for both Experiment 1 and Experiment 2. √ denotes the presence of the corresponding finding, and × denotes the absence of the corresponding finding in maintenance (blue) and categorization (orange) tasks.
Additional files
Download links
A two-part list of links to download the article, or parts of the article, in various formats.
Downloads (link to download the article as PDF)
Open citations (links to open the citations from this article in various online reference manager services)
Cite this article (links to download the citations from this article in formats compatible with various reference manager tools)
Stimulus representation in human frontal cortex supports flexible control in working memory
eLife 13:RP100287.
https://doi.org/10.7554/eLife.100287.4


