An anatomical and physiological basis for flexible coincidence detection in the auditory system
- Harvard Medical School, Department of Neurobiology, United States
- Stanley Center for Psychiatric Research, Broad Institute of MIT and Harvard, United States
Figures
Figure 1
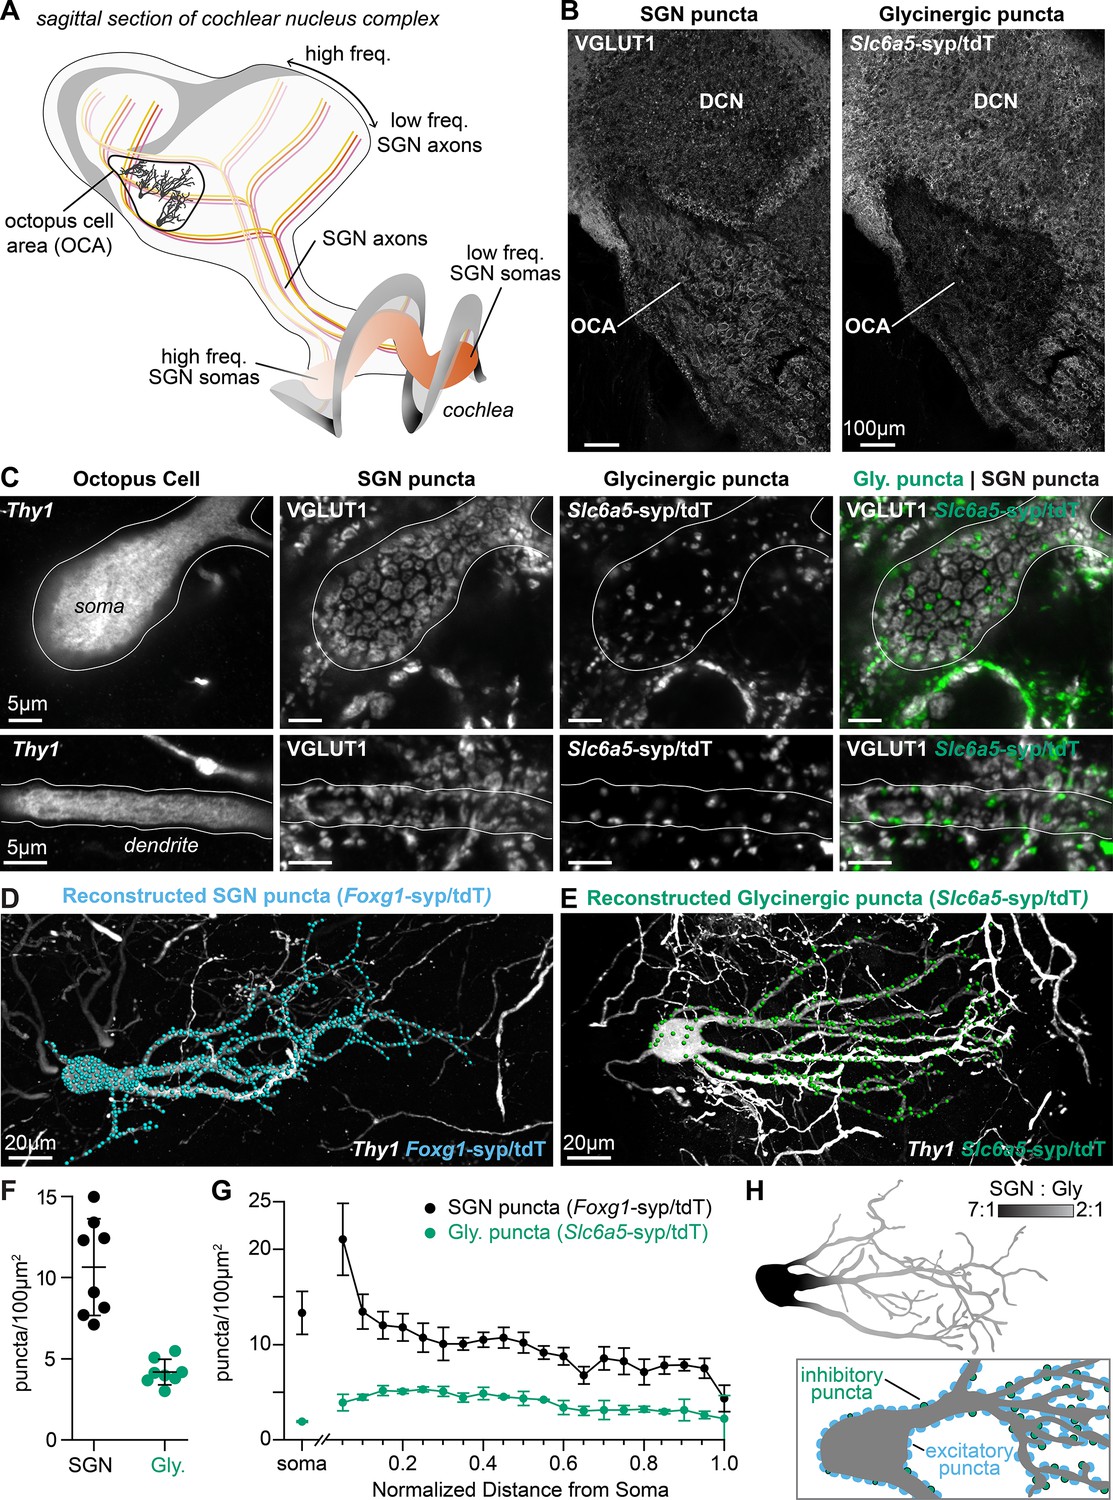
Excitatory and inhibitory synapses to octopus cells form two domains.
(A) Illustration of spiral ganglion neuron (SGN) central axons branching within a parasagittal section of the mouse cochlear nucleus complex (CNC). SGN somas in the cochlea are tonotopically organized according to frequency. Axons remain organized throughout the ventral (VCN) and dorsal (DCN) divisions of the CNC. Octopus cells are found in the octopus cell area (OCA) of the VCN. (B) Excitatory SGN puncta labeled with a VGLUT1 antibody (left) and glycinergic puncta labeled with Slc6a5Cre-dependent syp/tdT (Slc6a5-syp/tdT; right) in a parasagittal section of the CNC. The teardrop-shaped OCA is not devoid of inhibitory inputs, although they are less prominent than in the surrounding CNC. (C) A Thy1 sparsely labeled octopus cell with excitatory SGN (VGLUT1) and inhibitory (Slc6a5-syp/tdT) puncta. Micrographs of 3 µm confocal z-stacks show puncta on the medial surface of a soma (top) and a dendrite (bottom). (D) Representative reconstruction of excitatory SGN puncta labeled with Foxg1Cre-dependent syp/tdT (Foxg1-syp/tdT; blue) onto a Thy1 sparsely labeled octopus cell (white). (E) Representative reconstruction of inhibitory puncta labeled with Slc6a5-syp/tdT (green) onto a Thy1 sparsely labeled octopus cell (white). (F) Puncta density for excitatory SGN (Foxg1-syp/tdT; black: 10.7 ± 3.0, n=8 cells, 4 mice) and glycinergic puncta (Slc6a5-syp/tdT; green: 4.2 ± 0.8, n=8 cells, 3 mice) on octopus cell dendrites. Data are presented as mean ± SD. (G) Puncta density on somas for excitatory SGN (black: 13.3 ± 2.2, n=8 cells, 4 mice) and glycinergic puncta (green: 1.8 ± 0.1, n=8 cells, 3 mice) and the density along the length of dendrites. Data are presented as mean ± SEM. (H) Top: Illustration of an octopus cell and the ratio between excitatory SGN puncta and glycinergic puncta. Inset: Illustration of an octopus cell and the relative innervation densities of excitatory SGNs (blue) and inhibitory puncta (green).
-
Figure 1—source data 1
Data included in Figure 1F.
- https://cdn.elifesciences.org/articles/100492/elife-100492-fig1-data1-v1.xlsx
-
Figure 1—source data 2
Data included in Figure 1G.
- https://cdn.elifesciences.org/articles/100492/elife-100492-fig1-data2-v1.xlsx
Figure 2 with 3 supplements
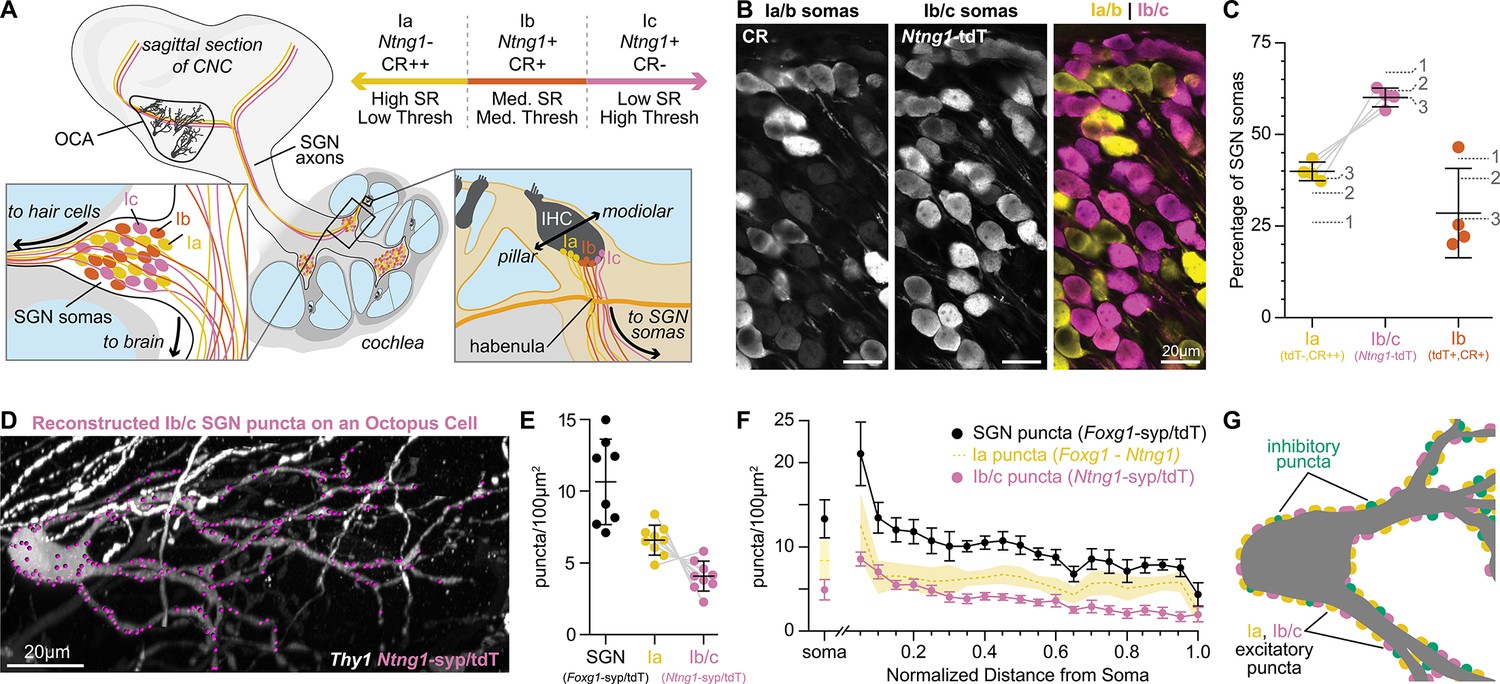
Type Ia SGNs are the primary contributors of excitation to octopus cells.
(A) Ia (yellow), Ib (orange), and Ic (magenta) spiral ganglion neuron (SGN) axons innervate the cochlear nucleus complex (CNC). SGN peripheral processes with different properties are grossly organized along the pillar-modiolar axis as they travel through the habenula and terminate on inner hair cells (IHCs). Ntng1-expressing Ib/c fibers are positioned on the modiolar side (closest to the ganglion). Strongly calretinin immunopositive Ia fibers are on the other side (closest to the pillar cells). This organization correlates with spontaneous rates (SR) and thresholds (thresh) measured in vivo. Somas of all SGN subtypes are found at all tonotopic locations. (B) Calretinin (CR) immunolabeling distinguishes SGN subtypes. Ia/b somas label with high (CR++) and medium (CR+) levels of CR, respectively. Ic somas label with low to undetectable levels of CR (CR-). Ntng1Cre-mediated expression of tdT (Ntng1-tdT) labels Ib/c SGNs. (C) Ia SGNs (tdT-, CR++) make up 39.9 ± 2.6% of the SGN population. Ib/c SGNs (tdT+) make up 60.1 ± 2.6% of the SGN population. Ib SGNs (tdT+CR+) make up 28.5 ± 12.2% of the SGN population (n=1599 neurons, 4 mice). Data are presented as mean ± SD; individual points represent percent coverage per animal, lines connect measurements from the same animal. Dotted lines indicate percentages from 1: Petitpré et al., 2018, 2: Shrestha et al., 2018 3: Sun et al., 2018. (D) Representative reconstruction of Ib/c puncta labeled with Ntng1Cre-dependent syp/tdT (Ntng1-syp/tdT; magenta) onto a Thy1 sparsely labeled octopus cell (white). (E) Puncta density for all SGNs (Foxg1-syp/tdT; black: data from Figure 1F), Ia SGNs (Foxg1 - Ntng1; yellow: 6.6 ± 1.0), and Ib/c SGNs (Ntng1-syp/tdT; magenta: 4.1 ± 1.0, n=9 cells, 5 mice) along the total dendritic length. Ia density was calculated by subtracting Ib/c density from total SGN density; lines connect measurements from the same reconstruction. Data are presented as mean ± SD. (F) Puncta density on somas for all SGNs (Foxg1-syp/tdT; black: data from Figure 1E), Ia SGNs (Foxg1 - Ntng1; yellow: 8.4 ± 2.3), and Ib/c SNGs (Ntng1-syp/tdT; magenta: 4.9 ± 1.2, n=8 cells, 4 mice) and the density along the length of dendrites. Data are presented as mean ± SEM. (G) Illustration of an octopus cell and the relative innervation densities of Ia SGNs (yellow), Ib/c SGNs (magenta), and inhibitory puncta (green).
-
Figure 2—source data 1
Data included in Figure 2C.
- https://cdn.elifesciences.org/articles/100492/elife-100492-fig2-data1-v1.xlsx
-
Figure 2—source data 2
Data included in Figure 2E.
- https://cdn.elifesciences.org/articles/100492/elife-100492-fig2-data2-v1.xlsx
-
Figure 2—source data 3
Data included in Figure 2F.
- https://cdn.elifesciences.org/articles/100492/elife-100492-fig2-data3-v1.xlsx
Figure 2—figure supplement 1
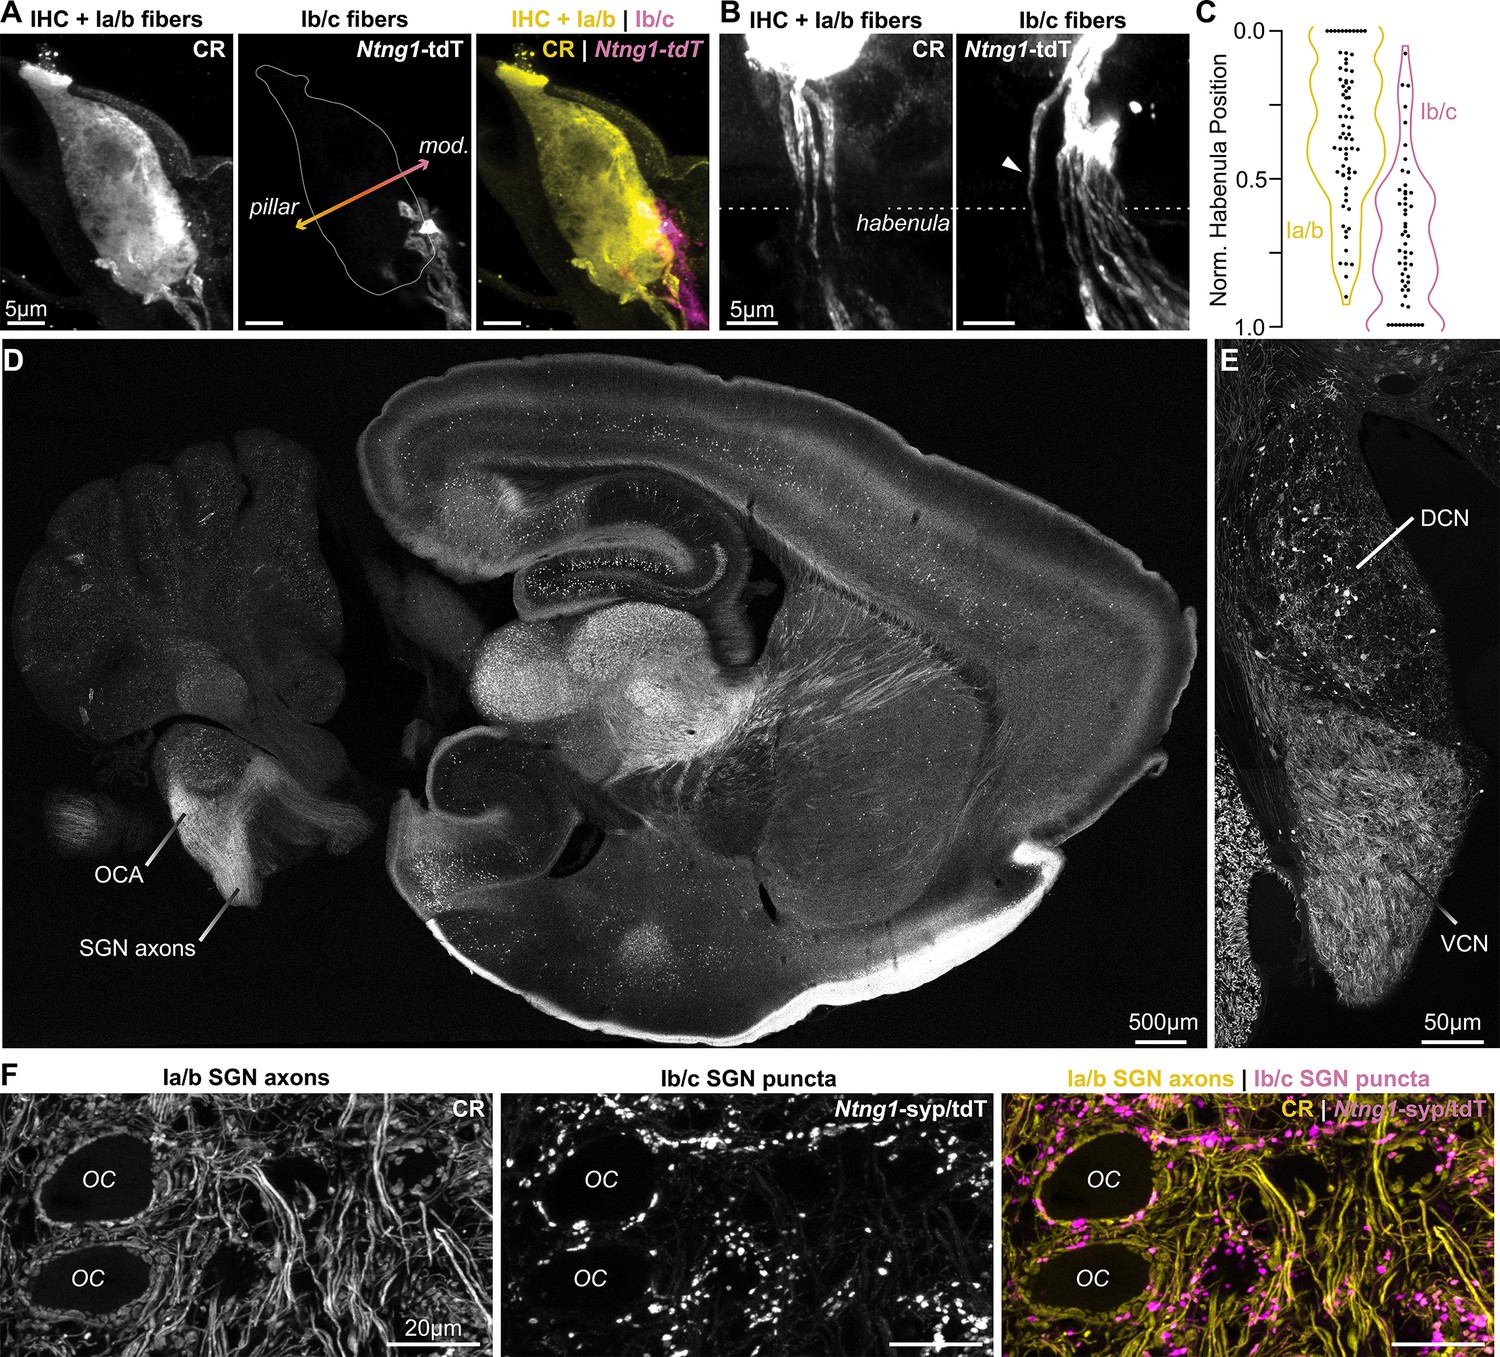
Ntng1Cre has high specificity for Ib/c SGNs.
(A) Calretinin immunopositive (CR+) Ia/b spiral ganglion neuron (SGN) peripheral fibers (CR, yellow) preferentially innervate the pillar side of inner hair cells (IHCs). Ib/c SGN peripheral fibers with Ntng1Cre-mediated expression of tdTomato (Ntng1-tdT; magenta) preferentially innervate the modiolar side of IHCs. IHCs also immunolabel for CR. (B) CR+ Ia/b SGN fibers (yellow) pass through the pillar side of the habenula while Ntng1-tdT+ Ib/c SGN fibers (magenta) pass through the modiolar side. Arrowhead highlights a Ntng1-tdT fiber passing through the pillar side of the habenula but ultimately terminating on the modiolar side of the IHC. (C) Normalized position of CR+ Ia/b (yellow) and Ntng1-tdT+ Ib/c (magenta) fibers in the habenula (n=124 fibers, 5 mice). (D) In the central nervous system, Ntng1-tdT is present throughout the brain, but is restricted to SGN axons in the ventral cochlear nucleus where the octopus cell area (OCA) is found. (E) A coronal section of the cochlear nucleus highlights Ntng1-tdT SGN axons in the ventral cochlear nucleus (VCN) and scattered Ntng1-tdT somas in the dorsal cochlear nucleus (DCN). (F) In the octopus cell area, CR immunolabel is present in Ia/b SGN axons and puncta. As in the ganglion, CR co-labels with some Ib/c puncta (Ntng1-syp/tdT).
Figure 2—figure supplement 2

Myo15iCre sparsely labels Ic SGNs.
(A) Cochlear sections with calretinin (CR) immunolabeling of hair cells and type Ia/b spiral ganglion neurons (SGNs) and Myo15iCre-mediated expression of tdTomato (Myo15-tdT) in hair cells and a subset of type Ic SGNs. (B) CR+ Ia/b SGN fibers (yellow) preferentially innervate the pillar side of inner hair cells (IHCs). The sparse subset of Ic SGN fibers labeled by Myo15-tdT (magenta) preferentially innervate the modiolar side of IHCs. IHCs label with both tdT and CR. (C) CR+ Ia/b SGN fibers (yellow) pass through the pillar side of the habenula while sparsely labeled Myo15-tdT+ Ic SGN fibers (magenta) pass through the modiolar side. (D) Normalized position of CR+ Ia/b (yellow) and Myo15-tdT+ Ic (magenta) SGN fibers along the pillar to modiolar axis of the habenula (n=90 fibers, 4 mice). (E) 65 µm cochlear section containing SGN somas. SGNs have variable levels of calretinin (CR) immunolabeling corresponding to the three molecular subtypes. Ia/b SGN somas label with high and medium levels of CR, respectively. Ic somas label with very low levels of CR. Myo15-tdT is sparsely found in Ic SGNs. All SGN somas are labeled with Foxg1Flp-mediated expression of EYFP (Foxg1-EYFP). (F) tdT+CR- SGNs make up 4.7 ± 2.3% of the SGN population (n=2150 neurons, 5 mice), indicating sparse reporter expression. Data are presented as mean ± SD; individual data points signify percent coverage per animal. Dotted lines are estimated percentages for type Ic SGNs from 1: Petitpré et al., 2018, 2: Shrestha et al., 2018 3: Sun et al., 2018. (G) A Thy1 octopus cell has few Myo15-syp/tdT puncta near its soma and dendrites. (H) Puncta density of all SGN (Foxg1-syp/tdT; black: data from Figure 1F), Ib/c SGN (Ntng1-syp/tdT; magenta: data from Figure 2E), and sparse Ic SGN inputs (Myo15-syp/tdT; open magenta circles: 1.1 ± 0.6, n=6 cells, 3 mice). Data are presented as mean ± SD. Markers represent the total puncta density computed per reconstructed octopus cell. (I) Puncta density per 100 µm2 of soma surface area for all SGN (Foxg1-syp/tdT; black: data from Figure 1G) and sparse Ic inputs (Myo15-syp/tdT; magenta open circles: 0.7 ± 0.4, n=6 cells, 3 mice) and density along the length of the dendritic tree, relative to the soma. Data are presented as mean ± SEM. Blue dashed line visualizes puncta density for 4.7% of the total SGN inputs, which is the expected innervation of Myo15-syp/tdT puncta if all SGN subtypes made a proportional number of contacts with octopus cells.
Figure 2—figure supplement 3
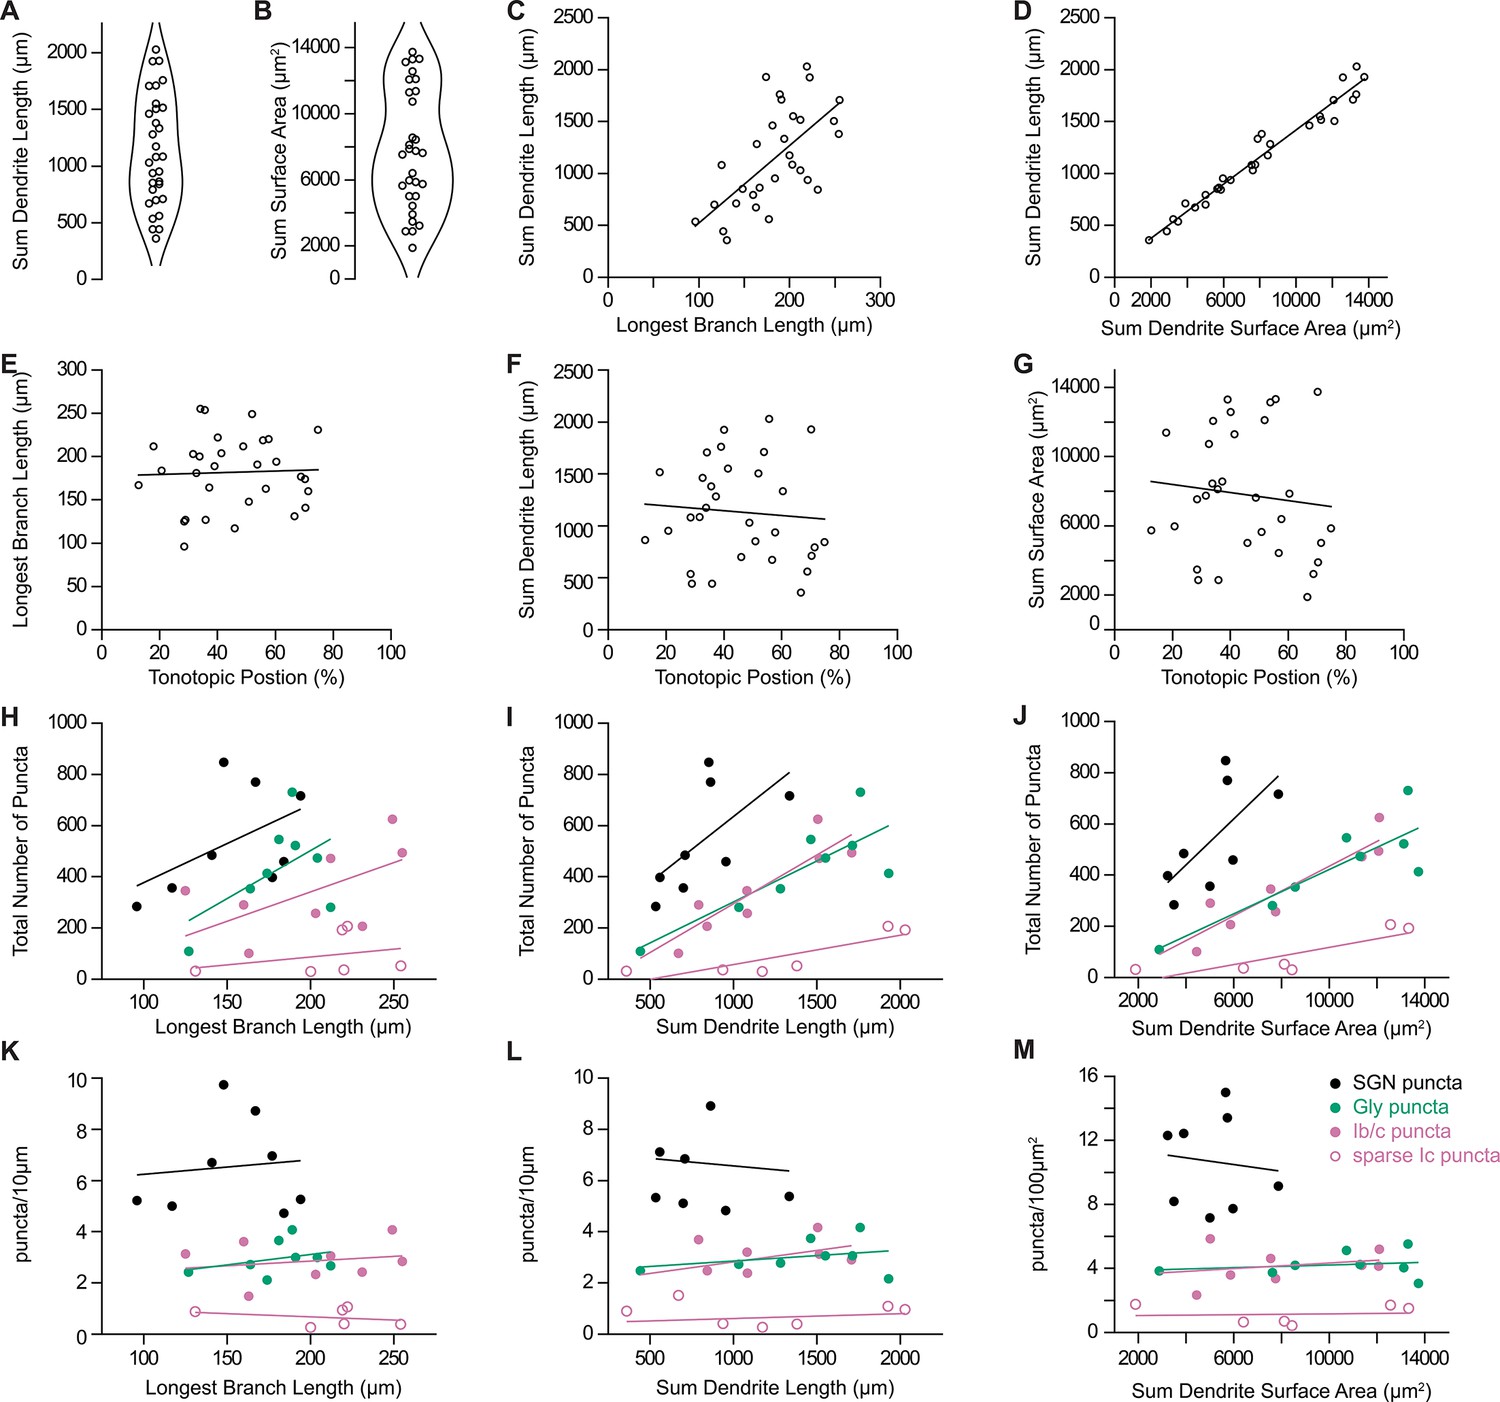
Dendritic and synaptic reconstructions of octopus cells.
(A) Total length of reconstructed dendritic arbors for 31 octopus cells. (B) Total surface area of reconstructed dendritic arbors for 31 octopus cells. (C) Octopus cell reconstructions were normalized to the longest reconstructed dendrite. Total length of reconstructed dendrites correlated with the longest branch per neuron. (D) Total length of reconstructed dendrites correlated with total dendritic surface area. (E–G) Longest branch length, total dendrite length, and total surface area compared to estimated position of the octopus cell soma in the tonotopic organization of the octopus cell area. (H–J) Total number of reconstructed spiral ganglion neuron (SGN) puncta (Foxg1-syp/tdT; black), inhibitory puncta (Slc6a5-syp/tdT; green), Ib/c SGN puncta (Ntng1-syp/tdT; magenta), and sparse Ic SGN puncta (Myo15-syp/tdT; open magenta circles) compared to the longest branch length, total dendrite length, and total dendrite surface area. (K–M) Density of reconstructed SGN puncta (Foxg1-syp/tdT; black), inhibitory puncta (Slc6a5-syp/tdT; green), Ib/c SGN puncta (Ntng1-syp/tdT; magenta), and sparse Ic SGN puncta (Myo15-syp/tdT; open magenta circles) compared to longest branch length, total dendrite length, and total dendrite surface area.
Figure 3
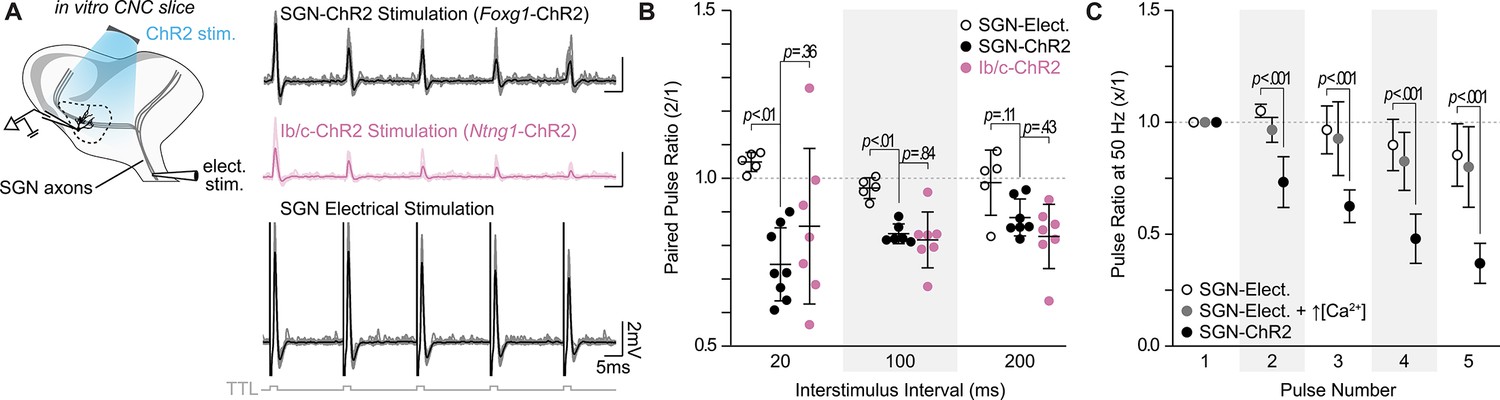
SGN subtype inputs to octopus cells do not differ in short-term plasticity.
(A) Illustration of the experimental paradigm and representative EPSP traces recorded during in vitro whole-cell current-clamp recordings of octopus cells. Spiral ganglion neuron (SGN) central axon stimulation methods included electrical stimulation or full-field, light-evoked activation of Foxg1-ChR2 or Ntng1-ChR2 SGNs. TTL trigger pulses are shown in gray. (B) Paired pulse ratios for electrically stimulated SGNs (open circles: n=5 cells, 3 mice), ChR2 stimulated SGNs (Foxg1-ChR2; black: n=8 cells, 5 mice), and ChR2 stimulated Ib/c SGNs (Ntng1-ChR2; magenta: n=7 cells, 6 mice) at three interstimulus intervals. With electrical stimulation, SGN inputs to octopus cells were stable and exhibited slight facilitation at 50 Hz (20ms interstimulus interval). ChR2 stimulation caused paired pulse depression not seen with electrical stimulation. Data are presented as mean ± SD. Each data point represents the average paired pulse ratio for a cell. p values from ANOVA and subsequent Tukey HSD test are reported for comparisons between methods of SGN activation (electrical and ChR2) and SGN subpopulation composition within method of activation (SGN-ChR2 and Ib/c-ChR2). Welch’s ANOVA was used for comparisons at 20ms interstimulus interval (50 Hz) as data in this condition did not meet the homogeneity of variance assumption. (C) Pulse ratios at 50 Hz for electrically stimulated SGNs with physiological 1.4 mM Ca2+ ACSF (open circles: n=5 cells, 3 mice), electrically stimulated SGNs with 2.4 mM Ca2+ ACSF (grey: n=3 cells, 2 mice) and ChR2 stimulated SGNs with physiological ACSF (Foxg1-ChR2; black: n=8 cells, 5 mice). Data are presented as mean ± SD. p<0.001 from ANOVA and subsequent Tukey HSD test for all comparisons between methods of SGN activation (SGN-Elect. and SGN-ChR2). There were no statistically significant differences for all comparisons between 1.4 mM (SGN-Elect.) and 2.4 mM Ca2+ (SGN-Elect. + ↑[Ca2+]) (p>0.100, ANOVA).
-
Figure 3—source data 1
Data and statistical analysis included in Figure 3B.
- https://cdn.elifesciences.org/articles/100492/elife-100492-fig3-data1-v1.xlsx
-
Figure 3—source data 2
Data and statistical analysis included in Figure 3C.
- https://cdn.elifesciences.org/articles/100492/elife-100492-fig3-data2-v1.xlsx
Figure 4 with 1 supplement
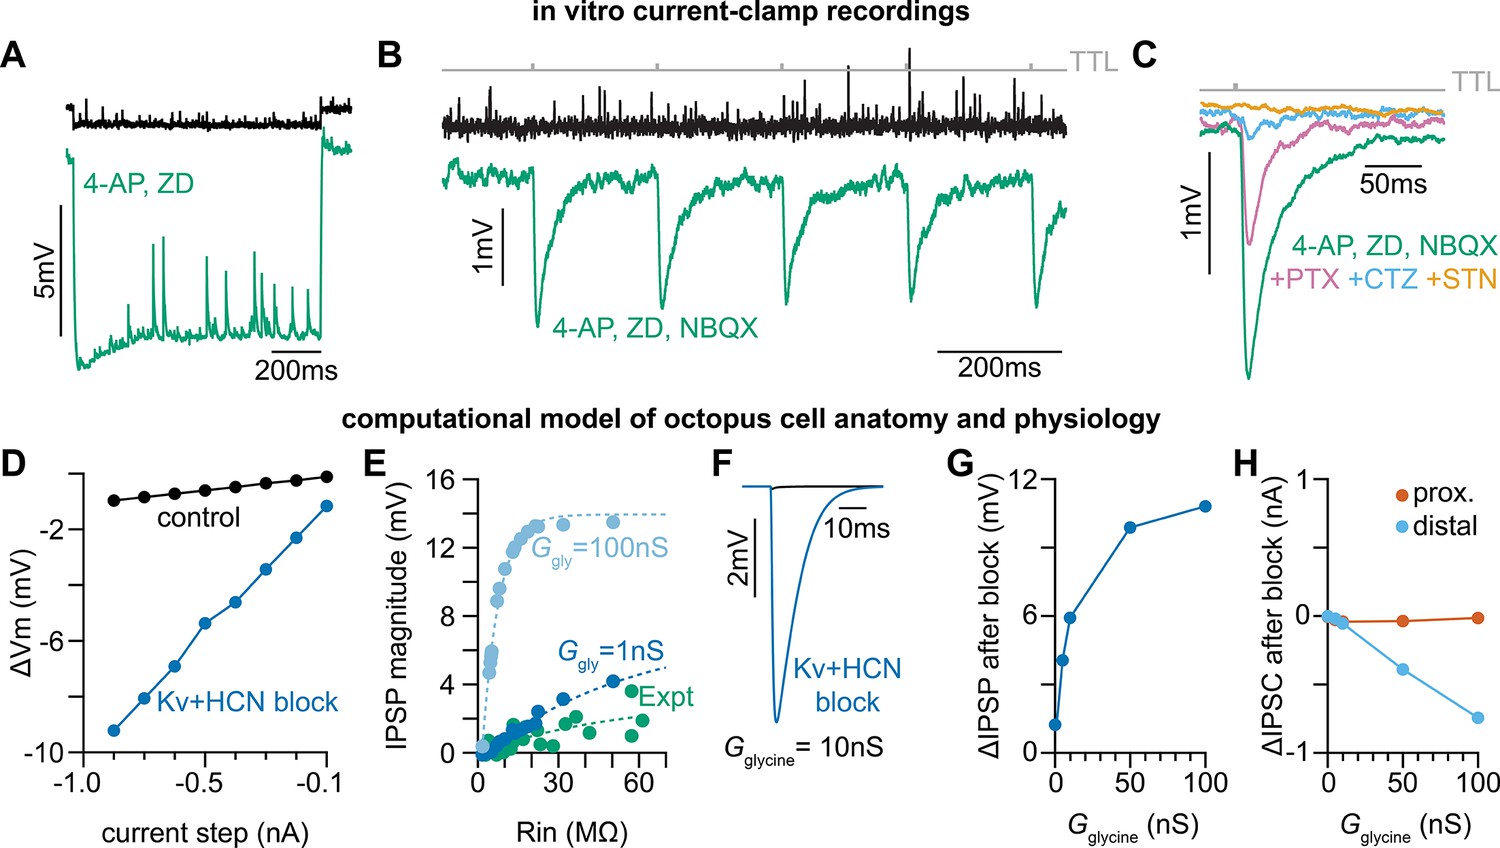
Octopus cells receive glycinergic inhibitory post synaptic potentials.
(A) Voltage responses to a –200 pA current injection. This representative neuron hyperpolarized 0.7 mV (black) in control conditions. After bath application of 100 µM 4-Aminopyridine (4-AP) and 50 µM ZD 7288 (ZD), hyperpolarizing responses to the same –200 pA current injection increased to 8.8 mV at steady state (green). (B) Postsynaptic responses to ChR2 stimulation of glycinergic terminals (Slc6a5-ChR2) with a 5 Hz train (gray) of 1ms full-field blue light pulses before (black) and after bath application of 100 µM 4-AP, 50 µM ZD, and 15 µM NBQX (green: n=9 cells, 8 mice). Increased input resistance reveals inhibitory potentials that are otherwise difficult to detect. (C) Postsynaptic responses to Slc6a5-ChR2 stimulation after bath application of 100 µM 4-AP, 50 µM ZD, and 15 µM NBQX (green), with further sequential addition of 20 µM picrotoxin (PTX, pink), 100 µM cyclothiazide (CTZ, blue), and 500 nM strychnine (STN, orange: n=6 cells, 5 mice). (D) Change in membrane voltage in response to hyperpolarizing somatic current steps in a morphologically and biophysically realistic model of octopus cells before (black) and after removal of voltage-gated potassium (Kv) and hyperpolarization-activated cyclic nucleotide-gated (HCN) channels (blue). As in in vitro current-clamp recordings (A), removing Kv and HCN channels increased the magnitude of voltage responses (ΔVm) to hyperpolarizing current. (E) IPSP magnitude in experimental data (green) and the model (dark and light blue) as a function of input resistance. In somatic measurements, IPSP size increases with input resistance. Modeled IPSPs are shown for two conductance levels (1nS, dark blue; 100nS light blue). (F) IPSPs measured at the soma of a modeled octopus cell before (black) and after removal of Kv and HCN channels (blue). As in in vitro current-clamp recordings, this allows for somatic IPSP detection. (G) Change in the magnitude of soma-measured IPSPs after removal of Kv and HCN channels. IPSP magnitude increases with Kv and HCN block for all glycine conductance levels. (H) Change in the magnitude of locally measured IPSCs at proximal (orange) and distal (blue) dendritic locations after removal of Kv and HCN channels. IPSC magnitude at the synapse decreases with Kv and HCN block for all glycine conductance levels. Change in IPSC magnitude is largest on distal dendrites.
Figure 4—figure supplement 1
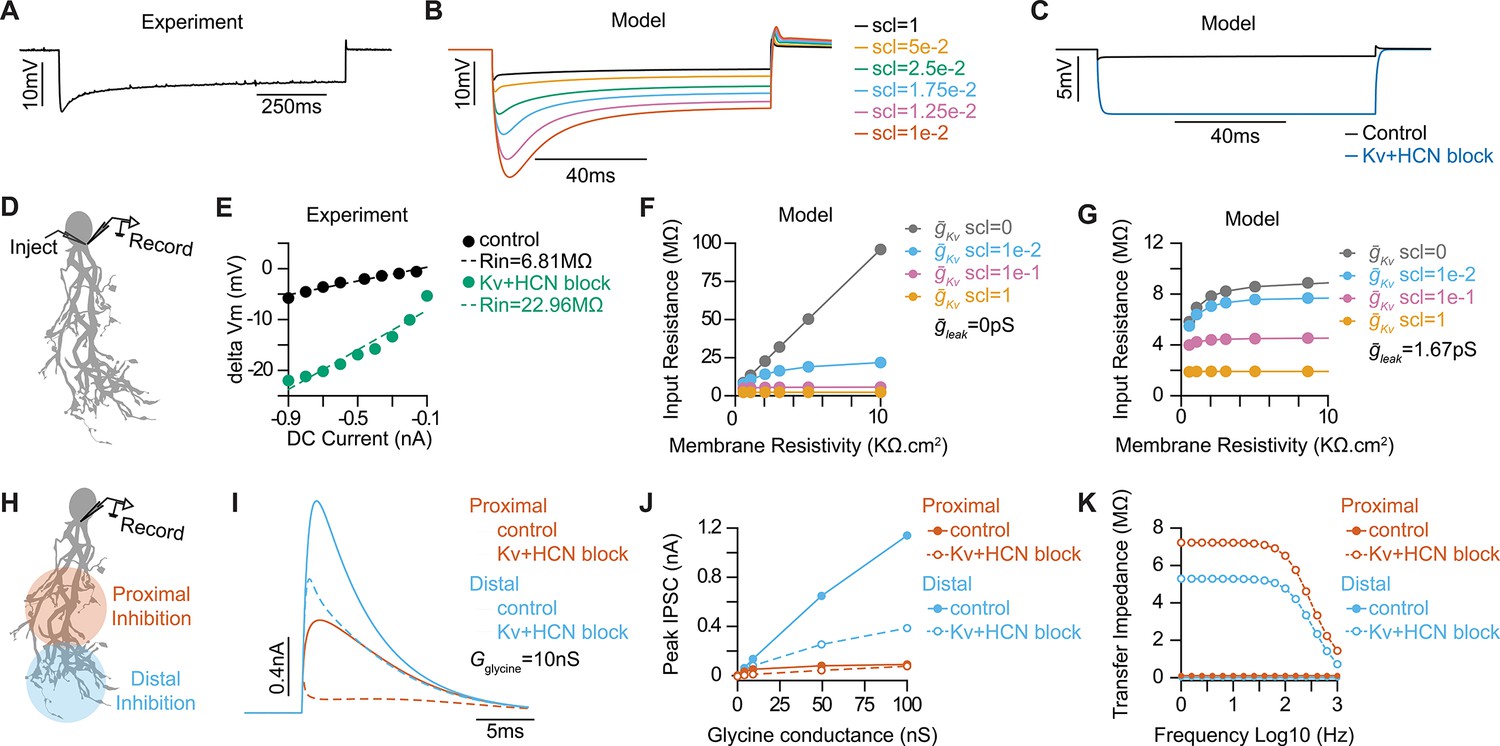
Optimizing active and passive properties of an octopus cell model.
(A) Subthreshold somatic voltage response to a –800 pA hyperpolarizing current injection in an in vitro whole-cell current clamp recording of an octopus cell. (B) Somatic voltage responses from a morphologically realistic octopus cell model to a –800 pA current injection for various scaling factors (scl) of maximal conductances of ḡKLT, ḡKHT, ḡKA, and ḡh. (C) Comparison of somatic hyperpolarizations to a –800 pA current injection in the model reproducing experimental data during control (black) and Kv and HCN block conditions (blue). (D) Illustration of injection and recording locations for panels E-G in a morphologically realistic octopus cell model. (E) Current-voltage (IV) relationships from a representative experimental octopus cell recorded in control ACSF and with Kv and HCN block. Dotted lines plot linear fits of the experimental data. The slope of the dotted line estimates Rin. (F–G) Impact of leak conductance (ḡleak) and scaling factor (scl) on passive properties of the model with ḡleak=0pS (F) and ḡleak=1.67pS (G) for various scaling factor values (indicated in different colors). (H) Illustration of injection and recording locations for panels I-K in a morphologically realistic octopus cell model. (I) Inhibitory post synaptic currents (IPSCs) from glycinergic synapses located in the proximal (orange) and distal (blue) dendritic tree during control (solid) and Kv and HCN block (dotted) conditions. IPSCs decrease in size after Kv and HCN block. (J) IPSC peak magnitude at different glycine conductances located in the proximal (orange) and distal (blue) dendritic tree during control (solid) and Kv and HCN block (dotted) conditions. Kv and HCN channel blockade causes IPSC reduction at distal synapses but no change at proximal synapses. (K) Transfer impedance as function of frequency from proximal dendrites to soma (orange) and distal dendrites to soma (blue) during control (solid) and Kv and HCN block (dotted) conditions.
Figure 5 with 1 supplement
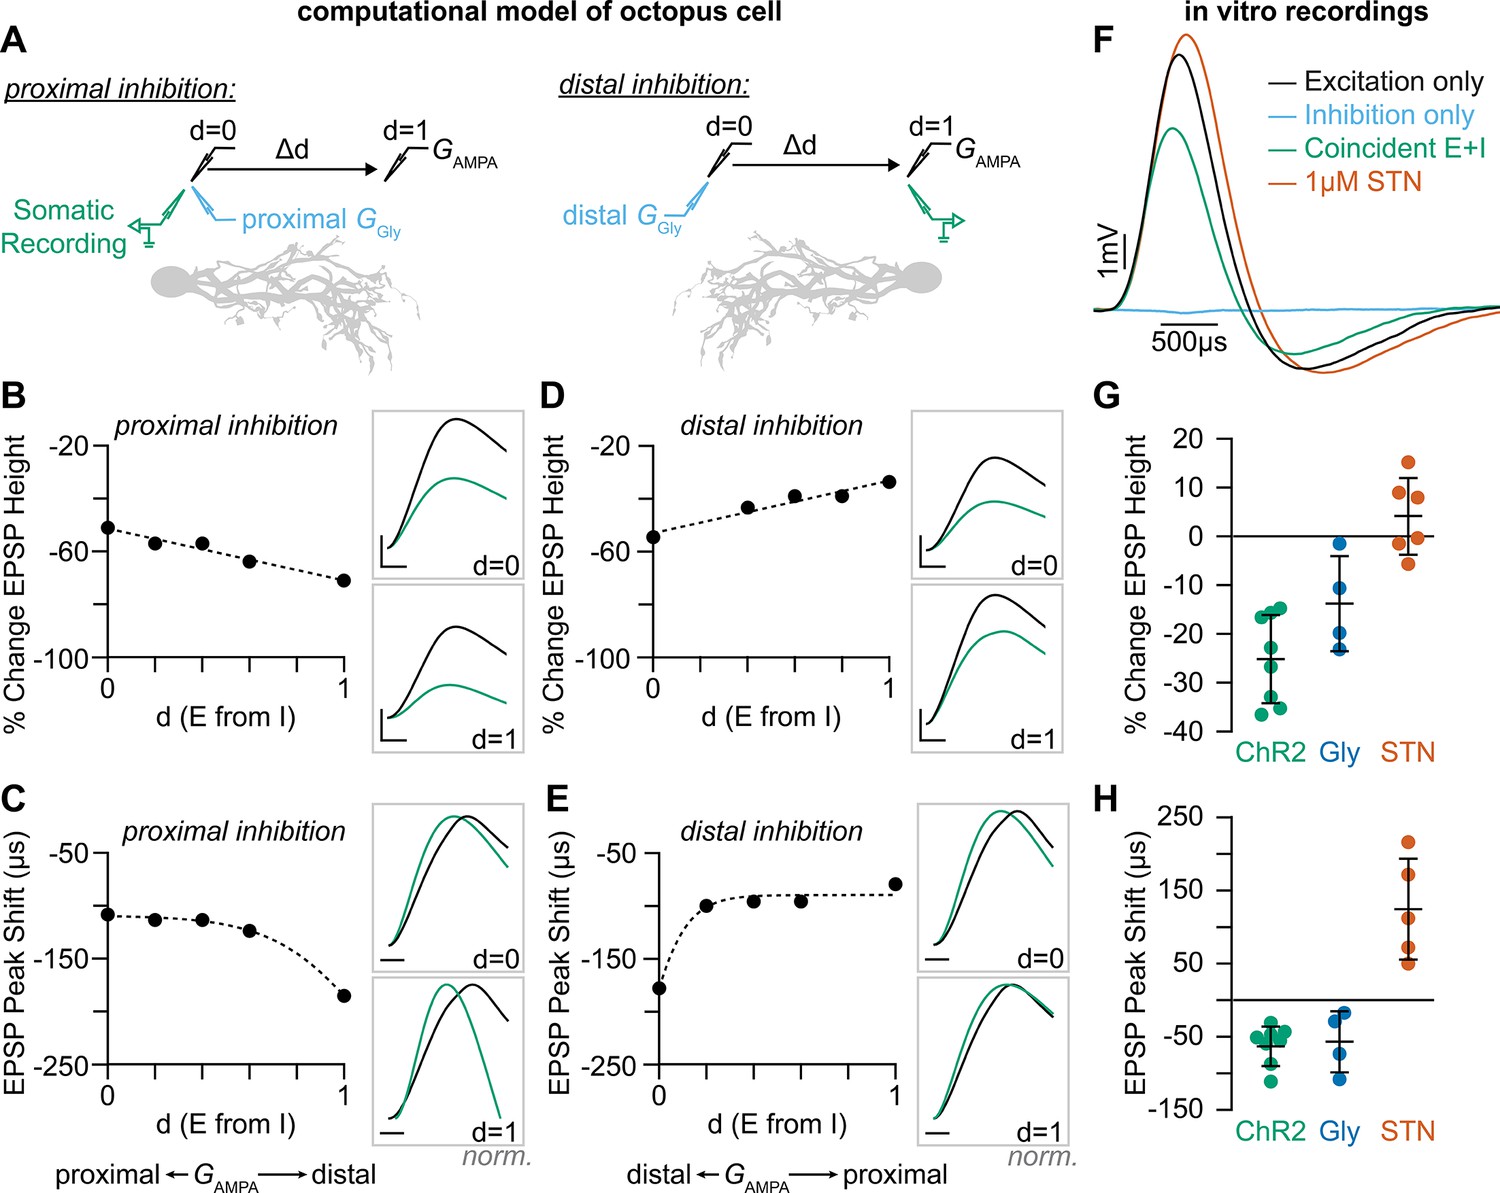
Coincident excitation and inhibition on octopus cell dendrites advances EPSP peak times.
(A) The impact of distance between excitatory and inhibitory synapses was measured in a computational model of octopus cells. Inhibitory synapses were placed either proximally or distally to excitation. Excitatory synapses were placed at varying locations along the dendritic arbor to change the anatomical distance (Δd) where d=0 is the location of inhibition (GGly) and d=1 is the condition where excitation (GAMPA) and inhibition are maximally separated. EPSPs were measured at the soma in all conditions (green). (B–E) Quantification of the percent change in soma-measured EPSP magnitude (B, D; GAMPA=5 nS) and the shift in EPSP peak timing (C, E; GAMPA=2 nS) in models of proximal (B–C) and distal (D–E) inhibition. Inhibitory conductances (GGly) between 6 and 10 nS produced values within experimental ranges. Example traces show EPSPs with (green) and without (black) inhibition at d=0 and d=1. Distal dendrites (d=1) have higher local input resistance and lower IPSP attenuation due to the sealed end. Inset scale bars are 1 mV, 200 ms. (F–H) Coincident stimulation of excitation and inhibition changes EPSP shape. (F) Representative responses to independent stimulation of excitatory spiral ganglion neurons (SGNs; black), independent stimulation of inhibitory inputs (light blue), coincident stimulation of both excitation and inhibition (green), and independent stimulation of excitatory SGNs with the addition of 1 µM strychnine (STN). Quantification of the percent change in EPSP height (G) and the shift in EPSP peak timing (H) during coincident Slc6a5-ChR2 activation of inhibitory inputs (green: n=8 cells, 6 mice), bath application of 25 µM glycine (dark blue: n=4 cells, 3 mice), and bath application of 1 µM STN (orange: n=5 cells, 4 mice). Activation of glycinergic receptors during excitation decreased EPSP heights and advanced EPSP peaks. Blocking of tonically active glycine receptors slowed and delayed EPSPs. Data are presented as mean ± SD. Markers represent the average quantification for a cell.
-
Figure 5—source data 1
Data included in Figure 5G.
- https://cdn.elifesciences.org/articles/100492/elife-100492-fig5-data1-v1.xlsx
-
Figure 5—source data 2
Data included in Figure 5H.
- https://cdn.elifesciences.org/articles/100492/elife-100492-fig5-data2-v1.xlsx
Figure 5—figure supplement 1
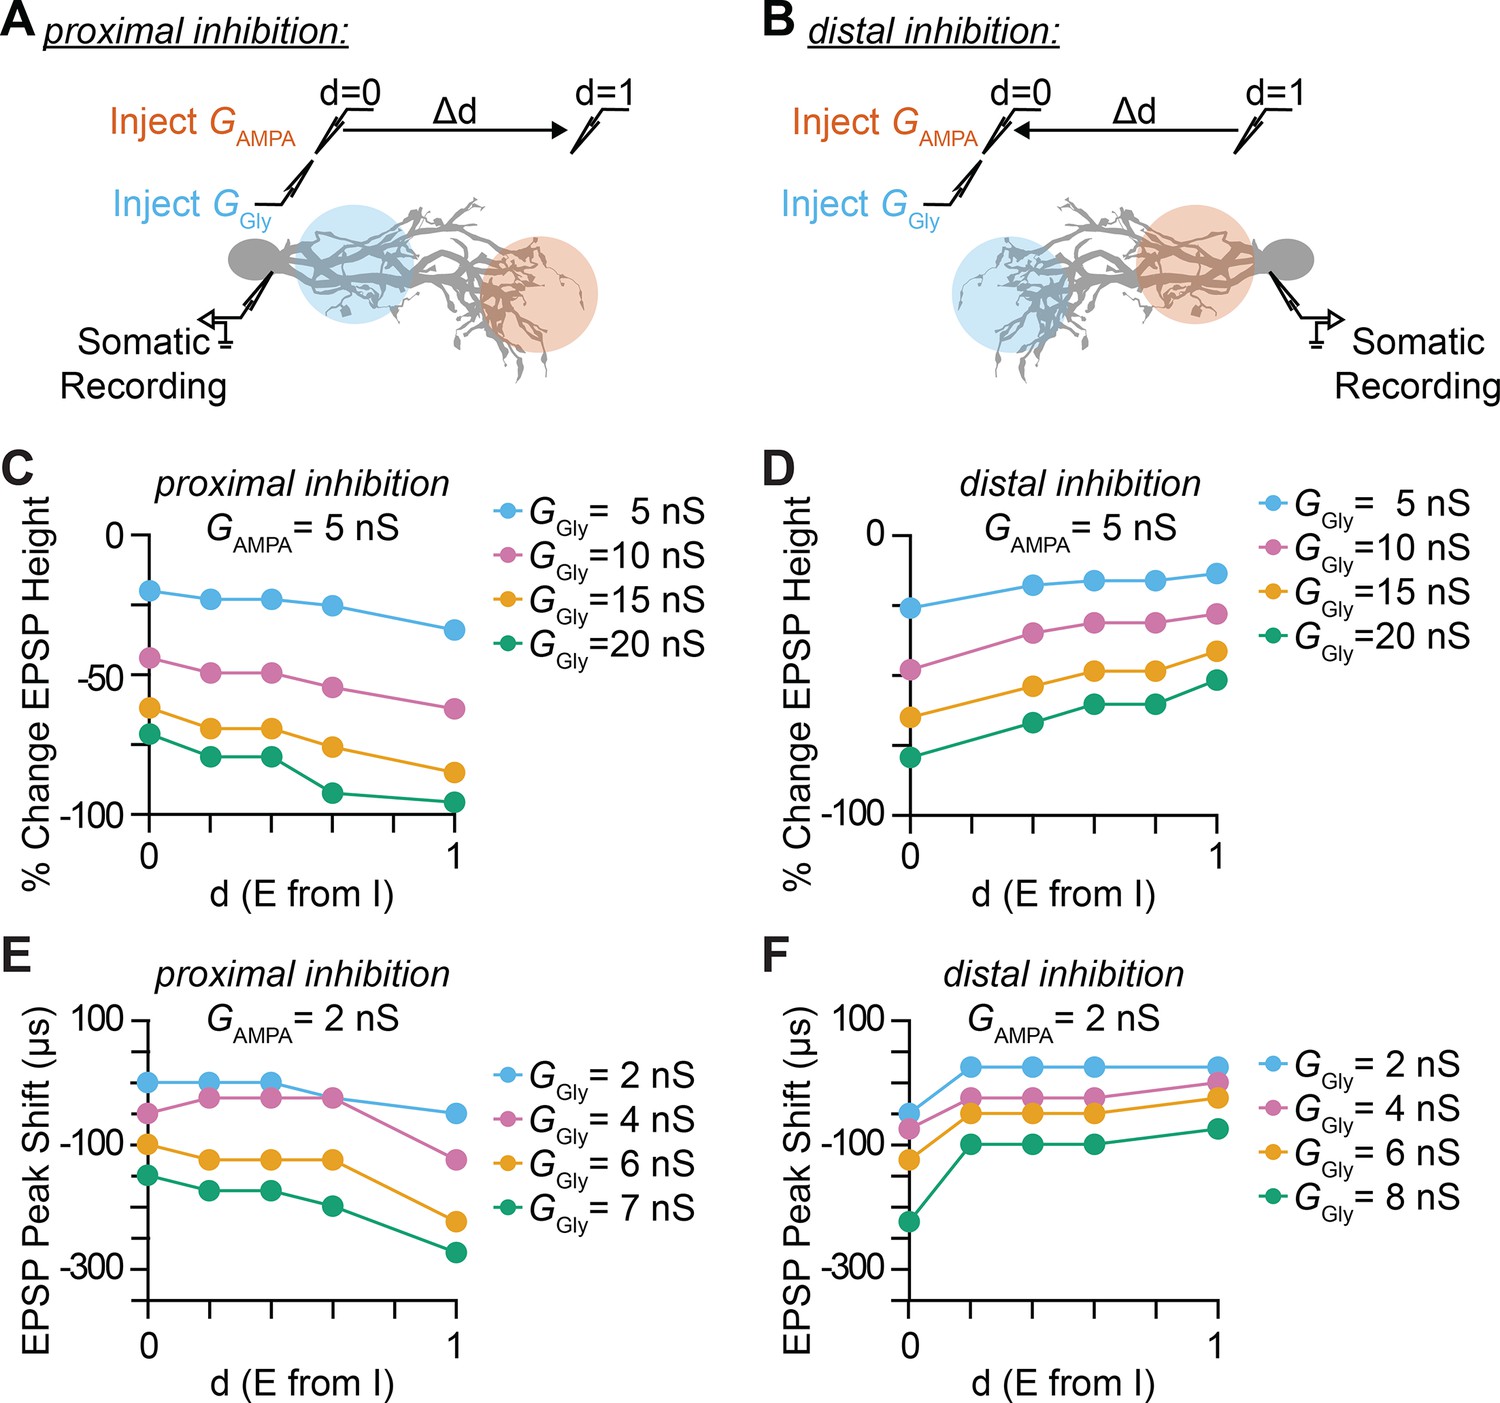
Impact of inhibitory synaptic location and distance between excitatory and inhibitory synapse on somatic EPSP amplitude and timing.
(A–B) Illustration of injection and recording locations for proximal (A) and distal (B) inhibition paradigms and the normalized relative distance (d) between excitatory synapses. The impact that the location of dendritic inhibition has on somatic EPSPs is primarily determined by the local potential change by an EPSP and the attenuation or the length constant (λ) of the IPSP towards the excitatory synaptic location. The exponential decay of membrane voltage is asymmetric, with lower λ for the open end and higher λ for sealed end propagation. Distal parts of the dendrites have higher local input resistance and lower attenuation of IPSP due to the sealed end. (C–D) Percentage change in somatic EPSP height with dendritic glycinergic inhibition as function of normalized distance between excitatory and inhibitory synapses in proximal (C) and distal (D) inhibition for various E/I ratio with excitatory AMPA conductance (GAMPA) set at 5 nS. (E–F) Somatic EPSP peak time shift with dendritic glycinergic inhibition as function of normalized distance between excitatory and inhibitory synapses in proximal (E) and distal (F) inhibition for various E/I ratio with excitatory AMPA conductance (GAMPA) set at 2 nS.
Figure 6
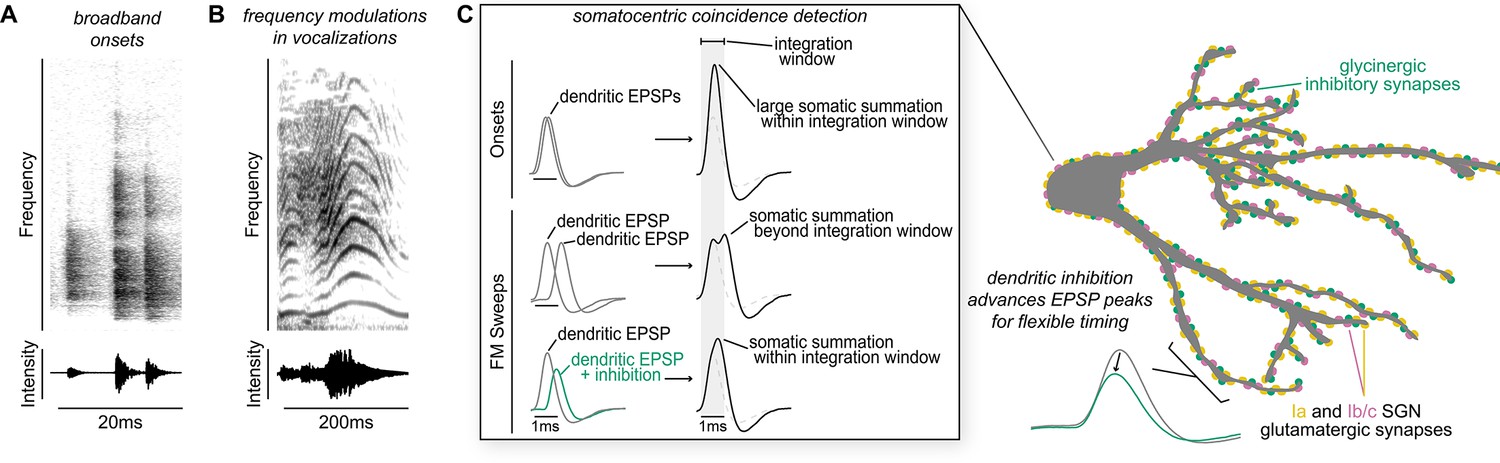
Proposed model of flexible dendritic timing for precise somatic coincidence detection.
(A–B) Spectrograms show how co-occurring frequencies in broadband onsets, shown for a clicking sound (A), and frequency modulations, shown for human squeaking (B), change in their strength (top) and total intensity (bottom) on different time scales. Despite the timing differences, both kinds of stimuli are hypothesized to result in somatic summation during the octopus cell’s spike integration window. (C) Excitation must summate at the soma of octopus cells within a narrow time window (~1ms) to achieve a depolarization rate rapid enough to trigger action potentials. Summation of excitation alone accounts for responses to sound onsets (inset, top). During stimuli that require summation over a longer time period, such as frequency modulated sweeps, synaptic inhibition can accelerate EPSPs as they travel along octopus cell dendrites towards the soma for coincidence detection computations (inset, bottom). We propose a mechanism for preferential processing of a subset of excitatory inputs where selective temporal advancement of a subset of EPSPs by local inhibition could expand the effective window for coincidence detection at the soma.
Author response image 1

Author response image 2

Author response image 3

Author response image 4

Author response image 5

Author response image 6

Tables
Key resources table
| Reagent type (species) or resource | Designation | Source or reference | Identifiers | Additional information |
|---|---|---|---|---|
| Biological sample (Mus musculus) | Foxg1Cre/+: Foxg1tm1.1(cre)Ddmo | Jackson Laboratory | RRID:IMSR_JAX:029690 | |
| Biological sample (Mus musculus) | Foxg1tm1.1Fsh | Miyoshi and Fishell, 2012 | MGI:5441367 | |
| Biological sample (Mus musculus) | Tg(EIIa-cre)C5379Lmgd | Jackson Laboratory | RRID:IMSR_JAX:003314 | |
| Biological sample (Mus musculus) | Ntng1Cre/+: Ntng1em1(cre)Kfra | Bolding et al., 2020 | MGI:6740547 | |
| Biological sample (Mus musculus) | Myo15 iCre/+: Myo15atm1.1(cre)Ugds | Caberlotto et al., 2011 | MGI:4361284 | |
| Biological sample (Mus musculus) | Slc6a5Cre/+: Slc6a5tm1.1(cre)Ksak | Kakizaki et al., 2017 | MGI:6382286 | |
| Biological sample (Mus musculus) | Ai14: Gt(ROSA)26Sortm14(CAG-tdTomato) | Jackson Laboratory | RRID:IMSR_JAX:007914 | |
| Biological sample (Mus musculus) | Ai34: Gt(Rosa)26Sortm34.1(CAG-Syp/tdTomato) | Jackson Laboratory | RRID:IMSR_JAX:012570 | |
| Biological sample (Mus musculus) | RCE:FRT: Gt(Rosa)26Sortm1.2(CAG-EGFP)Fsh | Sousa et al., 2009 | RRID:MMRRC_032038-JAX | |
| Biological sample (Mus musculus) | Ai32: Gt(Rosa)26Sortm32(CAG-COP4*H134R.EYFP) | Jackson Laboratory | RRID:IMSR_JAX:01256 | |
| Biological sample (Mus musculus) | Thy1: Tg(Thy1-YFP)HJrs | Jackson Laboratory | RRID:IMSR_JAX:003782 | |
| Antibody | Chicken polyclonal anti-GFP | Aves Labs | Cat# GFP-1020; RRID:AB_10000240 | 1:1000 |
| Antibody | Rabbit polyclonal anti-RFP | Rockland | Cat# 600-401-379; RRID:AB_2209751 | 1:1000 |
| Antibody | Goat polyclonal anti-Calretinin | Swant | Cat# CG1; RRID:AB_1000034 | 1:1000 |
| Antibody | Guinea Pig polyclonal anti-VGlut1 | Synaptic Systems | Cat# 135 304; RRID:AB_887878 | 1:500 |
| Chemical compound, drug | 4-Amynopyridine | Tocris | CAS: 504-24-5 | |
| Chemical compound, drug | 2,3-dioxo-6-nitro-7-sulfamoyl-benzo[f]quinoxaline (NBQX) | Tocris | CAS: 479347-86-9 | |
| Chemical compound, drug | ZD 7288 | Tocris | CAS: 133059-99-1 | |
| Chemical compound, drug | Cyclothiazide | Tocris | CAS: 2259-96-3 | |
| Chemical compound, drug | Strychnine | Sigma Aldrich | S0532, CAS: 57-24-9 | |
| Software, algorithm | Imaris | Oxford Instruments | Imaris | |
| Software, algorithm | ImageJ | https://imagej.net/ij/ | ImageJ | |
| Software, algorithm | pClamp9 | Molecular Devices | pClamp9 | |
| Software, algorithm | Igor Pro | Wavemetrics | Igor Pro | |
| Software, algorithm | NeuroMatic | http://www.neuromatic.thinkrandom.com/ | NeuroMatic | |
| Software, algorithm | NEURON simulation environment | https://neuron.yale.edu/neuron/ | NEURON simulation environment | |
| Software, algorithm | NEURON simulation code | https://modeldb.science/2018259 | NEURON simulation code | |
| Software, algorithm | Imaris | Oxford Instruments | Imaris |
Additional files
-
Supplementary file 1
Summary and description of experimental genotypes presented in figures.
Experimental genotypes, their abbreviations, and a description of reporter expression are listed for the relevant figures.
- https://cdn.elifesciences.org/articles/100492/elife-100492-supp1-v1.xlsx
-
MDAR checklist
- https://cdn.elifesciences.org/articles/100492/elife-100492-mdarchecklist1-v1.docx
Download links
A two-part list of links to download the article, or parts of the article, in various formats.
Downloads (link to download the article as PDF)
Open citations (links to open the citations from this article in various online reference manager services)
Cite this article (links to download the citations from this article in formats compatible with various reference manager tools)
An anatomical and physiological basis for flexible coincidence detection in the auditory system
eLife 13:RP100492.
https://doi.org/10.7554/eLife.100492.3


