Repeated activation of preoptic area recipient neurons in posterior paraventricular nucleus mediates chronic heat-induced negative emotional valence and hyperarousal states
- School of Biomedical Sciences, Faculty of Medicine, The Chinese University of Hong Kong, China
- Department of Neuroscience, College of Biomedicine, City University of Hong Kong, China
Figures
Figure 1 with 3 supplements
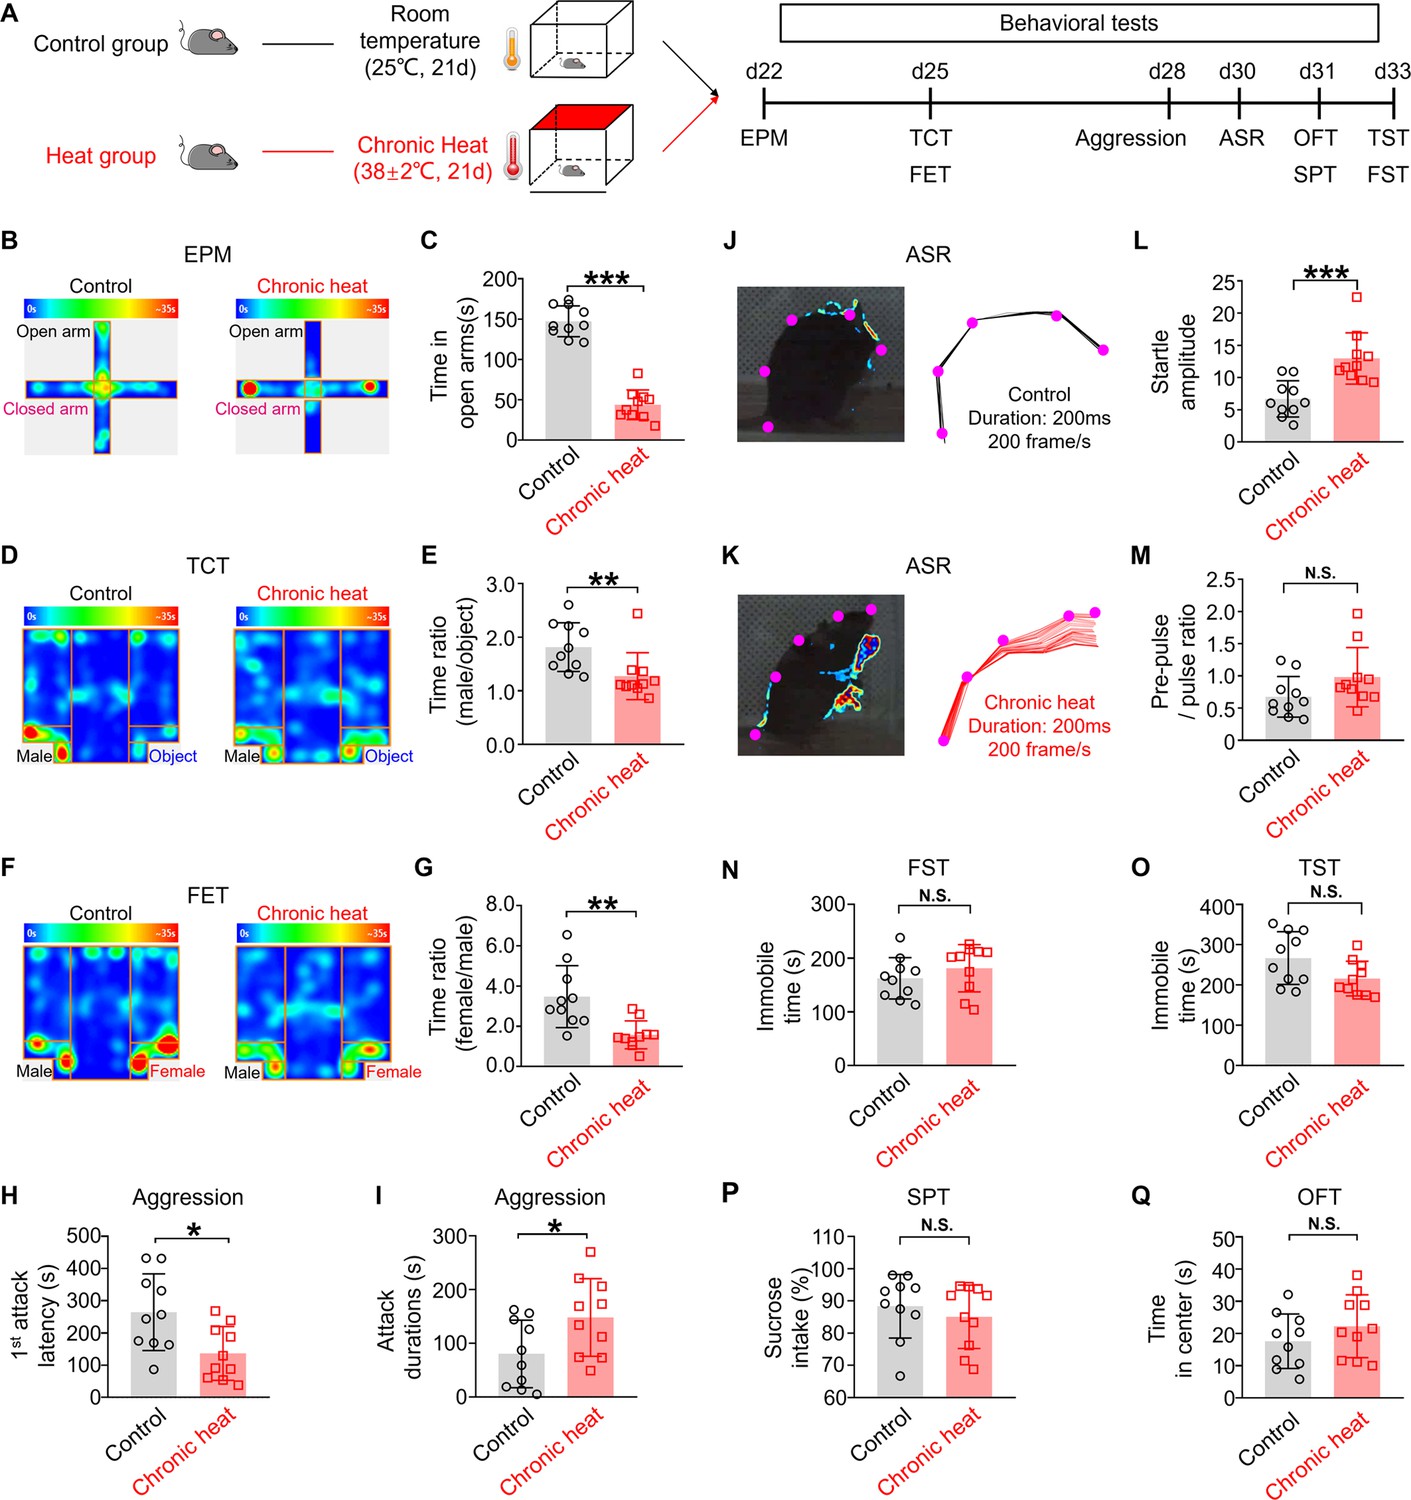
Chronic heat exposure produces negative emotional valence and hyperarousal states but not depression-like behaviors.
(A) Experimental schematics. Mice (n=10 in each group) were divided into Control and Heat groups and conducted with chronic exposure to room temperature and heat conditions, respectively, followed by behavioral tests. (B, C) The heatmaps of representative track tracing in elevated plus maze (EPM) test and the time spent in the open arms of EPM (Mann-Whitney unpaired two-tailed U test; U=0, ***p<0.001). (D, E) The representative heatmaps of in three-chamber test (TCT) and the interaction time with an unfamiliar male mouse relative to an inanimate object in TCT (Mann-Whitney unpaired two-tailed U test; U=13, ***p=0.0039). (F, G) The heatmap of representative tracking trace examples in female encounter test (FET) and the time surrounding the unfamiliar female mouse compared to an unfamiliar male mouse in FET (Mann-Whitney unpaired two-tailed U test; U=10, **p=0.0015). (H, I) The first-time attack latency (Mann-Whitney unpaired two-tailed U test; U=21, *p=0.0288) and the attack durations (Mann-Whitney unpaired two-tailed U test; U=23, *p=0.0433) in the aggression test. (J, K) Visualized and representative acoustic startle response (ASR) example (left panel) and corresponding labeled body parts’ skeletons (shown as purple dots) (right panel) in ASR test from control and chronic heat group.(L, M) The startle amplitude (Mann-Whitney unpaired two-tailed U test; U=6, ***p=0.0003) and the pre-pulse/pulse ratio (Mann-Whitney unpaired two-tailed U test; U=26, p=0.0753) in ASR test. (N–Q) The immobile time in the forced swim test (FST) (Mann-Whitney unpaired two-tailed U test; U=35, p=0.2799) and in the tail suspension test (TST) (Mann-Whitney unpaired two-tailed U test; U=26, p=0.0753). The percentage of sucrose intake in the sucrose preference test (SPT) (Mann-Whitney unpaired two-tailed U test; U=49.5, p=0.4887) and the time spent in the center of the open field test (OFT) (Mann-Whitney unpaired two-tailed U test; U=35.5, p=0.2888). *p<0.05, **p<0.01, ***p<0.001, NS: not significant.
Figure 1—figure supplement 1
The effect of chronic heat exposure on physiological states of mice and their motion activity during behavioral tests.
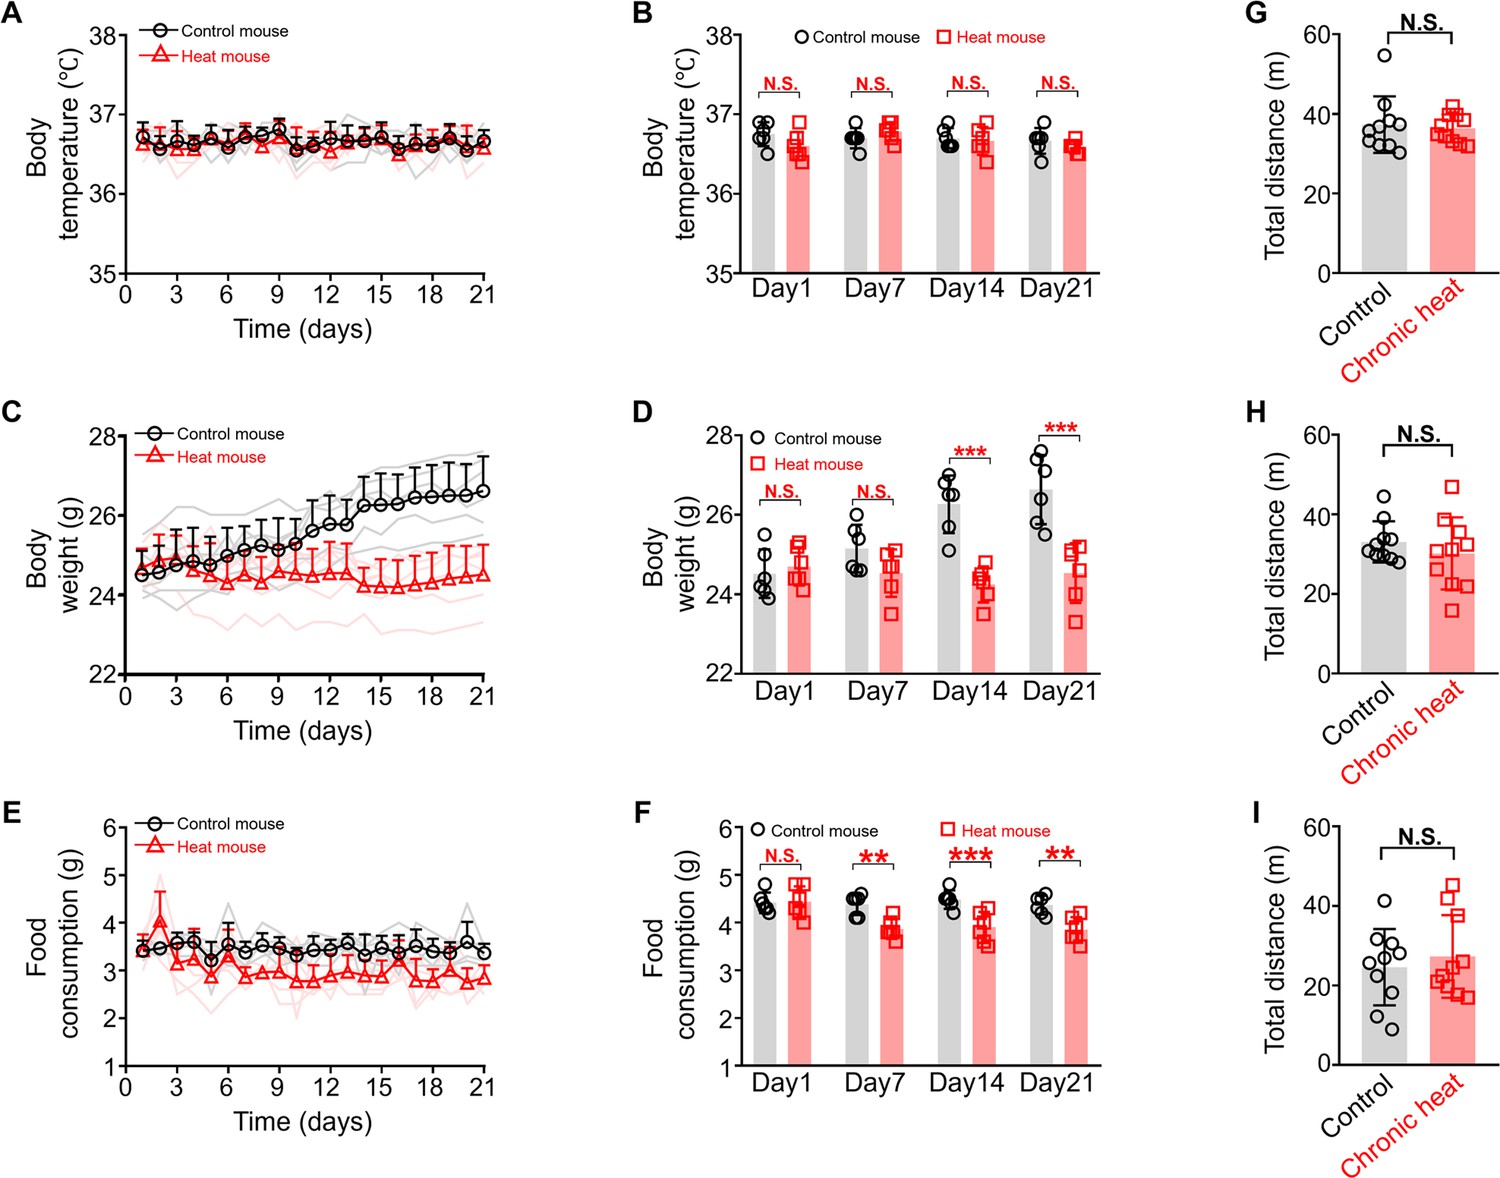
(A, B) Monitoring of body temperature of mice daily before heat exposure for both groups and statistical comparison (n=6 mice in each group, two-way repeated measures ANOVA with Sidak post hoc test; F(3, 40)=1.422, p=0.2505). (C, D) The effect of chronic heat exposure on mice’s body weight for both groups and statistical comparison (n=6 mice each, two-way repeated measures ANOVA with Sidak post hoc test; F(3, 30)=28.75, ***p<0.001). (E, F) The effect of chronic heat exposure on mice’s food consumption for both groups and statistical comparison (n=6 mice each, two-way repeated measures ANOVA with Sidak post hoc test; F(3, 40)=3.781, *p=0.0177). (G–I) Mice’s motion activity in the open-field test (n=10 mice each, Mann-Whitney unpaired two-tailed U test; U=47, p=0.8534), the three-chamber test (n=10 mice each, Mann-Whitney unpaired two-tailed U test; U=41, p=0.5288), and the female encounter test (n=10 mice each, Mann-Whitney unpaired two-tailed U test; U=48, p=0.9118). *p<0.05, **p<0.01, ***p<0.001, NS: not isignificant. See also Source data 1 for further statistical information.
Figure 1—figure supplement 2
Mice did not exhibit obvious changes of emotional valence and arousal states the day after acute heat exposure.
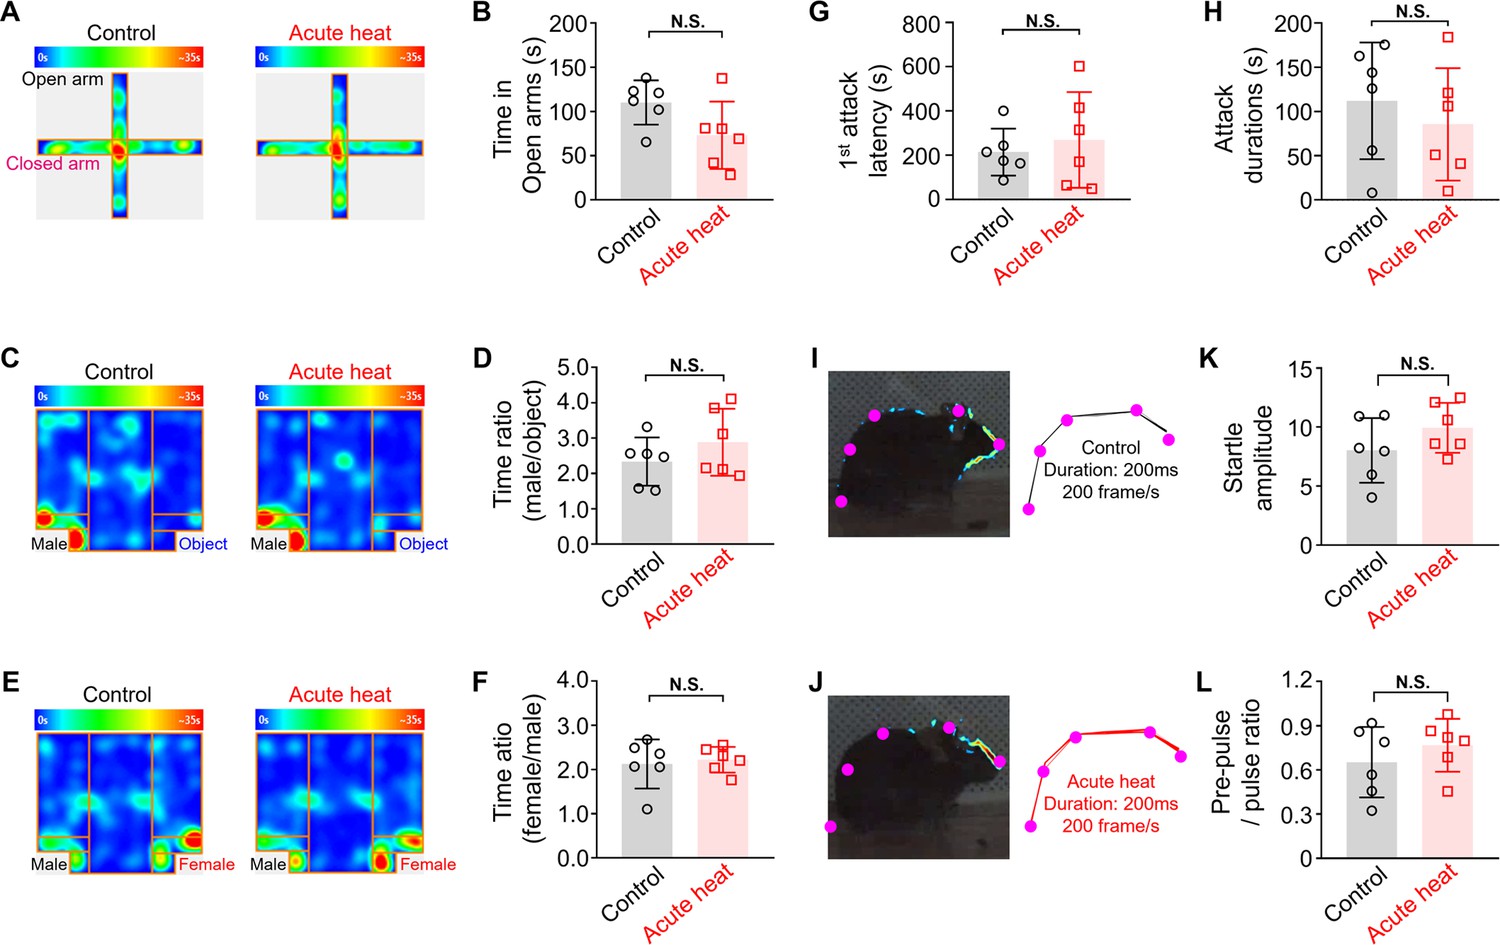
(A, B) The heatmap of representative tracking trace examples in elevated plus maze (EPM) test and the time spent in the open arms (n=6 mice, Mann-Whitney unpaired two-tailed U test; U=8, p=0.132). (C, D) The heatmap of representative tracking trace examples in three-chamber test (TCT) and the interaction time with an unfamiliar male mouse relative to the inanimate object (n=6 mice, Mann-Whitney unpaired two-tailed U test; U=13, p=0.4848). (E, F) The heatmap of representative tracking trace examples in female encounter test (FET) and the time surrounding the unfamiliar female mouse compared to an unfamiliar male mouse in FET compared for both groups (n=6 mice, Mann-Whitney unpaired two-tailed U test; U=17, p=0.9372). (G, H) The first-time attack latency (n=6 mice, Mann-Whitney unpaired two-tailed U test; U=17, p=0.9372) and the attack durations (n=6 mice, Mann-Whitney unpaired two-tailed U test; U=13, p=0.4848) in the aggression test. (I, J) Visualized acoustic startle response (ASR) examples (left panel) and corresponding labeled body parts’ skeletons (right panel) in ASR test from control group and acute heat group. (K, L) The startle amplitude (n=6 mice, Mann-Whitney unpaired two-tailed U test; U=10, p=0.2403) and the pre-pulse/pulse ratio (n=6 mice, Mann-Whitney unpaired two-tailed U test; U=13, p=0.4848) in ASR test. NS: not significant.
Figure 1—video 1
Representative video showed the delivery of a 105 dB sound stimulus within 200 ms evoked an obvious body fluctuation in the chronic heat-exposed mouse.
Figure 2 with 2 supplements
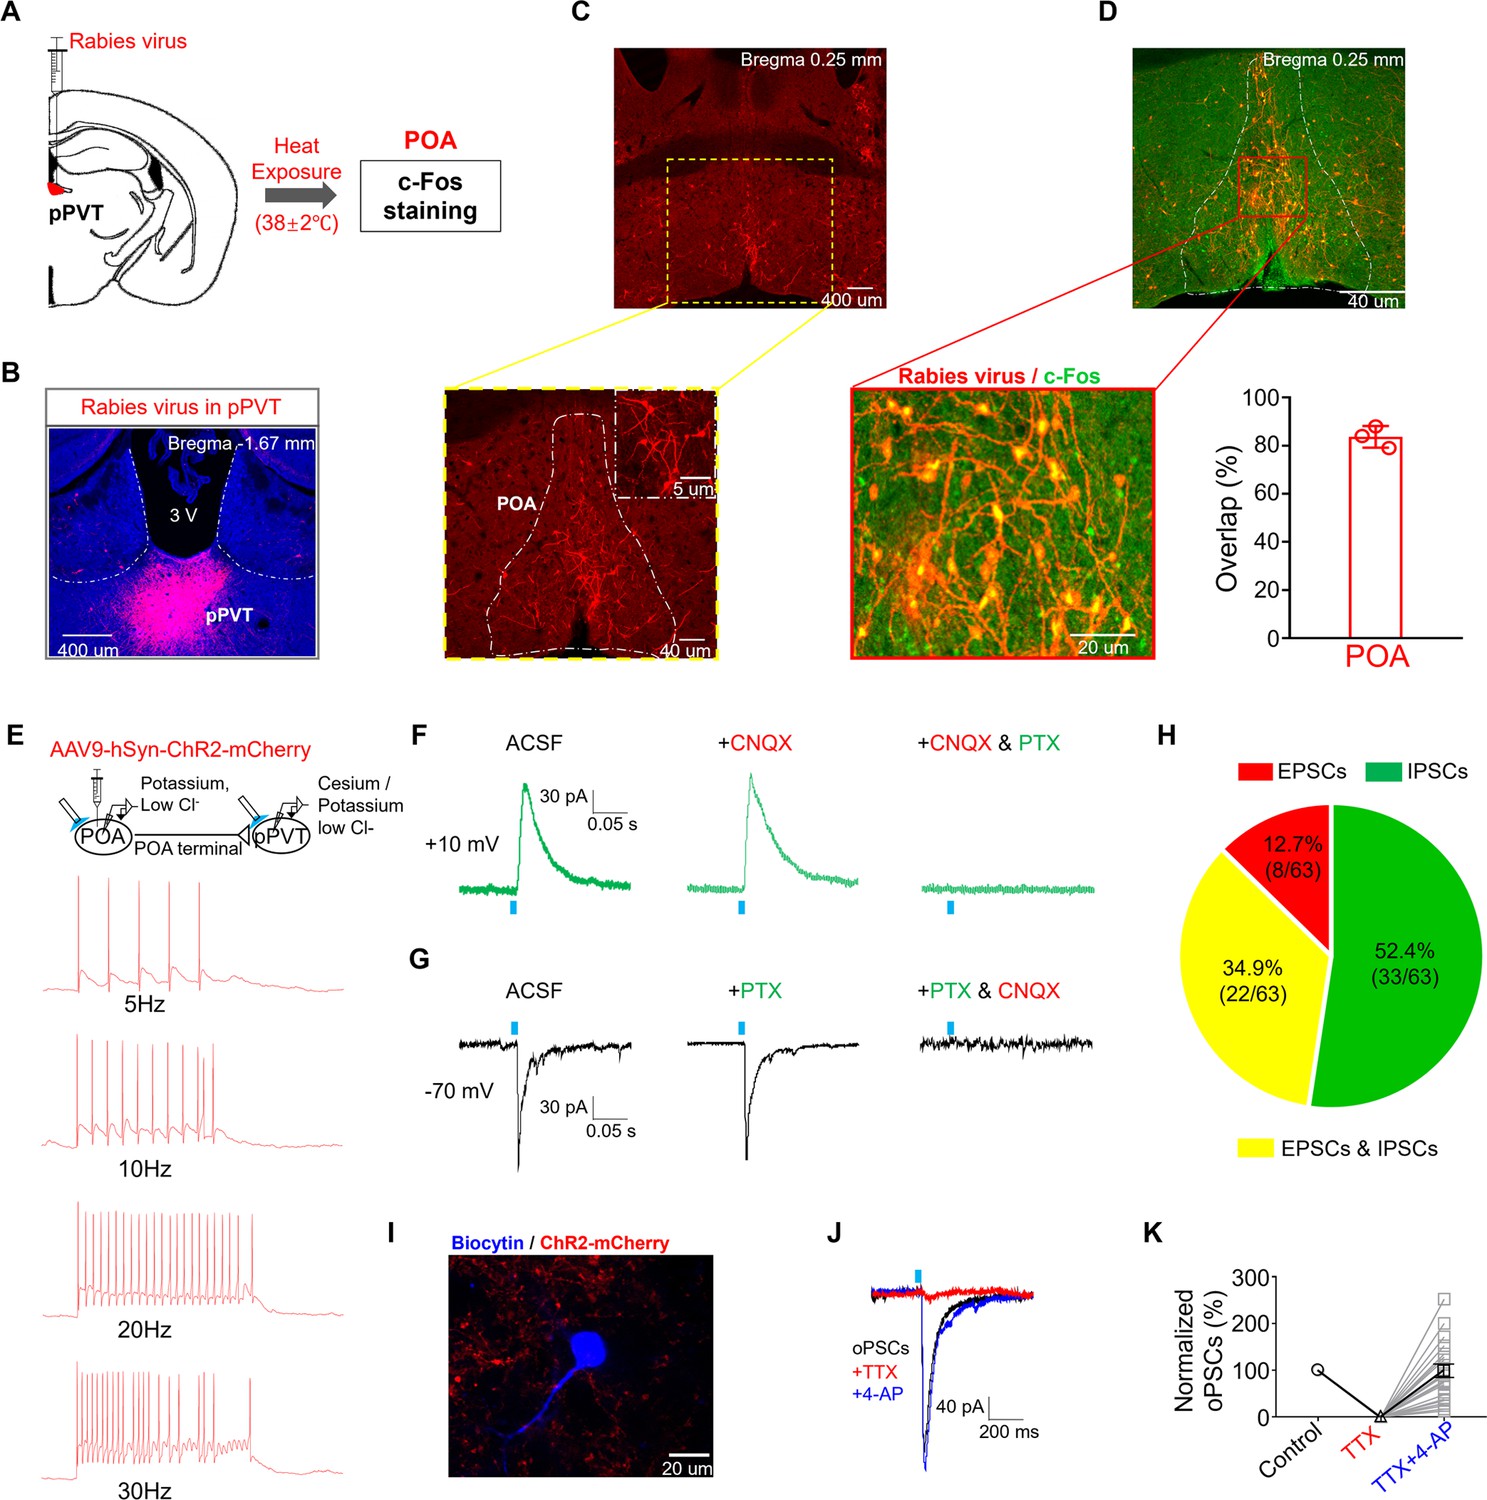
Involvement of the hypothalamic preoptic area (POA) to posterior paraventricular thalamus (pPVT) projections.
(A) The strategy of virus injection followed by heat exposure-induced c-Fos staining (n=3 mice). (B) The representative microphotograph showed the expression of rabies virus in the pPVT regions. (C) Rabies virus retro-labeled POA neurons. Upper: magnification: ×4, scale bar: 400 μm. Lower: magnification: ×10, scale bar: 40 μm. The top right corner of the lower picture: magnification: ×60, scale bar: 5 μm. (D) The representative microphotograph and quantification showed that most of pPVT rabies virus retro-labeled POA neurons co-stained with heat exposure-induced c-Fos. Upper: magnification: ×10, scale bar: 40 μm. Lower and left: magnification: ×20, scale bar: 20 μm. (E) The strategy of virus injection (n=5 mice) and patch-clamp recording was performed on POA expressing ChR2-mCherry neurons and pPVT neurons using potassium and cesium, low chloride internal solutions, respectively. Representative traces showed that POA expressing ChR2-mCherry neurons exhibited robust firing in response to optical stimulation at different frequencies (n=15 neurons from 5 mice). (F, G) Representative traces showed that blue light stimulation evoked either excitatory postsynaptic current (EPSC) which could be blocked by cyanquixaline (CNQX, 10 μM) or inhibitory postsynaptic current (IPSC) which could be blocked by picrotoxin (PTX, 100 nM). (H) Pie chart showed the projection types recorded on pPVT neurons (n=63 neurons from 10 mice). (I) The representative recorded pPVT neuron was visualized by biocytin staining and was found being surrounded by POA expressing ChR2-mCherry terminals. Magnification: ×60, scale bar: 20 μm. (J, K) The representative trace showed that the application of tetrodotoxin (TTX) eliminated the oPSC held at –70 mV while the addition of 4-aminopyridine (4-AP, 1 mM) recovered it and the quantification (n=24 neurons from 10 mice).
Figure 2—figure supplement 1
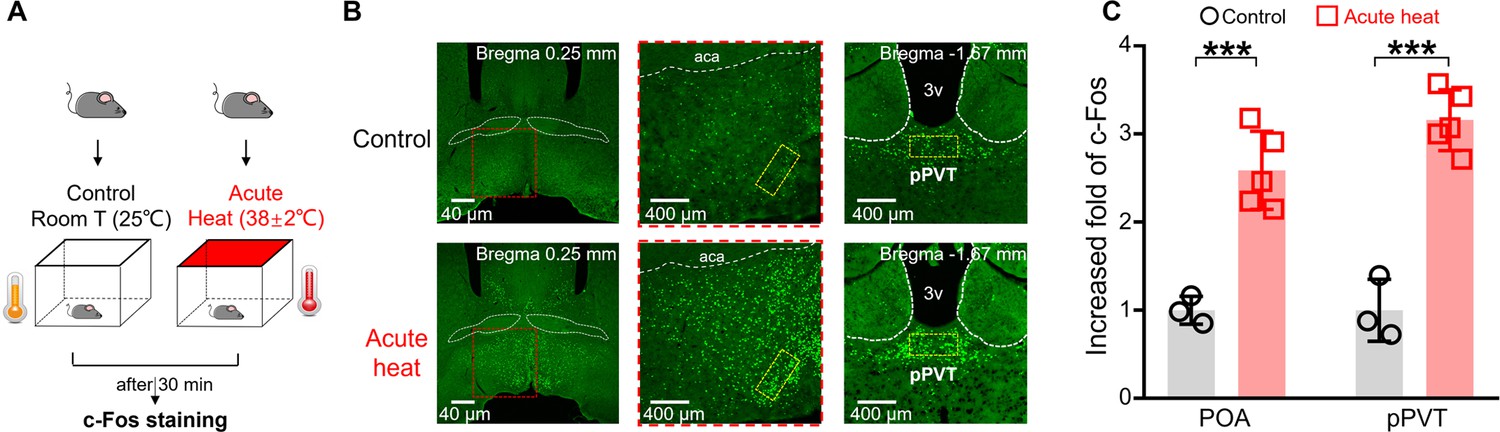
Posterior paraventricular thalamus (pPVT) was strongly activated after single-time heat exposure.
(A) Experimental schematics. Mice (n≥3 in each group) were randomly assigned to the control and acute heat groups, followed by immunofluorescent staining and confocal imaging. (B) The representative microphotographs (each with a rectangular box (400 μm [L] × 200 μm [W]) for subsequent quantification) showed the c-Fos expression of the hypothalamic preoptic area (POA) and pPVT for both groups. Magnification: left: ×4, middle: ×10, right: ×10. Scale bar: left: 40 μm, middle: 400 μm, right: 400 μm. (C) The c-Fos expression compared for both groups for both POA and pPVT (two-way repeated measures ANOVA with Sidak post hoc test; interaction: F(1, 12)=2.103, p=0.2505; heat treatment main effect: F(1, 12)=68.15, ***p<0.001; brain nuclei effect: F(1, 12)=5.159, p=0.0423; POA: control vs. acute heat: ***p<0.001; pPVT: control vs. acute heat: ***p=0.0008). ***p<0.001.
Figure 2—figure supplement 2
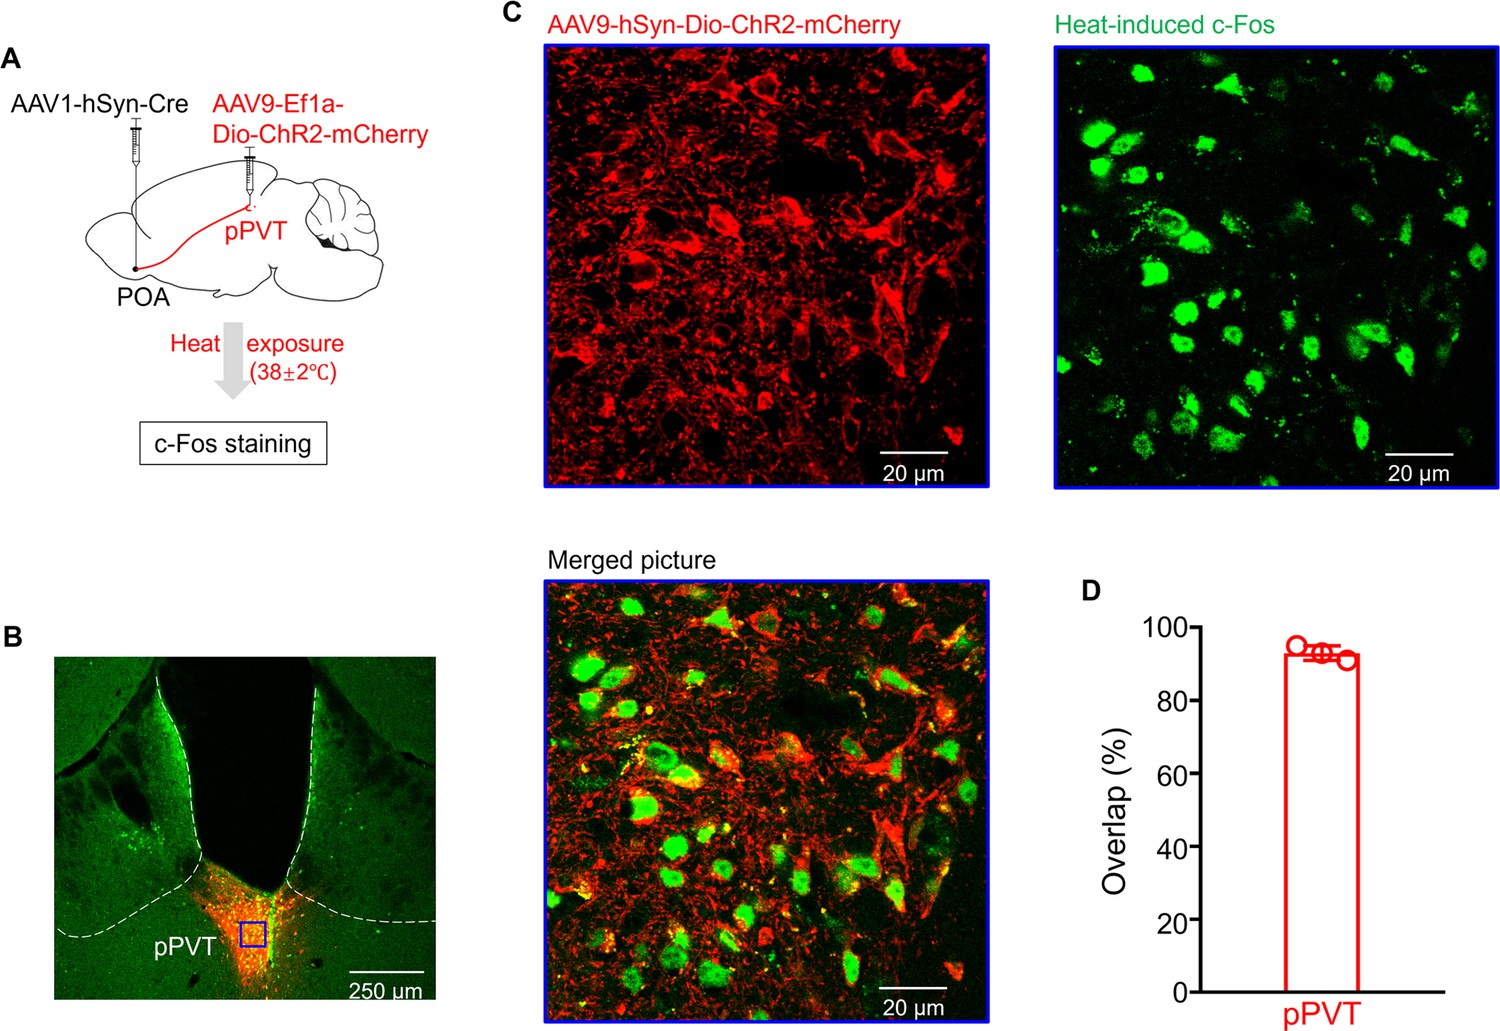
Preoptic area (POA) recipient posterior paraventricular thalamus (pPVT) neurons were activated after heat exposure.
(A) Experimental schematics. Mice (n=3) were stereotaxically injected with AAV1-hSyn-Cre-EGFP in the POA and AAV9-Ef1a-Dio-ChR2-mCherry in the pPVT, followed by heat exposure and c-Fos staining. (B) The representative picture showed Cre-dependent ChR2-mCherry successfully expressed on pPVT neurons, embedded with c-Fos expression with green fluorescence. Magnification: ×4, scale bar: 250 μm. (C) The amplified pictures from the blue box in (B), from left to right, respectively showed the expressions of ChR2-mCherry around the cell membrane, c-Fos with green fluorescence from the nuclei, and the merged picture of pPVT neurons. Magnification: ×100, scale bar: 20 μm. (D) The quantification of overlapping percentages of POA recipient pPVT neurons and heat exposure-induced c-Fos.
Figure 3 with 3 supplements
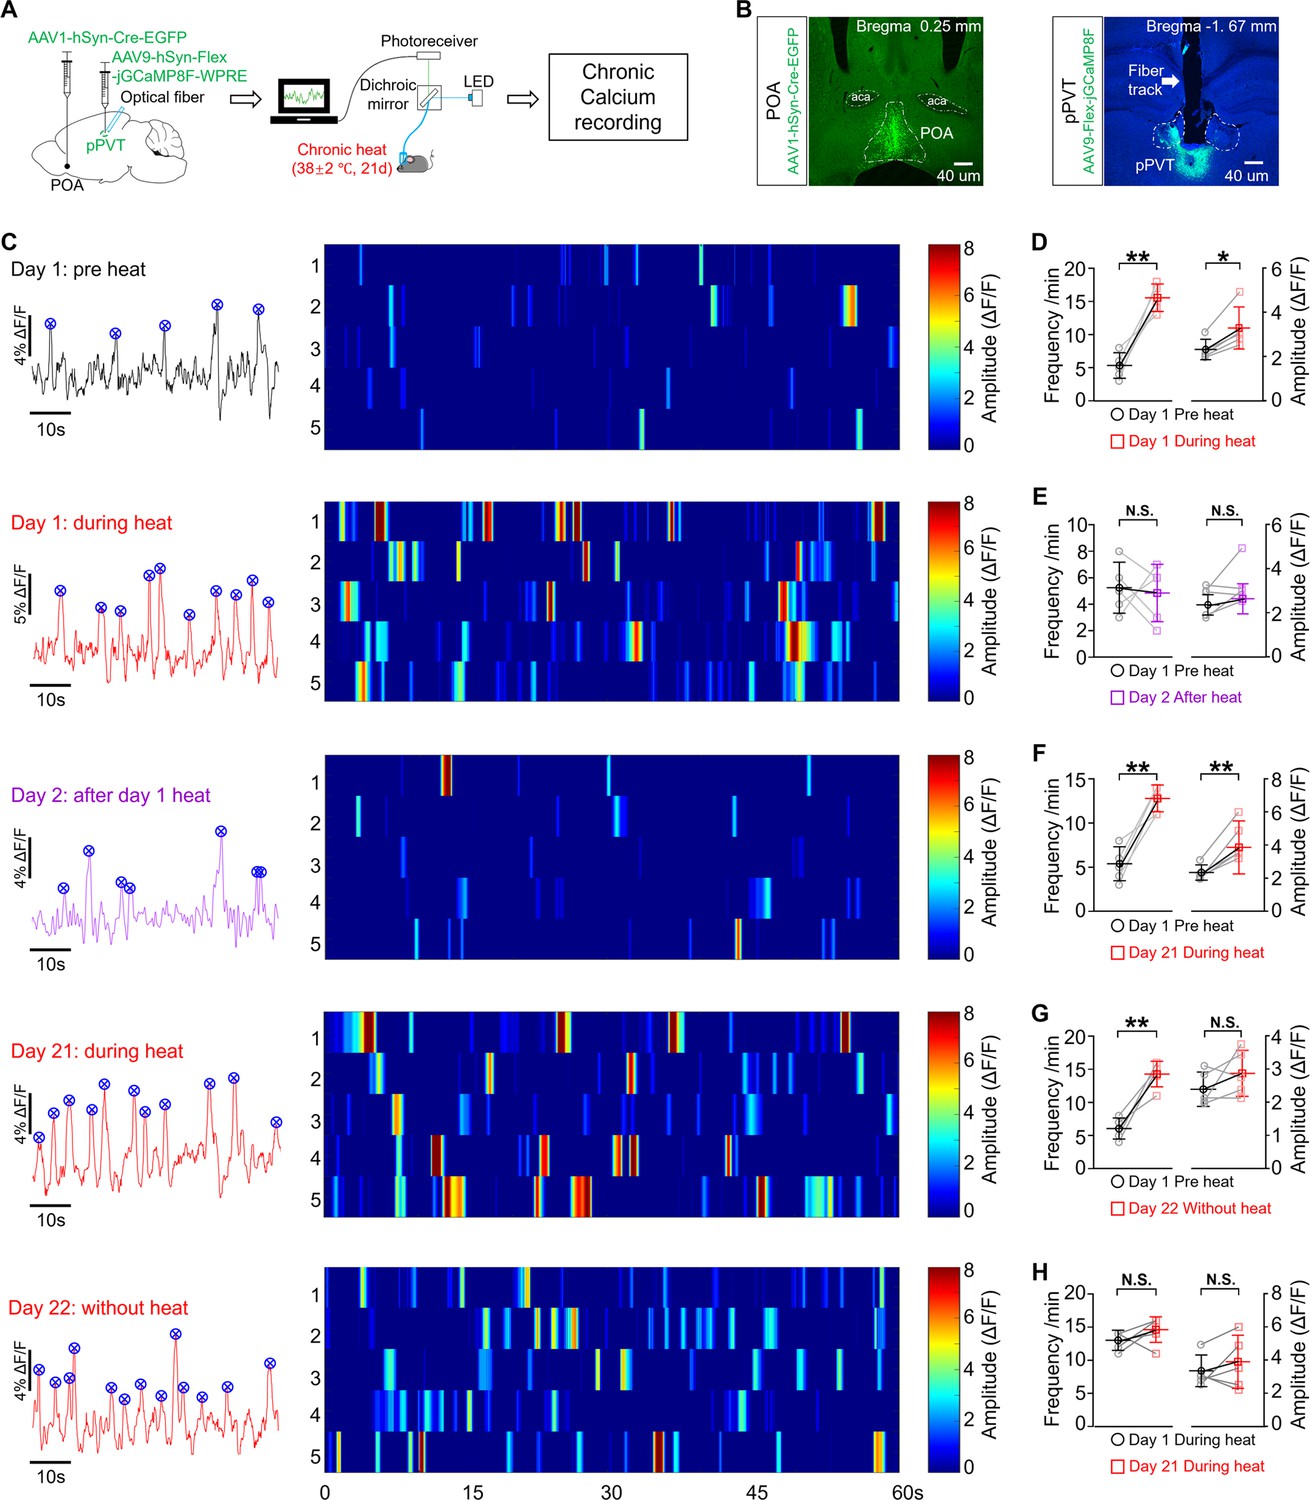
Activity changes of preoptic area (POA) recipient posterior paraventricular thalamus (pPVT) neurons throughout chronic heat exposure.
(A) Experimental schematics. Mice (n=5) were stereotaxically injected with Cre-dependent GCaMP into the pPVT, followed by the implantation of optical fiber and chronic calcium recording. (B) Representative microphotographs showed the virus expression in the POA and pPVT regions, scale bar: all 40 μm. (C) From the top to the bottom: the representative calcium events (on the left panel) and the calcium events from different mice (on the right panel) on different days. Each vertical stripe in the heatmap represents one calcium event for each mouse. Statistical analysis of the frequency and amplitude of POA recipient pPVT neurons’ calcium events compared for (D) pre and during heat exposure on day 1 (paired, parametric, two-tailed t-test; frequency (t=6.278, df = 4, p=0.0033); amplitude (t=4.344, df = 4, *p=0.0122)); (E) pre heat on day 1 and after heat on day 2 (paired, parametric, two-tailed t-test; frequency (t=0.2787, df = 4, p=0.7943); amplitude (t=1.726, df = 4, p=0.1595)); (F) pre heat on day 1 and during heat exposure on day 21 (paired, parametric, two-tailed t-test; frequency (t=6.124, df = 4, **p=0.0036); amplitude (t=4.704, df = 4, **p=0.0093)); (G) pre heat on day 1 and after chronic heat on day 22 (paired, parametric, two-tailed t-test; frequency (t=6.216, df = 4, **p=0.0034); amplitude (t=1.36, df = 4, p=0.2454)); (H) during heat exposure on day 1 and day 21 (paired, parametric, two-tailed t-test; frequency (t=1.242, df = 4, p=0.2821); amplitude (t=0.9424, df = 4, p=0.3993)). *p<0.05, **p<0.01, NS: not significant.
Figure 3—figure supplement 1

The calcium activities of the preoptic area (POA) recipient posterior paraventricular thalamus (pPVT) neurons were stable within our experimental period.
(A, B) The representative trace (left panel) and the overview of calcium events (right panel) of the control group from day 1 and day 22. (C, D) The changes of frequency (paired, parametric, two-tailed t-test; t=0.2325, df = 4, p=0.8276) and amplitude (paired, parametric, two-tailed t-test; t=0.2840, df = 4, p=0.7905) of calcium events between day 1 and day 22. NS: not significant.
Figure 3—figure supplement 2
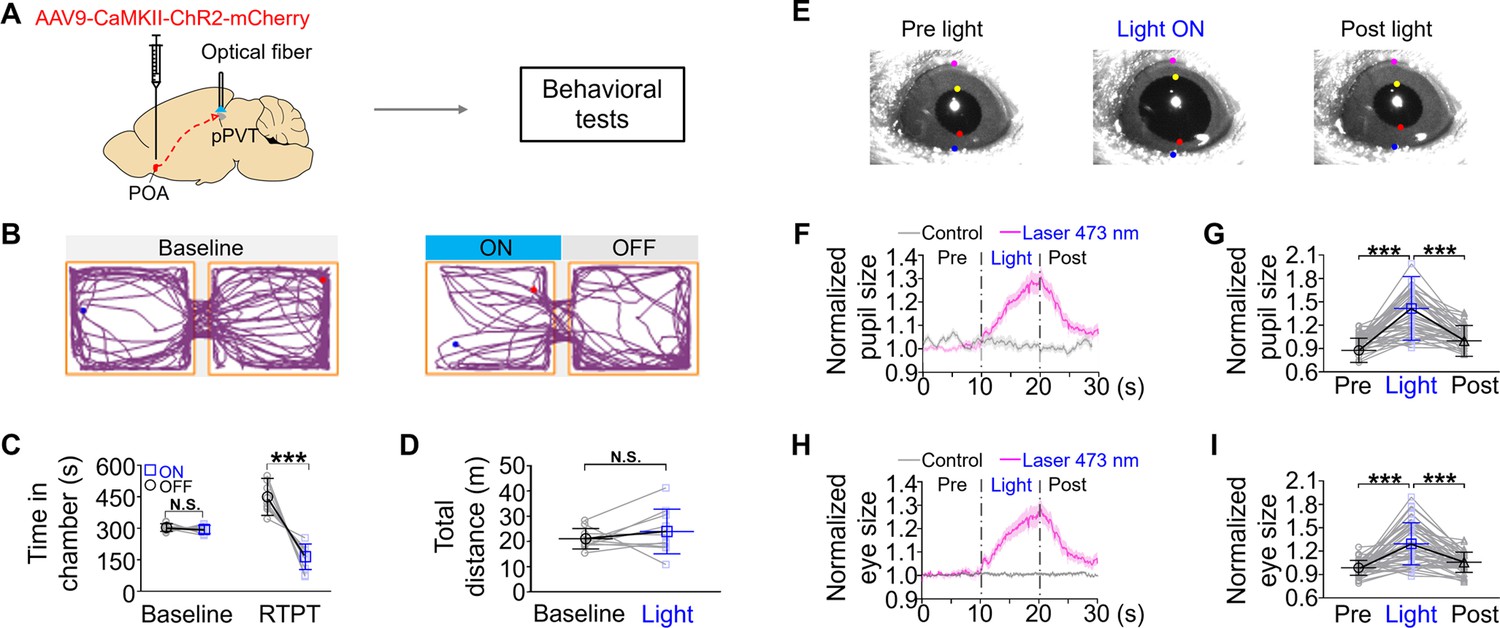
Optogenetic activation of preoptic area (POA) excitatory neuronal terminals within posterior paraventricular thalamus (pPVT) produced aversive emotional valence and increased pupil size in mice.
(A) Experimental schematics. Mice (n=10) were stereotaxically injected with AAV9-CaMKII-ChR2-mCherry in the POA, followed by the implantation of optical fiber in the pPVT. (B) Representative pictures showed mice’s trajectory in the chamber without and with optogenetic activation, respectively. (C) The time of mice spent in the chamber associated with blue light stimulation (two-way repeated measures ANOVA with Sidak post hoc test; interaction: F(1, 18)=33.59, ***p<0.0001; optical stimulation main effect: F(1, 18)=38.41, ***p<0.0001; chamber effect: F(1, 18)=1.42, p=0.2489; baseline: OFF vs. ON: p=0.9513; real-time place test: OFF vs. ON: ***p<0.001). (D) The locomotion activity during the real-time place test (paired, parametric, two-tailed t-test; t=1.006, df = 4, p=0.3406). (E) The representative pictures showed the pupil of mice pre-, during-, and post-light stimulation. (F, G) The changes of the pupil diameter (the vertical distance between yellow and red dots) of mice when the blue light was on and statistical comparison (one-way repeated measures ANOVA with Tukey post hoc test; F(1.508, 67.88)=56.28, ***p<0.001; pre vs. light: ***p<0.001; light vs. post: ***p<0.001). (H, I) The eye diameter (the vertical distance between purple and blue dots) of mice when the blue light was on and statistical comparison (one-way repeated measures ANOVA with Tukey post hoc test; F(1.378, 62.01)=47.58, ***p<0.001; pre vs. light: ***p<0.001; light vs. post: ***p<0.001). ***p<0.001, NS: not significant.
Figure 3—video 1
Representative video showed the enlargement of both the pupil and eye sizes of the head-fixed mouse during blue light stimulation of preoptic area (POA) excitatory terminals within posterior paraventricular thalamus (pPVT).
Figure 4
Preoptic area (POA) recipient posterior paraventricular thalamus (pPVT) neurons are sufficient and necessary for chronic heat exposure-induced negative emotional valence and hyperarousal states in mice.
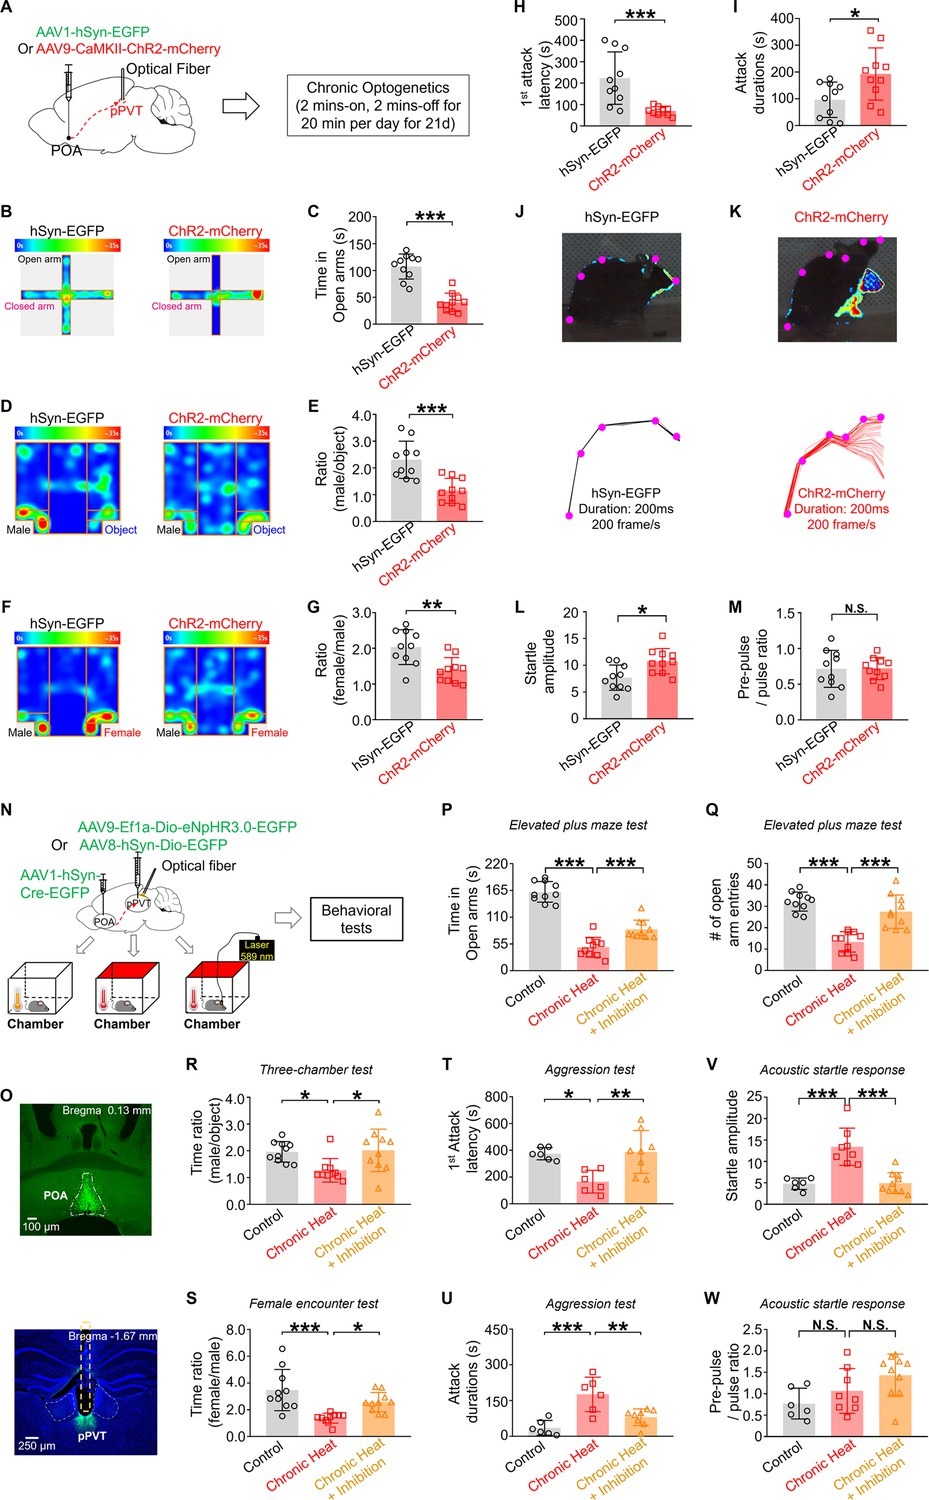
(A) Experimental schematics. Mice (n=10 in each group) were stereotaxically injected with either AAV1-hSyn-EGFP or AAV9-Camk2a-ChR2-mCherry into the POA, followed by the implantation of optical fiber into pPVT, chronic optogenetic activation, and behavioral tests. (B, C) The heatmap of representative tracking trace examples in elevated plus maze (EPM) test and the time spent in the open arms (Mann-Whitney unpaired two-tailed U test; U=2, ***p<0.001). (D, E) The heatmap of representative tracking trace examples in three-chamber test (TCT) and the interaction time with an unfamiliar male mouse relative to the inanimate object (Mann-Whitney unpaired two-tailed U test, U=8; ***p=0.0007). (F, G) The heatmap of representative tracking trace examples in female encounter test (FET) and the time surrounding the unfamiliar female mouse compared to an unfamiliar male mouse (Mann-Whitney unpaired two-tailed U test; U=13, **p=0.0039). (H, I) The first-time attack latency (Mann-Whitney unpaired two-tailed U test; U=8, p=0.007) and the attack durations (Mann-Whitney unpaired two-tailed U test; U=19, *p=0.0185) in the aggression test. (J, K) Visualized acoustic startle response (ASR) examples (upper panel) and corresponding labeled body parts’ skeletons (lower panel) from hSyn-EGFP group and ChR2-mCherry group. (L, M) The startle amplitude (Mann-Whitney unpaired two-tailed U test; U=17, *p=0.0115) and the pre-pulse/pulse ratio (Mann-Whitney unpaired two-tailed U test; U=48, p=0.9118) in ASR test. (N) Experimental schematics. Mice (n≥6 in each group) were stereotaxically injected with AAV1-hSyn-Cre-EGFP in the POA and either AAV9-Ef1a-Dio-eNpHR3.0-EGFP or AAV8-hSyn-Dio-EGFP into the pPVT, followed by the implantation of optical fiber and behavioral tests. (O) Representative microphotographs showed the expression of AAV1-hSyn-Cre-EGFP and AAV9-hSyn-Dio-eNpHR3.0 within the POA and pPVT, respectively. Magnification: ×4, scale bar: 100 μm (upper panel) and 250 μm (lower panel). (P, Q) The time (one-way repeated measures ANOVA with Tukey post hoc test; F(2, 27)=83.03, ***p<0.001; control vs. chronic heat, ***p<0.001; chronic heat vs. chronic heat+inhibition, ***p<0.001) and the entry numbers (one-way repeated measures ANOVA with Tukey post hoc test; F(2, 20.92)=27.96, ***p<0.001; control vs. chronic heat, ***p<0.001; chronic heat vs. chronic heat+inhibition, ***p<0.001) into the open arms of EPM. (R) The time spent with an unfamiliar male mouse compared to an inanimate object in TCT (one-way repeated measures ANOVA with Tukey post hoc test; F(2, 27)=5.381, *p=0.0108; control vs. chronic heat, *p=0.0292; chronic heat vs. chronic heat+inhibition, *p=0.0175). (S) The ratio of time with an unfamiliar female mouse compared to an unfamiliar male mouse in FET (one-way repeated measures ANOVA with Tukey post hoc test; F(2, 27)=10.94, ***p=0.0003; control vs. chronic heat, ***p=0.0002; chronic heat vs. chronic heat+inhibition, *p=0.0335). (T, U) The first-time attack latency (one-way repeated measures ANOVA with Tukey post hoc test; F(2, 17)=7.426, *p=0.0048; control vs. chronic heat, *p=0.0157; chronic heat vs. chronic heat+inhibition, *p=0.0063) and the attack durations (one-way repeated measures ANOVA with Tukey post hoc test; F(2, 17)=13.38, ***p=0.0003; control vs. chronic heat, ***p=0.0003; chronic heat vs. chronic heat+inhibition, **p=0.0051) in the aggression test. (V, W) The startle amplitude (one-way repeated measures ANOVA with Tukey post hoc test; F(2, 21)=21.03, ****p<0.0001; control vs. chronic heat, ***p<0.001; chronic heat vs. chronic heat+inhibition, ***p<0.001) and the pre-pulse/pulse ratio (one-way repeated measures ANOVA with Tukey post hoc test; F(2, 21)=3.802, *p=0.039; control vs. chronic heat, p=0.2616; chronic heat vs. chronic heat+inhibition, p=0.2246) in ASR test. *p<0.05, **p<0.01, ***p<0.001, NS: not significant.
Figure 5 with 1 supplement
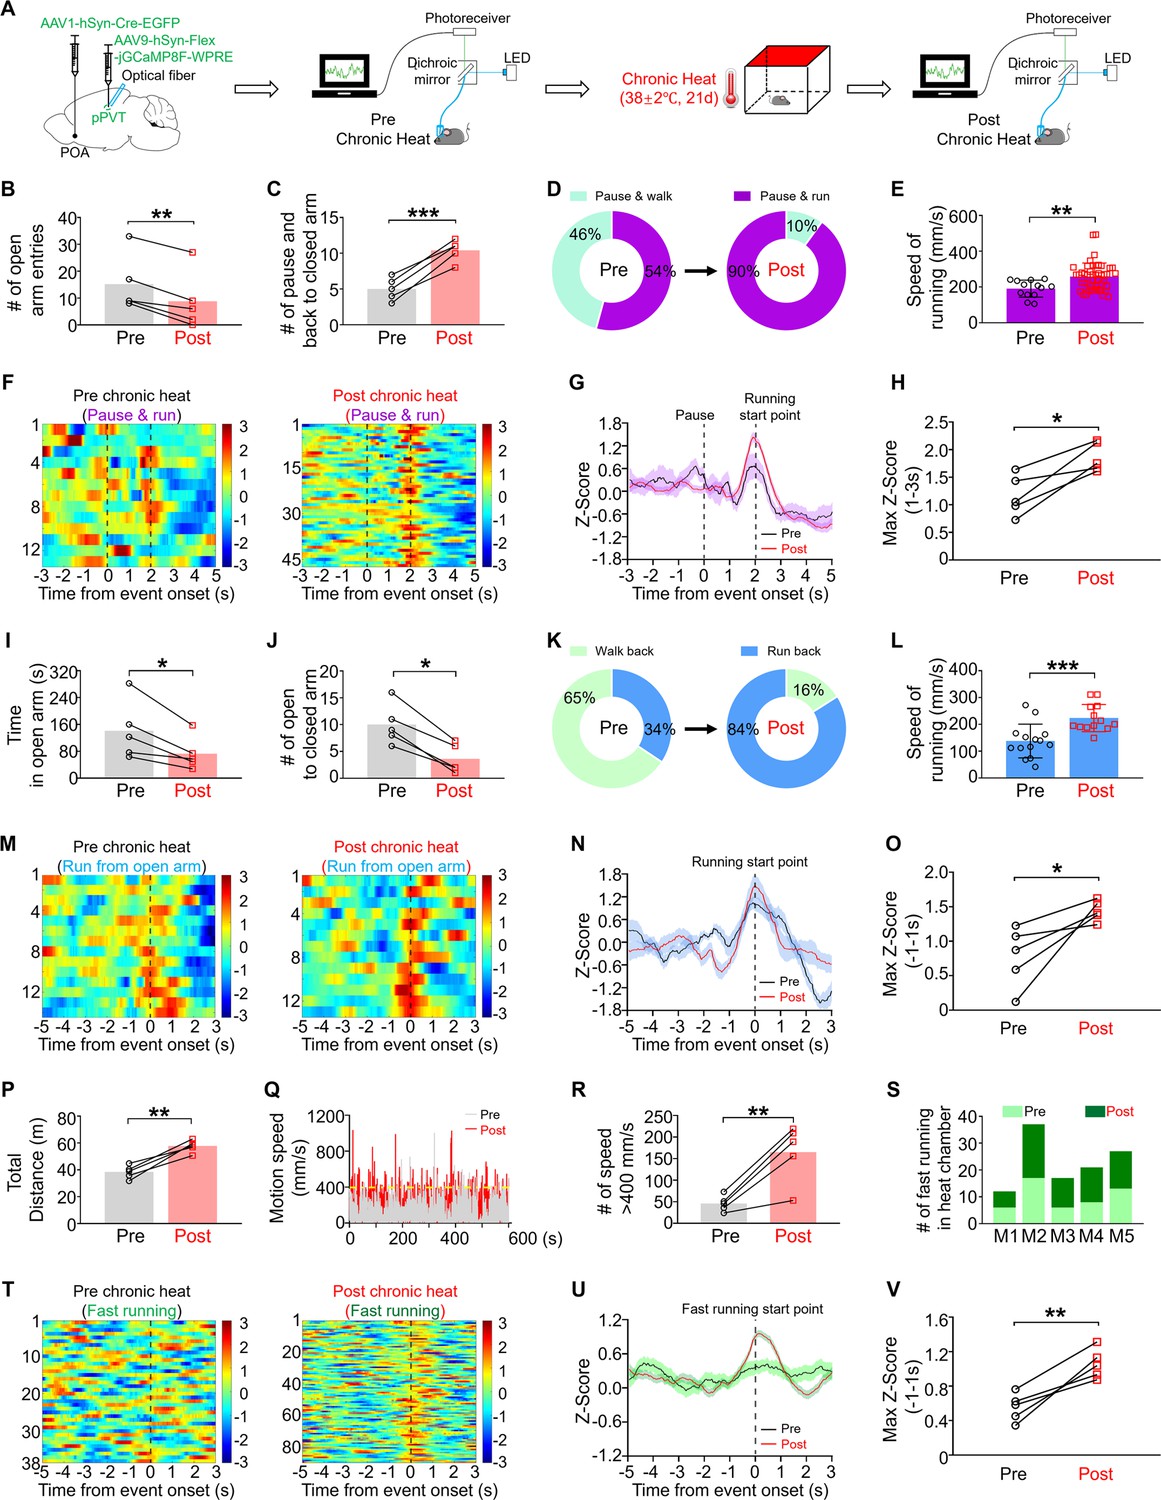
Chronically activated preoptic area (POA) recipient posterior paraventricular thalamus (pPVT) neurons exhibited exaggerated response to stressful situations.
(A) Experimental schematics. Mice (n=5) were stereotaxically injected with AAV1-hSyn-Cre-EGFP in the POA and AAV9-hSyn-Flex-jGCaMP8F-WPRE in the pPVT, followed by the implantation of optical fiber and calcium recording. (B) The number of entries into the open arms of elevated plus maze (EPM) (paired, parametric, two-tailed t-test; t=6.901, df = 4, **p=0.0023). (C) The number of instances where the mice paused at the center area followed by back to closed arms of EPM (paired, parametric, two-tailed t-test; t=9, df = 4, ***p=0.0008). (D) Pie chart showed the changes of the percentage of pause and then running back to closed arms. (E) The changes of running speed in EPM (Mann-Whitney unpaired two-tailed U test; U=139, **p=0.0028). (F–H) Heatmaps showed the calcium activities of POA recipient pPVT neurons when mice performed the pause-and-run-back-to-closed-arms behavior for pre (n=13 trials from 5 mice) and post conditions (n=47 trials from 5 mice), Z-score calcium signals, and statistical comparison (paired, parametric, two-tailed t-test; t=4.387, df = 4, *p=0.0118). (I) The time spent in open arms of EPM (paired, parametric, two-tailed t-test; t=3.649, df = 4, *p=0.0218). (J) The total number of the behavioral event: back from open to closed arms (paired, parametric, two-tailed t-test; t=6.901, df = 4, **p=0.0023). (K) Pie chart showed the changes of the number of running episodes from open to closed arms for pre and post conditions. (L) The changes of running speed in EPM (Mann-Whitney unpaired two-tailed U test; U=23, ***p=0.0005). (M–O) Heatmaps showed the calcium activities of POA recipient pPVT neurons when mice performed fast running from open to closed arms for pre (n=14 trials from 5 mice) and post conditions (n=13 trials from 5 mice), Z-score calcium signals, and statistical comparison (paired, parametric, two-tailed t-test; t=3.087, df = 4, *p=0.0367). (P) The total distances of mice traveled in the chamber previously subjected to chronic heat (paired, parametric, two-tailed t-test; t=6.876, df = 4, **p=0.0023). (Q) The changes of motion speed for pre and post conditions from one representative mouse. (R) The number of instances with motion speed exceeding 400 mm/s (paired, parametric, two-tailed t-test; t=5.100, df = 4, ***p=0.007). (S) The number of fast running episodes for pre and post conditions. (T–V) Heatmaps showed the calcium activities of POA recipient pPVT neurons when the mice performed fast running in the previous chronic heat-exposed chamber (n=90 trials from 5 mice) compared to pre-heat condition (n=38 trials from 5 mice), Z-score calcium signals, and statistical comparison (paired, parametric, two-tailed t-test; t=5.456, df = 4, **p=0.0055). *p<0.05, **p<0.01, ***p<0.001.
Figure 5—figure supplement 1
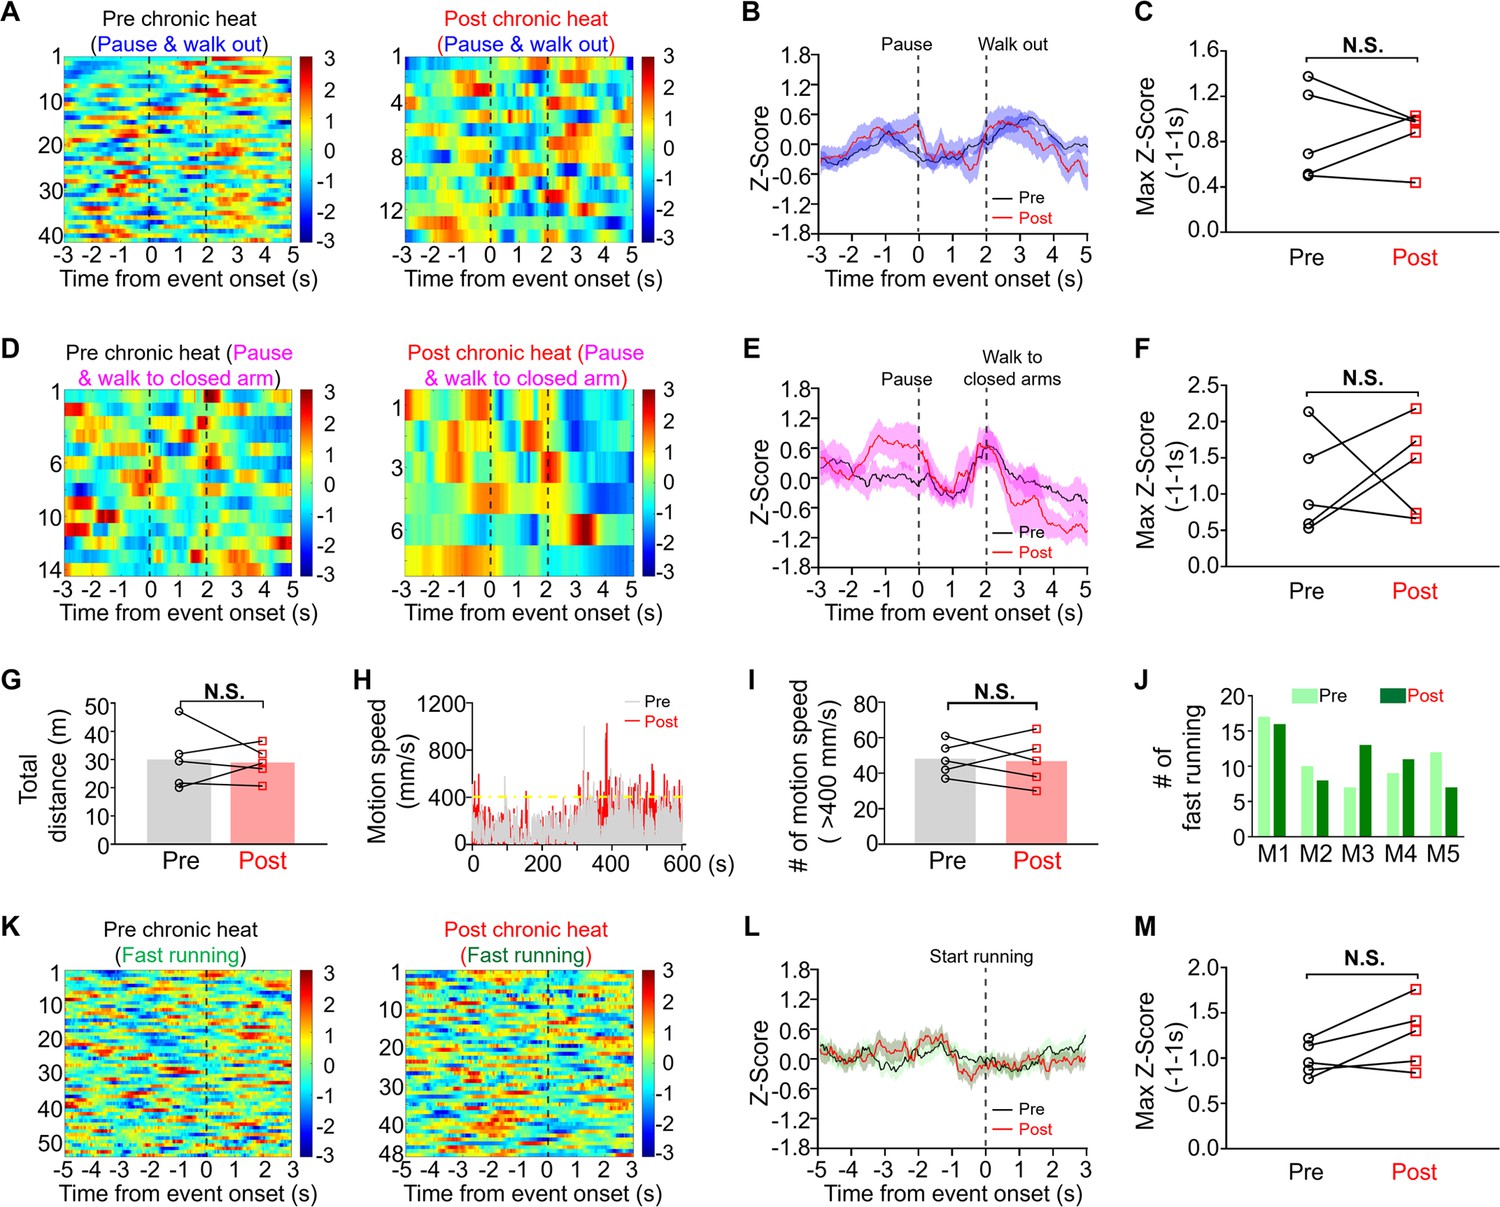
Preoptic area (POA) recipient posterior paraventricular thalamus (pPVT) neurons did not exhibit obvious changes in calcium activities when mice performed pause and walked to open arms, or walked to closed arms in the elevated plus maze (EPM), or displayed fast running in a heat-exposure-unrelated chamber.
(A–C) Heatmap showed the changes of calcium activities of the POA recipient pPVT neurons when mice performed pause and walked toward the open arms in the pre (n=41 trials from 5 mice) and post heat conditions (n=14 trials from 5 mice), Z-score calcium signals, and statistical comparison (paired, parametric, two-tailed t-test; t=0.02394, df = 4, *p=0.98). (D–F) Heatmap showed the changes of calcium activities of POA recipient pPVT neurons when mice performed pause and walked to the closed arms in the pre heat (n=14 trials from 5 mice) and post heat conditions (n=7 trials from 5 mice), Z-score calcium signals, and statistical comparison (paired, parametric, two-tailed t-test; t=0.5117, df = 4, *p=0.6358). (G) The changes in the total distance (paired, parametric, two-tailed t-test; t=0.2717, df = 4, p=0.7993). (H) The changes of motion speed for pre and post conditions from one representative mouse. (I) The number of instances where motion speed exceeded 400 mm/s (paired, parametric, two-tailed t-test; t=0.2597, df = 4, p=0.8079). (J) The number of fast running episodes compared for the pre and post heat conditions when mice were placed in a chamber unrelated to heat exposure. (K–M) Heatmap showed the calcium activities of the POA recipient pPVT neurons when mice performed fast running in the pre (n=54 trials from 5 mice) and post heat conditions (n=48 trials from 5 mice), Z-score calcium signals, and statistical comparison (paired, parametric, two-tailed t-test; t=2.114, df = 4, *p=0.1021). NS: not important.
Figure 6 with 1 supplement
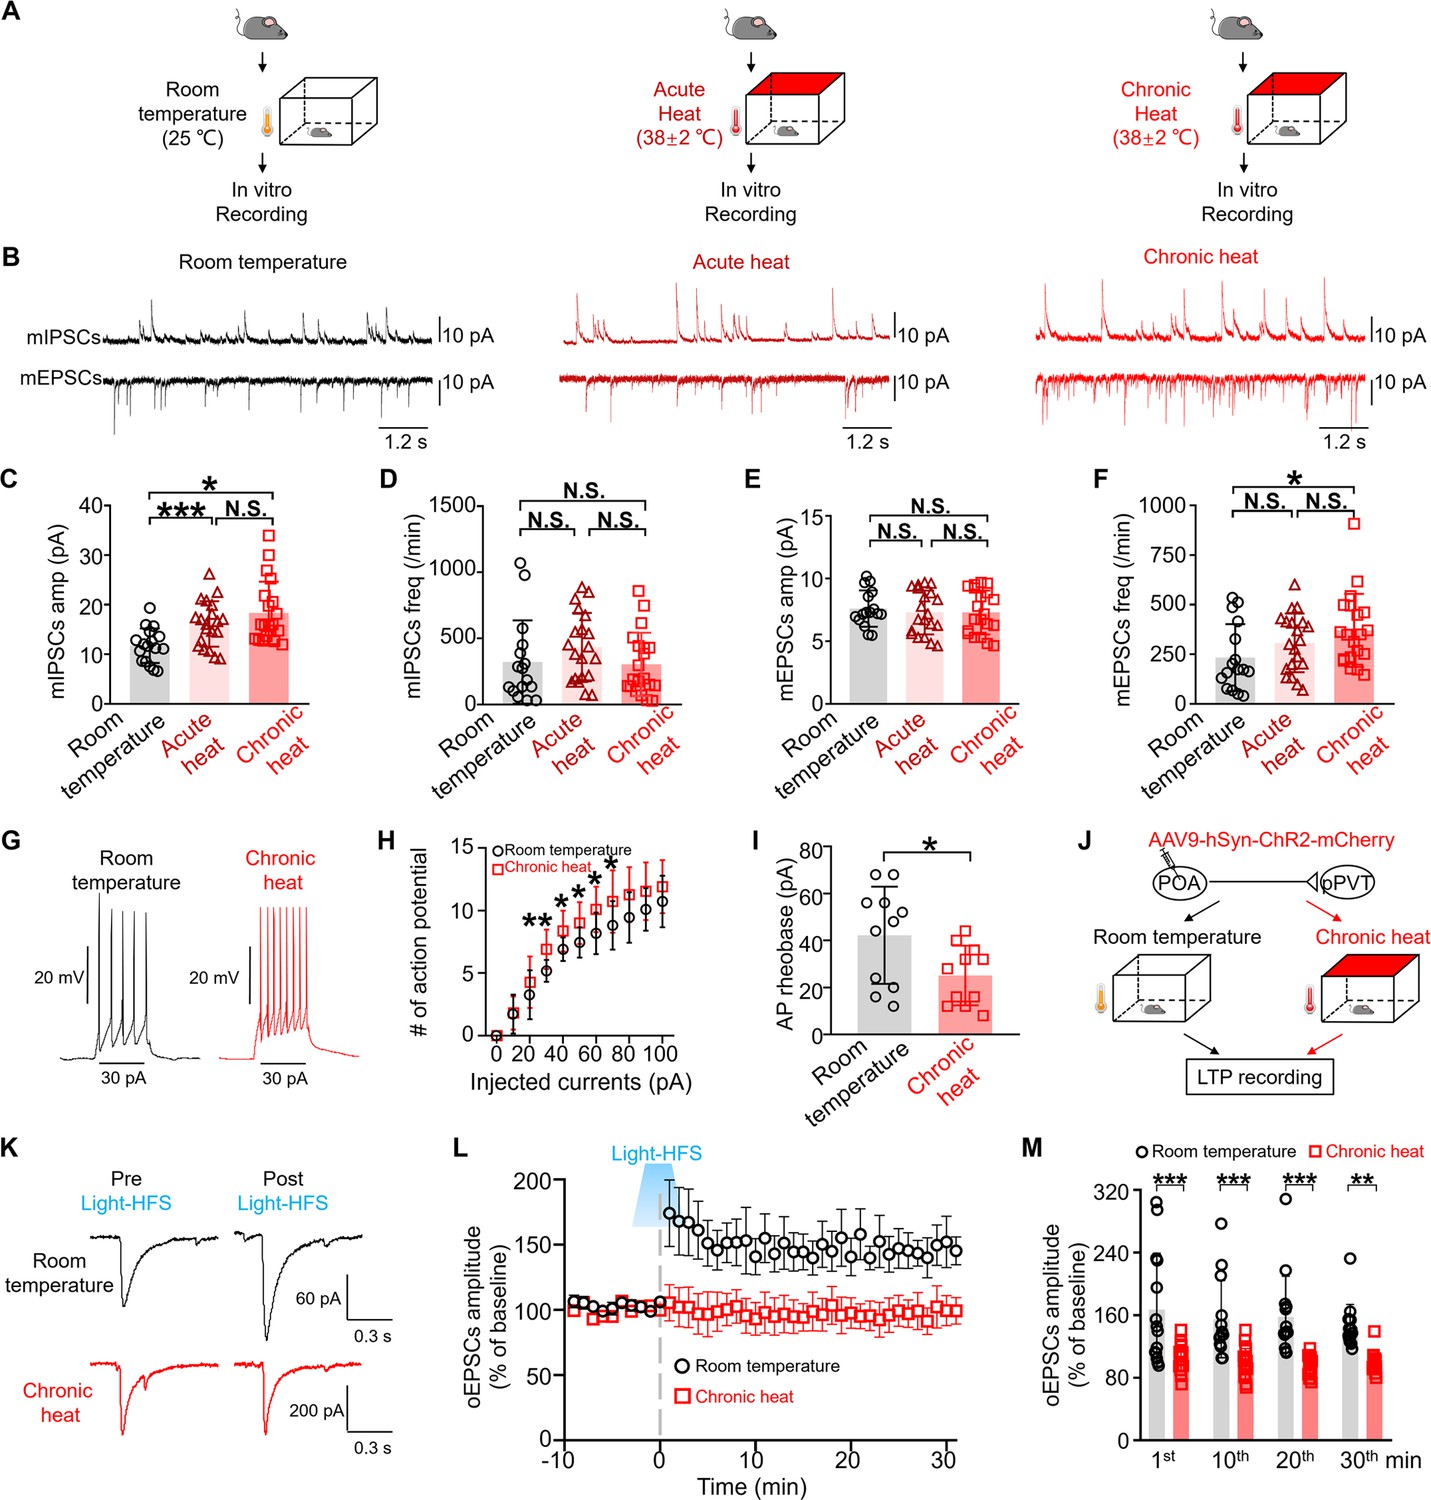
Increased pre- and postsynaptic excitability of posterior paraventricular thalamus (pPVT) neurons but saturated circuitry neuroplasticity capacity following chronic heat exposure.
(A) Experimental schematics. In vitro brain slice recording was performed on mice from three groups (n=16 neurons from 3 mice in the room temperature group, n=20 neurons from 4 mice in the acute heat group, and n=20 neurons from 4 mice in the chronic heat group). (B) Representative traces of miniature postsynaptic currents from three groups. Duration: 12 s. Scale bar: 10 pA. (C, D) The changes of miniature inhibitory postsynaptic currents (mIPSCs’) amplitude (one-way repeated measures ANOVA with Tukey post hoc test; F(2, 54)=8.226, ***p=0.0008, room temperature vs. acute heat, ***p=0.0005; room temperature vs. chronic heat, *p=0.0268) and frequency (one-way repeated measures ANOVA with Tukey post hoc test; F(2, 53)=1.346, p=0.269, room temperature vs. acute heat, p=0.4327; room temperature vs. chronic heat, p=0.9787) of pPVT neurons. (E, F) The changes of miniature excitatory postsynaptic currents (mEPSCs’) amplitude (one-way repeated measures ANOVA with Tukey post hoc test; F(2, 52.98)=0.1995, p=0.8198, room temperature vs. acute heat, p=0.8433; room temperature vs. chronic heat, p=0.8433) and frequency (one-way repeated measures ANOVA with Tukey post hoc test; F(2, 50.1)=2.981, p=0.0598, room temperature vs. acute heat, p=0.2931; room temperature vs. chronic heat, *p=0.0473) of pPVT neurons. (G) The representative traces of action potential of pPVT neurons upon 100 pA current injection. (H) The changes of excitability of pPVT neurons when different currents were injected to the patched pPVT neurons (n=11 neurons from 3 mice in each groups; Mann-Whitney unpaired two-tailed U test; 30 pA: U=22.5, **p=0.0091; 40 pA: U=31, *p=0.048; 50 pA: U=29.5, *p=0.0412; 60 pA: U=25, *p=0.0167; 70 pA: U=29.5, *p=0.0396). (I) The changes of rheobase of action potential (Mann-Whitney unpaired two-tailed U test; U=28.5, *p=0.0345). (J) Experimental schematics. Mice (n=5 mice in each group) stereotaxically injected with AAV9-Camk2a-ChR2-mCherry into the preoptic area (POA) were then divided into the room temperature and chronic heat groups. Sagittal slices of mice were prepared for long-term potentiation (LTP) induction and recording. (K) The representative traces showed pPVT neurons from mice exposed to room temperature and chronic heat exhibited different amplitude of oEPSCs after blue light-mediated high-frequency stimulation. (L) The LTP induction and recording of POA to pPVT pathway from slices of mice exposed to room temperature and chronic heat conditions after blue light stimulation at 30 Hz (n=14 neurons from control group and 18 neurons from chronic heat group). (M) Statistical comparison of the amplitude of oEPSCs at different time points (two-way repeated measures ANOVA with Sidak post hoc test; interaction: F(3, 120)=0.3486, p=0.7902; optical stimulation main effect: F(3, 120)=76.2, ***p<0.001; time points effect: F(3, 120)=0.8215, p=0.4844; 1st min: room temperature vs. chronic heat: ***p<0.001; 10th min: room temperature vs. chronic heat: p=0.0001; 20th min: room temperature vs. chronic heat: ***p<0.001; 30th min: room temperature vs. chronic heat: **p=0.0024). *p<0.05, **p<0.01, ***p<0.001, NS: not significant.
Figure 6—figure supplement 1
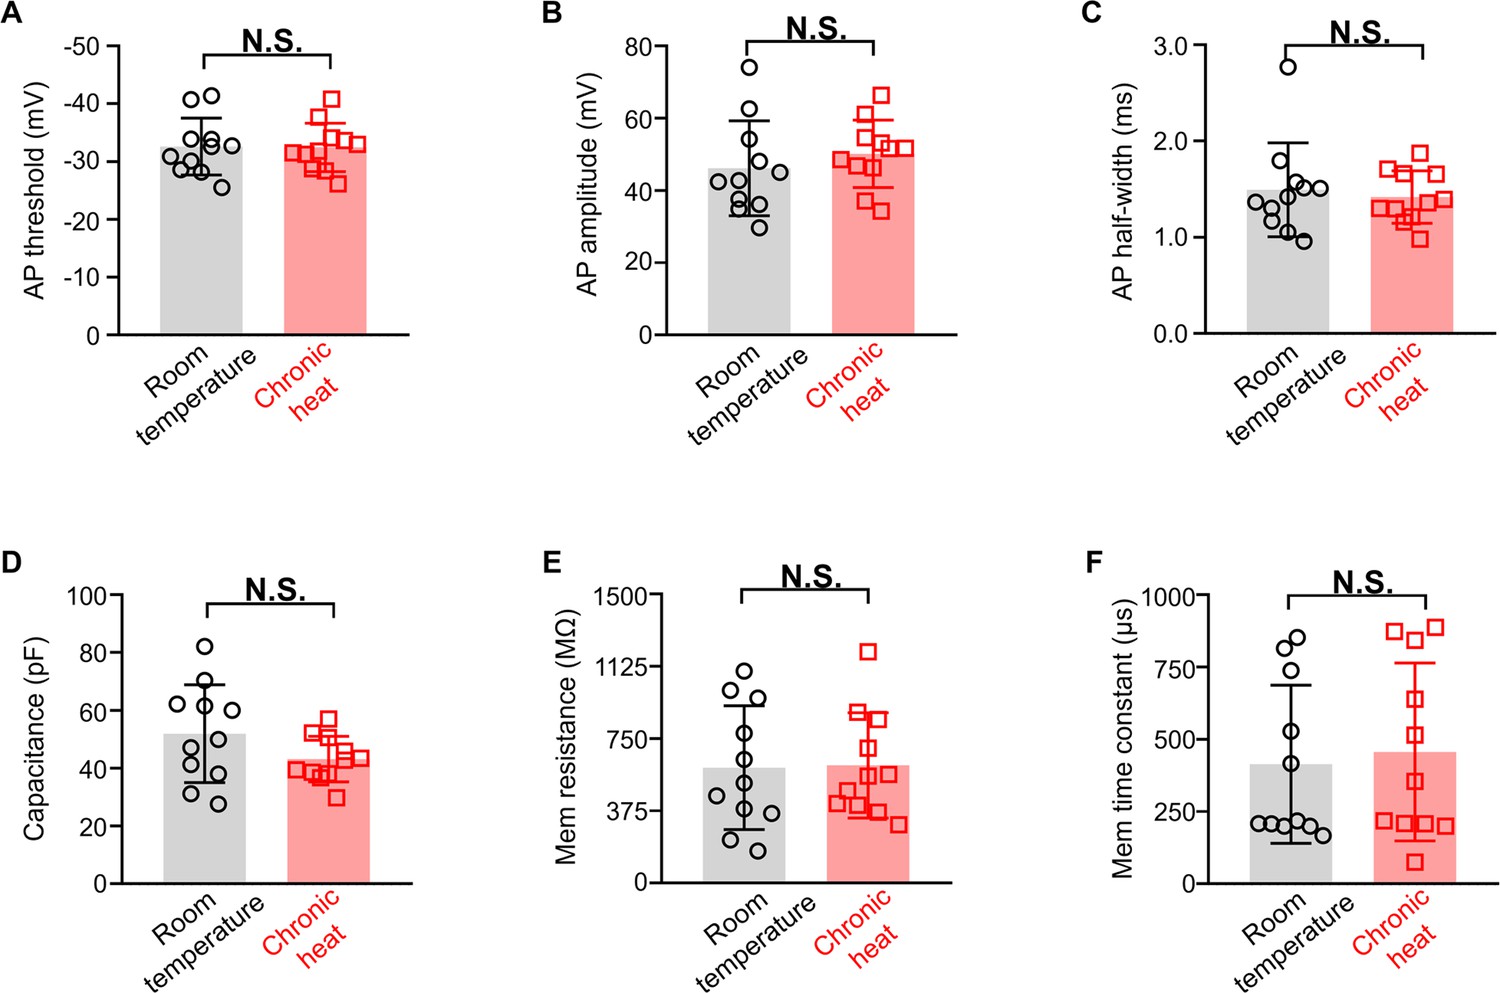
The effect of chronic heat exposure on intrinsic properties of posterior paraventricular thalamus (pPVT) neurons.
(A–F) The changes of half-width (Mann-Whitney unpaired two-tailed U test; U=58, p=0.8977), threshold (Mann-Whitney unpaired two-tailed U test; U=43, p=0.2703), peak amplitude (Mann-Whitney unpaired two-tailed U test; U=58, p=0.8977), capacitance (Mann-Whitney unpaired two-tailed U test; U=42, p=0.2426), membrane resistance (Mann-Whitney unpaired two-tailed U test; U=57, p=0.847), and membrane time constant (Mann-Whitney unpaired two-tailed U test; U=52.5, p=0.6177) of the action potential. NS: not significant.
Figure 7
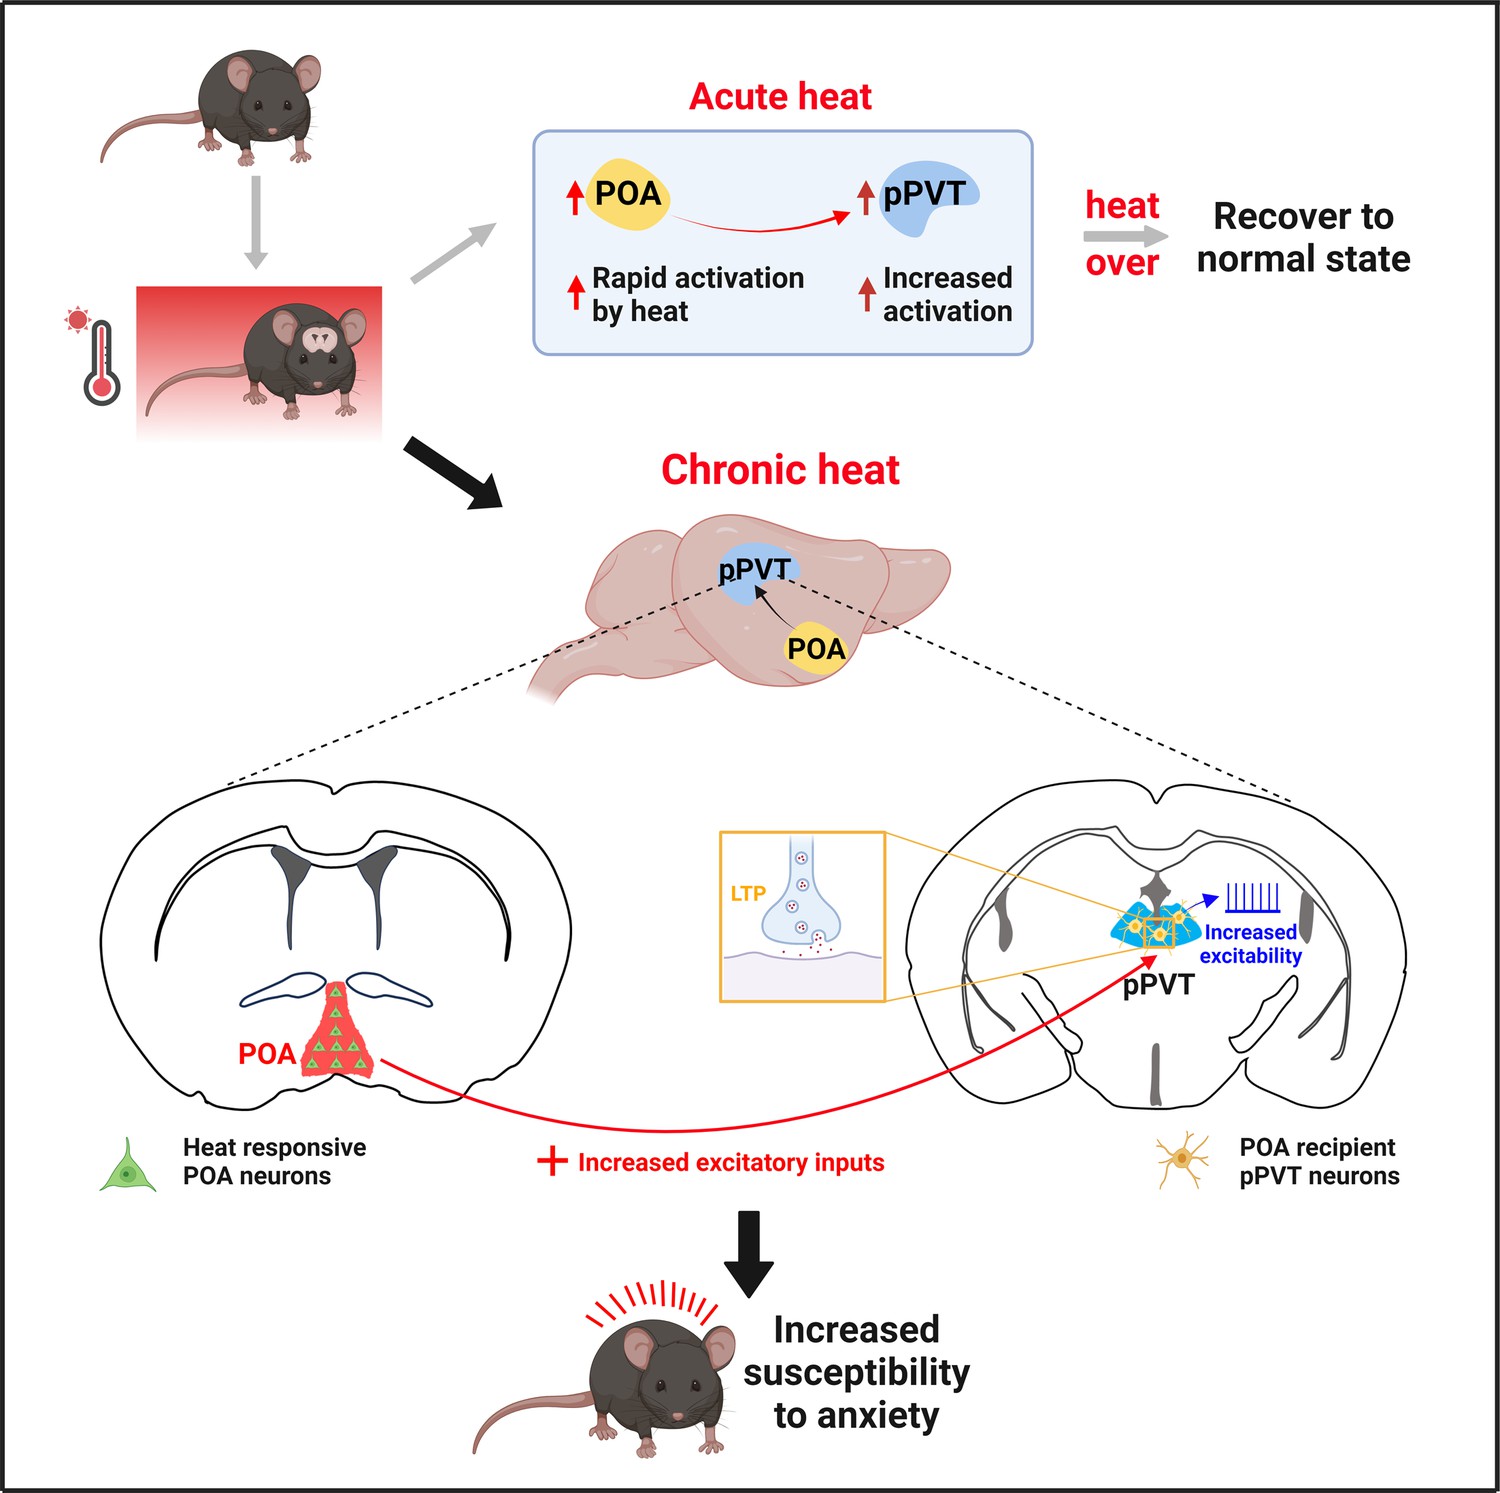
A working model of neural circuit mechanisms underlying preoptic area (POA) recipient posterior paraventricular thalamus (pPVT) neurons-mediated chronic heat exposure-induced negative emotional valence and hyperarousal states.
Different from acute heat exposure, chronic heat exposure-induced enhancement in excitatory inputs to pPVT and saturated neuroplasticity contributed to the increased membrane excitability underlie the heightened activities of POA recipient pPVT neurons, rendering mice become more susceptible to stressful situations manifested as negative emotional valence and hyperarousal states.
Additional files
Download links
A two-part list of links to download the article, or parts of the article, in various formats.
Downloads (link to download the article as PDF)
Open citations (links to open the citations from this article in various online reference manager services)
Cite this article (links to download the citations from this article in formats compatible with various reference manager tools)
Repeated activation of preoptic area recipient neurons in posterior paraventricular nucleus mediates chronic heat-induced negative emotional valence and hyperarousal states
eLife 13:RP101302.
https://doi.org/10.7554/eLife.101302.3


