Proactive distractor suppression in early visual cortex
- Vrije Universiteit Amsterdam, Netherlands
- Institute Brain and Behavior Amsterdam (iBBA), Netherlands
- Mind, Brain and Behavior Research Center (CIMCYC), University of Granada, Spain
- William James Center for Research, ISPA-Instituto Universitario, Portugal
Figures
Figure 1
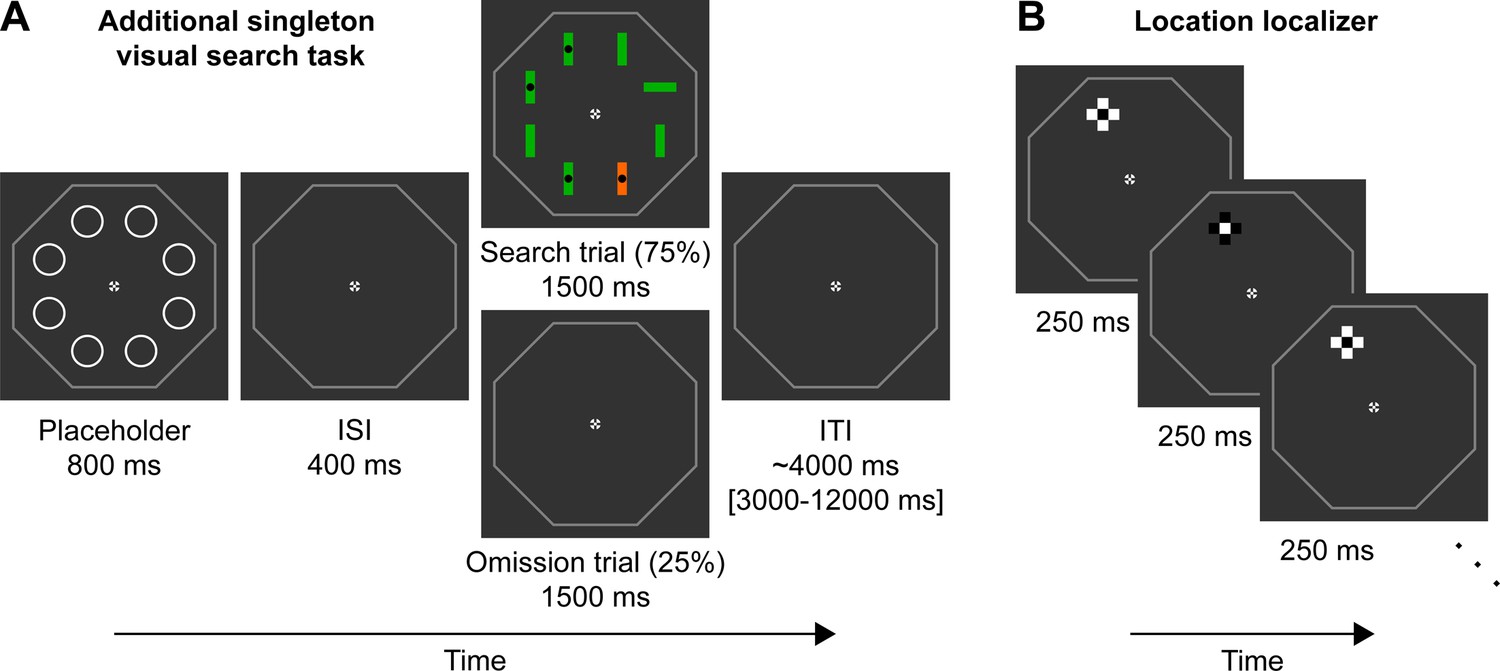
Paradigm.
(A) Example trial of the additional singleton visual search task. Trials started with a placeholder display (800 ms duration) signifying trial onset, followed by a fixed interstimulus interval (ISI) of 400 ms. On 75% of trials a search trial appeared next for 1500 ms. On 25% of trials, an omission trial (identical to the ISI display) was shown instead. Trials ended with a variable intertrial interval (ITI) of ~4000 ms. In the example search trial, the target is the horizontal green bar in the right upper corner, because it has a different orientation compared to the other seven bar stimuli. Because the target contains no black dot in the center, the correct response is ‘no’. The highly salient distractor is the orange vertical bar. The central fixation cross and octagonal outline surrounding the possible search area were presented throughout the experiment. (B) Three example color inversions of the location localizer, sampling the upper left location. The location localizer cross had the same size and location as the two possible bar stimuli (horizontal and vertical) during the search trial overlaid over each other, thus sampling neural populations responsive to this location. The cross flickered at 4 Hz for 12 s for each location of interest, sampling each location 8 times per run.
Figure 2
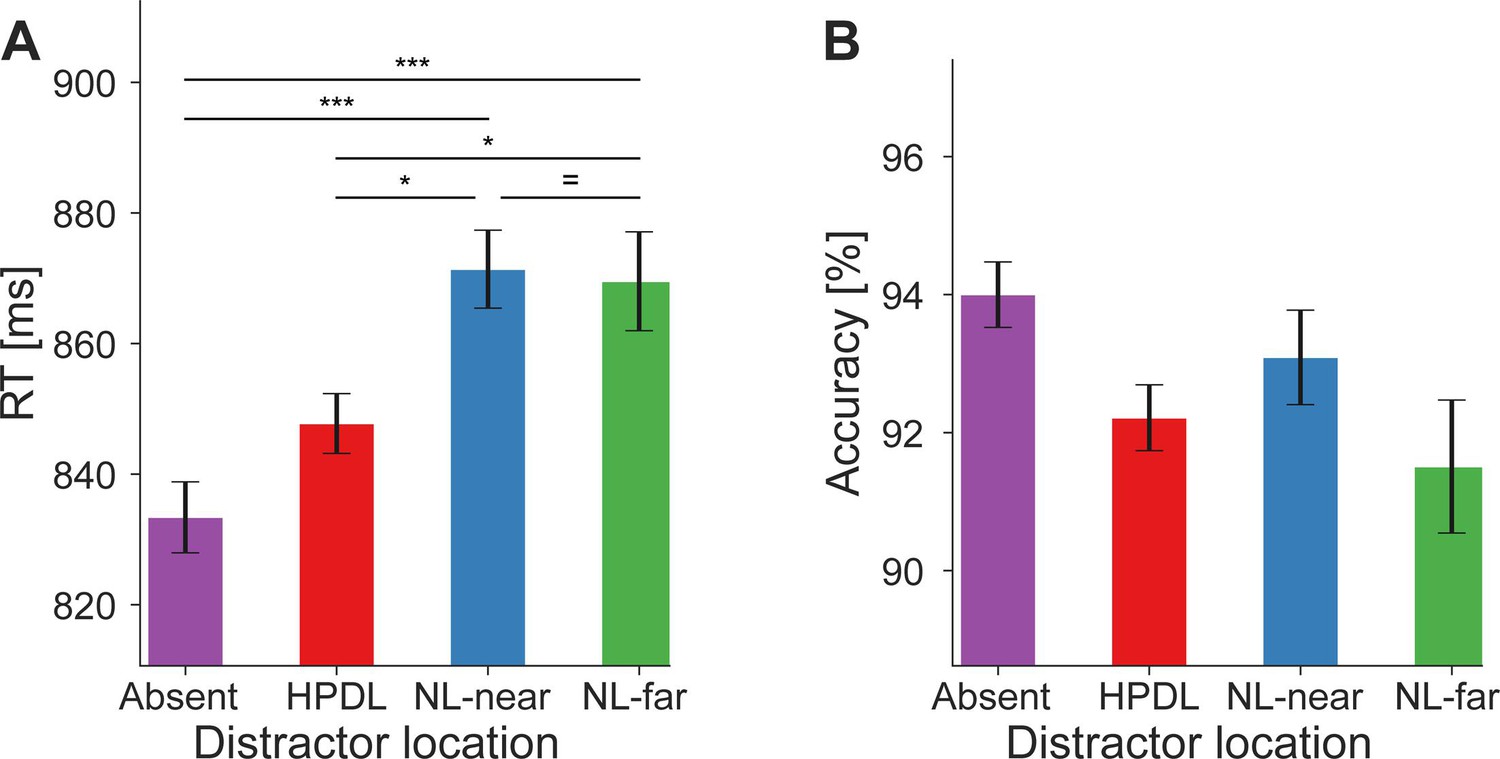
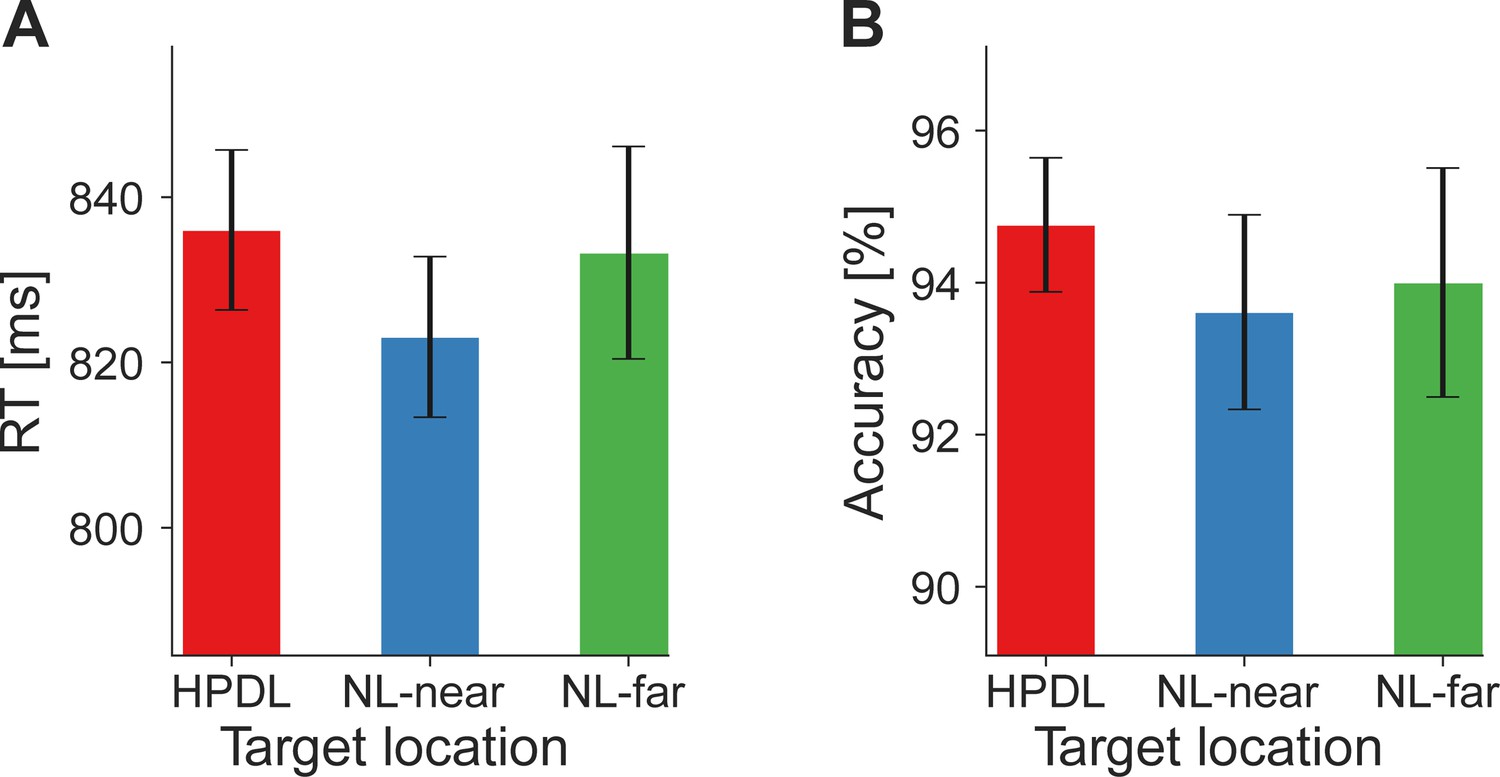
Behavioral facilitation by distractor suppression.
(A) Reaction times (RTs in ms; ordinate) were faster when distractor stimuli appeared at the high-probability distractor location (HPDL) compared to neutral location nearby the HPDL (NL-near) or neutral location furthest away from the HPDL (NL-far) locations. RTs were fastest when no distractor was present. (B) Response accuracy (in percent; ordinate) for each distractor location. Error bars denote within-subject SEM. Asterisks indicate statistically significant post hoc tests: *p<0.05, ***p<0.001, = BF10<1/3.
-
Figure 2—source data 1
Behavioral facilitation by distractor suppression – reaction time (RT) data.
- https://cdn.elifesciences.org/articles/101733/elife-101733-fig2-data1-v1.csv
-
Figure 2—source data 2
Behavioral facilitation by distractor suppression – accuracy data.
- https://cdn.elifesciences.org/articles/101733/elife-101733-fig2-data2-v1.csv
Figure 3
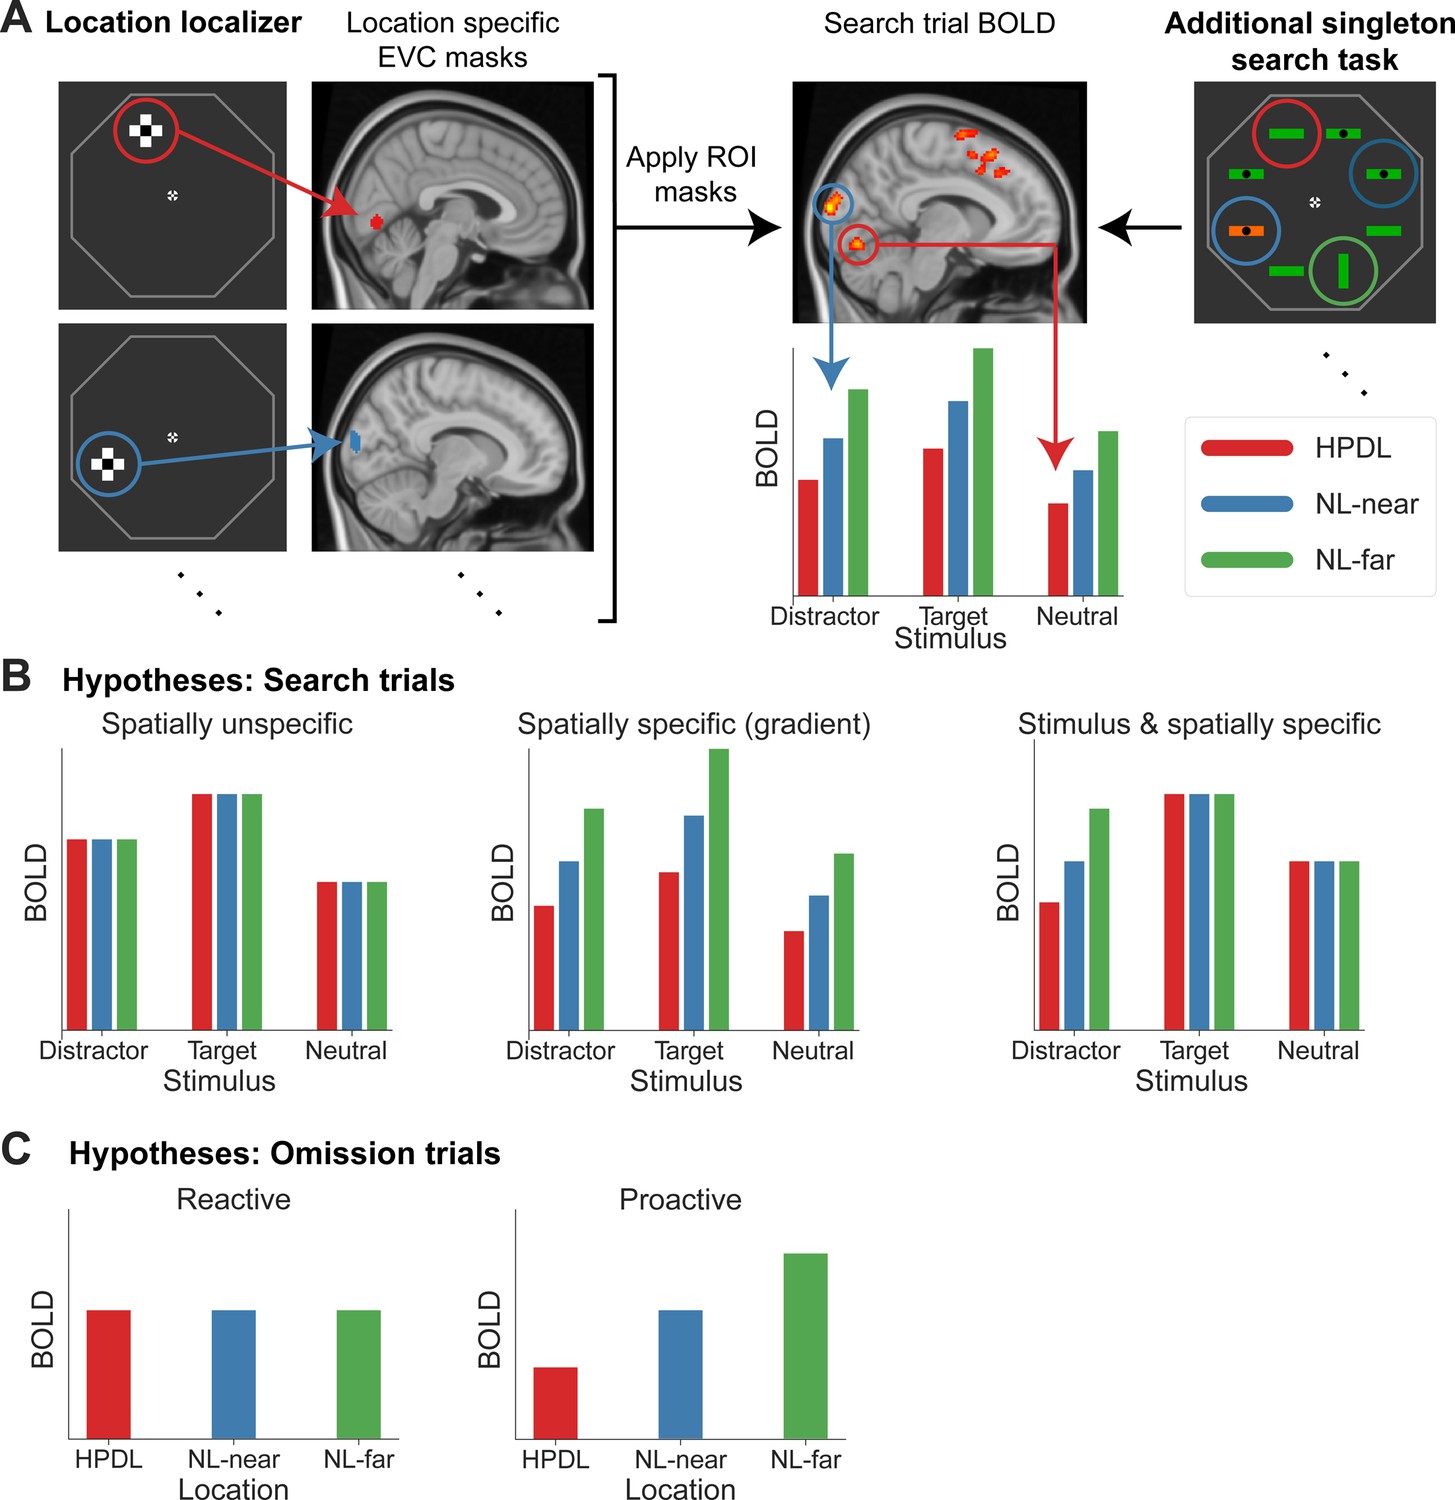
Illustration of the analysis rationale and hypotheses.
(A) Region of interest (ROI) analysis procedure. During an independent location localizer task (left) checkerboard cross patterns (flickering black and white at 4 Hz) were presented at the locations corresponding to the bar locations during the search task (right). Using BOLD activations in early visual cortex (EVC) from this localizer, location-specific ROI masks were created for the four locations of interest (high-probability distractor location [HPDL], two neutral location nearby the HPDL [NL-near], neutral location furthest away from the HPDL [NL-far]). The masks were then applied to the additional singleton task and the contrast parameter estimates (BOLD) during search trials extracted in a stimulus and location-specific manner. To illustrate, in the example above we assume that the HPDL was at the upper left location (red circle; determined by the statistical regularities throughout the search task). The example search trial contained a neutral stimulus at the HPDL (red circle), a salient distractor at the left NL-near (blue circle), a neutral stimulus at the right NL-near (dark blue circle), and a target stimulus at the NL-far (green circle) location. Therefore, the data provided by this trial was a neutral stimulus at HPDL (red arrow), a distractor at NL-near (blue arrow), a neutral stimulus at the other NL-near (not depicted), and a target at NL-far (not depicted). Therefore, each trial provided multiple location-specific data points. Specifically, data for each stimulus type and location combination were first estimated across trials and then extracted using the ROI-based approach. Data across the two NL-near locations were averaged. For further details, see Materials and methods: Statistical analysis and ROI definition. The same ROI analysis was performed for omission trials, except that by design, omission trials did not contain stimuli, hence resulting in only location-specific activation data points. (B) Potential outcomes for search trials. We distinguish between two factors modulating BOLD responses during search trials. First, we asked whether modulations in EVC are spatially specific. Illustrated on the left is a spatially unspecific modulation, affecting neural populations with receptive fields at all three locations equally. The middle panel depicts a spatially specific modulation with a gradient of increasing suppression the closer a location is to the HPDL. Second, we ask whether BOLD modulations are stimulus-specific, that is selectively suppressing only distractor stimuli, but not target and neutral stimuli (right panel). (C) Additionally, we distinguished between reactive compared to proactive spatial modulations by contrasting BOLD during omission trials. Reactive modulations (i.e. following search display onset) result in no spatially specific effects during omission trials (left panel), because no search display was shown. In contrast, proactive suppression yields spatially specific BOLD modulations during omission trials due to the deployment of spatial priority maps by anticipated search (right panel).
Figure 4 with 4 supplements
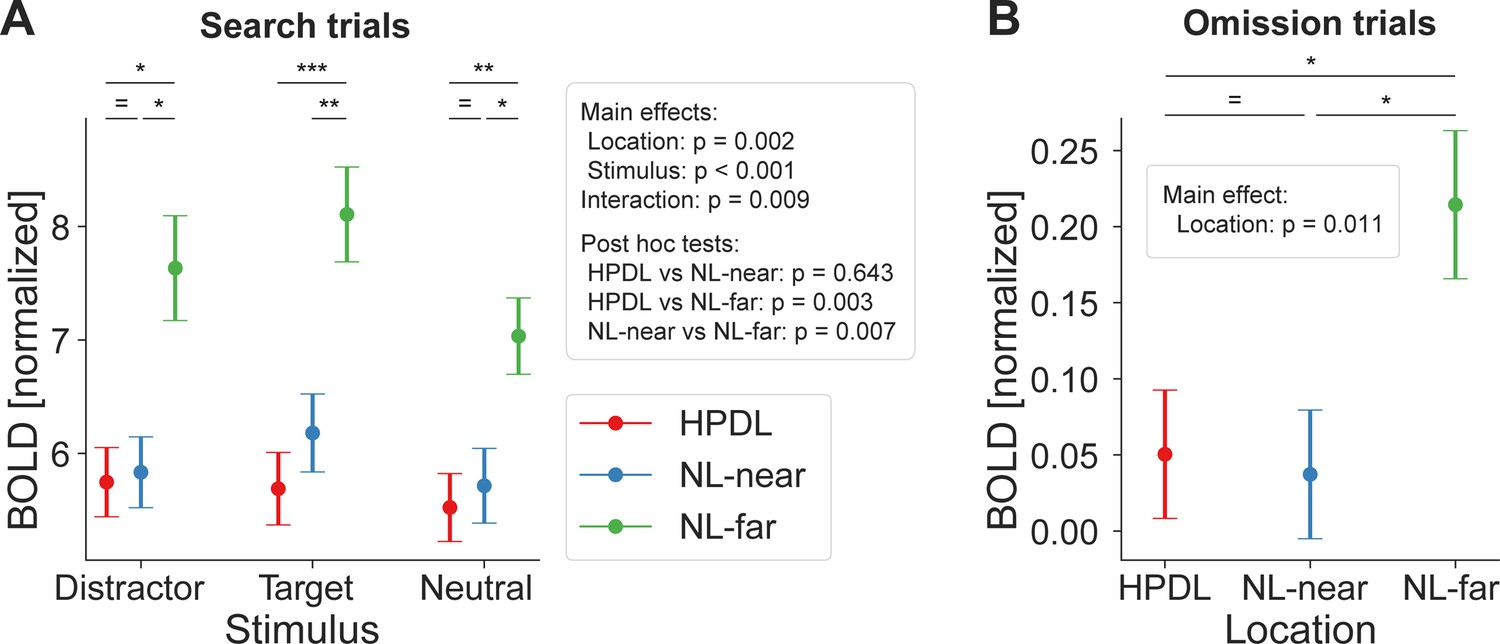
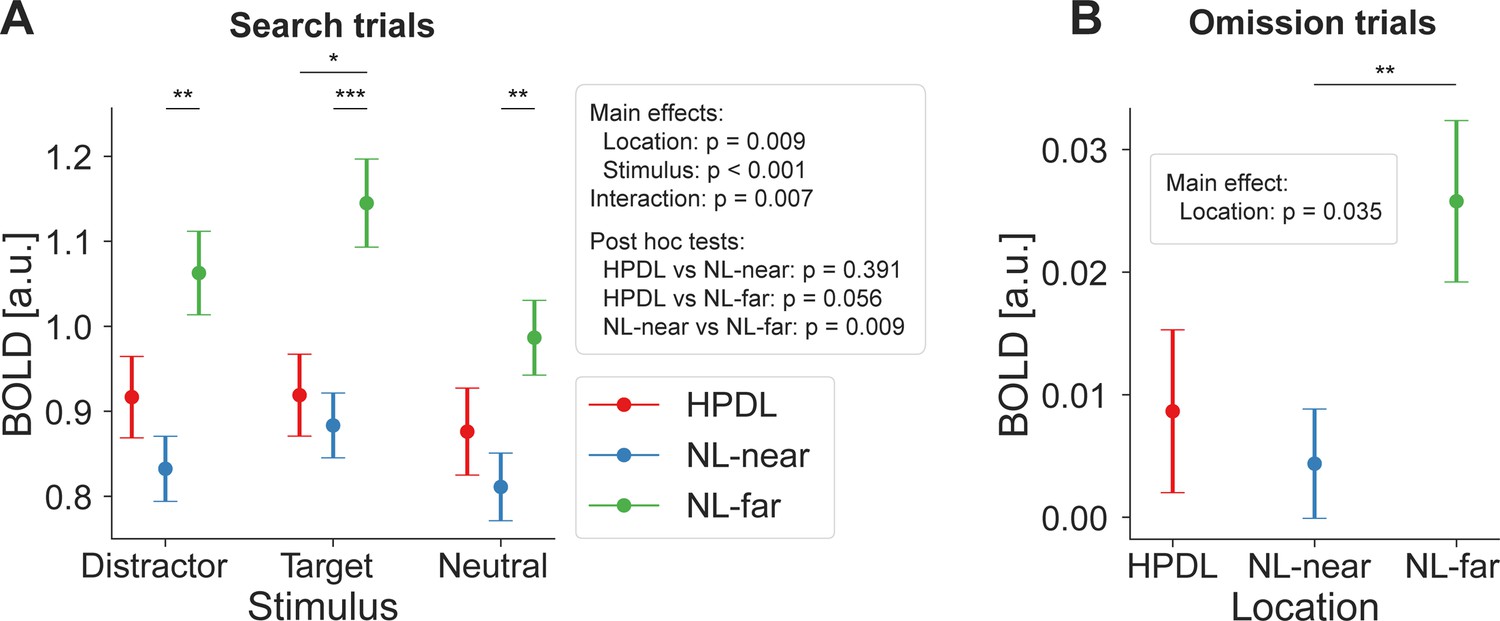
Distractor suppression in early visual cortex.
(A) fMRI BOLD responses (ordinate) during search trials, split into stimulus types (abscissa). Color denotes locations based on distractor contingencies with red = high-probability distractor location (HPDL), blue = neutral locations near the HPDL (NL-near), green = neutral locations far from the HPDL (NL-far; diagonally opposite from the HPDL). BOLD responses were systematically suppressed for all stimuli occurring at the HPDL and NL-near compared to NL-far. (B) Corresponding results for omission trials. Neural populations with receptive fields at the HPDL and NL-near locations were suppressed compared to those with receptive fields at the NL-far location. Note that BOLD responses are overall close to zero, which is expected given that no display was shown at this time. Error bars denote within-subject SEM. Asterisks indicate statistically significant pairwise comparisons within stimulus types: *p<0.05, **p<0.01, ***p<0.001, = BF10<1/3.
-
Figure 4—source data 1
Distractor suppression in early visual cortex – search trials.
- https://cdn.elifesciences.org/articles/101733/elife-101733-fig4-data1-v1.csv
-
Figure 4—source data 2
Distractor suppression in early visual cortex – omission trials.
- https://cdn.elifesciences.org/articles/101733/elife-101733-fig4-data2-v1.csv
Figure 4—figure supplement 1
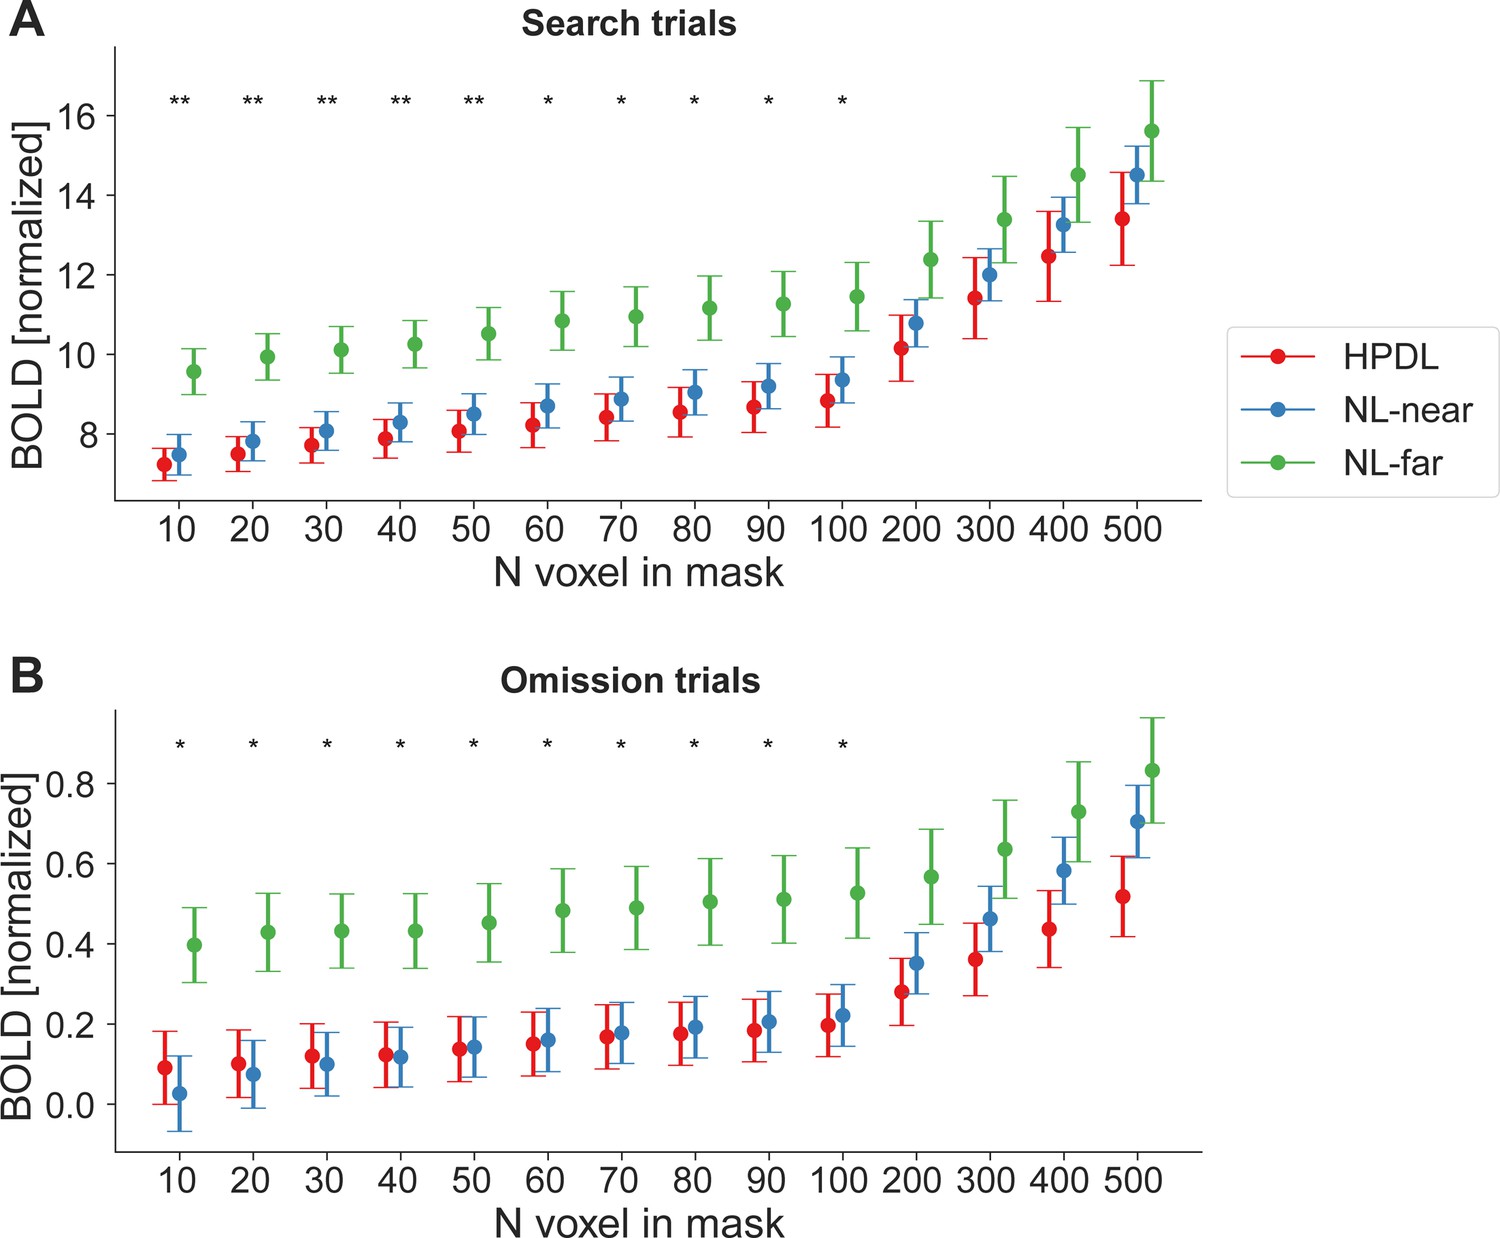
fMRI results generalize across region of interest (ROI) mask sizes.
To ensure that our results were not dependent on the exact number of voxels in the ROI masks, we repeated the main fMRI analysis with varying mask sizes. For simplicity, and because the primary ROI results suggested that there were no major differences between stimulus types, we here collapsed across stimuli by averaging distractor, target, and neutral stimuli. (A) Results for search trials and (B) omission trails were largely invariant to ROI size up to very large masks of 200 or more voxel per location (i.e. 800 or more voxels total, 6400 mm³). Error bars denote within-subject SEM. Asterisks indicate statistically significant simple main effects of location. *p<0.05, **p<0.01.
-
Figure 4—figure supplement 1—source data 1
fMRI results generalize across region of interest (ROI) mask sizes – search trials.
- https://cdn.elifesciences.org/articles/101733/elife-101733-fig4-figsupp1-data1-v1.csv
-
Figure 4—figure supplement 1—source data 2
fMRI results generalize across region of interest (ROI) mask sizes – omission trials.
- https://cdn.elifesciences.org/articles/101733/elife-101733-fig4-figsupp1-data2-v1.csv
Figure 4—figure supplement 2
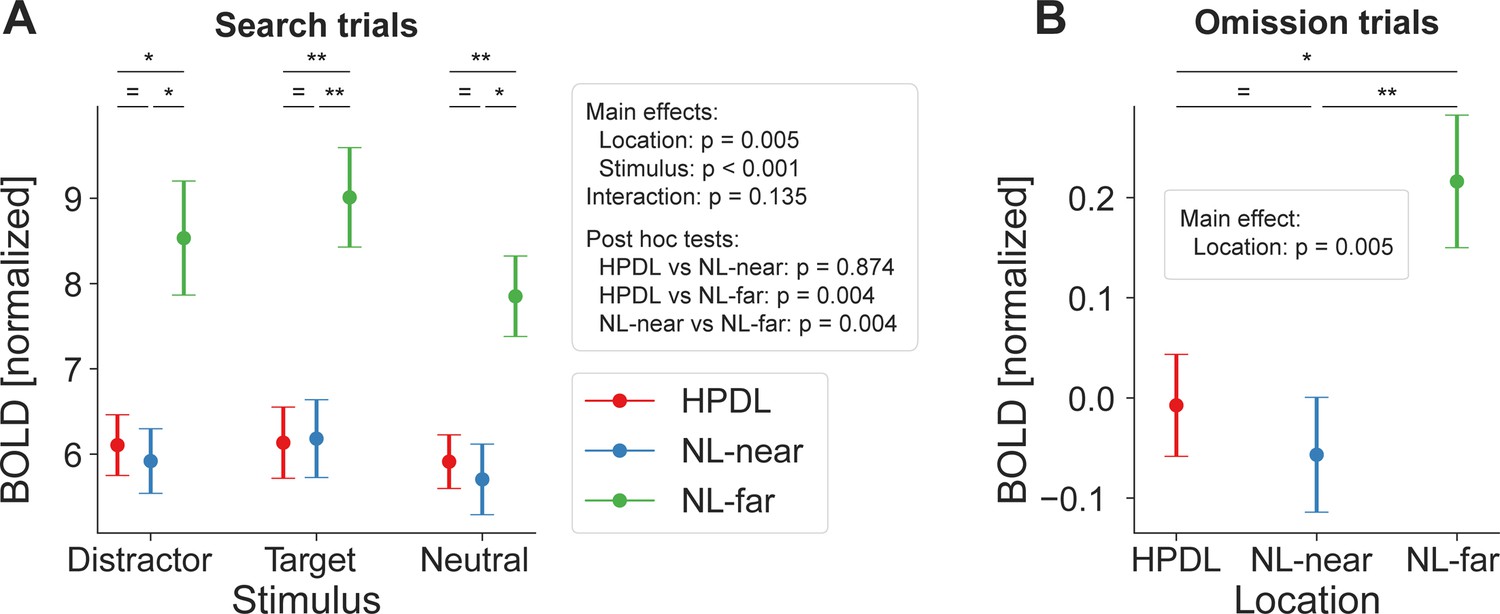
fMRI results did not depend on location-specific normalization of BOLD responses.
The high-probability distractor location (HPDL) differed between participants to avoid systematic effects of BOLD response differences driven by the physical location or hemodynamic differences for specific locations beyond the statistical regularities. However, within each participant the HPDL was constant, thus overall response magnitude differences per location may still affect the BOLD results. Therefore, in our main region of interest (ROI) analysis, we normalized fMRI BOLD responses for each location separately using independent localizer data. Specifically, we divided the BOLD response during the main task by the BOLD response during the localizer run for each location separately, thereby correcting for any location-specific differences in overall BOLD responses. Importantly, during the localizer no statistical contingencies were present and only one checkerboard stimulus was shown at a time. We believe that this approach is preferable, however, for transparency we also report the non-normalized results here. (A) Search trials. While results were overall less robust, which was expected given the additional noise added by location-specific BOLD differences, they qualitatively matched the normalized results. BOLD differences due to statistical learning were evident for neutral locations far from the HPDL (NL-far) compared to the other locations for target stimuli and NL-far compared to neutral locations near the HPDL (NL-near) for distractor and neutral stimuli. (B) For omission trials results qualitatively fit the main ROI analysis results, with a main effect of location and a reliable difference between NL-far and NL-near locations. In sum, non-normalized results further support our conclusions. Error bars denote within-subject SEM. Asterisks indicate statistically significant pairwise comparisons within stimulus types. *p<0.05, **p<0.01, ***p<0.001.
-
Figure 4—figure supplement 2—source data 1
fMRI results did not depend on location-specific normalization of BOLD responses – search trials.
- https://cdn.elifesciences.org/articles/101733/elife-101733-fig4-figsupp2-data1-v1.csv
-
Figure 4—figure supplement 2—source data 2
fMRI results did not depend on location-specific normalization of BOLD responses – omission trials.
- https://cdn.elifesciences.org/articles/101733/elife-101733-fig4-figsupp2-data2-v1.csv
Figure 4—figure supplement 3

Priming does not explain distractor suppression.
To test for potential contributions of spatial priming due to the location of the distractor stimulus on the preceding trial, compared to statistical learning, we first computed a BOLD suppression index. BOLD suppression = BOLDHPDL – BOLDNL-far. For this analysis we averaged across stimulus types, as the primary analyses did not yield different suppression magnitudes for targets, distractors, or neutral stimuli. We then split trials into those which on the preceding trial did contain a distractor at the high-probability distractor location (HPDL) (priming effect) vs trials which did not contain the distractor at the HPDL on the previous trial (other). We excluded omission trials, as well as trials with omissions on the preceding trials in this analysis to equate the two conditions as much as possible. We chose to exclude trials with omissions on the preceding trial, as omissions effectively constitute extended rest periods. These rest periods could allow participants, and particularly the visually evoked BOLD responses, to differ from trials that do not following omissions (e.g. potentially higher dynamic range). Results showed that overall BOLD suppression was statistically significant for both trial types (distractor on trial n-1 at HPDL: W=323, p=0.005, r=0.59; trial n-1. Other: t(27) = 3.12, p=0.004, d=0.59), replicating the primary conclusions of significant BOLD suppression from our main region of interest (ROI) analysis (Figure 4). Next, while BOLD suppression was numerically larger in trials following a distractor at the HPDL compared to trials with no distractor at the HPDL, in line with the priming account, this contrast was not statistically reliable (t(27) = 1.26, p=0.218, d=0.24; BF10=0.410). Error bars denote within-subject SEM. Asterisks indicate statistically significant one-sample tests. **p<0.01. While results were inconclusive concerning an additional contribution of priming beyond statistical learning, it is reasonable to assume a priori that priming contributes to the observed suppression. We note that our study design was not optimized to detect potential priming effects for multiple reasons, mostly related to a small number of trials in the relevant contrasts. Moreover, the distractor contingencies were intentionally less pronounced than in previous studies on distractor suppression (e.g. Ferrante et al., 2023; Wang and Theeuwes, 2018a; Wang and Theeuwes, 2018b) to minimize the likelihood of participants employing explicit top-down attentional strategies. However, this design choice necessarily resulted in fewer trials with the distractor at the HPDL on preceding trials, which is critical for an analysis of possible priming effect. Moreover, all trials with preceding omission trials were excluded from analysis, resulting in a substantial loss of statistical power. Combined, these factors likely reduced our ability to detect priming effects in the present data. Therefore, the present results should not be interpreted as evidence against spatial priming. Instead, they indicate that priming does not account for the observed distractor suppression effects, which are more likely attributed to statistical learning.
-
Figure 4—figure supplement 3—source data 1
Priming does not explain distractor suppression.
- https://cdn.elifesciences.org/articles/101733/elife-101733-fig4-figsupp3-data1-v1.csv
Figure 4—figure supplement 4
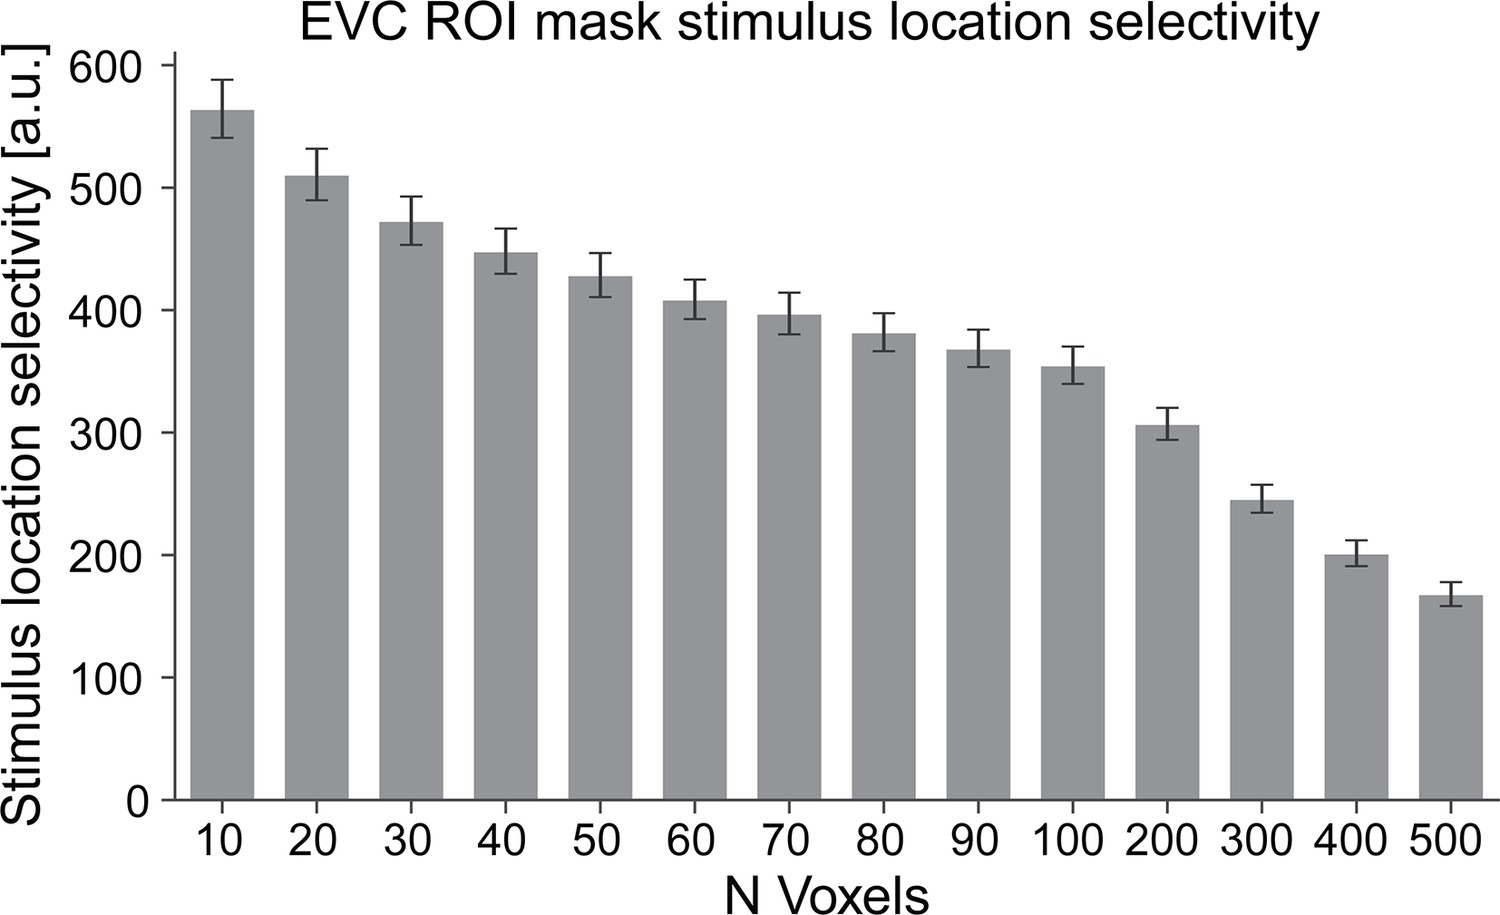
Region of interest (ROI) location masks generalize across localizer runs.
Depicted are results from a cross-validation analysis, confirming the stimulus location selectivity of our early visual cortex (EVC) ROI masks. Number of voxels are shown on the x axis, while the y axis depicts the averaged contrast parameter estimates of the location contrasts (average all combinations of stimulation of one location vs the other three locations) from the location localizer. For this cross-validation analysis masks were defined using data from the first localizer run and tested on the second localizer run (and vice versa). Location selectivity contrast parameter estimates were obtained for each participant separately and then averaged across subjects. Thus, values larger than zero indicate successful generalization of the location selectivity masks from one run to the other. All one-sample tests, contrasting stimulus location selectivity against zero (no selectivity), were p<0.001, demonstrating that EVC ROI definition was reliable and successful. Error bars denote the SEM. Note that up to 400 voxels per location mask zero voxels overlapped between location masks, further bolstering mask selectivity.
-
Figure 4—figure supplement 4—source data 1
Region of interest (ROI) location masks generalize across localizer runs.
- https://cdn.elifesciences.org/articles/101733/elife-101733-fig4-figsupp4-data1-v1.csv
Figure 5 with 1 supplement
Ruling out explicit attentional strategies: distractor suppression in a subsample of participants with incorrect high-probability distractor location (HPDL) choices in the questionnaire.
Results for search (A) and omission (B) trials were highly similar to the main results using the full sample. Significant suppression of BOLD responses at both the HPDL and neutral location nearby the HPDL (NL-near) locations compared to the neutral location furthest away from the HPDL (NL-far) location were evident during search and omission trials in the subsample with incorrect responses for the HPDL location on the questionnaire probing explicit knowledge of the distractor contingencies. Error bars denote within-subject SEM. Asterisks indicate statistically significant pairwise comparisons within stimulus types: *p<0.05, **p<0.01, = BF10<1/3.
-
Figure 5—source data 1
Distractor suppression in a subsample of participants with incorrect high-probability distractor location (HPDL) choices in the questionnaire – search trials.
- https://cdn.elifesciences.org/articles/101733/elife-101733-fig5-data1-v1.csv
-
Figure 5—source data 2
Distractor suppression in a subsample of participants with incorrect high-probability distractor location (HPDL) choices in the questionnaire – omission trials.
- https://cdn.elifesciences.org/articles/101733/elife-101733-fig5-data2-v1.csv
Figure 5—figure supplement 1
No behavioral prioritization of targets at neutral location furthest away from the HPDL (NL-far).
Behavioral data in a target contingent analysis. To avoid confounds by distractor location, only distractor absent trials were included in the target contingent analysis. (A) Reaction times (RTs in ms; ordinate) did not significantly differ when targets appeared at the neutral location nearby the HPDL (NL-near) compared to the NL-far location. (B) There were no response accuracy (in percent; ordinate) differences when targets were presented at the high-probability distractor location (HPDL) or NL-near locations compared to NL-far. Both RT and response accuracy results contradict a strategic prioritization of the NL-far location. Error bars denote within-subject SEM.
-
Figure 5—figure supplement 1—source data 1
No behavioral prioritization of targets at neutral location furthest away from the HPDL (NL-far) – reaction time (RT) data.
- https://cdn.elifesciences.org/articles/101733/elife-101733-fig5-figsupp1-data1-v1.csv
-
Figure 5—figure supplement 1—source data 2
No behavioral prioritization of targets at neutral location furthest away from the HPDL (NL-far) – accuracy data.
- https://cdn.elifesciences.org/articles/101733/elife-101733-fig5-figsupp1-data2-v1.csv
Appendix 1—figure 1
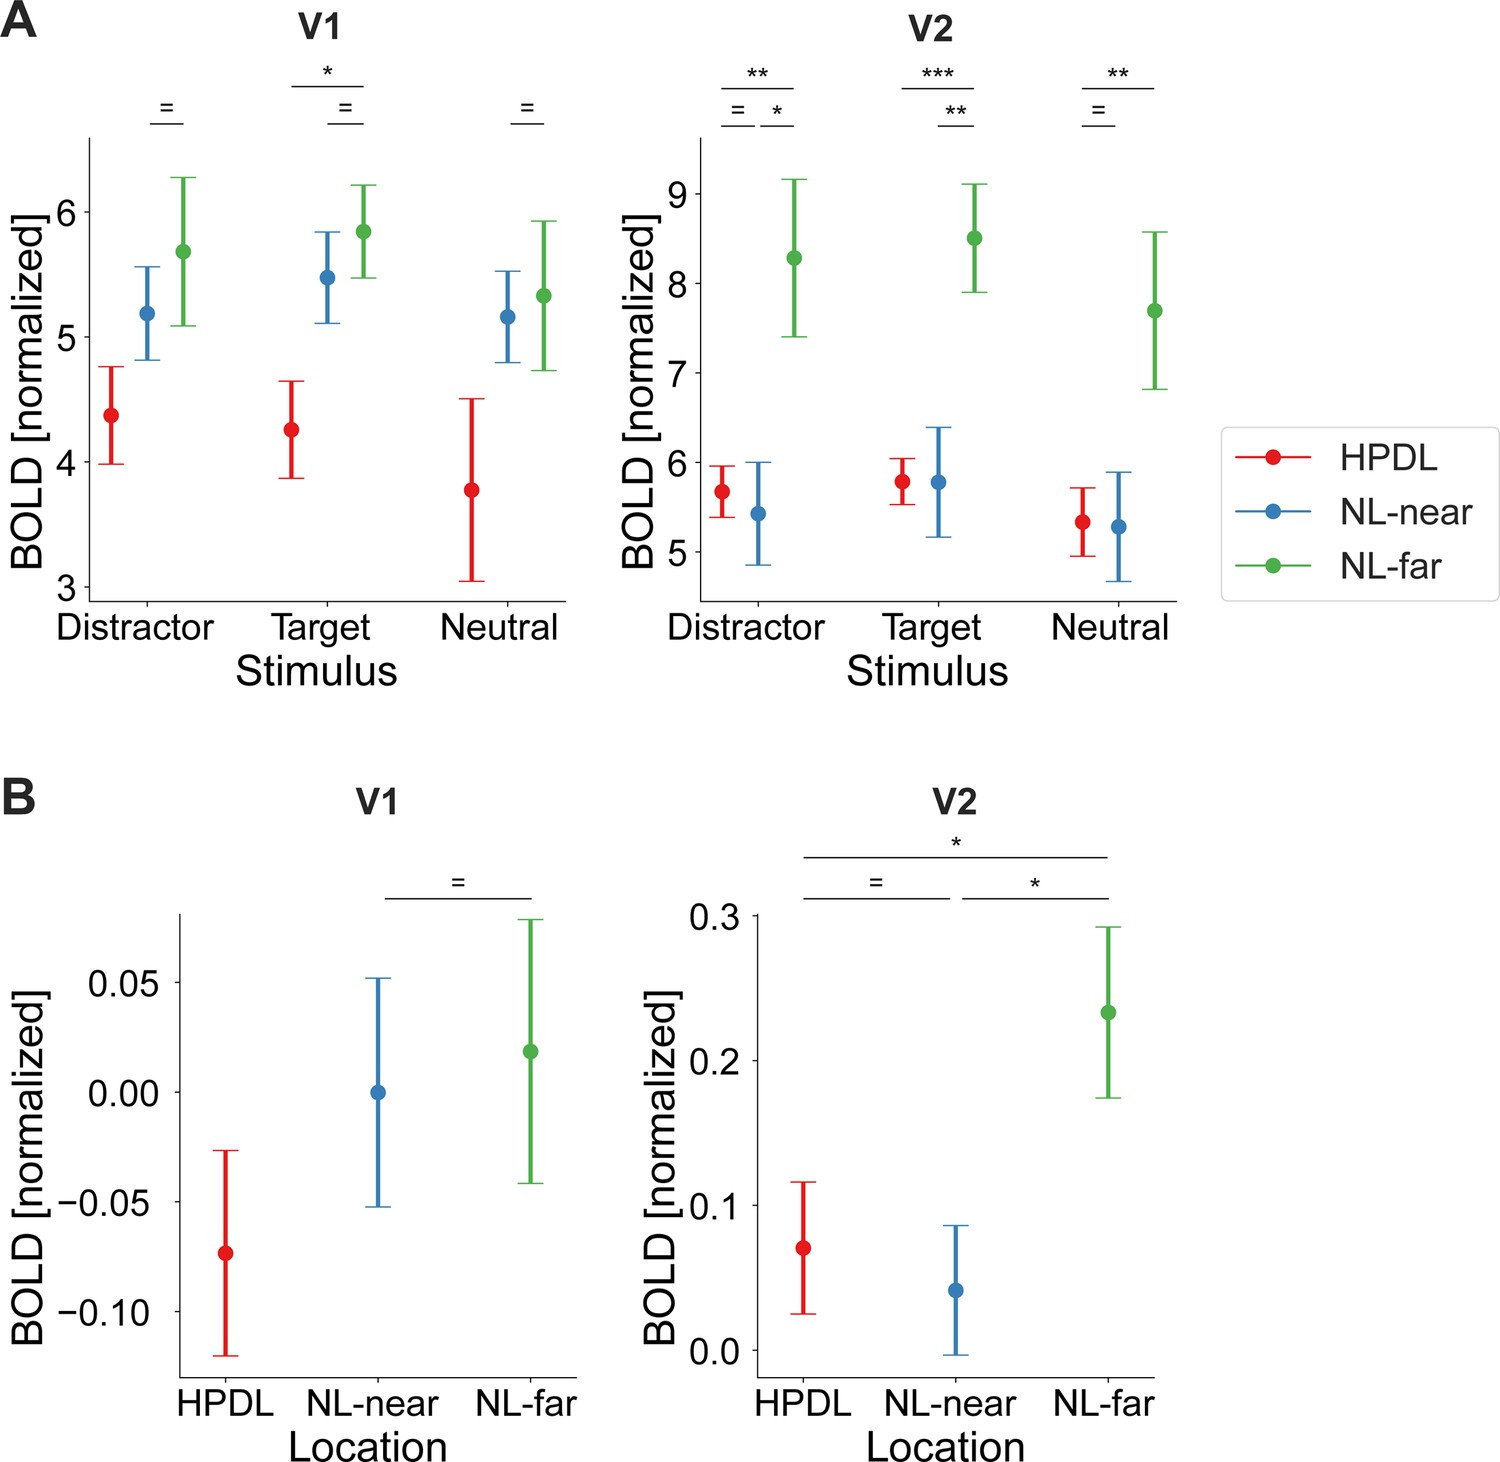
Distractor suppression in primary and secondary visual cortex.
(A) fMRI BOLD responses (ordinate) during search trials in V1 (left) and V2 (right), split into stimulus types (abscissa). Color denotes locations based on distractor contingencies with red = high-probability distractor location (HPDL), blue = neutral locations near the HPDL (NL-near), green = neutral locations far from the HPDL (NL-far; diagonally opposite from the HPDL). (B) Corresponding results for omission trials in V1 (left) and V2 (right). Neural populations with receptive fields at the HPDL and NL-near locations were suppressed compared to those with receptive fields at the NL-far location in V2, but not V1. Error bars denote within-subject SEM. Asterisks indicate statistically significant pairwise comparisons within stimulus types: *p<0.05, **p<0.01, ***p<0.001, = BF10<1/3.
-
Appendix 1—figure 1—source data 1
Distractor suppression in primary visual cortex – search trials.
- https://cdn.elifesciences.org/articles/101733/elife-101733-app1-fig1-data1-v1.csv
-
Appendix 1—figure 1—source data 2
Distractor suppression in secondary visual cortex – search trials.
- https://cdn.elifesciences.org/articles/101733/elife-101733-app1-fig1-data2-v1.csv
-
Appendix 1—figure 1—source data 3
Distractor suppression in primary visual cortex – omission trials.
- https://cdn.elifesciences.org/articles/101733/elife-101733-app1-fig1-data3-v1.csv
-
Appendix 1—figure 1—source data 4
Distractor suppression in secondary visual cortex – omission trials.
- https://cdn.elifesciences.org/articles/101733/elife-101733-app1-fig1-data4-v1.csv
Author response image 1

Analysis of BOLD suppression magnitudes in EVC across the MRI experiment phases.
BOLD suppression was comparable between early (Run 1+2) and late (Run 4+5) phases of the MRI experiment, suggesting consistent suppression in EVC following statistical learning. Error-bars denote within-subject SEM. * p < 0.05, ** p < 0.01, = BF10 < 1/3.
Additional files
-
Supplementary file 1
Results of planned pairwise tests contrasting fMRI BOLD responses during search trials.
Contrasted are the three stimulus locations (high-probability distractor location [HPDL], neutral location nearby the HPDL [NL-near], neutral location furthest away from the HPDL [NL-far]) for each stimulus type (distractor, target, neutral stimulus) separately. Reported are paired t-tests or Wilcoxon signed-rank tests results as appropriate with associated effect sizes (Cohen’s d for t-tests and matched rank biserial correlation for Wilcoxon signed-rank tests). p-Values are uncorrected. Bayes factors denote the BF10 from Bayesian paired t-tests.
- https://cdn.elifesciences.org/articles/101733/elife-101733-supp1-v1.docx
-
MDAR checklist
- https://cdn.elifesciences.org/articles/101733/elife-101733-mdarchecklist1-v1.pdf
-
Appendix 1—figure 1—source data 1
Distractor suppression in primary visual cortex – search trials.
- https://cdn.elifesciences.org/articles/101733/elife-101733-app1-fig1-data1-v1.csv
-
Appendix 1—figure 1—source data 2
Distractor suppression in secondary visual cortex – search trials.
- https://cdn.elifesciences.org/articles/101733/elife-101733-app1-fig1-data2-v1.csv
-
Appendix 1—figure 1—source data 3
Distractor suppression in primary visual cortex – omission trials.
- https://cdn.elifesciences.org/articles/101733/elife-101733-app1-fig1-data3-v1.csv
-
Appendix 1—figure 1—source data 4
Distractor suppression in secondary visual cortex – omission trials.
- https://cdn.elifesciences.org/articles/101733/elife-101733-app1-fig1-data4-v1.csv
Download links
A two-part list of links to download the article, or parts of the article, in various formats.
Downloads (link to download the article as PDF)
Open citations (links to open the citations from this article in various online reference manager services)
Cite this article (links to download the citations from this article in formats compatible with various reference manager tools)
Proactive distractor suppression in early visual cortex
eLife 13:RP101733.
https://doi.org/10.7554/eLife.101733.3


