Pleiotropy increases parallel selection signatures during adaptation from standing genetic variation
- Institut für Populationsgenetik, Vetmeduni Vienna, Austria
- Vienna Graduate School of Population Genetics, Vetmeduni Vienna, Austria
- Department of Applied Statistics, Johannes Kepler University Linz, Austria
Figures
Figure 1
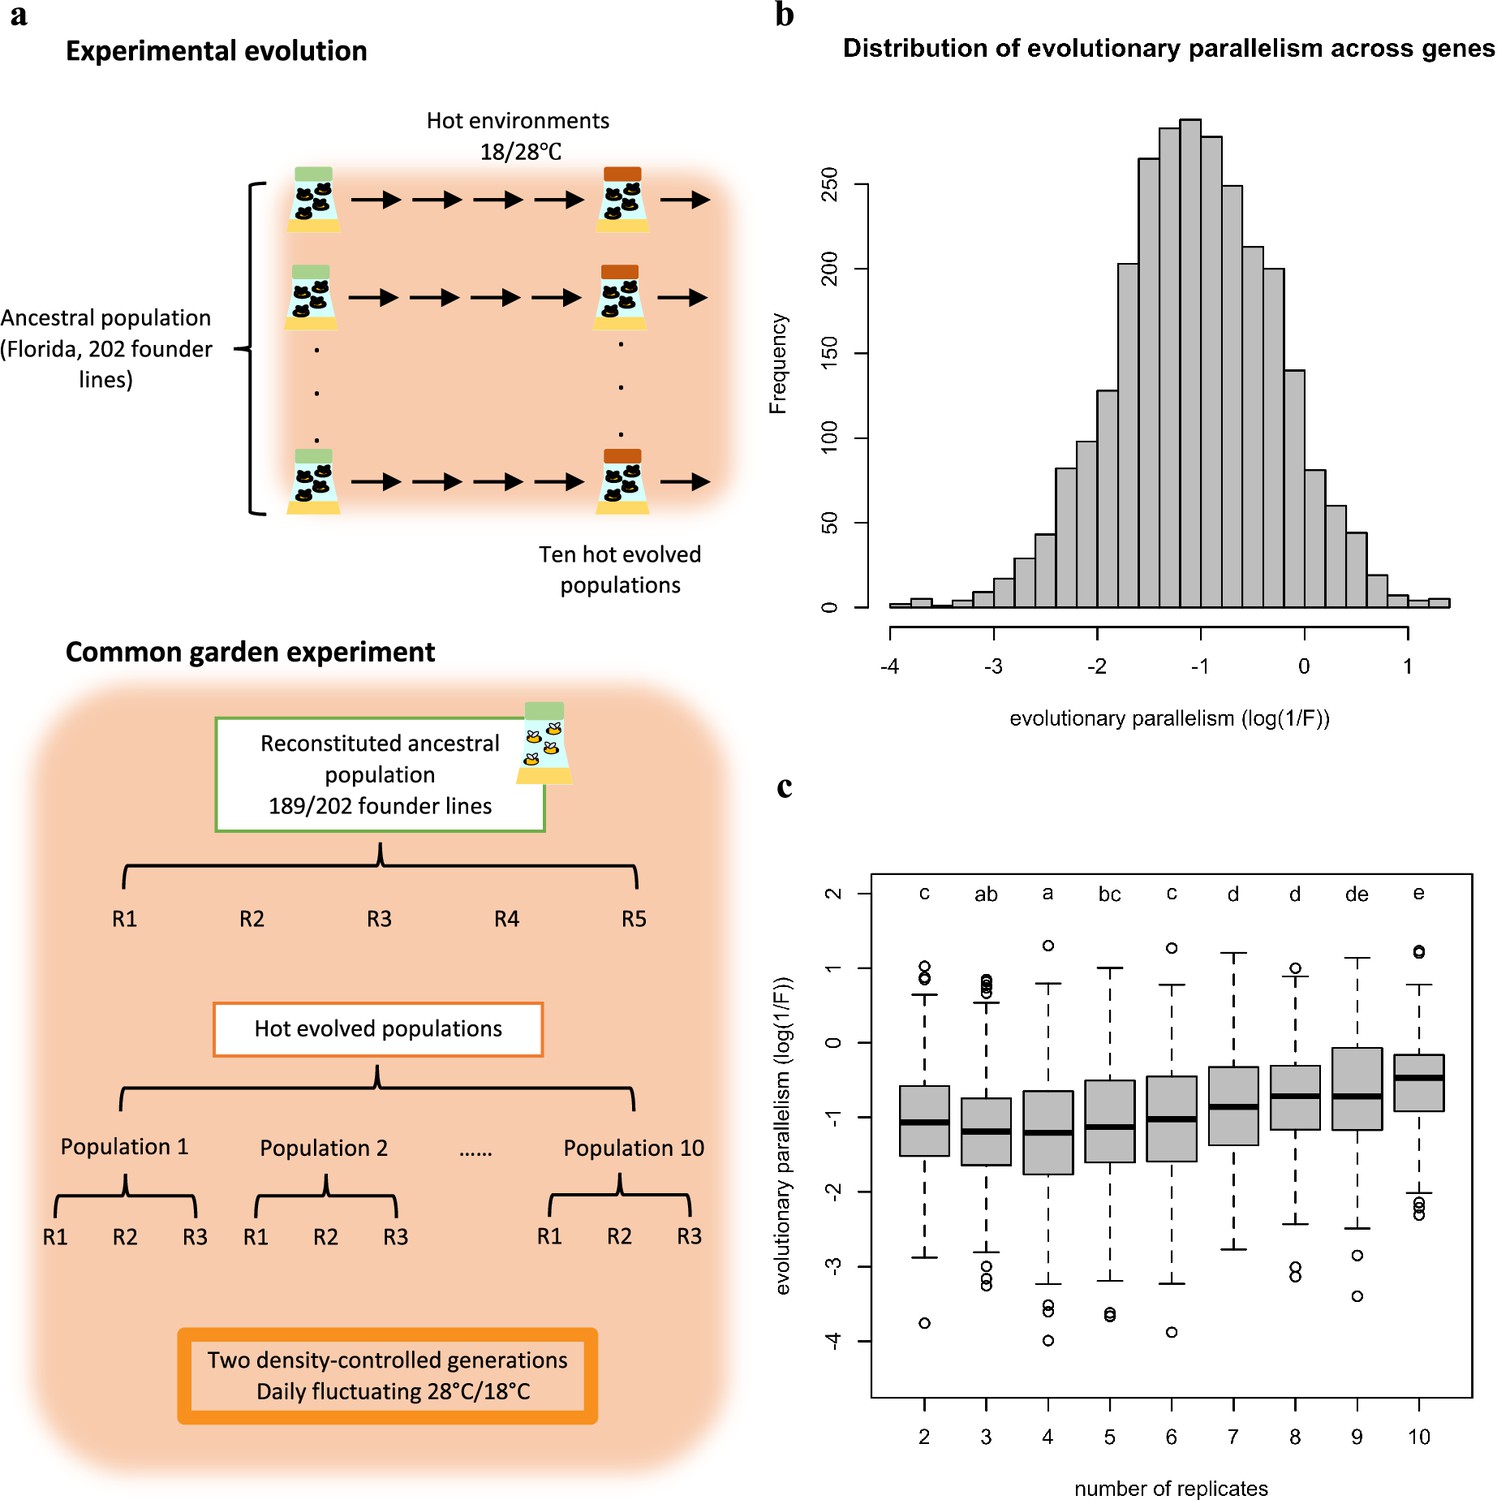
Overview of the experimental procedures (a) and the variation in parallel gene expression evolution across genes (b,c).
(a) Experimental Evolution: ten replicated populations seeded from one common founder population have been evolving for >100 generations in a hot laboratory environment at 18 and 28°C. Common Garden Experiment: at the 103rd generation of the evolution experiment, the ten evolved populations (each with three biological replicates) were maintained together with the reconstituted ancestral population (with five biological replicates) for two generations in the same environment as in the evolution experiment. After two generations in the common garden, 50 males from each biological replicates were pooled and subjected to RNA-Seq. (b) Replicate frequency spectrum. Number of populations (x-axis) in which a given gene experienced a significant change in gene expression. The y-axis indicates the number of genes in each category. Most of the genes experienced a significant change in gene expression in a few evolved populations while much fewer genes were significant in all 10 populations. This pattern suggests that the parallelism in gene expression evolution differs across genes. (c) The distribution of gene expression evolution parallelism (log(1 /F)) across genes. Larger log(1 /F) values indicate more parallel evolution of a gene. The exhibit variation suggests that genes varied in their parallelism of its expression evolution.
Figure 2
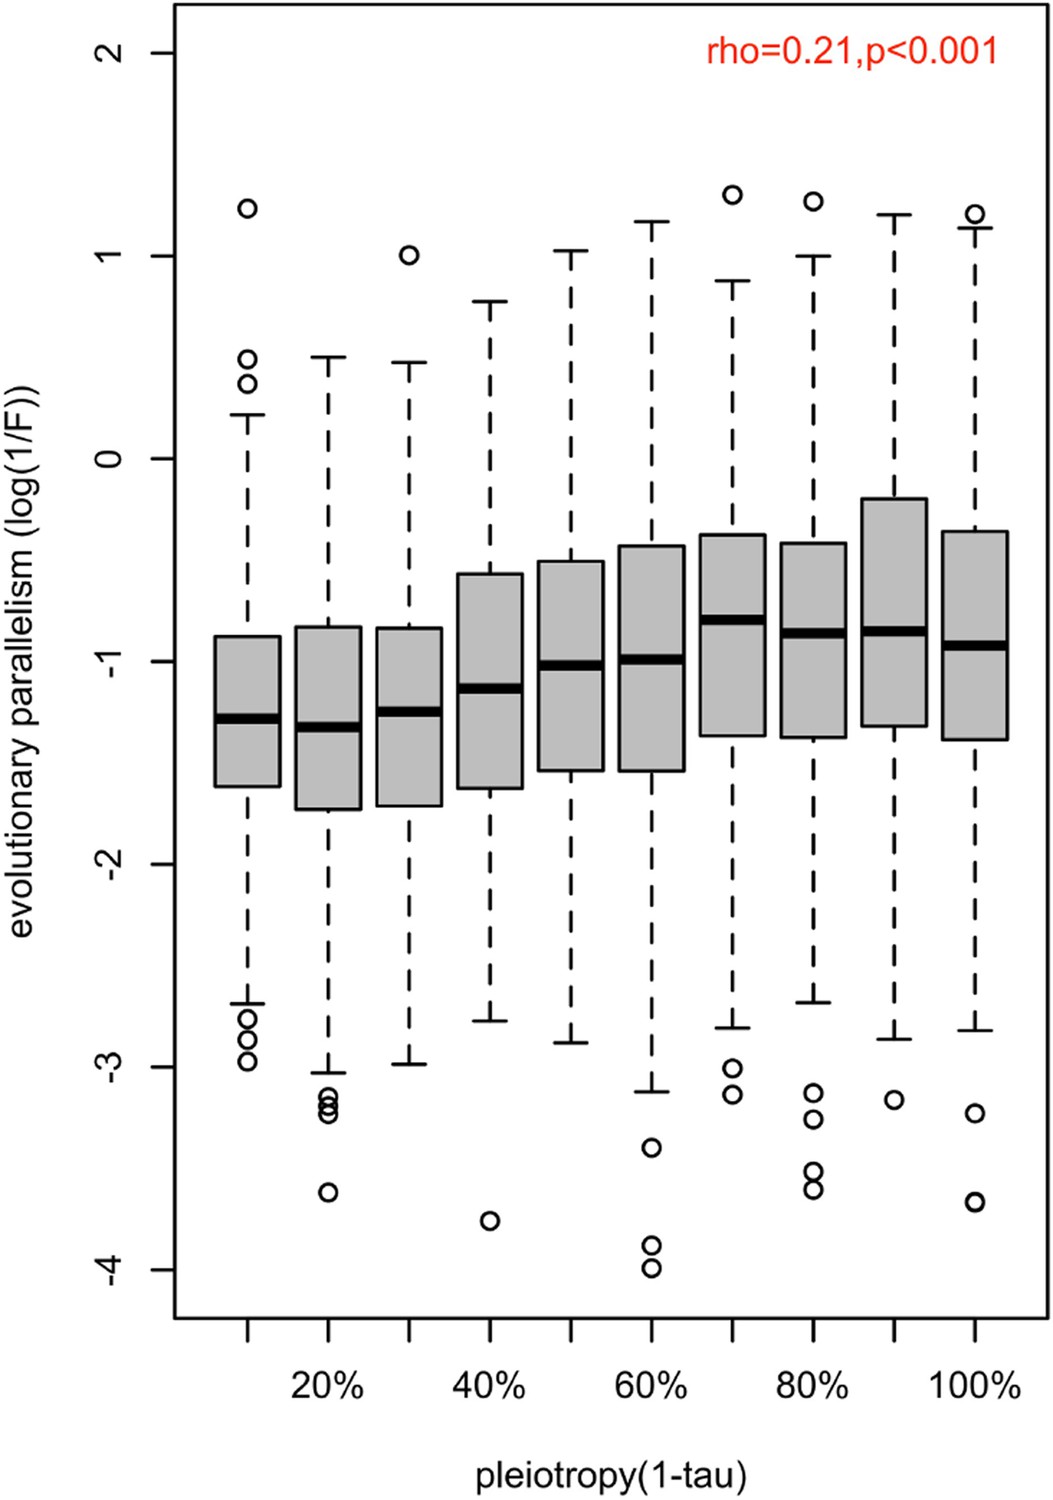
Association between the magnitude of evolution parallelism and the strength of pleiotropy.
The distribution of evolution parallelism (log(1 /F)) of putatively adaptive genes (n=1775) is shown in boxplots binned by their strength of pleiotropy (1-). Overall, the strength of pleiotropy was positively correlated with evolution parallelism (spearman correlation coefficient; =0.26; p-value <2.2e-16).
Figure 3
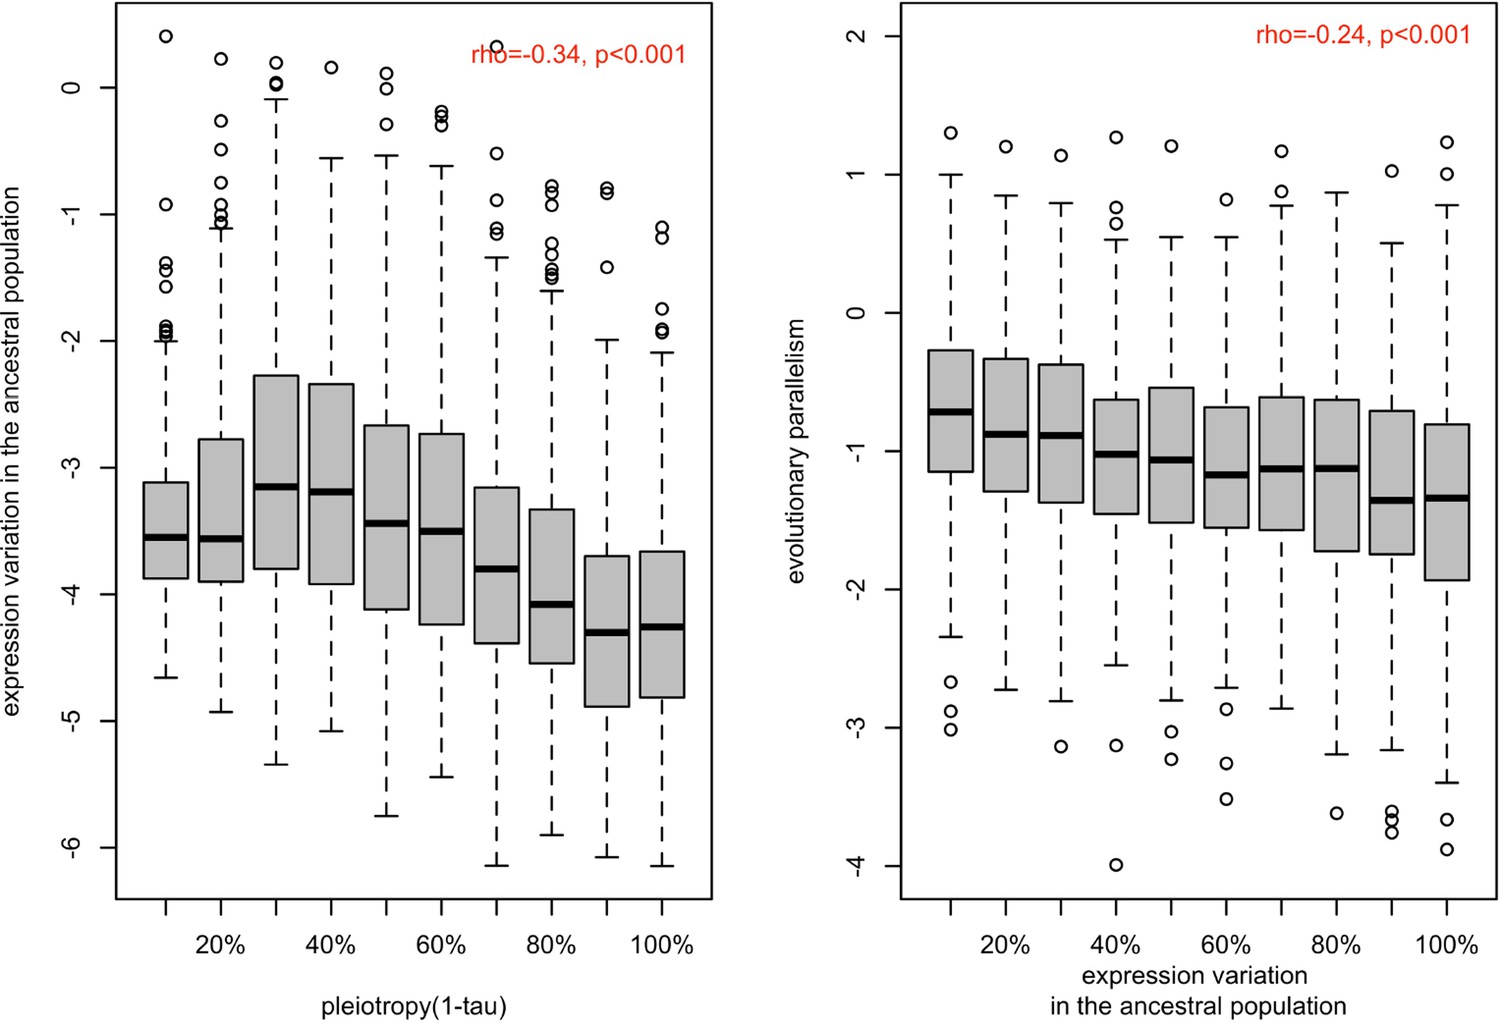
Association between ancestral variation in gene expression with the strength of pleiotropy (1- ) (a) and with the evolution parallelism (b).
(a) The distribution of gene expression variation in the ancestral population (log (BCV2)) of putatively evolved genes (n=1,775) is shown in boxplots binned by their strength of pleiotropy (1-). Overall, the strength of pleiotropy was negatively correlated with ancestral variation in gene expression (spearman correlation coefficient; =−0.34, p-value <2.2e-16). (b) The distribution of evolutionary parallelism (log(1 /F)) of putatively adaptive genes (n=1775) is shown in boxplots binned by their strength of ancestral variation. The strength of parallelism is negatively correlated with the ancestral variation in gene expression (spearman correlation coefficient; ρ=−0.22, p-value <2.2e-16).
Figure 4

Computer simulations illustrate the negative effect of ancestral variation on parallel evolution.
Computer simulations assume a fitness-related trait determined by the expression of four genes. The expression of these four genes is determined by a different number of genetic loci, reflecting the influence of pleiotropy on ancestral genetic variation. A shift in trait optimum was used to illustrate the connection between ancestral variation in expression (x-axis) and parallelism of expression change across ten evolved populations (y-axis). The negative correlation between them (ρ = –0.26, p-value <1.77e-07) suggests that the genes with less ancestral variation are resulting in more parallel responses.
Figure 5
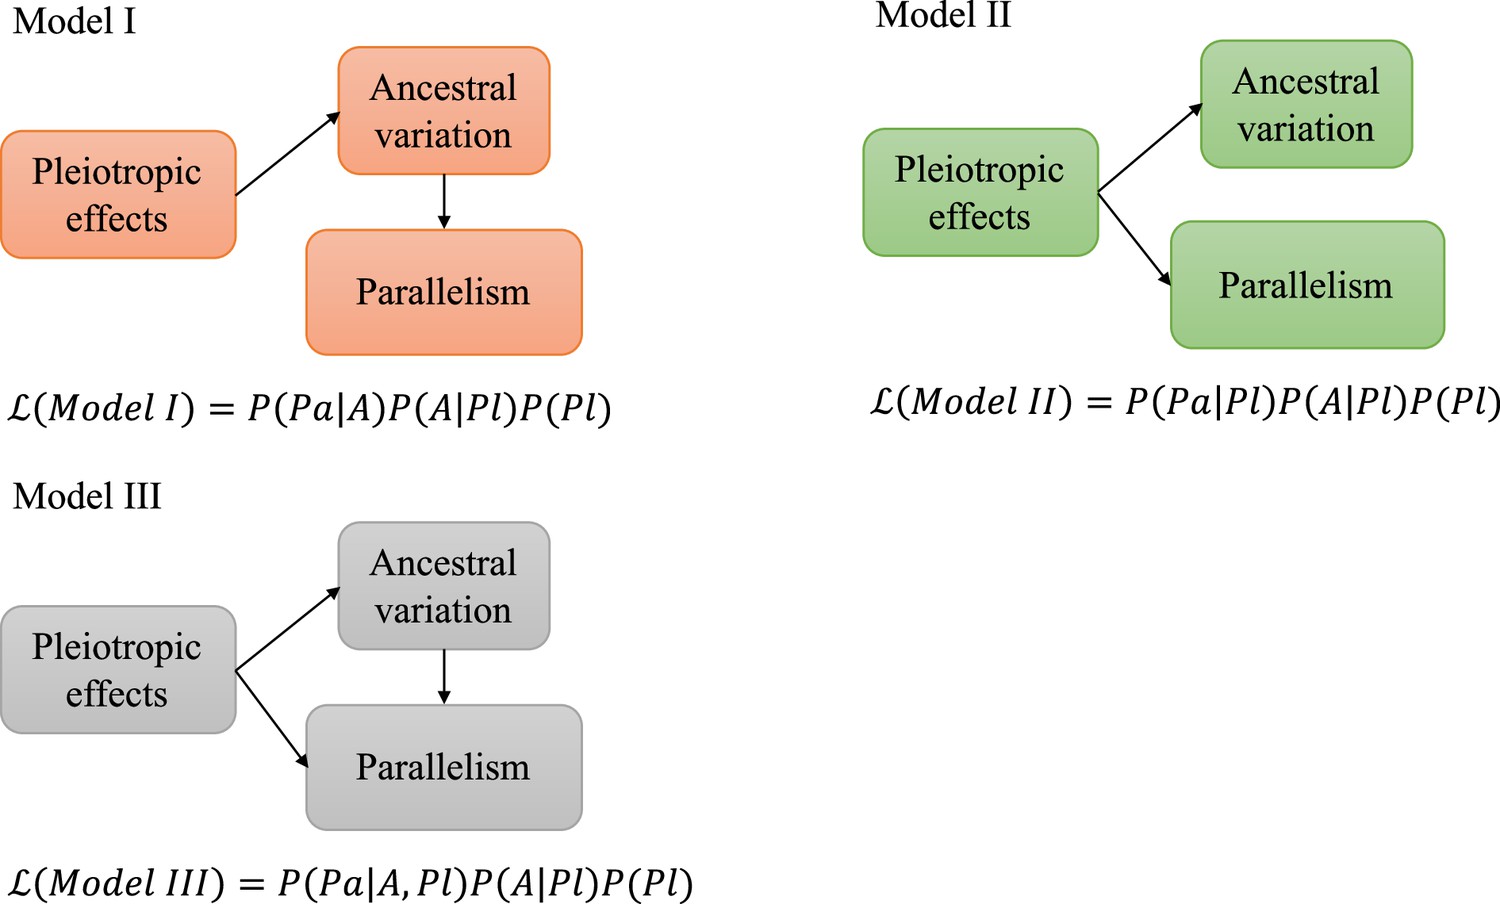
Schematic figure illustrating the causal models evaluated.
Five possible relationships between pleiotropic effects, ancestral variation, and evolutionary parallelism. denotes the likelihood of each model given the data. P is the probability or conditional probability of the measurements for each gene; Pa is the parallelism level and A is the level of ancestral variation in gene expression. Pl is the pleiotropic effects. See materials and methods for a more detailed description.
Appendix 1—figure 1

Positive correlation between two measures of pleiotropy.
The substantial correlation (rho = 0.45, p-value <2.2e-16) between network connectivity (x-axis) and 1- (y-axis) suggests that both estimates are capturing similar information representing the pleiotropy.
Appendix 1—figure 2
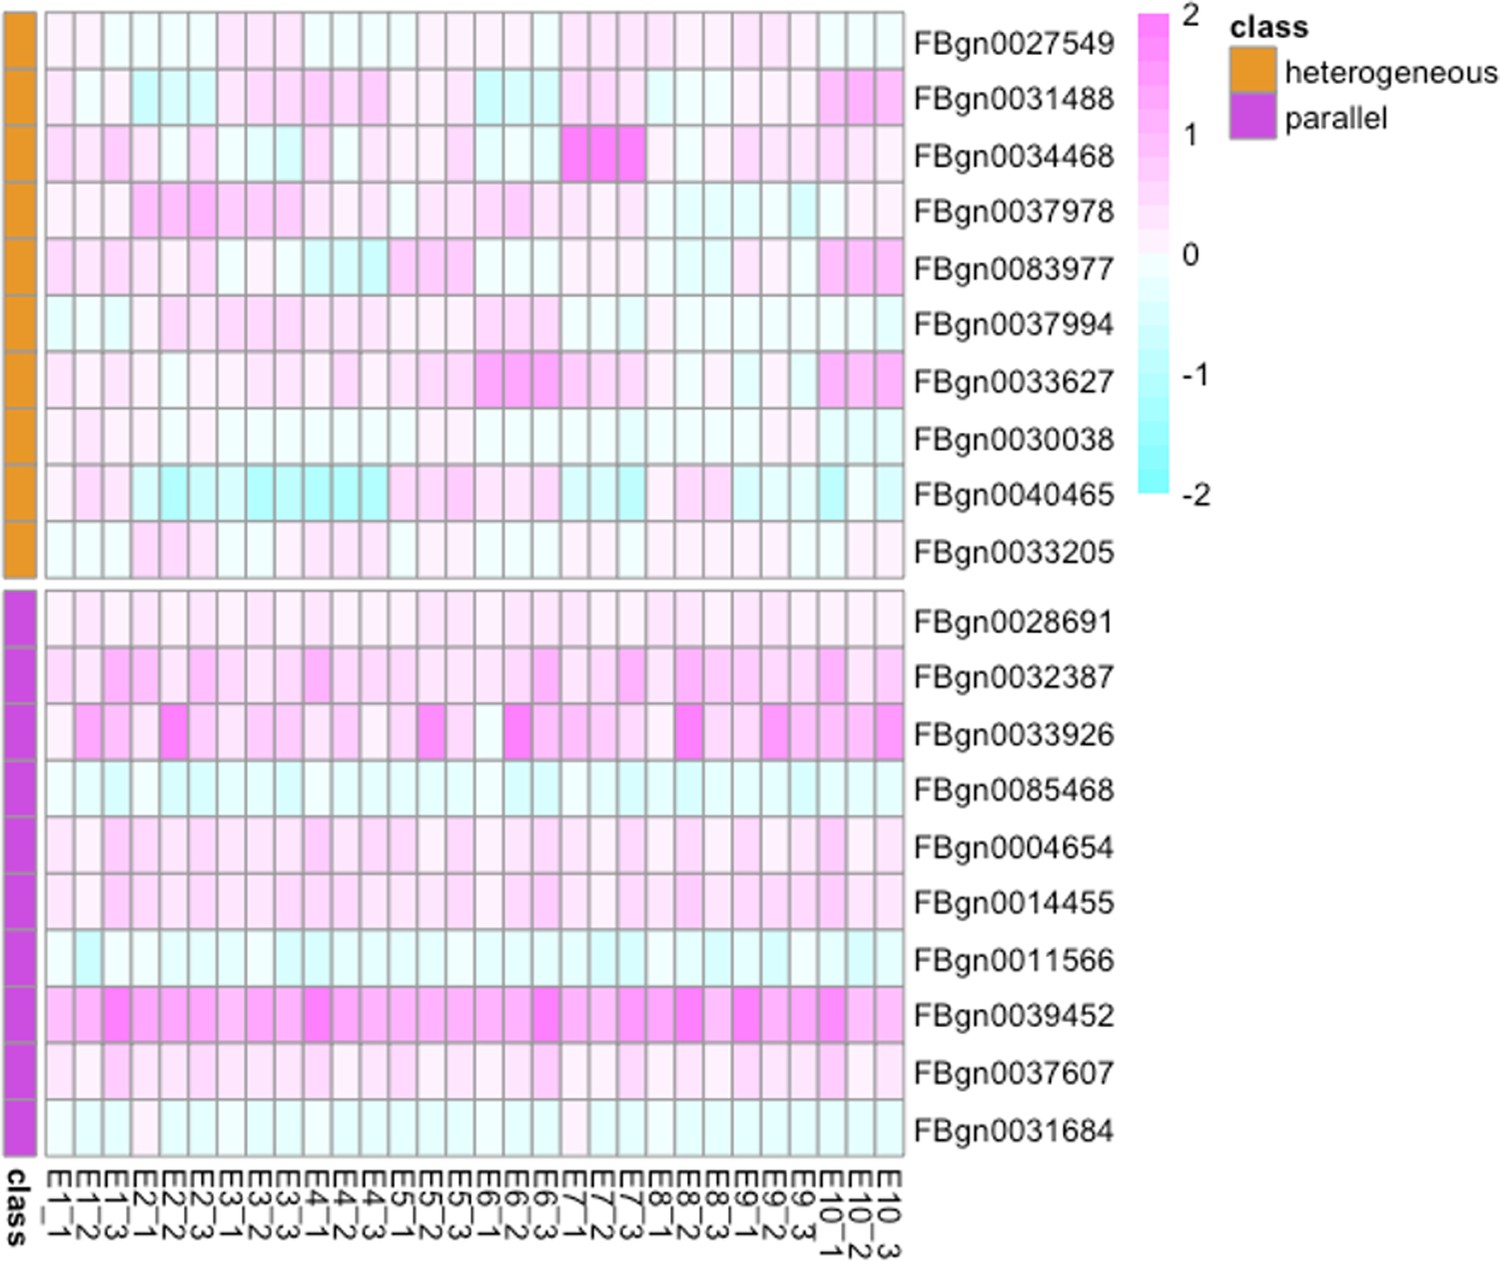
Evolutionary changes of gene expression across 10 evolved populations.
The figure compares the log2FC of the top 10 genes with the most parallel evolutionary responses (genes with the top 10 highest 1 /F values, shown in pink) and the top 10 genes with the most heterogeneous evolutionary responses (genes with the lowest 1 /F values, shown in orange). As illustrated in the figure, genes with higher 1 /F values display more parallel evolutionary responses (log2FC) across the 10 evolved populations, while genes with lower 1 /F values exhibit more variation in their evolutionary responses.
Appendix 1—figure 3

Association between parallelism of a gene (log(1 /F); y-axis) and the number of evolved populations in which it is significantly differentiated from the ancestral population (x-axis).
A significant positive correlation between them (rho = 0.22, p-value <5.7e-10) suggests that genes being detected in more evolved populations have higher expression parallelism and vice versa.
Appendix 1—figure 4
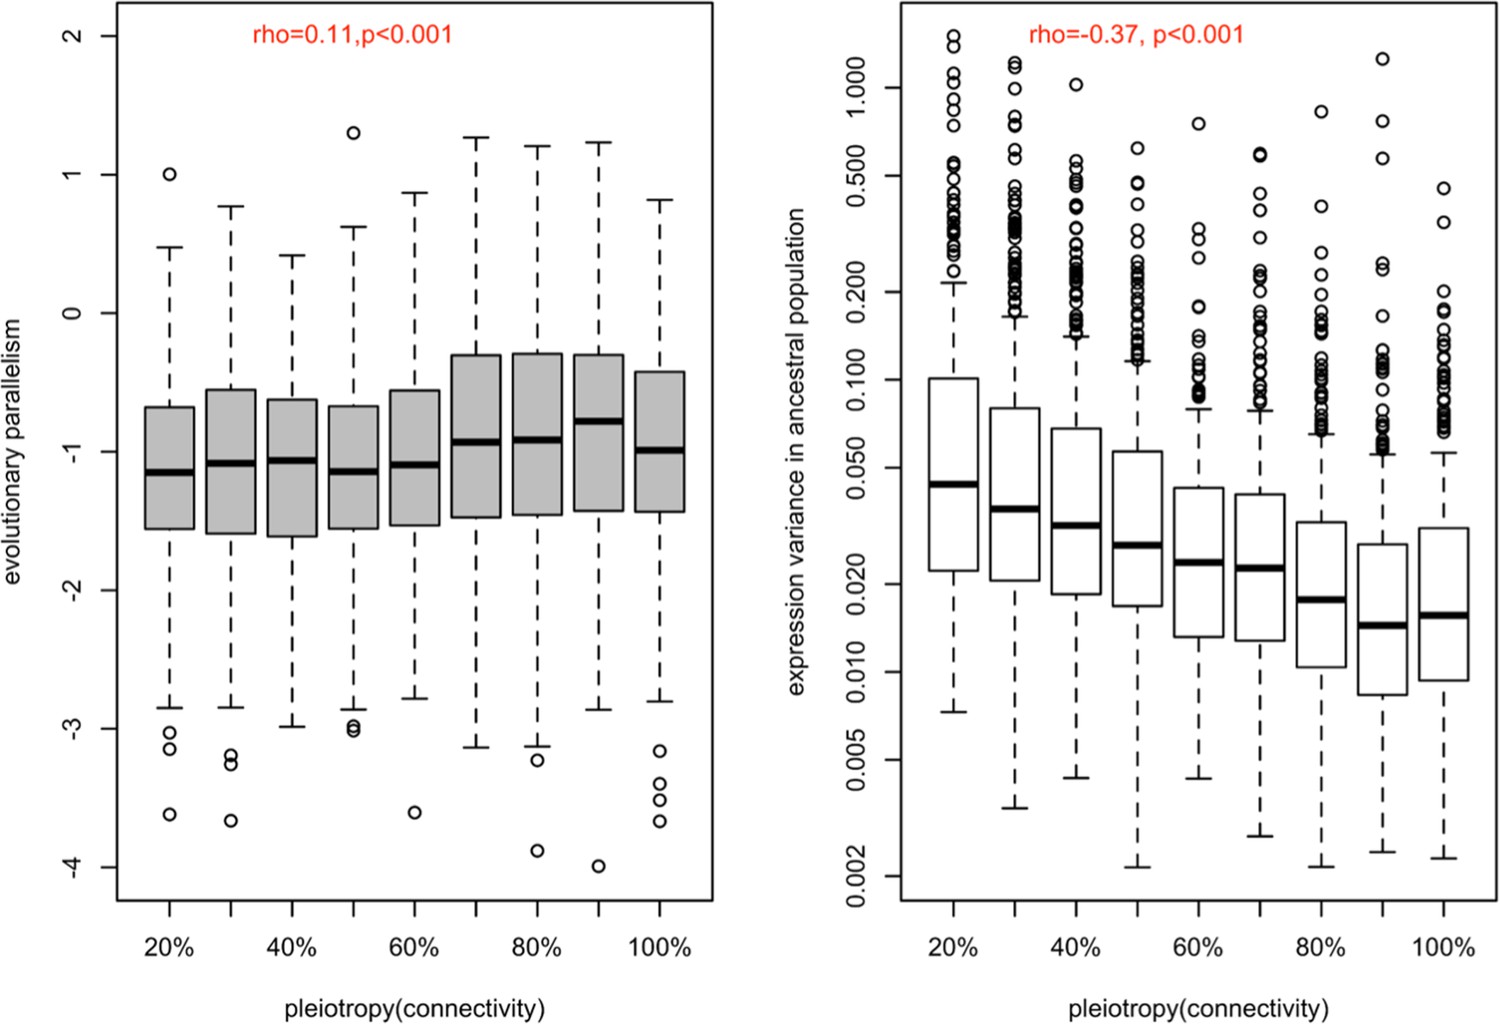
Correlation between the strength of pleiotropy (network connectivity) with the evolutionary parallelism (a) and with the ancestral variation (b).
(a) The distribution of evolutionary parallelism of different genes is shown in boxplots binned by their strength of pleiotropy (network connectivity). The strength of pleiotropy was positively correlated with evolutionary parallelism (rho = 0.11, p-value <5.6e-07). (b) The distribution of expression variance in ancestral populations of different genes is shown in boxplots binned by their strength of pleiotropy. The strength of pleiotropy is negatively correlated with the ancestral variation in gene expression (rho = −0.37, p-value <2.2e-16). Both results were consistent with the finding of the other measure of pleiotropy, tissue specificity.
Appendix 1—figure 5
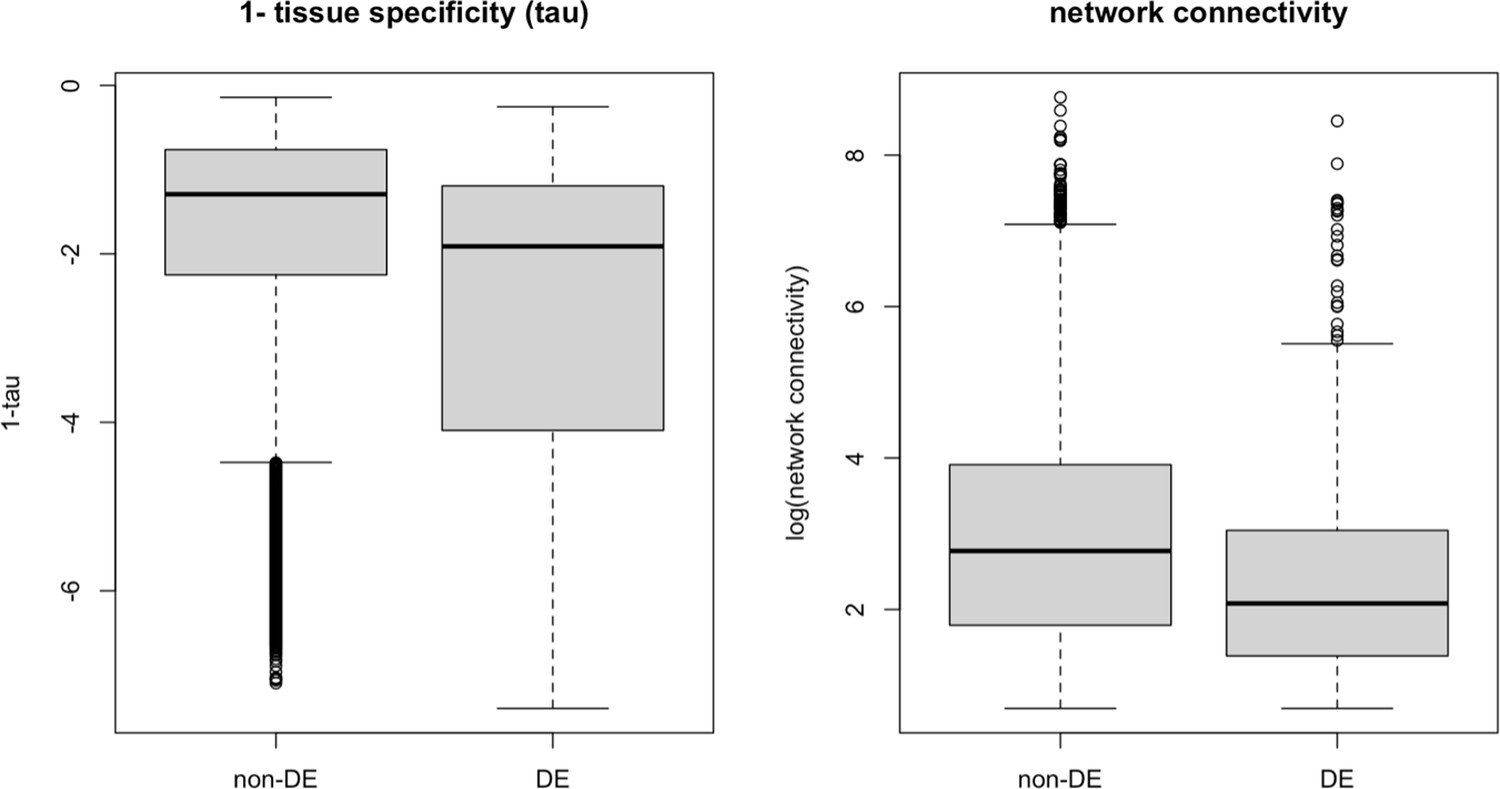
Strength of pleiotropy between DE and non-DE gene groups using 1-tissue specificity (a) and network connectivity (b) as proxies, respectively.
Genes without an evolutionary response (non-DE) exhibit greater pleiotropic strength compared to genes with evolutionary responses (differential expression, DE), defined here as genes showing significant expression changes between ancestral and evolved populations in the same direction in at least three populations. This pattern is consistent when using both tissue specificity and network connectivity as measures of pleiotropy, suggesting that extremely high levels of pleiotropy may constrain evolutionary responses.
Tables
Table 1
Bayesian Information Criteria (BIC) value for Model I-V.
The model with the smallest BIC is the one best support by the data.
| Model | BIC value (Network connectivity) | BIC value (Tissue specificity) |
|---|---|---|
| I | 9258.395 | 8958.125 |
| II | 9316.852 | 8972.626 |
| III | 9264.769 | 8939.342 |
| IV | 9490.017 | 9162.090 |
| V | 9550.309 | 9247.540 |
Table 2
Appendix 1—table 1
Regression of evolutionary parallelism (response) on both measures of pleiotropy (1- and network connectivity) and ancestral variation.
Coefficient estimates and hypothesis test () results are provided.
| Variable | F-statistics | p-value | |
|---|---|---|---|
| Ancestral variation | –0.16 | 76.7227 | <2.2e-16*** |
| 1- | 0.13 | 26.4172 | 3.055e-07*** |
| Network connectivity | –0.03 | 1.1288 | 0.2882 |
Appendix 1—table 2
Regression of ancestral variation (response) on both measures of pleiotropy (1- and network connectivity).
Coefficient estimates and hypothesis test () results are provided.
| Variable | F-statistics | p-value | |
|---|---|---|---|
| 1- | –0.236 | 258.581 | <2.2e-16*** |
| Network connectivity | –0.239 | 95.079 | <2.2e-16*** |
Additional files
Download links
A two-part list of links to download the article, or parts of the article, in various formats.
Downloads (link to download the article as PDF)
Open citations (links to open the citations from this article in various online reference manager services)
Cite this article (links to download the citations from this article in formats compatible with various reference manager tools)
Pleiotropy increases parallel selection signatures during adaptation from standing genetic variation
eLife 13:RP102321.
https://doi.org/10.7554/eLife.102321.3


