Elevated pyramidal cell firing orchestrates arteriolar vasoconstriction through COX-2-derived prostaglandin E2 signaling
- Sorbonne Université, CNRS, Inserm, Neuro-SU, France
- Sorbonne Université, CNRS, Inserm, Institut de Biologie Paris-Seine, France
- Sorbonne Université, CNRS, Inserm, Institut de la Vision, F-75012, France
- Sorbonne Université, INSERM, Nutrition and Obesities: Systemic Approaches, NutriOmics, Research Unit, France
Figures
Figure 1 with 2 supplements
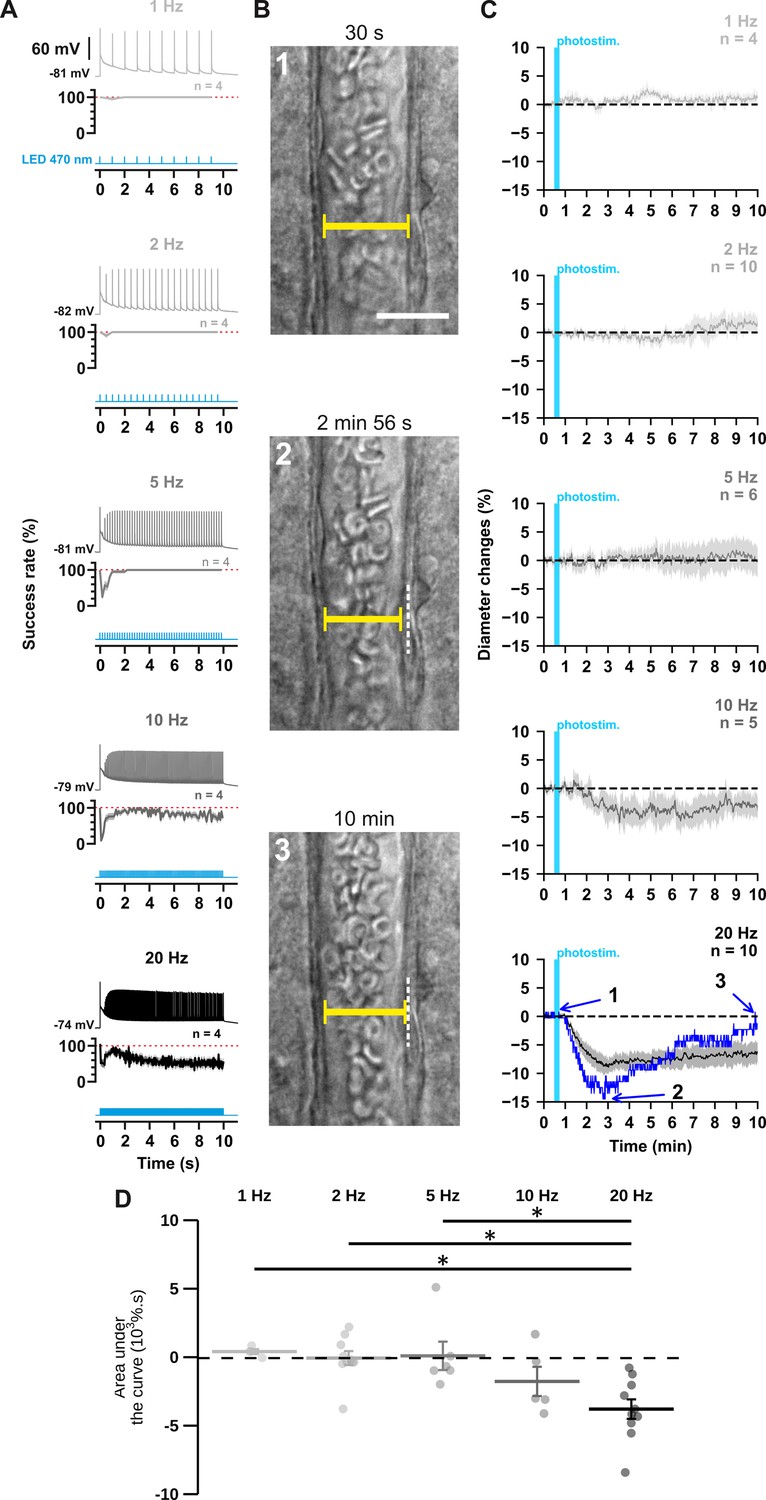
The occurrence and strength of vasoconstriction depends on the photostimulation frequency of pyramidal cells.
(A) Representative examples of the voltage responses of a layer II-III pyramidal cell (upper traces light grey to black traces) induced by photostimulations (470 nm, 10 s train, 5ms pulses) delivered at 1, 2, 5, 10, and 20 Hz (cyan lower traces) and mean spike success rate (middle trace, n=4 cells from 3 mice). The SEMs envelope the mean traces. The red dashed lines represent a spike success rate of 100%. (B) Representative example showing IR-DGC pictures of a layer I penetrating arteriole (1) before a 20 Hz photostimulation, (2) at the maximal diameter decrease, and (3) after 10 min of recording. Pial surface is upward. Yellow calipers represent the measured diameters. White dashed lines indicate the initial position of the vessel wall. Scale bar: 25 µm. (C) Kinetics of arteriolar diameter changes induced by photostimulation (vertical cyan bars) at 1 Hz (n=4 arterioles from 3 mice), 2 Hz (n=10 arterioles from 8 mice), 5 Hz (n=6 arterioles from 6 mice), 10 Hz (n=5 arterioles from 5 mice), and 20 Hz (n=10 arteriole from 9 mice). The SEMs envelope the mean traces. The blue trace represents the kinetics of the diameter changes of the arteriole shown in (B). (D) Effects of the different photostimulation frequencies on AUC of vascular responses during 10 min of recording. Data are presented as the individual values and mean ± SEM. * statistically different from 20 Hz stimulation with p<0.05.
-
Figure 1—source data 1
Detection of spikes per light pulse interval from different cells used to determine spike success rate in Figure 1A.
- https://cdn.elifesciences.org/articles/102424/elife-102424-fig1-data1-v1.xls
-
Figure 1—source data 2
Diameter measurements (µm) of individual arterioles used to determine diameter changes in Figure 1C and Figure 1—figure supplement 2.
- https://cdn.elifesciences.org/articles/102424/elife-102424-fig1-data2-v1.xls
Figure 1—figure supplement 1
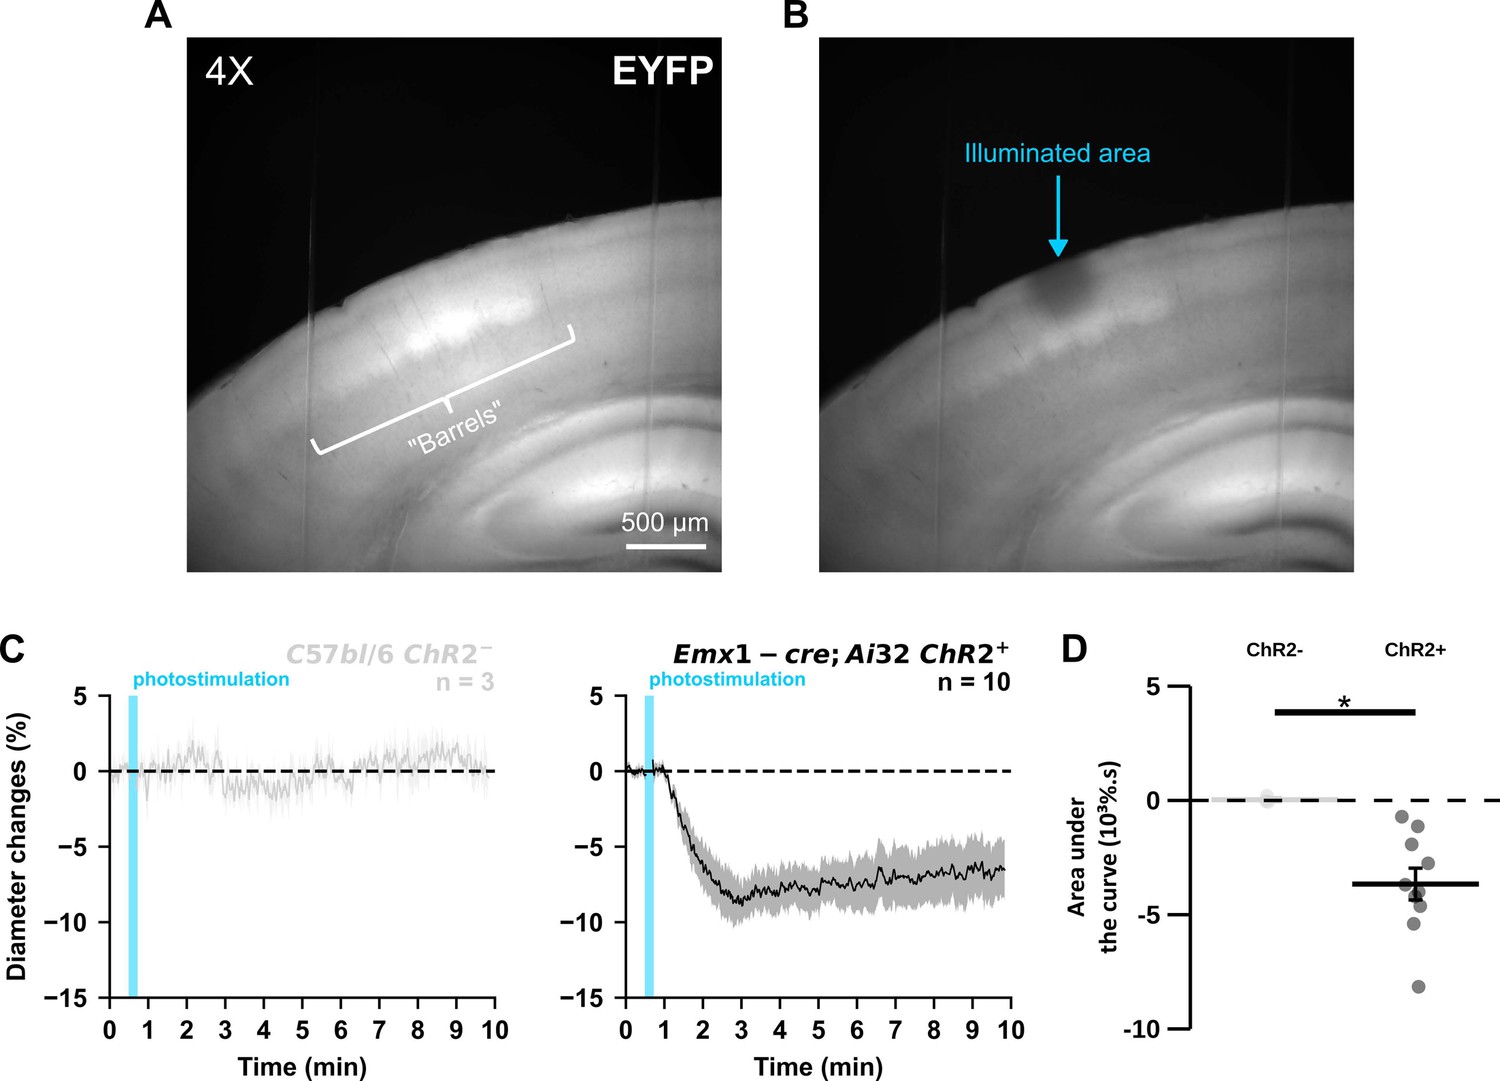
Vasoconstriction induced by widefield photostimulation is specific of ChR2 expression in pyramidal cells.
(A) Visualization of EYFP-ChR2 fusion transgene fluorescence in a cortical slice of an Emx1-cre;Ai32 mouse at 4 X objective. Note the presence of barrels in layer IV. (B) Photobleaching in superficial cortical layers was achieved by widefield illumination at maximum LED power for 1 min with a 40 X objective. The round photobleached area was approximately 0.15 mm². (C) Kinetics of vascular responses induced by photostimulation at 20 Hz in cortical brain slices from naive C57bl/6 J (light gray, n=3 arterioles) or ChR2-expressing Emx1-cre;Ai32 mice (black, n=10 arterioles). Dashed line represents the baseline. The SEMs envelope the mean traces. (D) Effect of pyramidal cell ChR2 expression on AUC of vascular responses evoked by photostimulation at 20 Hz. The data are shown as the individual values and mean ± SEM. * statistically different with p<0.05.
-
Figure 1—figure supplement 1—source data 1
Diameter measurements (µm) of individual arterioles used to determine diameter changes in Figure 1—figure supplement 1C.
- https://cdn.elifesciences.org/articles/102424/elife-102424-fig1-figsupp1-data1-v1.xlsx
Figure 1—figure supplement 2
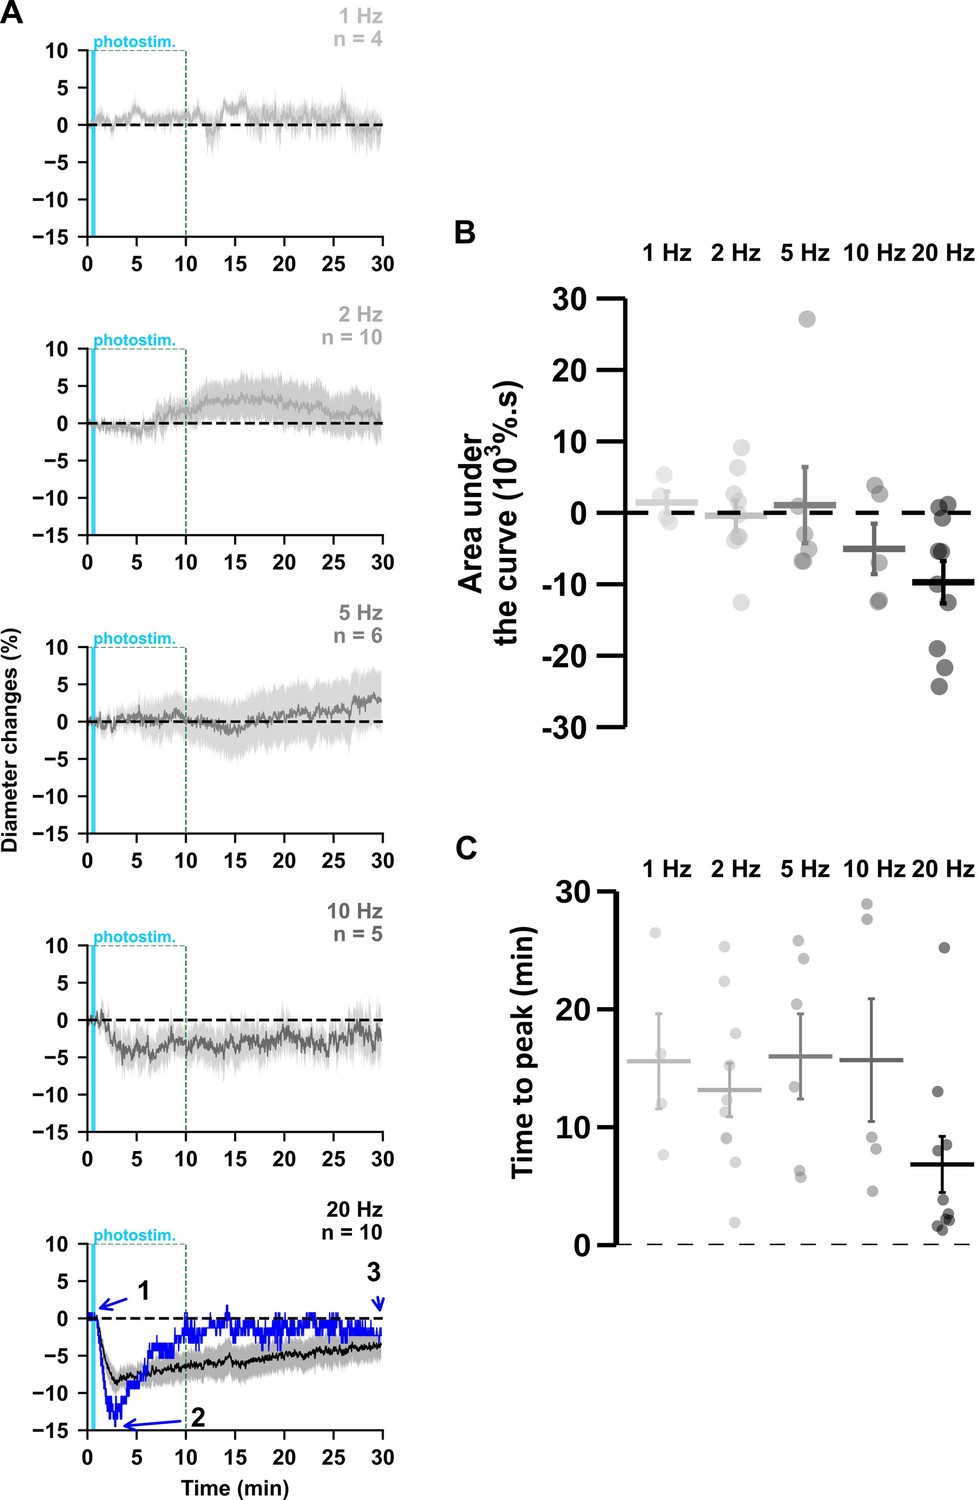
Vasoconstrictions occurred during the 30 first minutes after pyramidal cells photoactivation.
(A) Kinetics of arteriolar diameter changes induced by photostimulation (vertical cyan bars) at 1 Hz (n=4 arterioles from 3 mice), 2 Hz (n=10 arterioles from 8 mice), 5 Hz (n=6 arterioles from 6 mice), 10 Hz (n=5 arterioles from 5 mice) and 20 Hz (n=10 arterioles from 9 mice) during 30 min recording. The SEMs envelope the mean traces. The blue trace represents the kinetics of the diameter changes of the arteriole shown in Figure 1B. (B, C) Effects of the different photostimulation frequencies on (B) AUC and (C) time to peak of vascular responses during the 30 min of recording. Data are presented as the individual values and mean ± SEM.
Figure 2 with 1 supplement
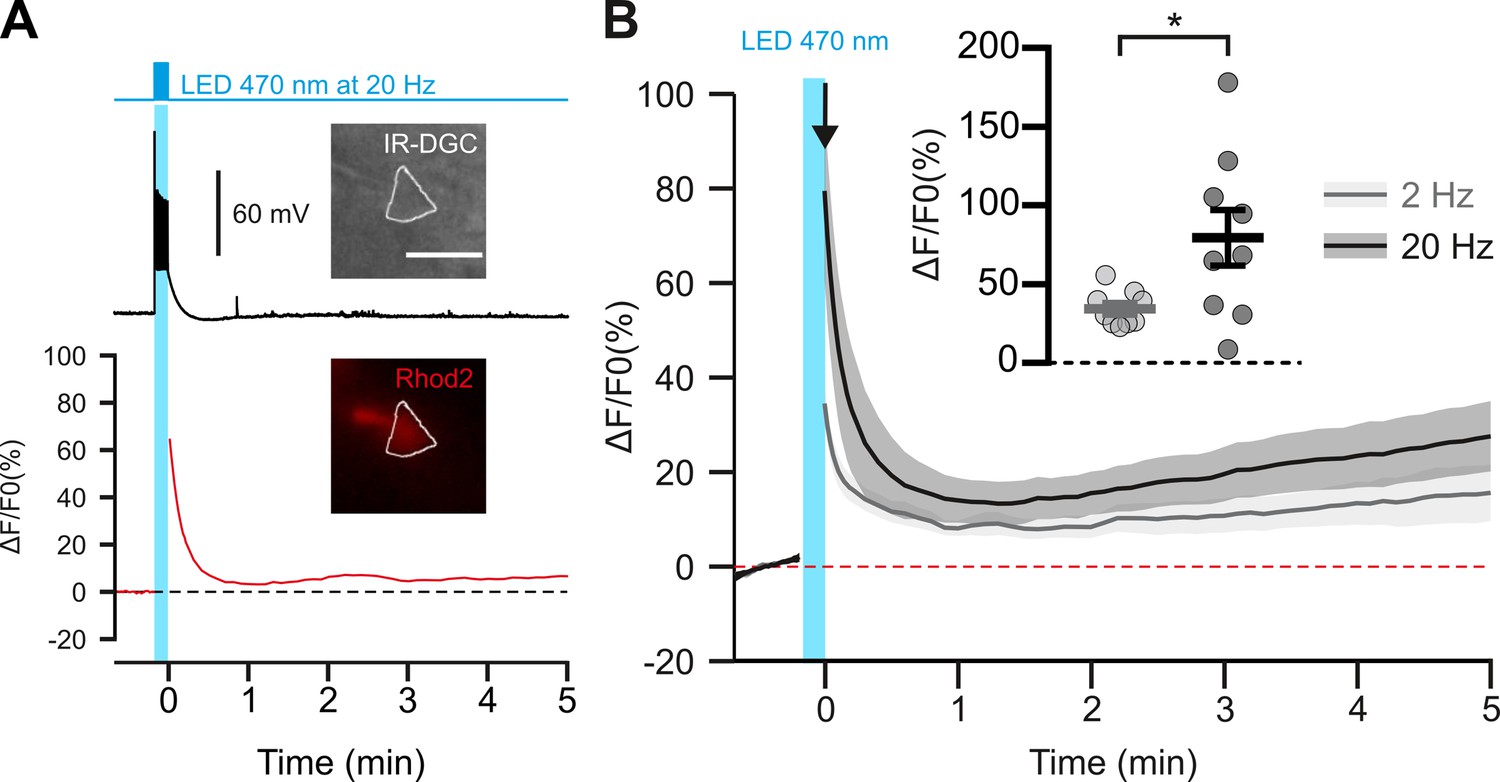
Photostimulation of pyramidal cells elicits a time-locked firing and a frequency-dependent calcium increase.
(A) Voltage response (top trace) and kinetics of relative fluorescence changes (red bottom trace) induced by photostimulation at 20 Hz. Insets, IR-DGC (top), Rhod2 fluorescence (bottom) pictures of an imaged layer II/III pyramidal cell. The somatic region of interest is outlined in white. Pial surface is upward. Scale bar: 20 µm. (B) Mean relative variations of Ca2+ fluorescence in response to photostimulation at 2 Hz (grey, n=9 cells from 5 mice) and 20 Hz (black, n=9 cells from 5 mice). Dashed line represents the baseline. The vertical cyan bar indicates the duration of photostimulation. SEMs envelope the mean traces. Inset, Maximum increase in relative fluorescence changes induced immediately after photostimulation, indicated by the black arrow. The data are shown as the individual values and mean ± SEM. * statistically different with p<0.05.
-
Figure 2—source data 1
Somatic fluorescence measurements (A.U.) used to determine fluorescence changes in Figure 2.
- https://cdn.elifesciences.org/articles/102424/elife-102424-fig2-data1-v1.xls
Figure 2—figure supplement 1
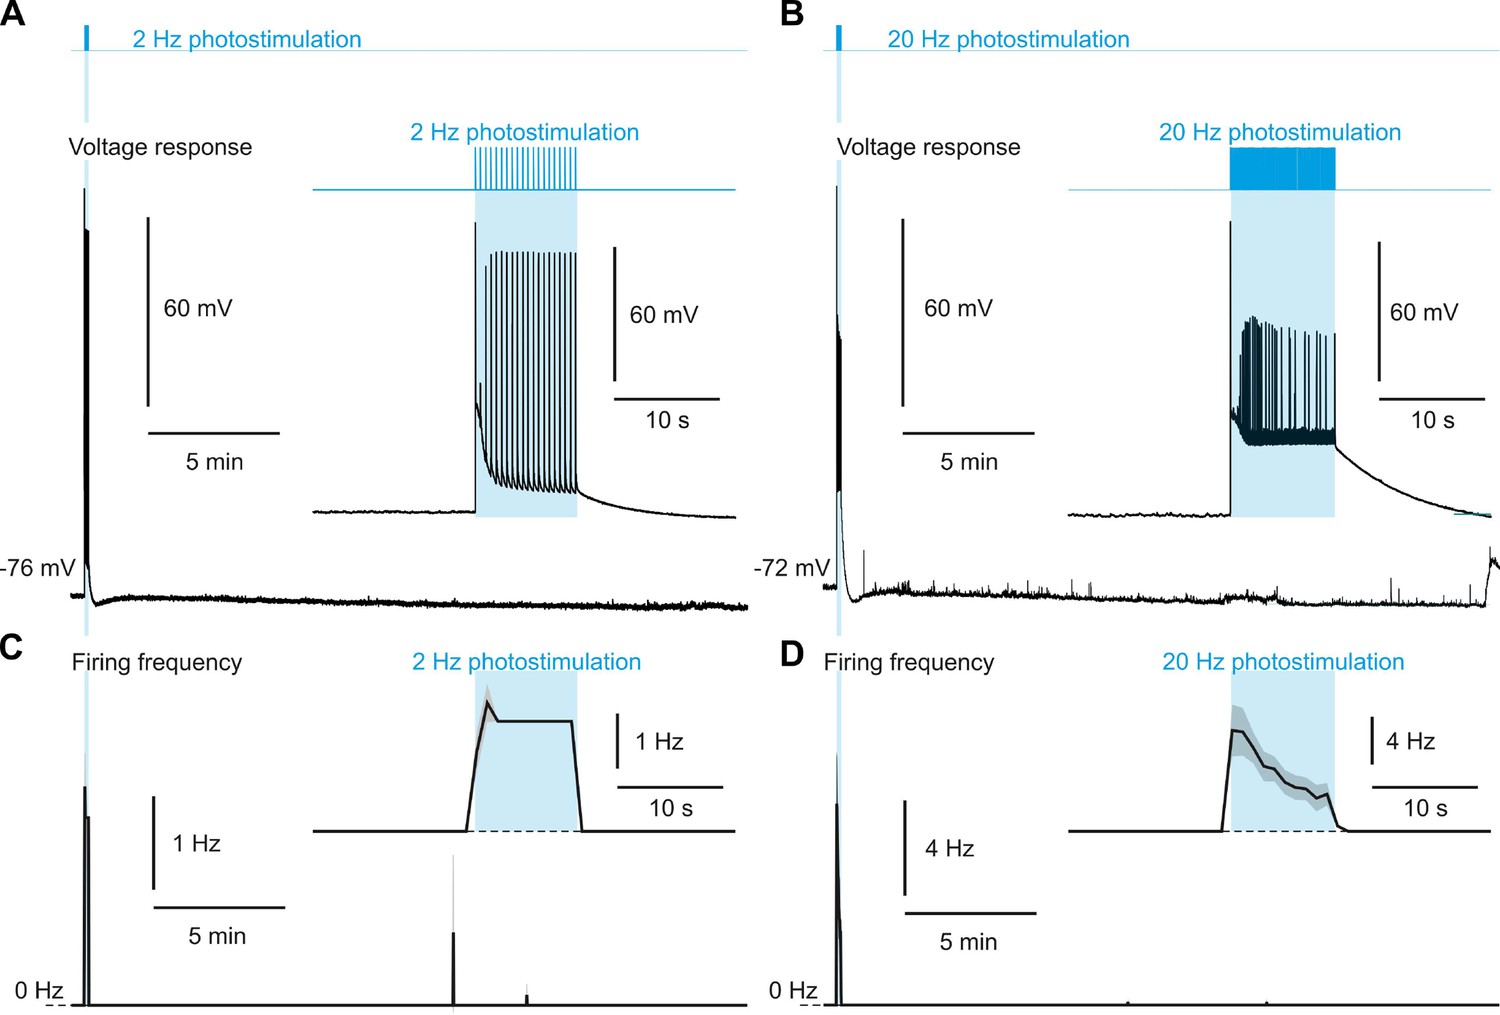
Photostimulation of pyramidal cells does not evoke recurrent spiking network activity.
(A, B) Representative voltage responses evoked before, during, and after photostimulation (vertical cyan bars) delivered at 2 (A) and 20 Hz (B). The insets show the enlarged voltage responses during photostimulation (cyan zones). (C, D) Mean firing frequency of pyramidal cells evoked at 2 Hz (C), n=9 cells from 5 mice and 20 Hz (D), n=9 cells from 5 mice. Note sporadic action potentials after photostimulation. The insets show the zoomed-in mean firing frequency during the 40 s period around photostimulation. The dashed line represents the 0 Hz baseline. The SEMs envelope the mean traces.
-
Figure 2—figure supplement 1—source data 1
Detection of spikes per second used to determine the mean firing frequency in Figure 2—figure supplement 1C and D.
- https://cdn.elifesciences.org/articles/102424/elife-102424-fig2-figsupp1-data1-v1.xls
Figure 3 with 1 supplement
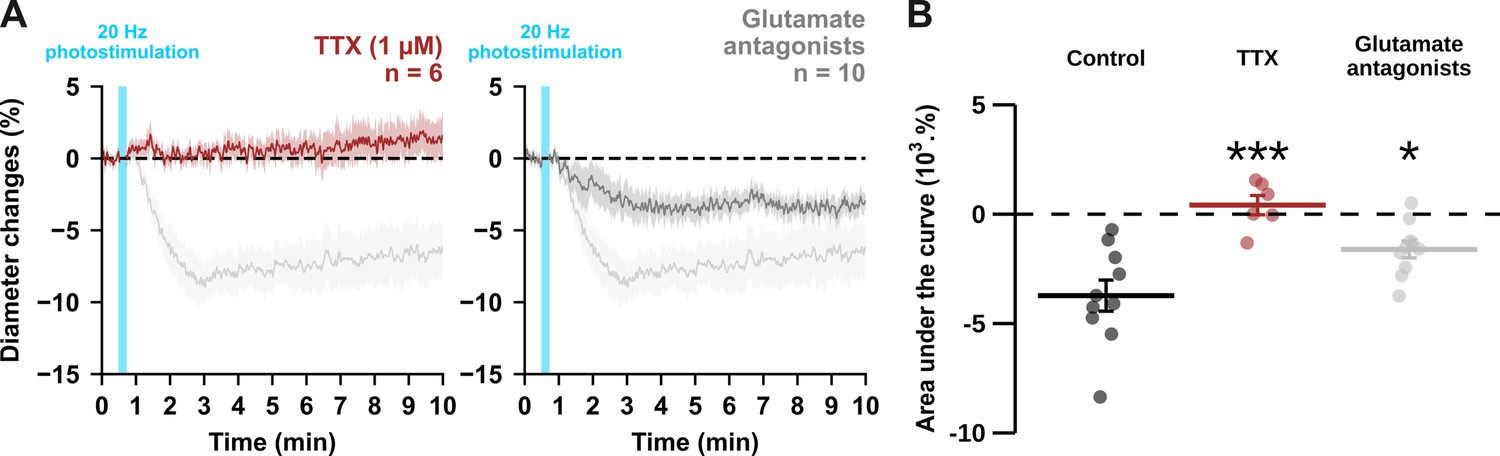
Optogenetically-induced vasoconstriction requires AP firing and partially glutamatergic transmission.
Effect of TTX (1 µM, brown, n=6 arterioles from 5 mice) and cocktail antagonists of AMPA/kainate (DNQX, 10 µM), NMDA (D-AP5, 50 µM), mGluR1 (LY367385, 100 µM) and mGluR5 (MPEP, 50 µM) receptors (gray, n=10 arterioles from 6 mice) on (A) kinetics and (B) magnitude of arteriolar vasoconstriction induced by 20 Hz photostimulation (cyan bar). The SEMs envelope the mean traces. Dashed lines represent the initial diameter. The shaded traces correspond to the kinetics of arteriolar vasoconstriction in control condition (Figure 1C – 20 Hz). Data are presented as the individual values and mean ± SEM. * and *** statistically different from control condition (Figure 1D – 20 Hz) with p<0.05 and p<0.001, respectively.
-
Figure 3—source data 1
Diameter measurements (µm) of individual arterioles used to determine diameter changes in Figure 3A.
- https://cdn.elifesciences.org/articles/102424/elife-102424-fig3-data1-v1.xlsx
Figure 3—figure supplement 1
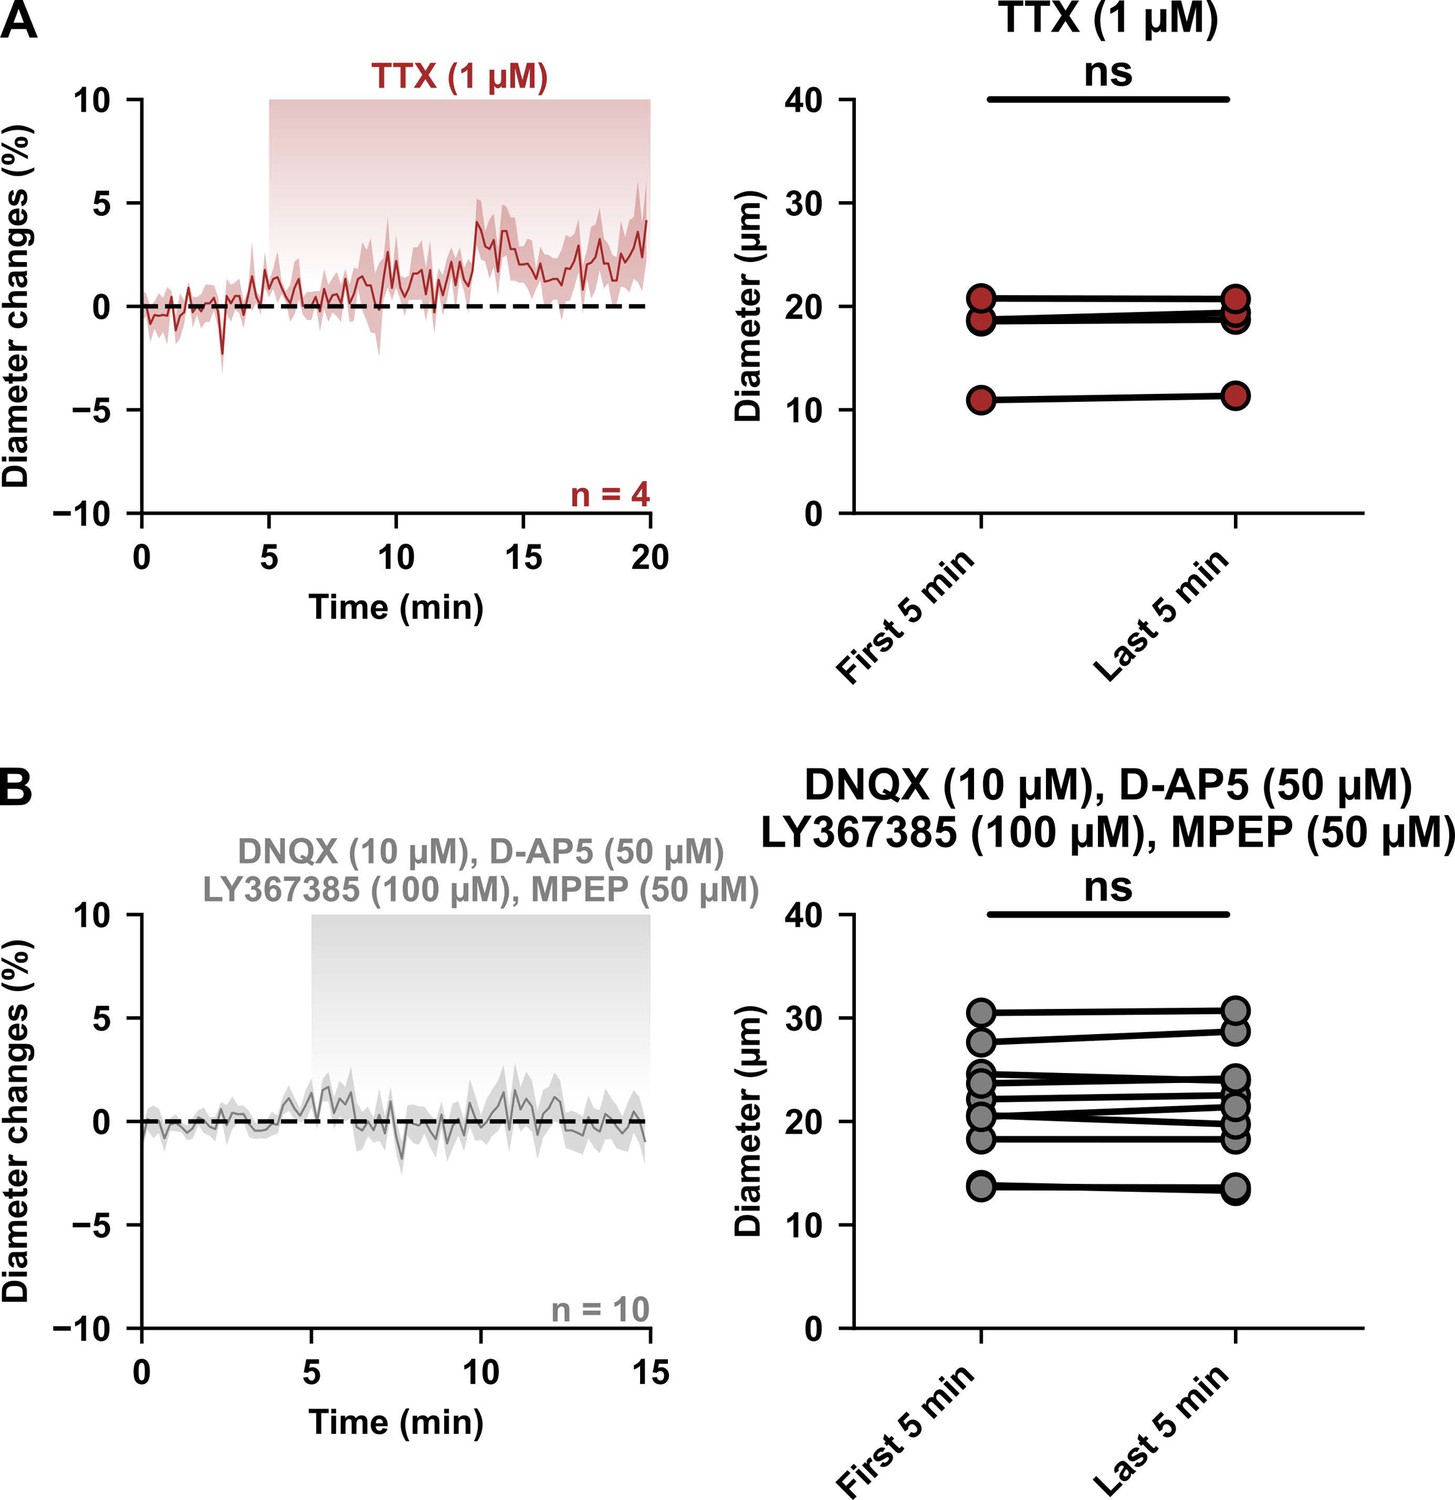
Basal network activity and tonic glutamate do not influence resting vascular tone.
(A, B) Kinetics of diameter changes (left panels) and comparison of the mean luminal diameter between the 5-min control period and after 15 or 20 min of treatment (right panels) with (A) TTX (1 µM, brown, n=4 arterioles from 2 mice) or (B) a cocktail of AMPA/kainate (DNQX, 10 µM), NMDA (D-AP5, 50 µM), mGluR1 (LY367385, 100 µM) and mGluR5 (MPEP, 50 µM) glutamate receptor antagonists (gray, n=10 arterioles from 6 mice). n.s. not statistically significant.
-
Figure 3—figure supplement 1—source data 1
Diameter measurements (µm) of individual arterioles used to determine diameter changes in Figure 3—figure supplement 1.
- https://cdn.elifesciences.org/articles/102424/elife-102424-fig3-figsupp1-data1-v1.xlsx
Figure 4 with 1 supplement
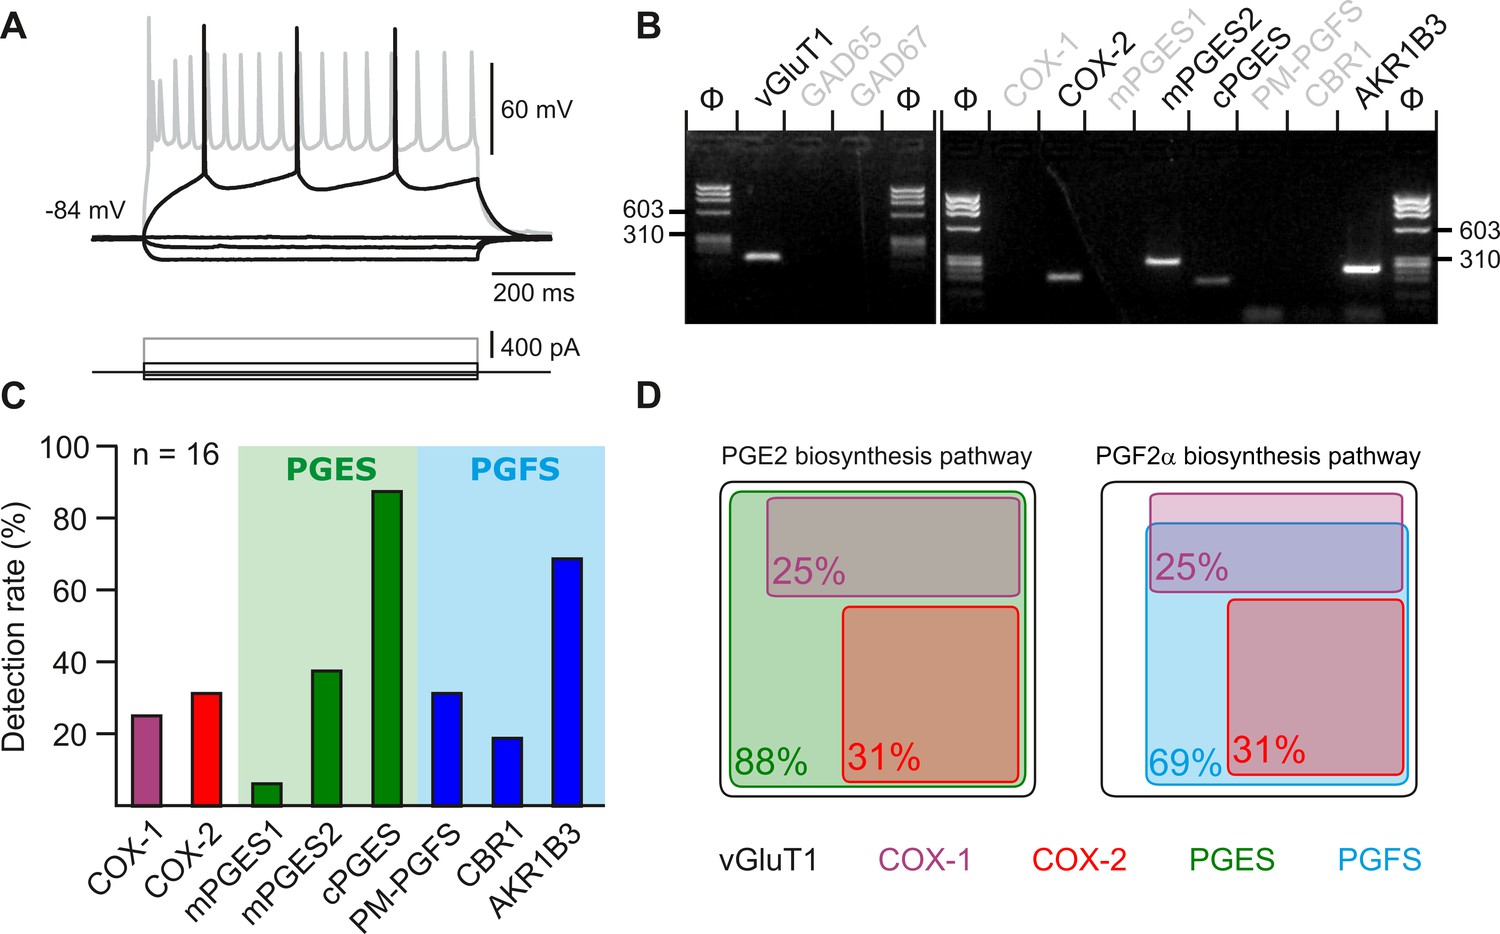
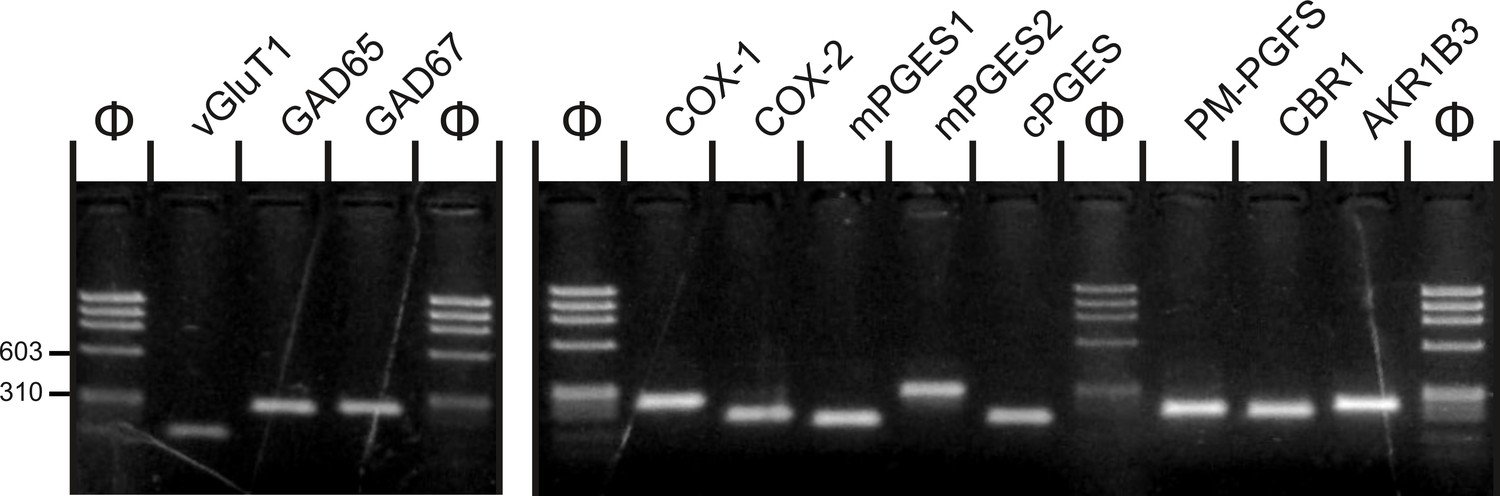
Layer II-III pyramidal cells express PGE2 and PGF2α synthesizing enzymes.
(A) Voltage responses of a layer II-III pyramidal cell induced by injection of current (bottom traces). In response to a just-above-threshold current pulse, the neuron fired long-lasting action potentials with little frequency adaptation (middle black trace). Near saturation, it exhibits the pronounced spike amplitude accommodation and marked frequency adaptation characteristic of regular spiking cells (upper grey trace). (B) Agarose gel analysis of the scRT-PCR products of the pyramidal cell shown in (A) revealing expression of vGluT1, COX-2, mPGES2, cPGES, PM-PGFS and CBR1. Φx174 digested by HaeIII (Φ in bps) was used as molecular weight marker (C) Histogram summarizing the single-cell detection rate of PGE2 and PGf2α synthesizing enzymes in layer II-III pyramidal cells (n=16 cells from 6 mice). PGES (green zone) corresponds to mPGES1, mPGES2 and/or cPGES and PGFS (blue zone) to PM-PGFS, CBR1 and/or AKR1B3. (D) Co-expression of PGE2 and PGf2α synthesizing enzymes in pyramidal cells. The box size is proportional to the detection rate. Note the absence of co-expression between COX-1 (purple) and COX-2 (red). Co-expression of a PGES (left, green) and a PGFS (right, blue) with COX-1 (up) and COX-2 (bottom).
-
Figure 4—source data 1
Original files of the full raw unedited gels shown in Figure 4B.
- https://cdn.elifesciences.org/articles/102424/elife-102424-fig4-data1-v1.zip
-
Figure 4—source data 2
Uncropped gels shown in Figure 4B with relevant lanes labeled.
- https://cdn.elifesciences.org/articles/102424/elife-102424-fig4-data2-v1.zip
Figure 4—figure supplement 1
Sensitivity of the RT-mPCR protocol.
Agarose gel analysis of a RT-PCR performed from 500 pg of forebrain total RNAs Φx174 digested by HaeIII (Φ in bps) was used as molecular weight marker. All the amplicons were detected with the expected sized from the gene sequences (Appendix 1—key resources table).
-
Figure 4—figure supplement 1—source data 1
Original file of the full raw unedited gel shown in Figure 4—figure supplement 1.
- https://cdn.elifesciences.org/articles/102424/elife-102424-fig4-figsupp1-data1-v1.zip
-
Figure 4—figure supplement 1—source data 2
Uncropped gels shown in Figure 4—figure supplement 1 with relevant lanes labeled.
- https://cdn.elifesciences.org/articles/102424/elife-102424-fig4-figsupp1-data2-v1.zip
Figure 5 with 2 supplements
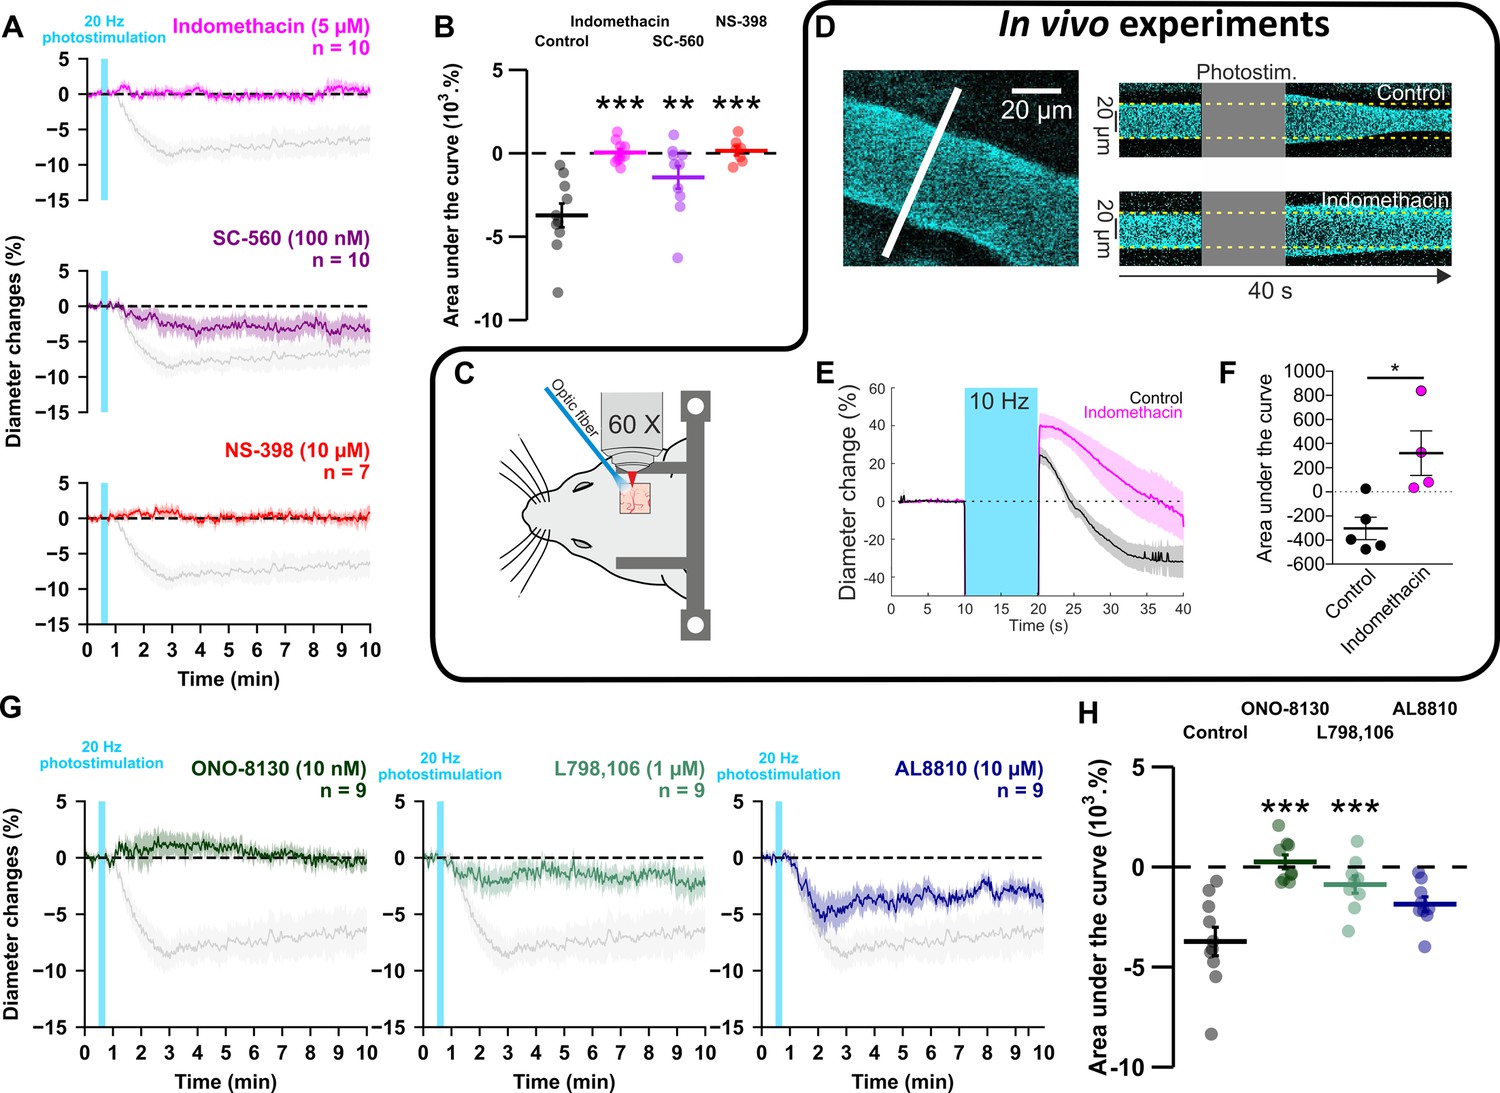
GE2 mostly derived from COX-2 activity and its EP1 and EP3 receptors mediates vasoconstriction induced by optogenetically activated pyramidal cells.
(A, B) Ex vivo effects of the COX1/2 inhibitor indomethacin (magenta, n=10 arterioles from 9 mice), the COX-1 inhibitor SC-560 (purple, n=10 arterioles from 7 mice), and the COX-2 inhibitor NS-398 (red, n=7 arterioles from 6 mice) on kinetics (A) and AUC (B) of arteriolar vasoconstriction induced by 20 Hz photostimulation (vertical cyan bar). In vivo experiments are highlighted by a black frame. (C) Optogenetic stimulation was achieved in vivo with an optic fiber through a chronic cranial window over the barrel cortex. (D) Left, diameter of pial arterioles labeled with fluorescein dextran (i.v) was measured with line-scan crossing the vessel (white line). Right, Representative examples of vascular response upon photostimulation (10 Hz, 10 s) under control (top) and indomethacin condition (bottom). (E) Diameter changes upon photostimulation under control (black; n=5 arterioles, 4 mice) or indomethacin (magenta; n=4 arterioles, 4 mice) conditions. (F) Area under the curve of the diameter change in control (black) or indomethacin (magenta) conditions calculated between 20 and 40 s (unpaired, two-tailed Mann Whitney test, * p<0.05). (G, H) Effects of the EP1, EP3 and FP antagonists, ONO-8130 (10 nM, dark green, n=9 arterioles from 7 mice), L798,106 (1 µM, light green, n=9 arterioles from 5 mice) and AL8810 (10 µM, dark blue, n=9 arterioles from 7 mice), respectively, on kinetics (G) and AUC (H) of arteriolar vasoconstriction induced by 20 Hz photostimulation. The data are shown as the individual values and mean ± SEM. Dashed line represents the baseline. The SEMs envelope the mean traces. The shaded traces in A and G correspond to the control condition (from Figure 1C – 20 Hz). *, ** and *** statistically different from 20 Hz control condition with p<0.05, 0.01 and 0.001, respectively.
-
Figure 5—source data 1
Diameter measurements (µm) of individual arterioles used to determine diameter changes in Figure 5A, B, G and H.
- https://cdn.elifesciences.org/articles/102424/elife-102424-fig5-data1-v1.xlsx
-
Figure 5—source data 2
Diameter changes of individual arterioles shown in Figure 5E under control condition.
- https://cdn.elifesciences.org/articles/102424/elife-102424-fig5-data2-v1.xlsx
-
Figure 5—source data 3
Diameter changes of individual arterioles shown in Figure 5E after indomethacin treatment.
- https://cdn.elifesciences.org/articles/102424/elife-102424-fig5-data3-v1.xlsx
Figure 5—figure supplement 1
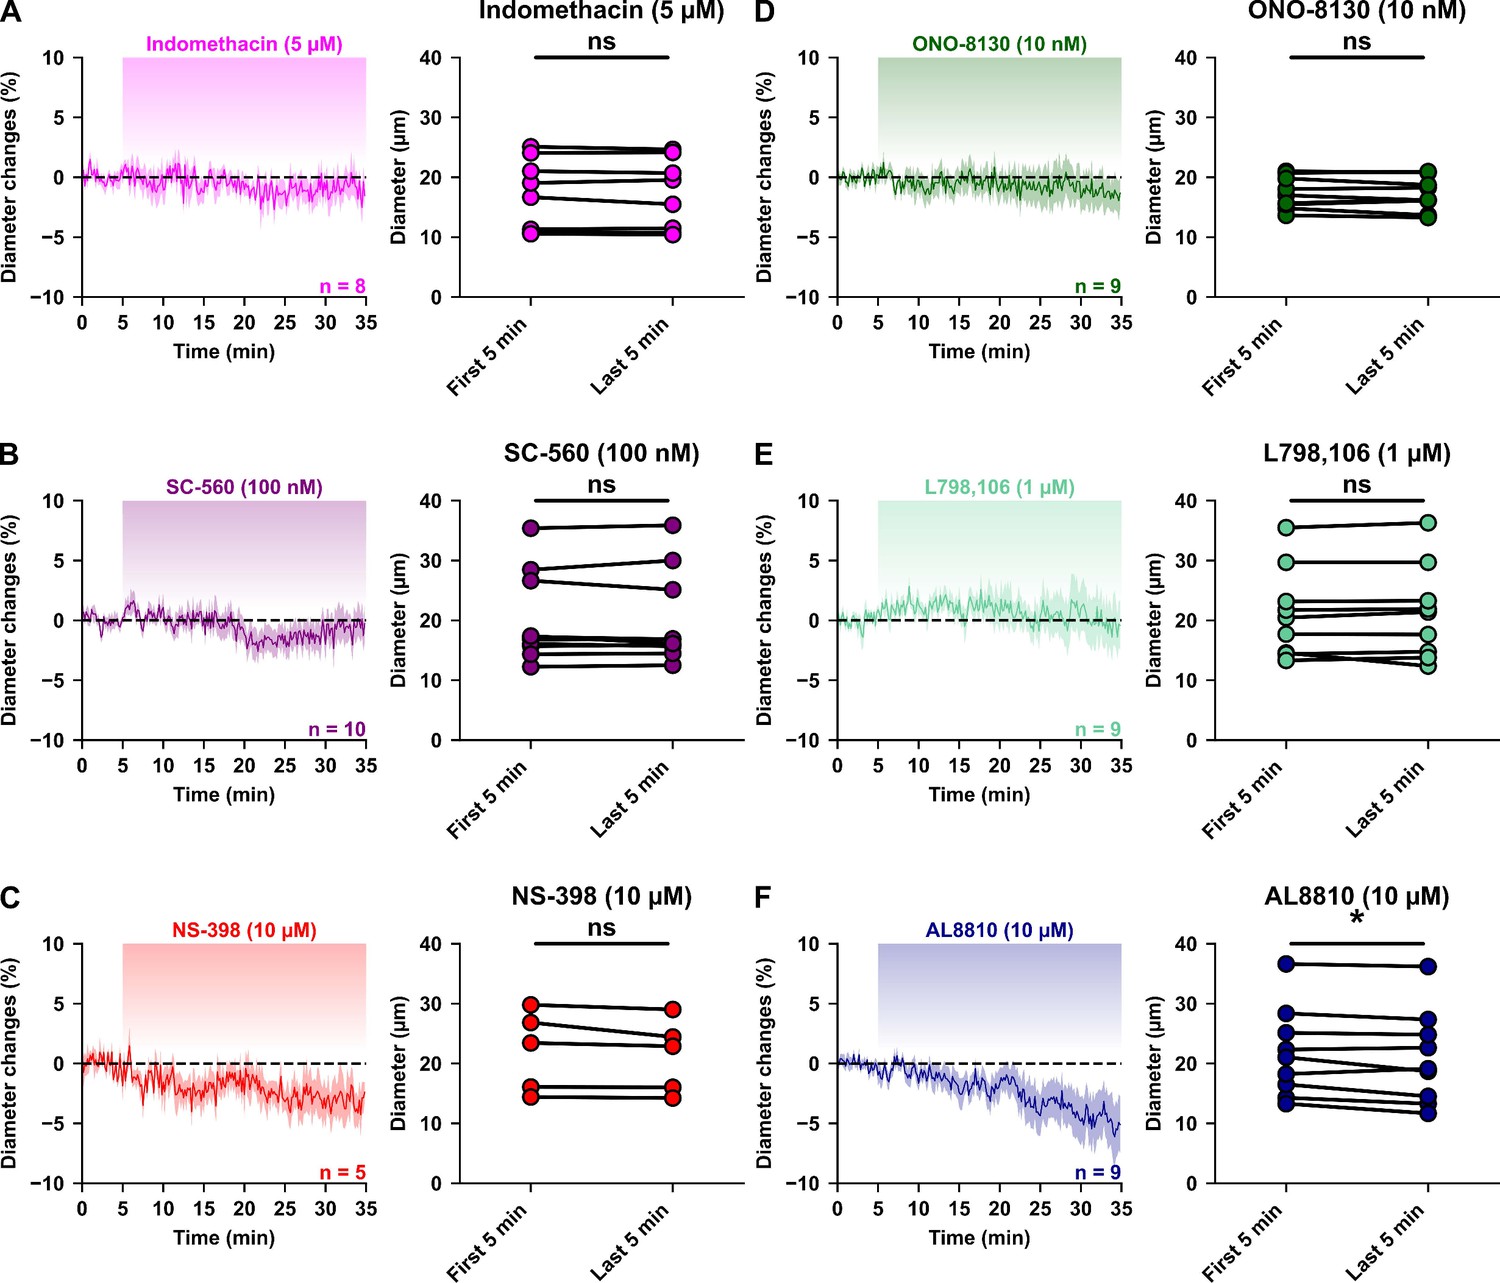
Tonic PGE2 does not affect basal vascular tone.
Kinetics of diameter changes (left panels) and comparison of the mean luminal diameter between the five minutes control period and the five minutes following 30 min treatment by the COX inhibitors (A) indomethacin (5 µM, magenta, n=8 arterioles from 7 mice), (B) SC-560 (100 nM, purple, n=10 arterioles from 7 mice), (C) NS-398 (10 µM, red, n = 5 arterioles from 4 mice), and the EP1, EP3 and FP antagonists (D) ONO-8130 (10 nM, dark green, n = 9 arterioles from 7 mice), (E) L-798,106 (1 µM, light green, n = 9 arterioles from 4 mice) and (F) AL8810 (10 µM, dark blue, n = 9 arterioles from 7 mice), respectively. n.s. not statistically significant and * statistically different with p< 0.05.
-
Figure 5—figure supplement 1—source data 1
Diameter measurements (µm) of individual arterioles used to determine diameter changes in Figure 5—figure supplement 1.
- https://cdn.elifesciences.org/articles/102424/elife-102424-fig5-figsupp1-data1-v1.xls
Figure 5—figure supplement 2

PGE2 dose-dependently induces vasoconstriction.
(A, B) Kinetics of arteriolar diameter changes induced by exogenous application of PGE2 (vertical green zones) at (A1) 10 nM (n = 7 arterioles from 4 mice), (A2) 100 nM (n=8 arterioles from 6 mice), (A3) 1 µM (n=7 arterioles from 4 mice) and (A4) 10 µM (n=6 arterioles from 4 mice), by (B) the EP1/EP3 agonist sulprostone (fluorescent green, 10 µM, n=8 arterioles from 5 mice) or (C) by 10 µM PGE2 under a TTX application (1 µM, n=5 arterioles from 3 mice). Dashed line represents the baseline. The SEMs envelope the mean traces. (D) Dose-dependent effect of PGE2 or sulprostone effect on AUC of vascular responses. The data are shown as the individual values and mean ± SEM.
-
Figure 5—figure supplement 2—source data 1
Diameter measurements (µm) of individual arterioles used to determine diameter changes in Figure 5—figure supplement 2.
- https://cdn.elifesciences.org/articles/102424/elife-102424-fig5-figsupp2-data1-v1.xls
Figure 6 with 1 supplement

NPY Y1 receptors activation and 20-HETE synthesis mediates the vasoconstriction induced by pyramidal neurons.
Effects of paxilline (1 µM, orange, n=10 arterioles from 6 mice), HET-0016 (100 nM, blue-grey, n=10 arterioles from 7 mice) and BIBP3226 (1 µM, yellow, n=10 arterioles from 6 mice) on (A) kinetics and (B) AUC of arteriolar vasoconstriction induced by 20 Hz photostimulation (vertical blue bar). Dashed line represents the baseline. The SEMs envelope the mean traces. The shaded traces correspond to the control condition (Figure 1C – 20 Hz). The data are shown as the individual values and mean ± SEM. * and *** statistically different from 20 Hz control condition with p<0.05 and 0.001.
-
Figure 6—source data 1
Diameter measurements (µm) of individual arterioles used to determine diameter changes in Figure 6.
- https://cdn.elifesciences.org/articles/102424/elife-102424-fig6-data1-v1.xlsx
Figure 6—figure supplement 1
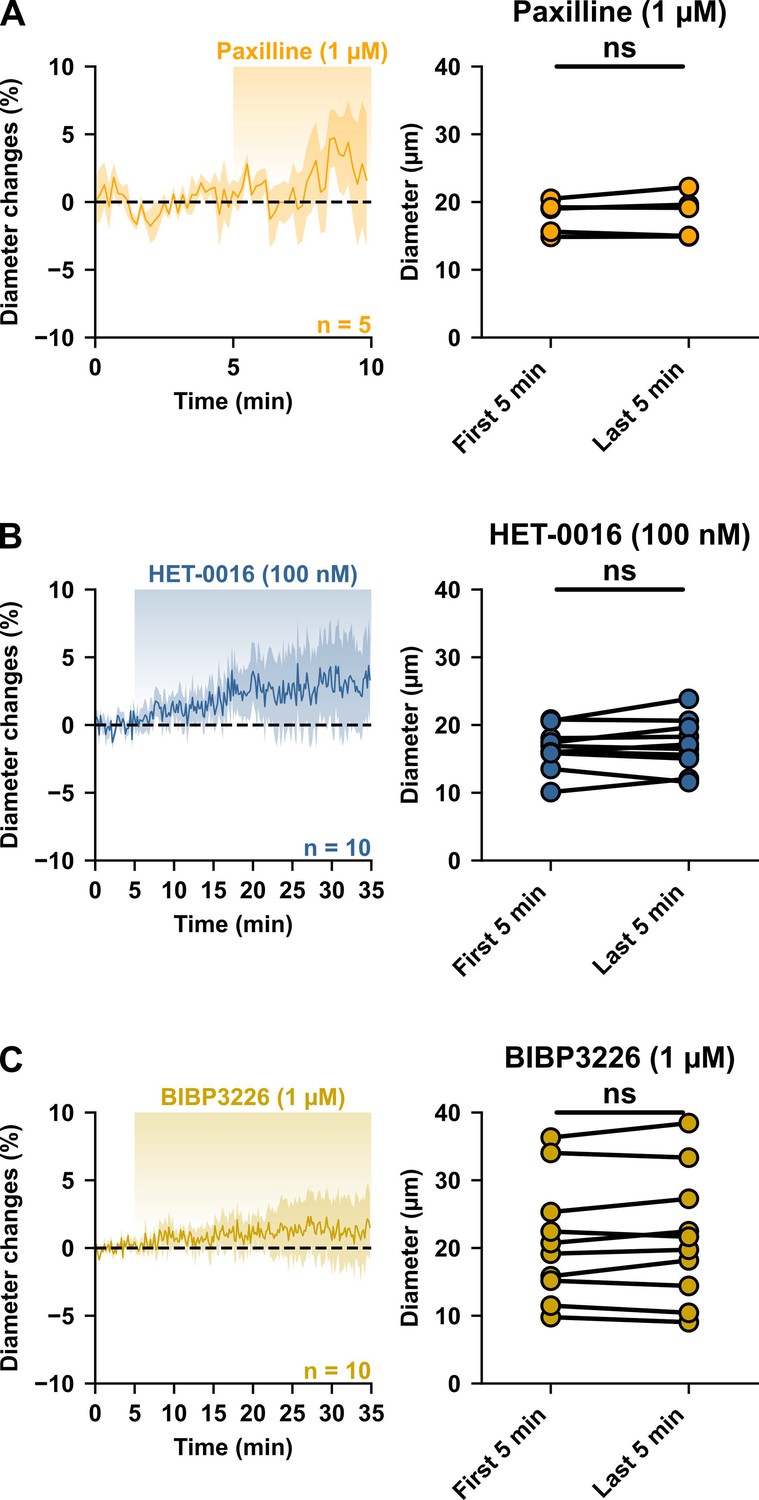
Vasoconstrictive pathways do not influence resting vascular tone.
Kinetics of diameter changes (left panels) and comparison of the mean luminal diameter between the five-minute control period and the last five minutes (right panels) of treatment with (A) paxilline (1 µM, orange, n=5 arterioles from 3 mice) for five minutes or with (B) HET-0016 (100 nM, blue-grey, n = 10 arterioles from 7 mice) or (C) BIBP3226 (1 µM, yellow, n=10 arterioles from 6 mice) for 30 min. n.s. not statistically significant.
-
Figure 6—figure supplement 1—source data 1
Diameter measurements (µm) of individual arterioles used to determine diameter changes in Figure 6—figure supplement 1.
- https://cdn.elifesciences.org/articles/102424/elife-102424-fig6-figsupp1-data1-v1.xls
Figure 7
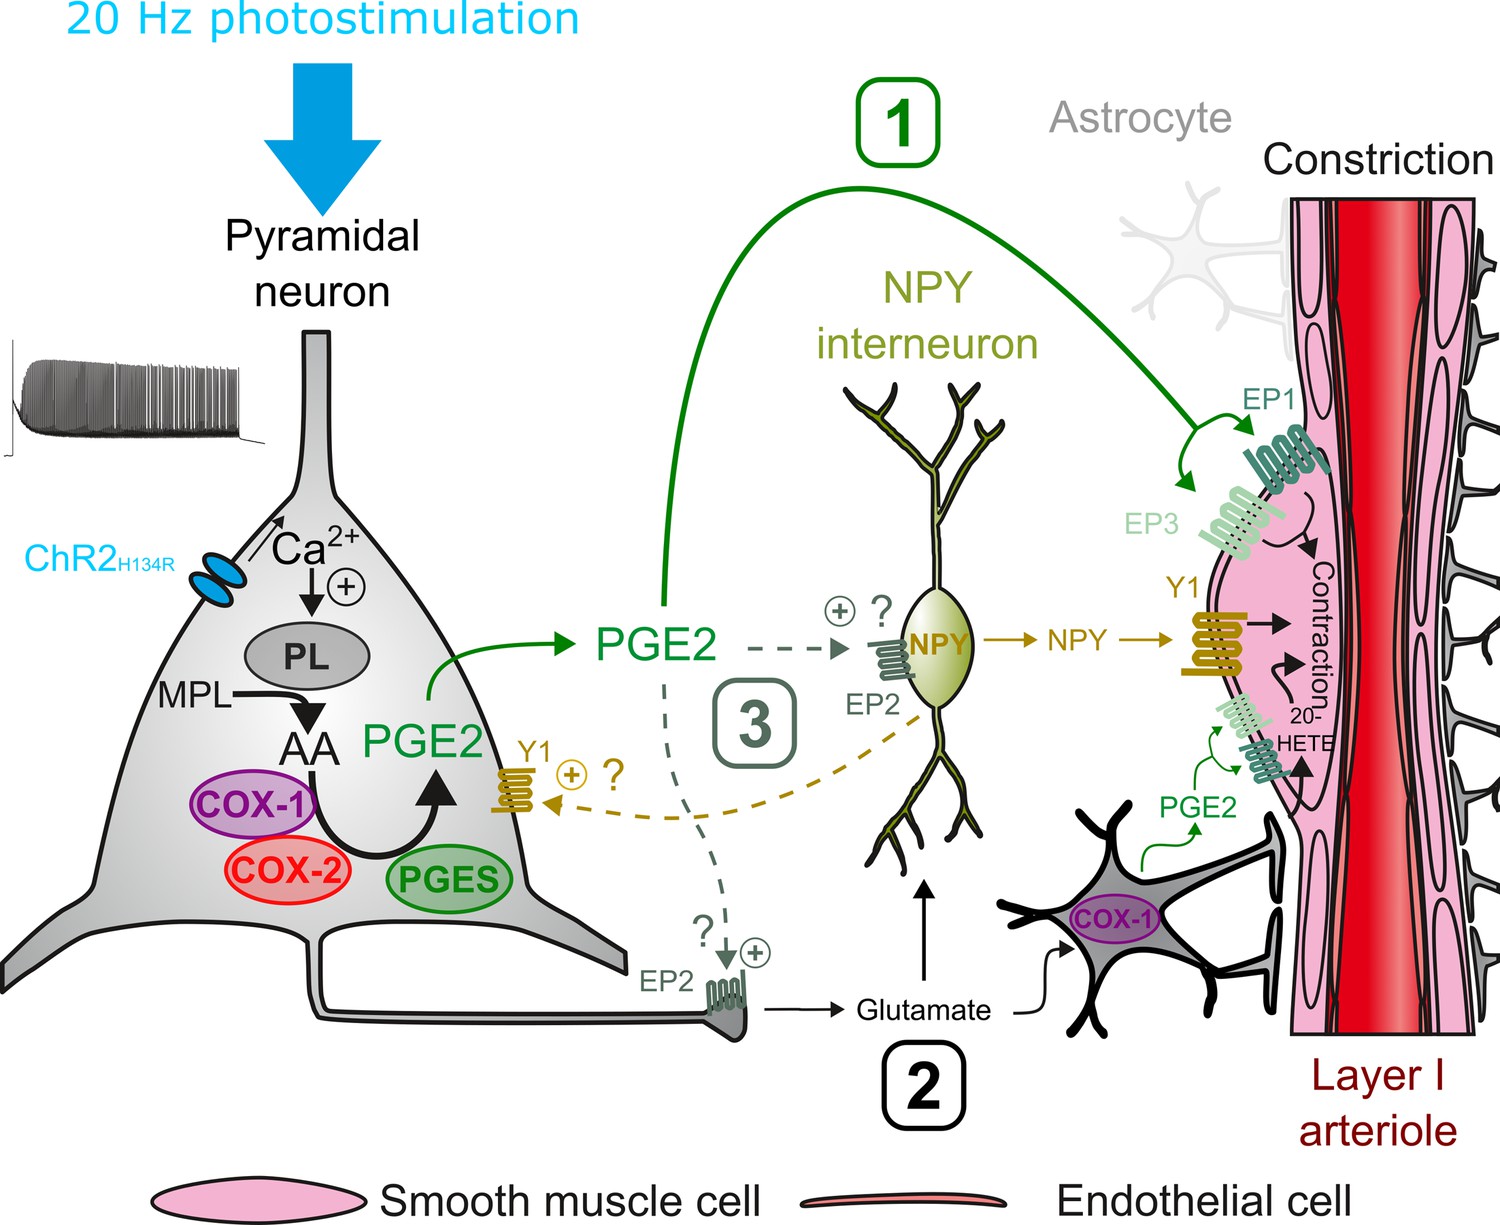
Possible pathways of vasoconstriction induced by pyramidal neurons.
20 Hz photostimulation induces activation of pyramidal neurons expressing channelrhodopsin-2 (ChR2H134R) and increases intracellular calcium (Ca2+). Arachidonic acid (AA) is released from membrane phospholipids (MPL) by phospholipases (PL) activated by intracellular Ca2+ and is metabolized by type-1 and type-2 cyclooxygenases (COX-1 and COX-2) and prostaglandin E2 synthases (PGES) to produce prostaglandin E2 (PGE2). Three non-exclusive pathways can be proposed for arteriolar vasoconstriction in layer I: (1) PGE2 released into the extracellular space may act directly on arteriolar EP1 and EP3 receptors to induce smooth muscle cell constriction. (2) Glutamate released from pyramidal cells may activate neuropeptide Y (NPY) interneurons and NPY is released to act on vascular and neuronal Y1 receptors to constrict smooth muscle cells and promote glutamate release, respectively. Glutamate can also activate astrocytes to induce constriction through the 20-HETE and the COX-1/PGE2 pathways. (3) PGE2 may act on pre- and postsynaptic EP2 receptors to facilitate glutamate release and NPY interneuron activation, respectively.
Author response image 1

Example of a pial arteriole filled with fluorescein dextran (cyan) in an Emx1-EYFP mouse (parenchyma labeled with YFP, in cyan).
The red line represents a line-scan to record the change in diameter. Due to the perivascular space surrounding the arterioles, the vessel walls are clearly identified and separated from the fluorescent parenchyma.
Author response image 2

Optogenetic stimulation in a wild-type mouse.
A. No diameter changes upon stimulations of 10 seconds, 10 Hz, 1 mW, 5 ms pulses, i.e. the conditions we used for the experiments in Emx1 mice. B. Stimulation of higher power (4 mW), longer duration (20 ms pulses) and at a higher frequency elicited a small dilation in 1 (grey traces) of 2 pial arterioles.
Tables
Table 1
Morphological and physiological properties, and neurovascular responses of diving arterioles used in the analysis of the frequency-dependence of the polarity of neurovascular response evoked by pyramidal cells.
| Frequency | 1 Hz | 2 Hz | 5 Hz | 10 Hz | 20 Hz |
|---|---|---|---|---|---|
| Number of arterioles | n=4 | n=10 | n=6 | n=5 | n=10 |
| Resting stability (%) | 1.2±0.2 | 1.6±0.2 | 1.6±0.2 | 1.3±0.2 | 1.0±0.1 |
| F (4, 30)=2.161 p=0.098 | |||||
| n.s. | |||||
| Wall thickness (µm) | 3.6±0.8 | 3.8±0.3 | 3.2±0.5 | 4.1±0.8 | 4.0±0.2 |
| F (4, 30)=0.656 p=0.627 | |||||
| n.s. | |||||
| Area under the curve after photostimulation (AUC; x103 %.s) | 0.5±0.2 | 0.0±0.5 | 0.2±1 | –1.7±1.1 | –3.7±0.7 |
| F (4, 30)=6.135 p=0.00099 | |||||
| *** | |||||
| Maximal dΔT/dt (%.s–1) | 0.19±0.09 | 0.64±0.14 | 0.22±0.04 | 0.43±0.19 | 0.8±0.11 |
| All <2 %.s–1 | |||||
-
Data are mean ± SEM, one-way ANOVA F test and corresponding exact p-value. n.s., not statistically different and ***: p<0.001.
-
Table 1—source data 1
Properties of individual arterioles used for Table 1.
- https://cdn.elifesciences.org/articles/102424/elife-102424-table1-data1-v1.xlsx
Table 2
Electrophysiological properties of pyramidal cells recorded during single-cell RT-PCR experiments.
| COXs-negative(n=7) | COX-1 positive(n=4) | COX-2 positive(n=5) | |
|---|---|---|---|
| Passive properties | |||
| Resting potential (mV) | –82.0±2.2 | –84.7±4.2 | –82.0±6.1 |
| Input resistance (MΩ) | 329±53.7 | 360.8±63.7 | 314.2±79.7 |
| Time constant (ms) | 50.7±6.4 | 47.3±7.2 | 47.74±10.1 |
| Membrane capacitance (pF) | 161.4±14.7 | 133.2±7.8 | 159.4±23.0 |
| Sag index (%) | 11.3±3.8 | 6.7±1.1 | 6.9±1.8 |
| Just above threshold properties | |||
| Rheobase (pA) | 52.7±8.7 | 51.7±15.5 | 62.3±18.2 |
| First spike latency (ms) | 295.2±50.8 | 271.6±62.9 | 178.7±55.6 |
| Adaptation (Hz/s) | –3.1±0.9 | –2.6±0.3 | –3.3±1.3 |
| Minimal frequency (Hz) | 5.5±0.7 | 4.6±0.4 | 6.3±1.2 |
| Firing properties | |||
| Accommodation (mV) | 16.4±4.6 | 24.8±4.9 | 11.9±3.7 |
| Amplitude of early adaptation (Hz) | 62.1±13.3 | 89.8±8.5 | 62.3±16.4 |
| Time constant of early adaptation (ms) | 29.7±4.4 | 28.3±2.2 | 43.1±18.7 |
| Late adaptation (Hz/s) | –11.6±2.3 | –9.6±3.9 | –10.7±1.7 |
| Maximal frequency (Hz) | 23.4±1.7 | 27.6±3.3 | 22.0±2.9 |
| Action potentials properties | |||
| 1st spike amplitude (mV) | 94.8±1.7 | 93.0±5.0 | 88.6±1.9 |
| 1st spike duration (ms) | 1.8±0.1 | 1.9±0.1 | 1.8±0.1 |
| 2nd spike amplitude (mV) | 91.6±1.9 | 91.9±4.5 | 85.5±2.5 |
| 2nd spike duration (ms) | 1.9±0.1 | 1.9±0.1 | 1.9±0.1 |
| Amplitude Reduction (%) | 3.4±0.4 | 1.1±0.7 | 3.6±1.4 |
| Duration Increase (%) | 5.3±0.9 | 3.8±1.5 | 7.5±1.6 |
| AHP and ADP properties | |||
| 1st spike fast AHP (mV) | –8.7±0.8 | –8.7±0.6 | –7.9±1.1 |
| 1st spike ADP (mV) | 0.2±0.1 | 0.2±0.2 | 0±0 |
| 1st spike medium AHP (mV) | –13.8±1.4 | –15.5±0.6 | –13.7±0.8 |
| 1st spike fast AHP latency (ms) | 8.2±1.0 | 7.7±1.4 | 9.8±1.5 |
| 1st spike ADP latency (ms) | 4.6±2.2 | 2.0±2.0 | 0±0 |
| 1st spike, medium AHP latency (ms) | 49.2±3.3 | 48.2±5.4 | 54.8±6.1 |
| 2nd spike fast AHP (mV) | –9.8±1.1 | –8.5±0.5 | –9.6±1.0 |
| 2nd spike ADP (mV) | 0±0 | 0.1±0.1 | 0±0 |
| 2nd spike medium AHP (mV) | –16.1±1.2 | –17.1±0.6 | –15.8±0.4 |
| 2nd spike, fast AHP latency (ms) | 8.6±0.9 | 7.1±0.7 | 11.7±1.3 |
| F (2.13)=4.063 p=0.0426 | |||
| * | |||
| No significant difference in multiple comparisons. | |||
| 2nd spike ADP latency (ms) | 1.2±1.2 | 1.7±1.7 | 0±0 |
| 2nd spike, medium AHP latency (ms) | 57.1±5.8 | 51.9±4.6 | 58.3±6.7 |
-
Data are presented as mean ± SEM. Statistical analyses were performed using a one-way ANOVA (F test) or a Kruskal-Wallis test, depending on the result of the Shapiro-Wilk normality test. If a significant result was found, the corresponding statistics are reported, and post-hoc multiple comparisons are performed.
-
Table 2—source data 1
Electrophysiological and molecular properties of pyramidal cells used for Table 2.
- https://cdn.elifesciences.org/articles/102424/elife-102424-table2-data1-v1.xlsx
Table 3
IC50 and concentrations of inhibitors, blocker and antagonists used in tissue.
| Concentrations used for inhibition/antagonism | ||||
|---|---|---|---|---|
| Inhibitor/antagonist | In vitro IC50 | Preparation | Concentration | |
| Indomethacin | COX-1: 22 nM; Lora et al., 1998 | COX-2: 87 nM | Mouse brain slices; Lacroix et al., 2015 | 5 µM |
| SC560 | COX-1: 9 nM; Smith et al., 1998 | COX-2: 6.3 µM | Mouse brain slices; Lacroix et al., 2015 | 100 nM |
| NS-398 | COX-1: 50 µM; Lora et al., 1998 | COX-2: 0.6 µM | Mouse brain slices; Lacroix et al., 2015 | 10 µM |
| ONO-8130 | EP1 receptors: 9.3 nM; Säfholm et al., 2013a | isolated guinea pig trachea; Säfholm et al., 2013b | 10 nM | |
| L798,106 | EP3 receptors: 0.3 nM (Ki); Juteau et al., 2001 | Isolated mouse mesenteric arteries; Chia et al., 2011 | 1 µM | |
| AL8810 | FP receptors: 426 nM (Ki); Griffin et al., 1999 | Isolated porcine retinal arterioles; Oversø Hansen et al., 2015 | 10 µM | |
| Paxilline | BK channels: 97 nM; Tammaro et al., 2004 | Mouse brain slices; Girouard et al., 2010 | 1 µM | |
| HET-0016 | CYP4A isoforms: 35 nM; Miyata et al., 2001 | Mouse brain slices; Blanco et al., 2008 | 100 nM | |
| BIBP3226 | Y1 receptors: 26 nM; Rudolf et al., 1994 | Mouse brain slices; Sun et al., 2003 | 1 µM | |
Appendix 1—key resources table
| Reagent type (species) or resource | Designation | Source or reference | Identifiers | Additional information |
|---|---|---|---|---|
| Strain, strain background (Mus musculus, male and female) | C57BL/6RJ, Wild type | Janvier Labs | C57BL/6RJ | |
| Strain, strain background (Mus musculus, male and female) | B6.129P2- Emx1tm1(cre)Krj/J, Emx1 Cre/Cre | PMID:12151506; Gorski et al., 2002 | RRID:IMSR_JAX:005628 | |
| Strain, strain background (Mus musculus, male and female) | B6.129P2- Gt(ROSA)26Sortm32(CAG-COP4*H134R/EYFP)Hze, Gt(ROSA)26Sor ChR2(H134R)-EYFP/ ChR2(H134R)-EYFP | PMID:22446880; Madisen et al., 2012 | RRID:IMSR_JAX:024109 | |
| Sequence-based reagent | Slc17a7 external sense PCR primer (vGluT1) | PMID:23565079; Cabezas et al., 2013 | GGCTCCTTTTTCTGGGGCTAC | |
| Sequence-based reagent | Slc17a7 external antisense PCR primer (vGluT1) | PMID:23565079; Cabezas et al., 2013 | CCAGCCGACTCCGTTCTAAG | |
| Sequence-based reagent | Slc17a7 internal sense PCR primer (vGluT1) | PMID:23565079; Cabezas et al., 2013 | ATTCGCAGCCAACAGGGTCT | |
| Sequence-based reagent | Slc17a7 internal antisense PCR primer (vGluT1) | PMID:23565079; Cabezas et al., 2013 | TGGCAAGCAGGGTATGTGAC | |
| Sequence-based reagent | Gad2 external sense PCR primer (GAD 65) | PMID:19295167; Karagiannis et al., 2009 | CCAAAAGTTCACGGGCGG | |
| Sequence-based reagent | Gad2 external antisense PCR primer (GAD 65) | PMID:19295167; Karagiannis et al., 2009 | TCCTCCAGATTTTGCGGTTG | |
| Sequence-based reagent | Gad2 internal sense PCR primer (GAD 65) | PMID:22754499; Perrenoud et al., 2012 | CACCTGCGACCAAAAACCCT | |
| Sequence-based reagent | Gad2 internal antisense PCR primer (GAD 65) | PMID:22754499; Perrenoud et al., 2012 | GATTTTGCGGTTGGTCTGCC | |
| Sequence-based reagent | Gad1 external sense PCR primer (GAD 67) | PMID:12196560; Férézou et al., 2002 | TACGGGGTTCGCACAGGTC | |
| Sequence-based reagent | Gad1 external antisense PCR primer (GAD 67) | PMID:12196560; Cabezas et al., 2013 | CCCAGGCAGCATCCACAT | |
| Sequence-based reagent | Gad1 internal sense PCR primer (GAD 67) | PMID:23565079; Cabezas et al., 2013 | CCCAGAAGTGAAGACAAAAGGC | |
| Sequence-based reagent | Gad1 internal antisense PCR primer (GAD 67) | PMID:23565079; Cabezas et al., 2013 | AATGCTCCGTAAACAGTCGTGC | |
| Sequence-based reagent | Ptgs1 external sense PCR primer (COX-1) | This paper | ATCCCTGTTGTTACTATCCGTGC | |
| Sequence-based reagent | Ptgs1 external antisense PCR primer (COX-1) | This paper | TGTGGGGCAGTCTTTGGGTA | |
| Sequence-based reagent | Ptgs1 internal sense PCR primer (COX-1) | This paper | AGGGTGTCTGTGTCCGCTTT | |
| Sequence-based reagent | Ptgs1 internal antisense PCR primer (COX-1) | This paper | GGCTGGGGATAAGGTTGGAC | |
| Sequence-based reagent | Ptgs2 external sense PCR primer (COX-2) | PMID:21734275; Lecrux et al., 2011 | CTGAAGCCCACCCCAAACAC | |
| Sequence-based reagent | Ptgs2 external antisense PCR primer (COX-2) | PMID:29985318; Devienne et al., 2018 | CCTTATTTCCCTTCACACCCAT | |
| Sequence-based reagent | Ptgs2 internal sense PCR primer (COX-2) | PMID:29985318; Devienne et al., 2018 | AACAACATCCCCTTCCTGCG | |
| Sequence-based reagent | Ptgs2 internal antisense PCR primer (COX-2) | PMID:29985318; Devienne et al., 2018 | TGGGAGTTGGGCAGTCATCT | |
| Sequence-based reagent | Ptges external sense PCR primer (mPGES1) | This paper | GCCTGGTGATGGAGAGCG | |
| Sequence-based reagent | Ptges external antisense PCR primer (mPGES1) | This paper | GGAGCGAAGGCGTGGGTT | |
| Sequence-based reagent | Ptges internal sense PCR primer (mPGES1) | This paper | AGATGAGGCTGCGGAAGAAG | |
| Sequence-based reagent | Ptges internal antisense PCR primer (mPGES1) | This paper | CACGAAGCCGAGGAAGAGGA | |
| Sequence-based reagent | Ptges2 external sense PCR primer (mPGES1) | This paper | CGACTTCCACTCCCTGCC | |
| Sequence-based reagent | Ptges2 external antisense PCR primer (mPGES2) | This paper | CATCTCCTCCGTCCTGGCTT | |
| Sequence-based reagent | Ptges2 internal sense PCR primer (mPGES2) | This paper | GAGGTGAATCCCGTGAGAAGG | |
| Sequence-based reagent | Ptges2 internal antisense PCR primer (mPGES2) | This paper | TTCCTTCCCGCCATACATCT | |
| Sequence-based reagent | Ptges3 external sense PCR primer (cPGES) | This paper | TCCAAGCATAAAAGAACAGACAGA | |
| Sequence-based reagent | Ptges3 external antisense PCR primer (cPGES) | This paper | TGGCATCTTTTCATCATCACTGTC | |
| Sequence-based reagent | Ptges3 internal sense PCR primer (cPGES) | This paper | TAACAAAGGAAAGGGCAAAGC | |
| Sequence-based reagent | Ptges3 internal antisense PCR primer (cPGES) | This paper | CATCATCTGCTCCATCTACTTCTG | |
| Sequence-based reagent | Prxl2b external sense PCR primer (PM-PGFS) | This paper | AGGAGTTTCTGGATGGTGGTTAC | |
| Sequence-based reagent | Prxl2b external antisense PCR primer (PM-PGFS) | This paper | CACCTCCCACACACCTCTTCAT | |
| Sequence-based reagent | Prxl2b internal sense PCR primer (PM-PGFS) | This paper | ACCTGTTCGTGATGTAGCCTCC | |
| Sequence-based reagent | Prxl2b internal antisense PCR primer (PM-PGFS) | This paper | CTGGGGTGGCTTGCTGGA | |
| Sequence-based reagent | Akr1b1 external sense PCR primer (Akr1b3) | This paper | CAGAATGAGAAGGAGGTGGGA | |
| Sequence-based reagent | Akr1b1 external antisense PCR primer (Akr1b3) | This paper | TTGAAGTTGGAGACACCGATTG | |
| Sequence-based reagent | Akr1b1 internal sense PCR primer (Akr1b3) | This paper | CAAGGAGCAGGTGGTGAAGC | |
| Sequence-based reagent | Akr1b1 internal antisense PCR primer (Akr1b3) | This paper | CATAGCCGTCCAAGTGTCCA | |
| Sequence-based reagent | Cbr1 external sense PCR primer (CBR1) | This paper | AACCCGCAGAGCATTCGC | |
| Sequence-based reagent | Cbr1 external antisense PCR primer (CBR1) | This paper | GCCAACCTTCTTCCGCAT | |
| Sequence-based reagent | Cbr1 internal sense PCR primer (CBR1) | This paper | CAATGACGACACCCCCTTCC | |
| Sequence-based reagent | Cbr1 internal antisense PCR primer (CBR1) | This paper | CTCCTCTGTGATGGTCTCGCTT | |
| Chemical compound, drug | Rhod-2 | Cayman chemical | 20777 | |
| Chemical compound, drug | 9,11-dideoxy-9α,11α-methanoepoxy prostaglandin F2α | Enzo | BML-PG023 | |
| Chemical compound, drug | Tetrodotoxin | Latoxan | L8503 | |
| Chemical compound, drug | D-(-)–2-amino-5-phosphonopentanoic acid | Hello Bio | HB0225 | |
| Chemical compound, drug | 6,7-dinitroquinoxaline-2,3-dione | Hello Bio | HB0262 | |
| Chemical compound, drug | LY367385 | Hello Bio | HB0398 | |
| Chemical compound, drug | 2-methyl-6-(phenylethynyl)pyridine | Hello Bio | HB0426 | |
| Chemical compound, drug | Indomethacin | Sigma-Aldrich | I7378 | |
| Chemical compound, drug | SC-560 | Sigma-Aldrich | S2064 | |
| Chemical compound, drug | NS-398 | Enzo | BML-EI261 | |
| Chemical compound, drug | ONO-8130 | Tocris | 5406 | |
| Chemical compound, drug | L-798,106 | Cayman chemical | 11129 | |
| Chemical compound, drug | AL8810 | Cayman chemical | 16735 | |
| Chemical compound, drug | PGE2 | Hello Bio | HB3460 | |
| Chemical compound, drug | Sulprostone | Cayman chemical | 14765 | |
| Chemical compound, drug | BIBP3226 | Tocris | 2707 | |
| Chemical compound, drug | HET0016 | Merck | SML2416 | |
| Chemical compound, drug | paxilline | Tocris | 2006 | |
| Chemical compound, drug | Dithiothreitol | VWR | 443852 A | |
| Chemical compound, drug | Primer "random" | Roche | 11034731001 | |
| Chemical compound, drug | dNTPs | GE Healthcare Life Sciences | 28-4065-52 | |
| Chemical compound, drug | Mineral Oil | Sigma-Aldrich | M5904 | |
| Chemical compound, drug | RNasin Ribonuclease Inhibitors | Promega | N2511 | |
| Chemical compound, drug | SuperScript II Reverse Transcriptase | Invitrogen | 18064014 | |
| Chemical compound, drug | Taq DNA Polymerase | Qiagen | 201205 | |
| Software, algorithm | Pclamp v 10.2 | Molecular Devices | RRID:SCR_011323 | |
| Software, algorithm | Matlab v 2018b | MathWorks | RRID:SCR_001622 | |
| Software, algorithm | GraphPad Prism v 7 | GraphPad | RRID:SCR_002798 | |
| Software, algorithm | ImagingWorkbench v 6.1 | INDEC Systems | ||
| Software, algorithm | FIJI | PMID:22743772; Schindelin et al., 2012 | RRID:SCR_002285 | |
| Software, algorithm | R v 4.3.0 | R Core Team | RRID:SCR_001905 | |
| Other | Vibratome | Leica | VT1000S RRID:SCR_016495 | |
| Other | Upright microscope | Olympus | BX51WI | |
| Other | Dual port module | Olympus | WI-DPMC | |
| Other | 60 x Objective | Olympus | LUMPlan Fl /IR 60 x/0.90 W | |
| Other | 40 x Objetive | Olympus | LUMPlan Fl /IR 40 x/0.80 W | |
| Other | sCMOS camera | Hamamatsu | ORCA-Flash4.0 | |
| Other | Axopatch 200B | Molecular Devices | RRID:SCR_018866 | |
| Other | Digidata 1440 A | Molecular Devices | RRID:SCR_021038 | |
| Other | S900 stimulator | Dagan corporation | ||
| Other | pE-2 | CoolLED | ||
| Other | Excitation filter | Semrock | HC 392/474/554/635 | |
| Other | Dichroic mirror | Semrock | BS 409/493/573/652 | |
| Other | Emission filter | Semrock | HC 432/515/595/730 | |
| Other | 780 nm Collimated LED | Thorlabs | M780L3-C1 | |
| Other | Dodt Gradient Contrast | Luigs and Neumann | 200–100 200 0155 | |
| Other | Beam splitter | Semrock | 725 DCSPXR | |
| Other | Analogic CCD camera | Sony | XC ST-70 CE |
Additional files
-
MDAR checklist
- https://cdn.elifesciences.org/articles/102424/elife-102424-mdarchecklist1-v1.pdf
-
Source code 1
Matlab script for blood vessel analysis.
The method has been described in Lacroix et al., 2015.
- https://cdn.elifesciences.org/articles/102424/elife-102424-code1-v1.zip
Download links
A two-part list of links to download the article, or parts of the article, in various formats.
Downloads (link to download the article as PDF)
Open citations (links to open the citations from this article in various online reference manager services)
Cite this article (links to download the citations from this article in formats compatible with various reference manager tools)
Elevated pyramidal cell firing orchestrates arteriolar vasoconstriction through COX-2-derived prostaglandin E2 signaling
eLife 13:RP102424.
https://doi.org/10.7554/eLife.102424.3


