Auditory cortex learns to discriminate audiovisual cues through selective multisensory enhancement
- Key Laboratory of Brain Functional Genomics (Ministry of Education and Shanghai), School of Life Sciences, East China Normal University, China
- College of Information Engineering, Hangzhou Vocational and Technical College, China
- Department of Biomedical Sciences, Kentucky College of Osteopathic Medicine, University of Pikeville, United States
Figures
Figure 1
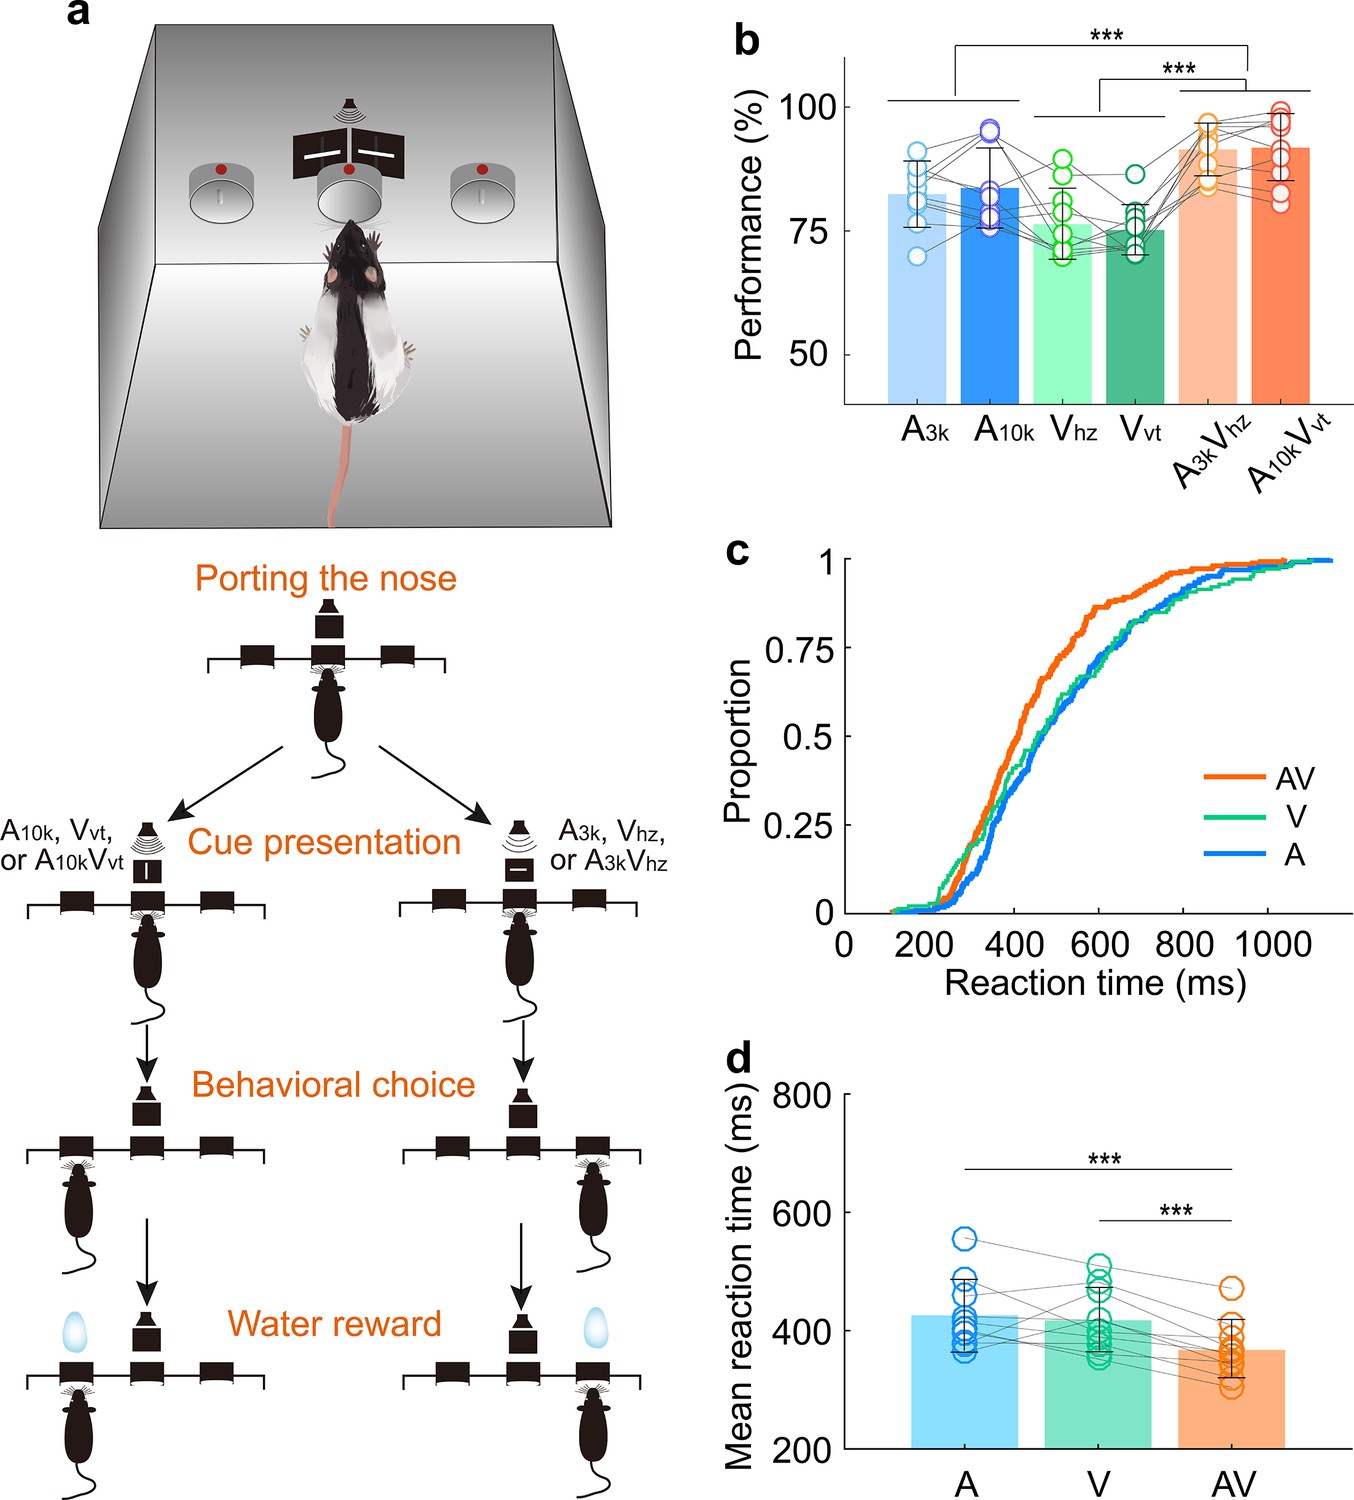
Multisensory discrimination task for rats.
(a) Schematic illustration of the behavioral task. A randomly selected stimulus was triggered when a rat placed its nose in the central port. If the triggered stimulus was a 10 kHz pure tone (A10k), a vertical light bar (Vvt), or their combination (A10kVvt), the rat was rewarded at the left port. Conversely, for other stimuli (a 3 kHz pure tone (A3k), a horizontal light bar (Vhz), or A3kVhz), the rat was required to move to the right port. Visual stimuli were presented via custom-made LED matrix panels, with one panel for each side. Auditory stimuli were delivered through a centrally located speaker. (b) The mean performance for each stimulus condition across rats. Circles connected by a gray line represent data from one individual rat. (c) Cumulative frequency distribution of reaction time (time from cue onset to leaving the central port) for one representative rat in auditory, visual and multisensory trials (correct only). (d) Comparison of average reaction times across rats in auditory, visual, and multisensory trials (correct only). ***, p<0.001. Error bars represent SDs.
Figure 2 with 4 supplements
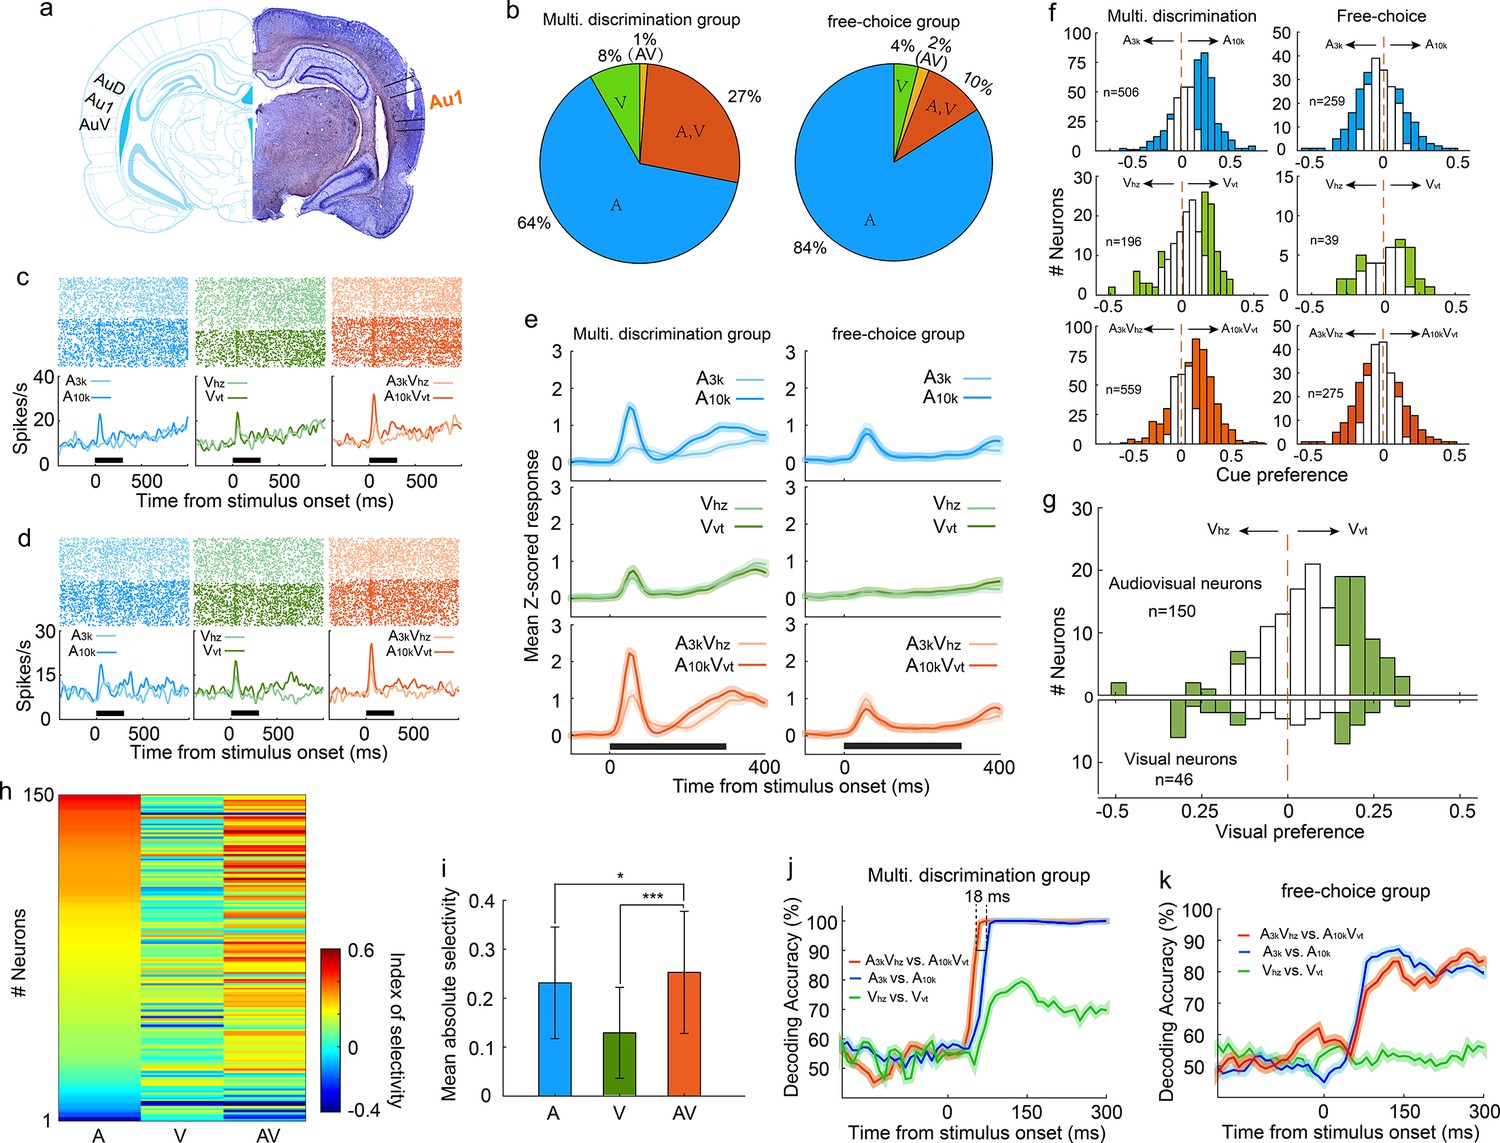
Auditory, visual and multisensory selectivity in task engagement.
(a) Histological verification of recording locations within the primary auditory cortex (Au1). (b) Proportion of neurons categorized based on their responsiveness to auditory-only (A), visual-only (V), both auditory and visual (A, V), or audiovisual-only (AV) stimuli during task engagement. (c–d) Rasters (top) and peristimulus time histograms (PSTHs, bottom) show responses of two exemplar neurons in A3k (light blue), A10k (dark blue), Vhz (light green), Vvt (dark green), A3kVhz (light orange), and A10kVvt (dark orange) trials (correct only). Mean spike counts in PSTHs were computed in 10 ms time windows and then smoothed with a Gaussian kernel (σ=50ms). Black bars indicate the stimulus onset and duration. (e) Mean normalized response PSTHs across neurons in auditory (top), visual (middle), and multisensory (bottom) trials (correct only) for multisensory discrimination (left) and free-choice (right) groups. Shaded areas represent mean ± SEM. Black bars indicate stimulus onset and duration. (f) Histograms of auditory (top), visual (middle) and multisensory (bottom) selectivity for multisensory discrimination (left) and free-choice (right) groups. Filled bars indicate neurons for which the selectivity index was significantly different from 0 (permutation test, p<0.05, bootstrap n=5000). The dash line represents zero. (g) Comparison of visual selectivity distribution between audiovisual (top) and visual (bottom) neurons. (h) Comparison of auditory (A), visual (V), and multisensory (AV) selectivity of 150 audiovisual neurons, ordered by auditory selectivity. (i) Average absolute auditory, visual and multisensory selectivity across 150 audiovisual neurons. Error bars represent SDs. *, p<0.05; ***, p<0.001. (j) Decoding accuracy of populations in the multisensory discrimination group. Decoding accuracy (cross-validation accuracy based on SVM) of populations between responses in two auditory (blue), two visual (green), and two multisensory (red) trials. Each decoding value was calculated in a 100ms temporal window moving at the step of 10ms. Shadowing represents the mean ± SD from bootstrapping of 100 repeats. Two dashed lines represent 90% of decoding accuracy for auditory and multisensory conditions. (k) Decoding accuracy of populations in the free-choice group.
Figure 2—figure supplement 1

Characteristic frequency (CF) and response to target sound stimuli of AC neurons recorded in well-trained rats under anesthesia.
(a) Frequency-intensity tonal receptive fields (TRFs) of three representative AC neurons. The red triangle denotes CF. To create the TRF, we measured responses to a series of pure tone sounds (1–45 kHz in 1 kHz steps) at different intensities (20–60 dB in 10 dB increments). The color bar indicates the range of maximum and minimum spike response counts observed within the TRFs. (b) CF distributions of neurons recorded from two representative rats. (c) Overall distribution of all recorded neurons. (d) Comparison of responses to 3 kHz (A3k) and 10 kHz (A10k) pure tones. Each circle represents one neuron. (e) Comparison of mean response magnitude across populations for A3k and A10k conditions.
Figure 2—figure supplement 2
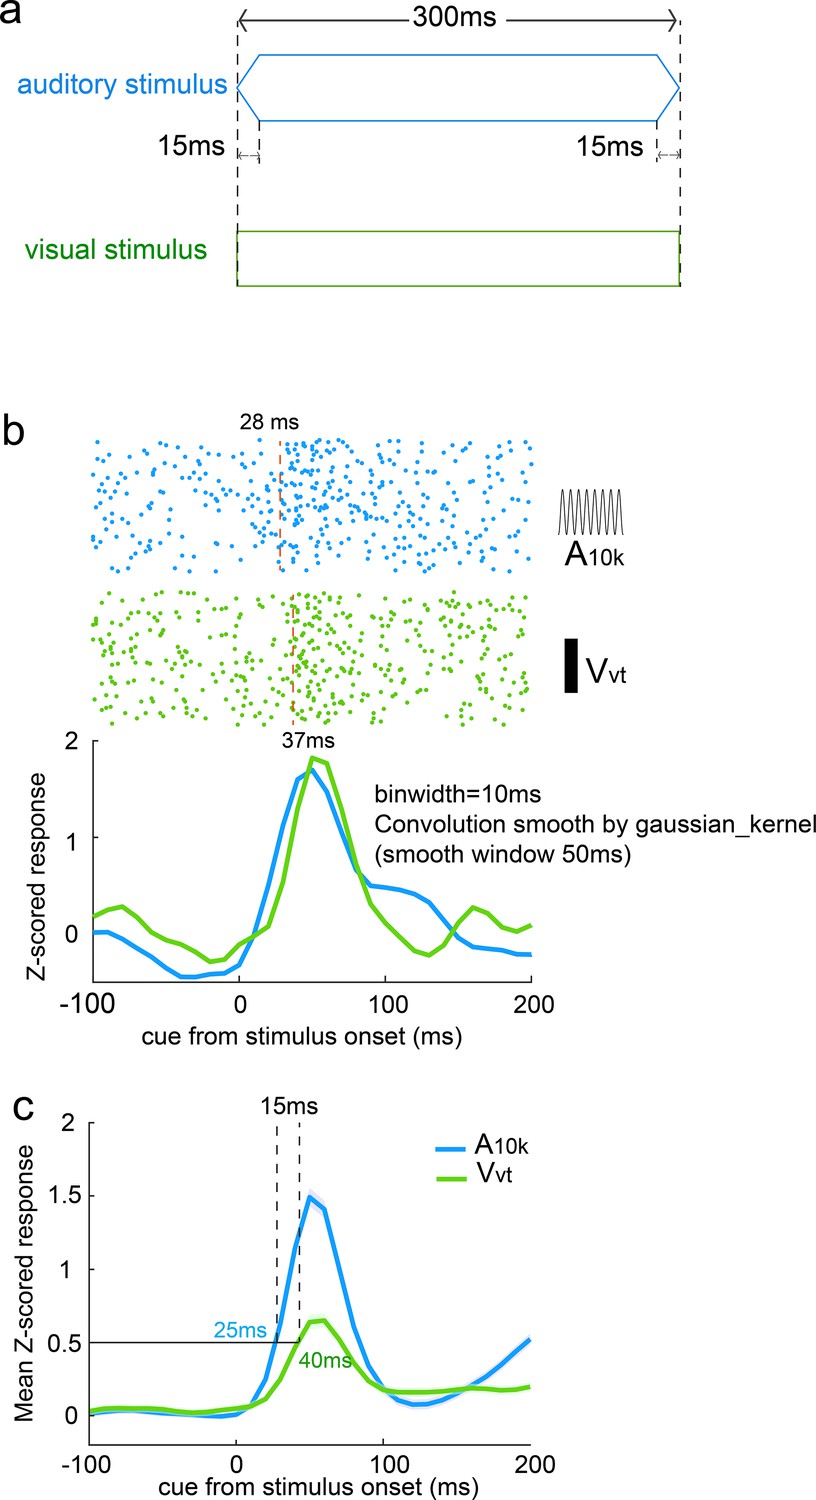
Stimulus-evoked neural responses and latency comparison for auditory and visual stimuli.
(a) Schematic of the auditory and visual stimuli used in the experiment. Auditory stimuli consisted of pure tones with a 15ms ramp and 300ms duration. Visual stimuli, evoked by an LED array, did not include a ramp. (b) Example raster plots and PSTHs for a single neuron (the same neuron as shown in Figure 2c). Auditory responses (blue) began 9ms earlier than visual responses (green). PSTHs were smoothed using a Gaussian kernel (window = 50ms). (c) Population mean Z-scored responses for auditory (blue) and visual (green) stimuli. Auditory responses consistently reached 0.5 of the mean amplitude 15ms earlier than visual responses.
Figure 2—figure supplement 3
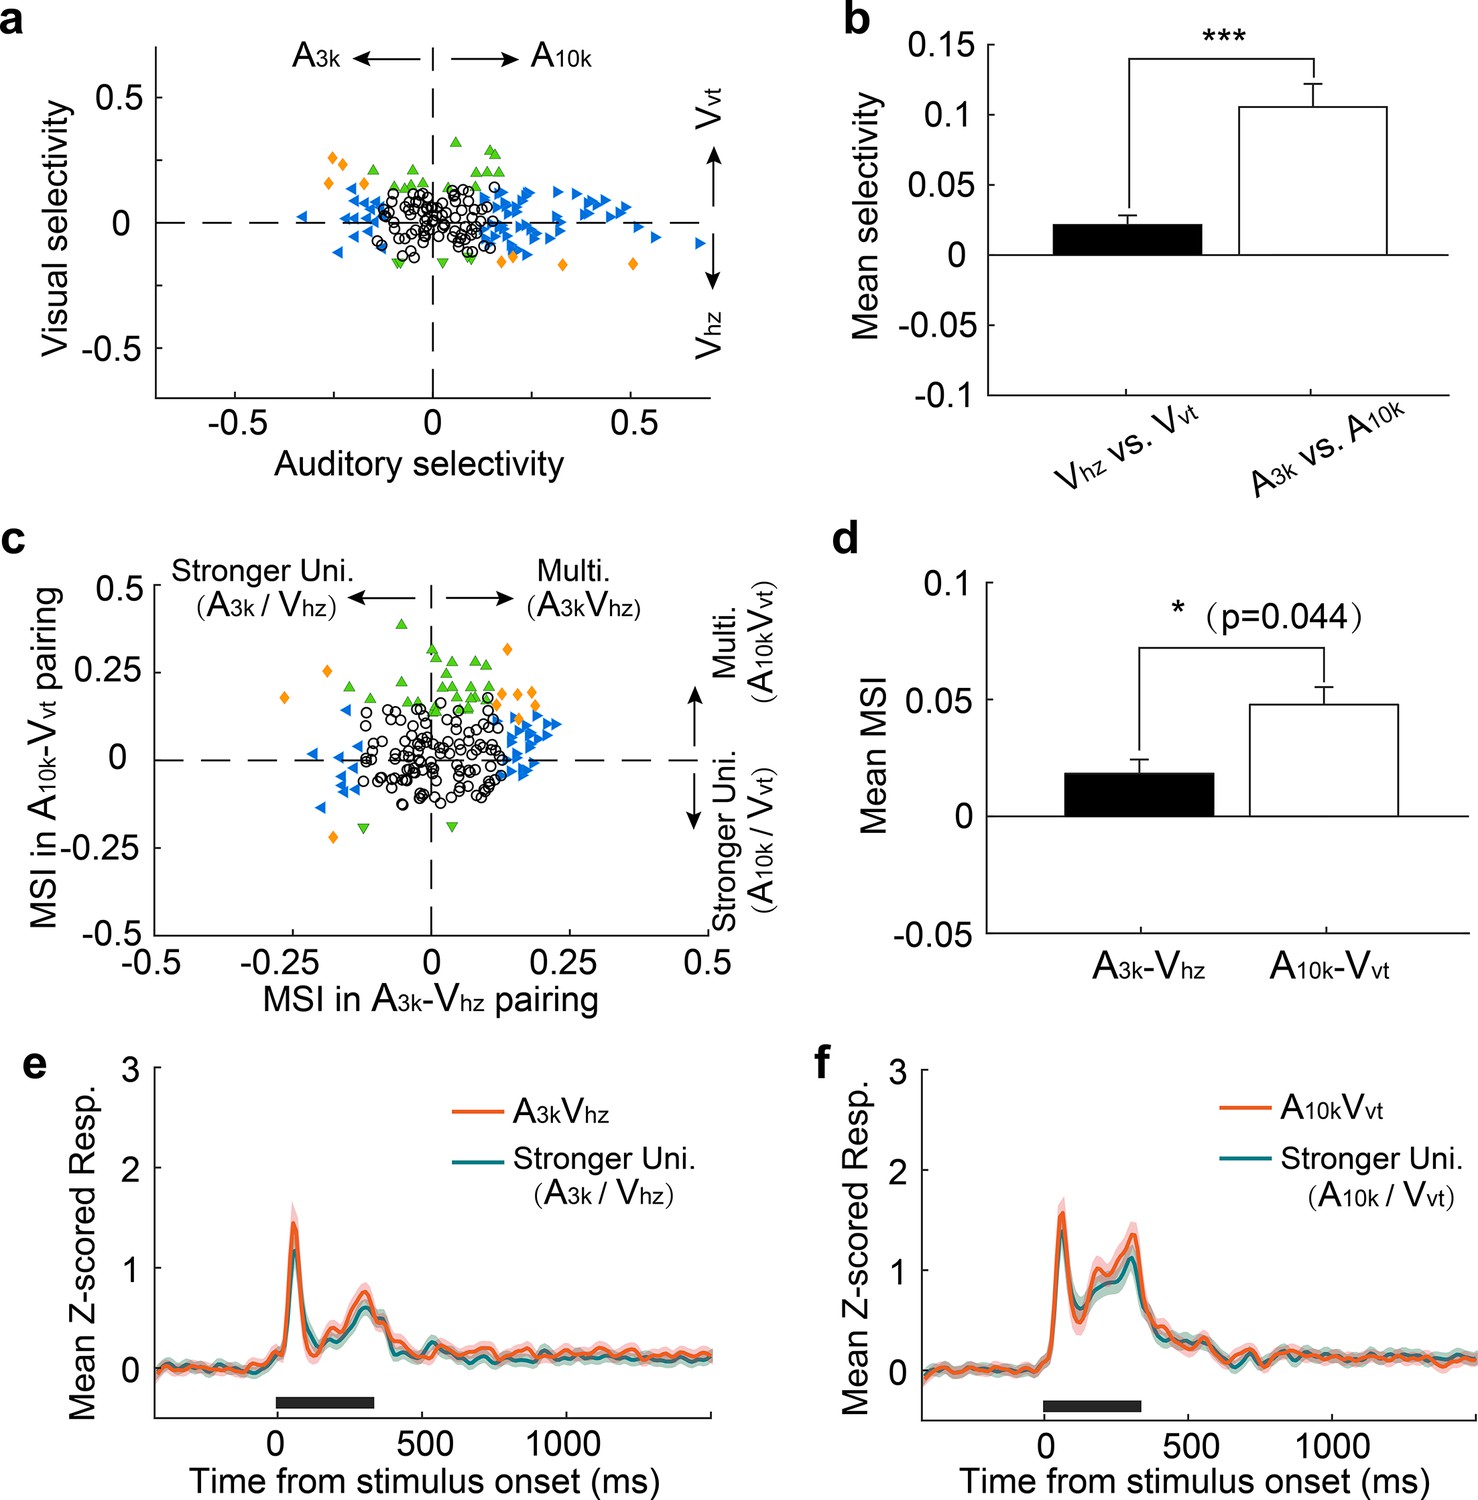
Cue preference and multisensory integration of AC neurons in well-trained rats under anesthesia.
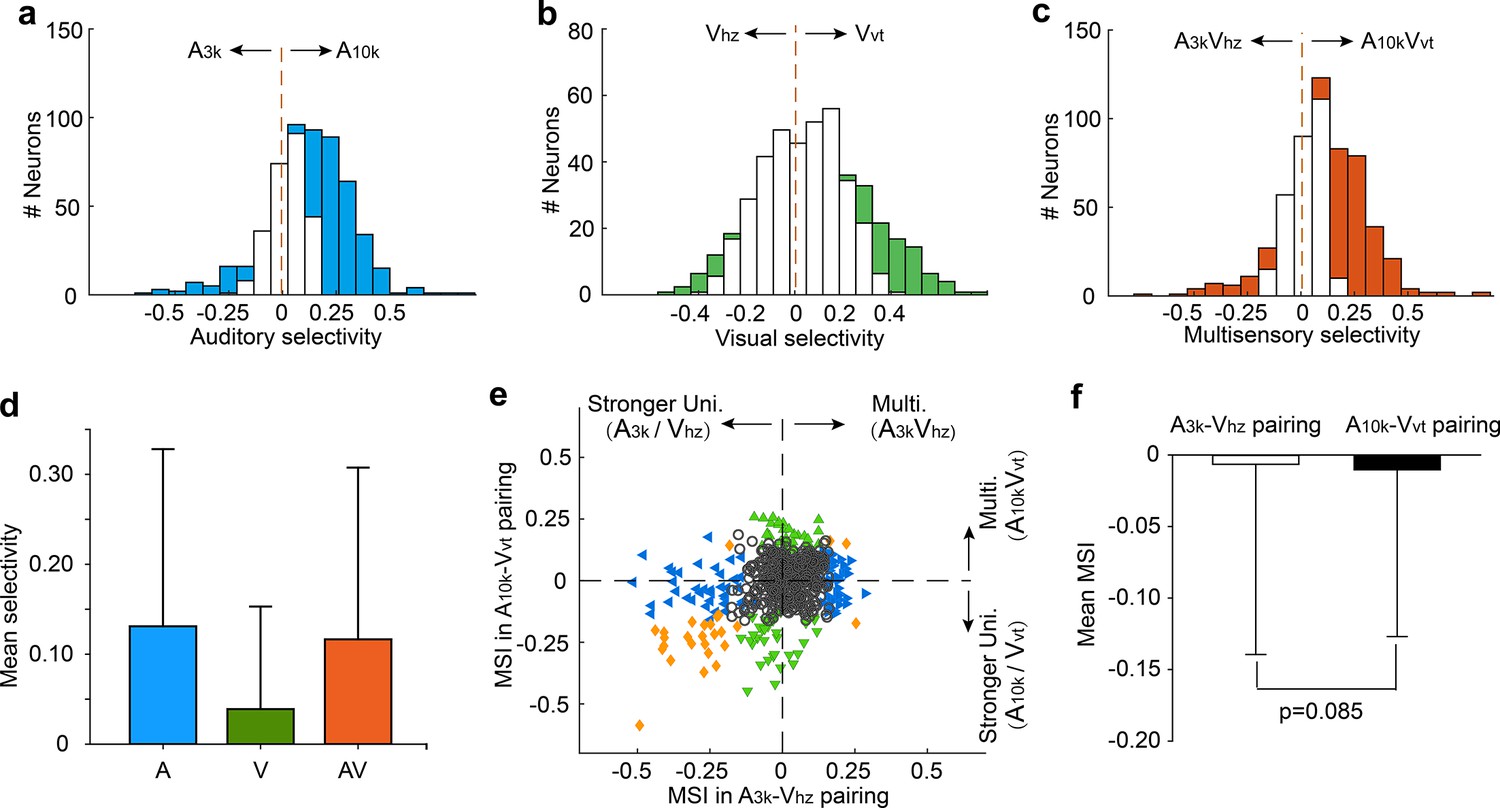
(a) Comparison of auditory and visual selectivity. Each point represents values for a single neuron. Open circles indicate neurons where neither auditory nor visual selectivity was significant (p>0.05, permutation test). Triangles indicate significant selectivity in either auditory (blue) or visual (green) conditions, while diamonds represent significant selectivity in both auditory and visual conditions. Dashed lines represent zero cue selectivity. (b) Mean auditory (filled) and visual (unfilled) selectivity. Error bars represent SEMs. ***, p<0.001. (c) MSI in A3k-Vhz and A10k-Vvt pairings. (d) Mean MSI in A3k-Vhz (unfilled) and A10k-Vvt (filled) pairings. Error bars represent SEMs. (e, f) Comparison of mean multisensory responses (red) with mean corresponding largest unisensory responses (dark blue) across populations for A3k-Vhz (e) and A10k-Vvt (f) pairings. The conventions used are consistent with those in Figures 2 and 3.
Figure 2—figure supplement 4

An auditory cortical neuron exhibiting responsiveness to visual targets in the multisensory discrimination task.
Rasters and PSTHs illustrate the neuron’s responses to auditory (blue), visual (green), and audiovisual (red) target cues. The dashed lines indicate the cue onset (left) and the first spike latency for the visual target (Vhz) response (right). For this neuron, the first spike latency to the Vhz response is 44ms. The inset displays 100 recorded spike waveforms from this neuron (blue) with their average waveform overlaid in black.
Figure 3 with 2 supplements

Auditory and visual integration in the multisensory discrimination task.
(a–c) Rasters and PSTHs showing responses of three typical neurons recorded in well-trained rats performing the multisensory discrimination task. (d) Population-averaged multisensory responses (red) compared to the corresponding stronger unisensory responses (dark blue) in A3kVhz (top) and A10kVvt (bottom) pairings for multisensory discrimination (left) and free-choice (right) groups. (e) Comparison of MSI between A3kVhz (x-axis) and A10kVvt (y-axis) conditions. Each point represents values for a single neuron. Open circles: MSI in either condition was not significant (p>0.05, permutation test); triangles: significant selectivity in either A3k-Vhz (blue) or A10k-Vvt (green) condition; Diamonds: significant selectivity in both conditions. Dashed lines show zero MSI. Points labeled a-c correspond to the neurons in panels a–c. (f) Mean MSI for A10k-Vvt and A3k-Vhz pairings across audiovisual neurons in the multisensory discrimination group. (g) Comparison of MSI for the free-choice group. (h) Mean MSI across audiovisual neurons for the free-choice group. (i) SVM decoding accuracy in AC neurons between responses in multisensory vs. corresponding unisensory trials. Black line indicates shuffled control. (j) Positive relationship between the change in MSI (A10kVvt - A3kVhz) and the change in selectivity (multisensory selectivity - auditory selectivity). (k) Probability density functions of predicted mean multisensory responses (predicted AV) based on 0.83 times the sum of auditory (A) and visual (V) responses (same neuron as in Figure 2c). The observed multisensory response matches the predicted mean (Z-score=–0.17). (l) Frequency distributions of Z-scores. Open bars indicate no significant difference between actual and predicted multisensory responses. Red bars: Z-scores ≥ 1.96; blue bars: Z-scores ≤ −1.96.
Figure 3—figure supplement 1
Cue selectivity and multisensory integration in the late period (151–300ms) after cue onset.
(a–c) Auditory (a), visual (b), and multisensory (c) selectivity during the late period (151–300ms) after cue onset. Filled bars indicate neurons with a selectivity index significantly different from 0 (permutation test, p<0.05, bootstrap n=5000). The dashed line represents zero. (d) Comparison of mean selectivity indices for auditory (blue), visual (green), and multisensory (red) conditions. Error bars represent standard deviations (SD). (e) MSI for A3k-Vhz (x-axis) and A10k-Vvt (y-axis) conditions. (f) Mean MSI for A3k-Vhz (unfilled bars) and A10k-Vvt (filled bars) conditions. Error bar represent SD of then mean.
Figure 3—figure supplement 2

The observed versus the predicted multisensory response.
(a) Probability density functions of the predicted mean multisensory responses (predicted AV) based on summing the modality-specific visual (V) and auditory (A) responses (see Materials and methods for details). Black arrow, the mean of the predicted distribution. The same neuron is shown in Figure 2B and only responses in correct contralateral choice trials are involved. The predicted mean, actual mean observed, and their difference expressed in SDs (Z-score) are shown. (b) Frequency distributions of Z-scores. Open bars represent Z-scores between –1.96 and 1.96, indicating that the actual observed multisensory response is not significantly different from the predicted multisensory response (additive integration). Red bars, Z-score ≥ 1.96 (superadditive integration); blue bars, Z-score ≤ −1.96 (subadditive integration). (c) Comparison between the mean predicted multisensory response and the actual observed multisensory response for all audiovisual neurons. Note that the predicted multisensory response is greater than the observed in most cases. Red squares and blue diamonds represent neurons with observed multisensory responses that are significantly greater (red squares) or less (blue diamonds) than the predicted mean multisensory responses.
Figure 4 with 1 supplement
Impact of choice selection on audiovisual Integration.
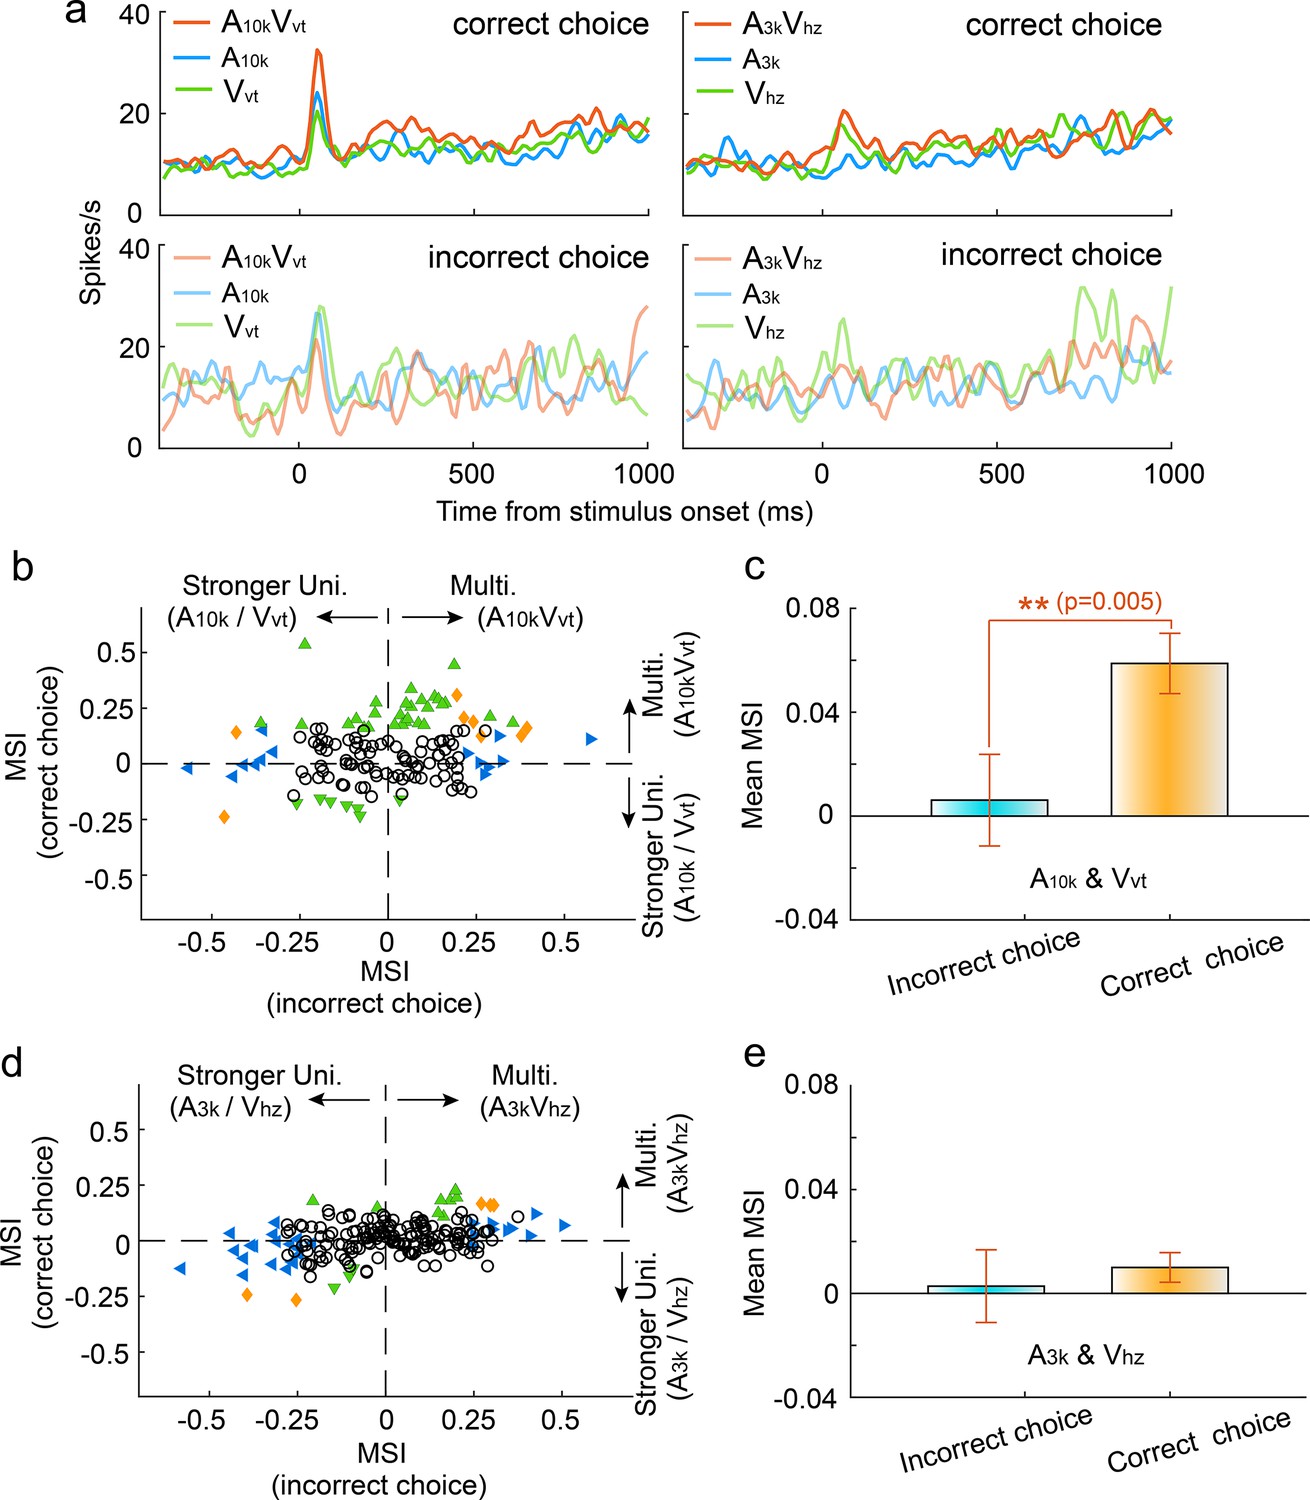
(a) PSTHs show mean responses of an exemplar neuron for different cue and choice trials. (b) Mean MSI across neurons for correct (orange) and incorrect (blue) choices in the A10k-Vvt pairing. (c) Comparison of MSI between correct and incorrect choices for the A10k-Vvt pairing. Error bars, SEM. (d, e) Similar comparisons of MSI for correct and incorrect choices in the A3k-Vhz pairing.
Figure 4—figure supplement 1
Comparison of cue selectivity between correct and incorrect choice conditions.
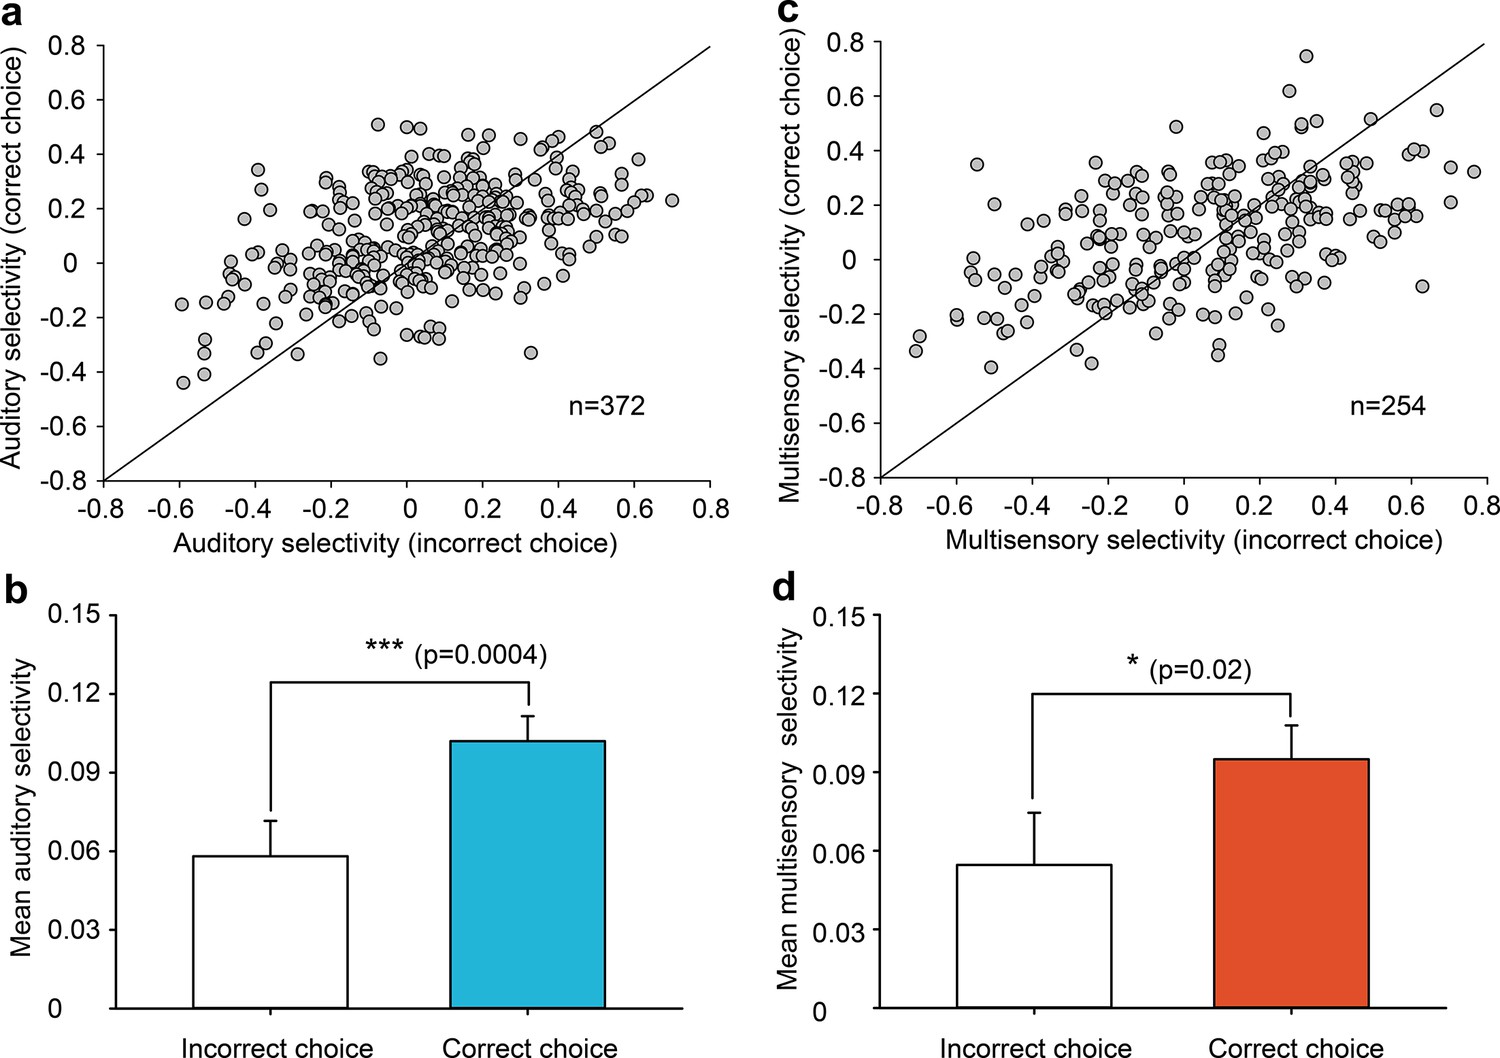
(a) Comparison of auditory selectivity between incorrect and correct choice trials for neurons with at least nine trials in the incorrect condition. The solid line indicates equality. (b) Mean auditory selectivity across neurons between incorrect and correct choice trials. Error bars represent SEM. Statistical significance: ***, p=0.0004. (c) Scatterplot comparing multisensory selectivity between correct and incorrect choice trials, limited to neurons with a minimum of nine trials in the incorrect condition. (d) Mean multisensory selectivity across neurons between incorrect and correct choice trials. Error bars represent SEM. Statistical significance: *, p=0.02.
Figure 5 with 1 supplement
Information-dependent integration and discrimination of audiovisual cues.
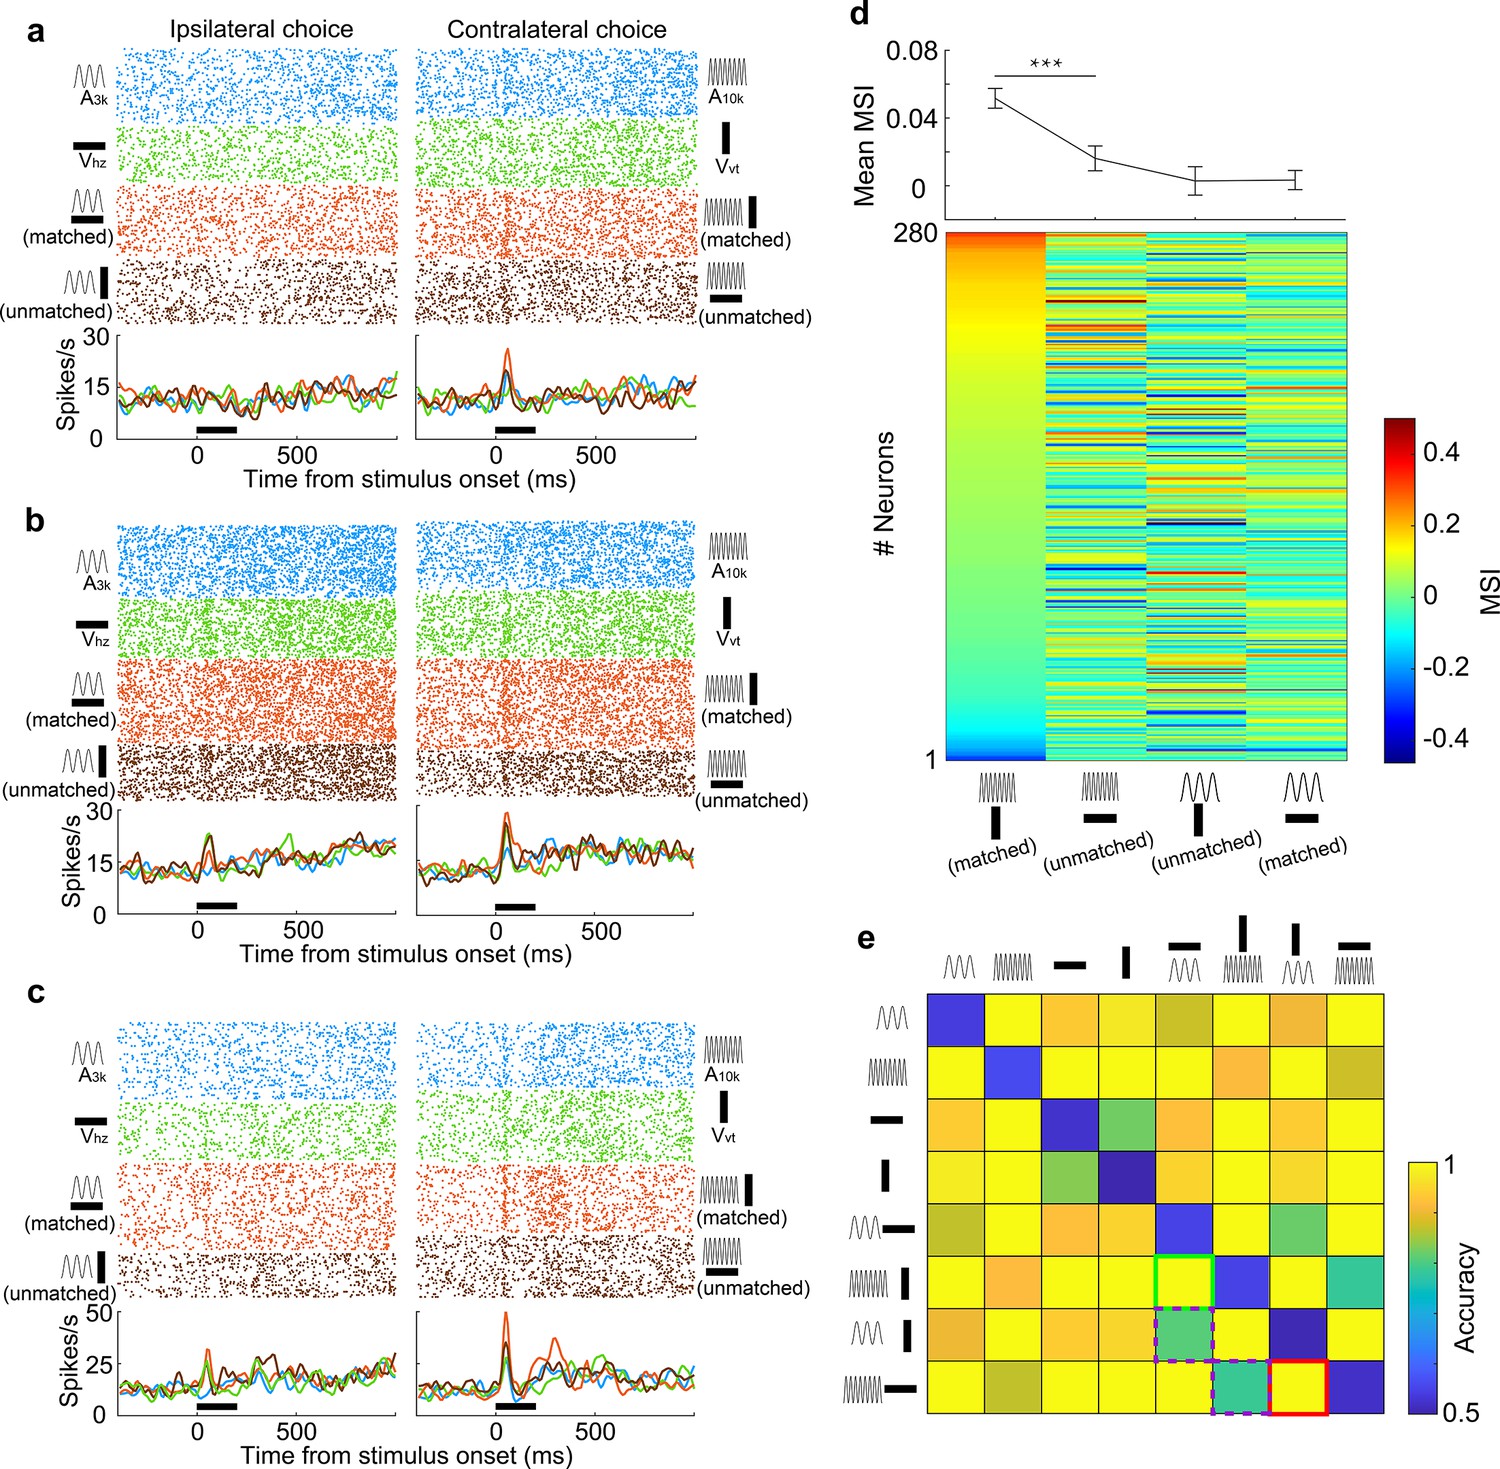
(a–c) Responses of three example neurons to six target stimuli and two unmatched multisensory cues (A3kVvt and A10kVhz) presented during task engagement. (d) Lower panel: MSI for different auditory-visual pairings. Neurons are sorted by their MSI for the A10kVvt condition. Upper panel: Mean MSI across the population for each pairing. Error bar, SEM. ***, p<0.001. (e) Population decoding accuracy for all stimulus pairings (8×8) within a 150ms window after stimulus onset. Green, purple, and red squares denote the decoding accuracy for discriminating two target multisensory cues (green), discriminating two unmatched auditory-visual pairings (red) and matched versus unmatched audiovisual pairings (purple), respectively.
Figure 5—figure supplement 1

Behavioral choice in incongruent and congruent audiovisual trials.
(a) Proportions of choices (filled bars for left choice, unfilled bars for right choice) for incongruent A3kVvt (red) and A10kVhz (blue) trials. Circles connected by a dashed line represent data from one individual rat. (b) Behavioral performance in congruent A3kVhz (white) and A10kVvt (gray) conditions.
Figure 6
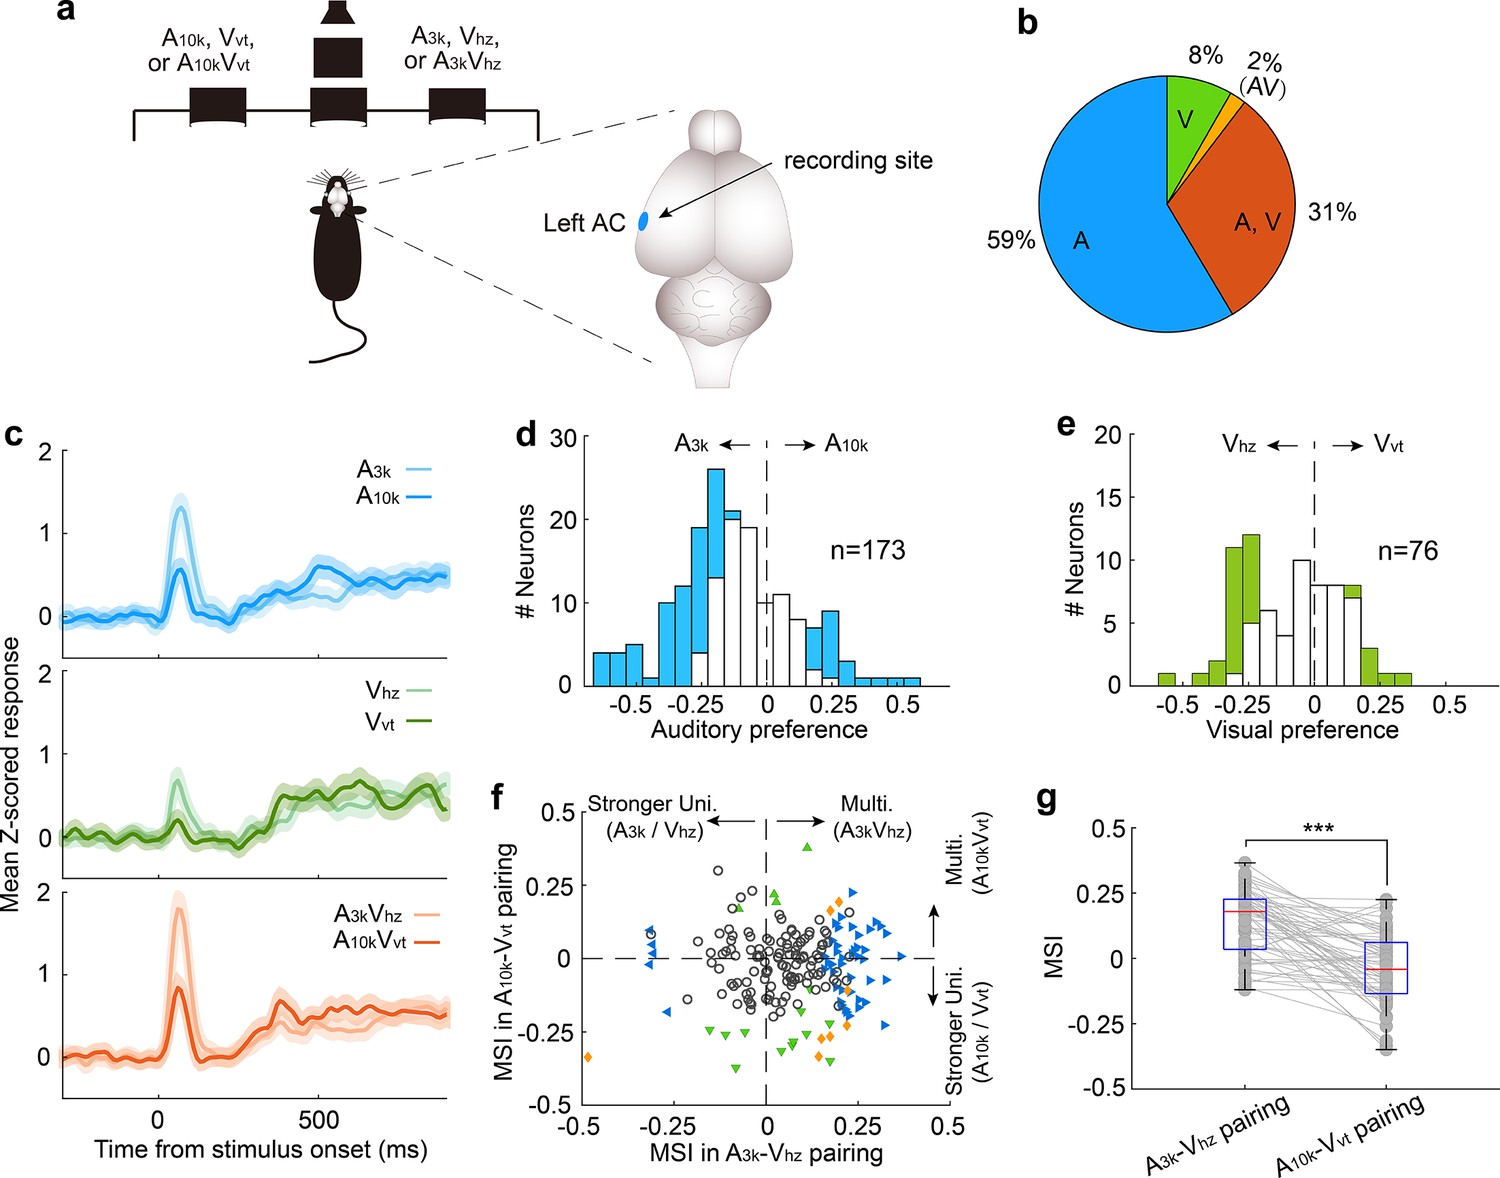
Multisensory integration and cue preferences of neurons recorded in left AC.
(a) The behavioral task and the recording site within the brain (the left AC). (b) The proportion of neurons responsive to auditory-only (A), visual-only (V), both auditory and visual (A, V), and audiovisual-only (VA) stimuli based on their spiking activity. (c) The mean PSTHs of normalized responses across neurons for different cue conditions. (d) A histogram of auditory selectivity index. Filled bars represent neurons with a significant selectivity index (permutation test, p<0.05, bootstrap n=5000). (e) Similar to panel (d), this panel shows a histogram of the visual selectivity index. (f) Comparison of MSI between A3k-Vhz and A10k-Vvt pairings. (g) A boxplot shows the comparison of MSI for audiovisual neurons. ***, p<0.001. The conventions used are consistent with those in Figures 2 and 3.
Figure 7
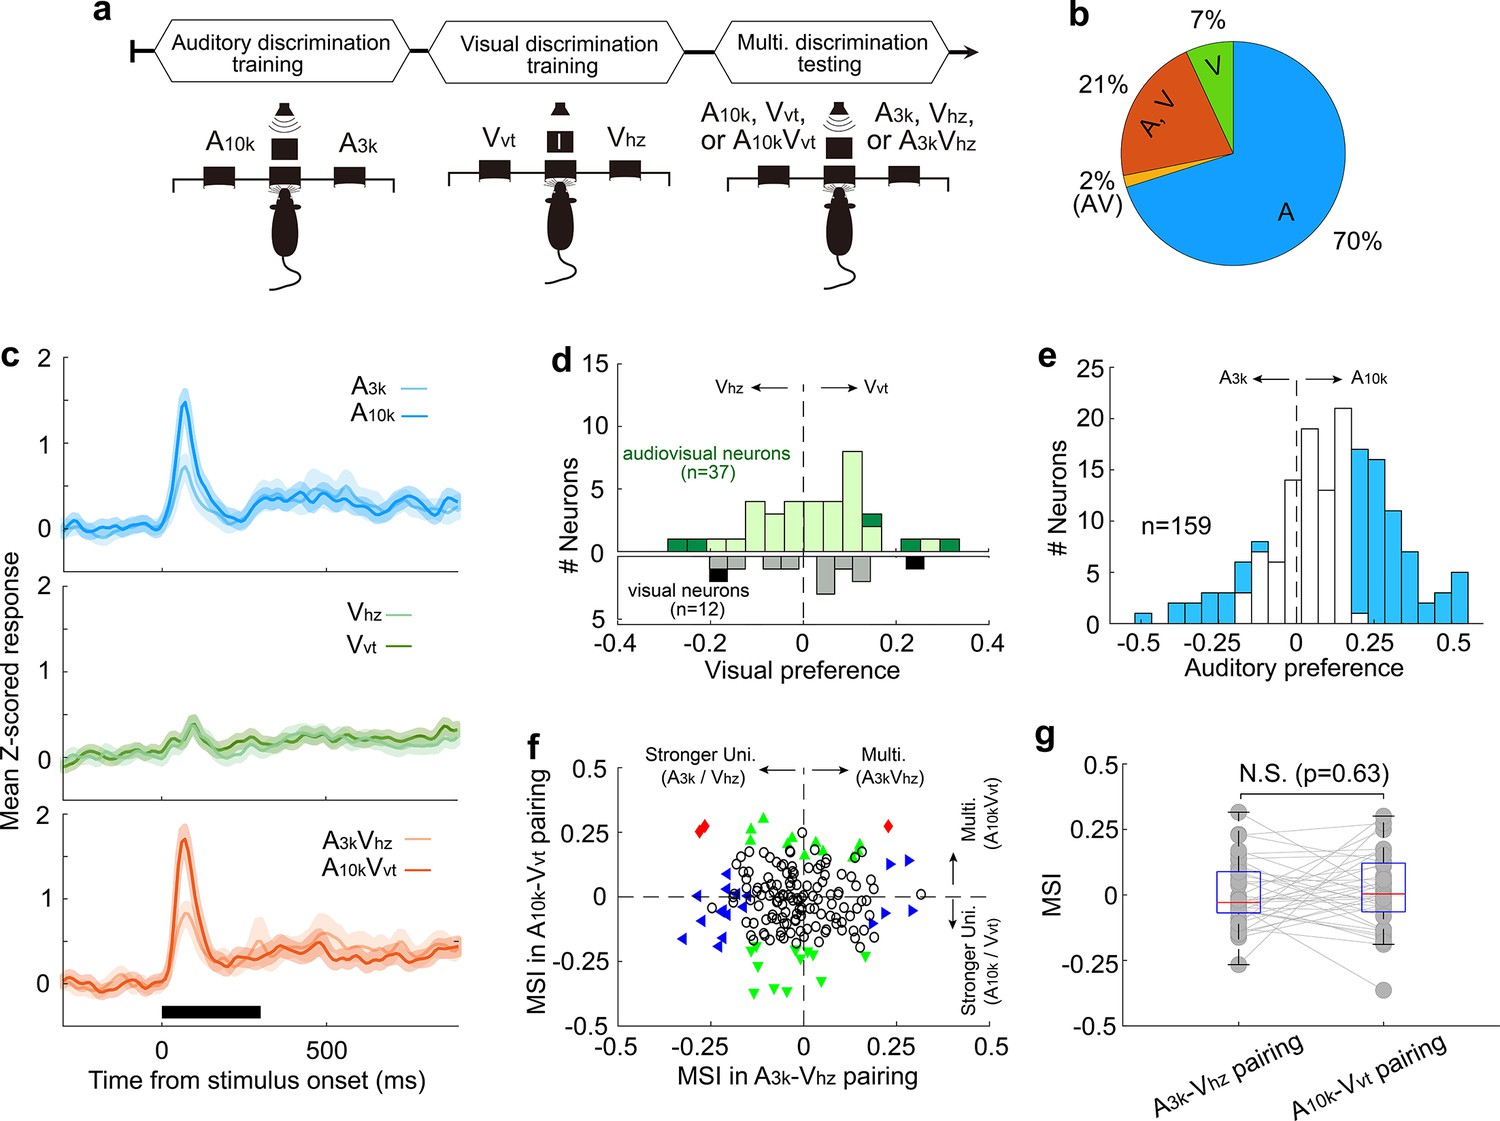
Multisensory integration and cue preferences in right AC neurons after unisensory training.
(a) This panel depicts the training stages for the rats: auditory discrimination training followed by visual discrimination training. (b) The proportion of neurons of different types. (c) Mean normalized responses across neurons for different cue conditions. (d, e) Histograms of visual (d) and auditory (e) selectivity. (f) Comparison of neuronal MSI between A3k-Vhz and A10k-Vvt pairings. (g) MSI comparison in audiovisual neurons. N.S., no significant difference. The conventions used are consistent with those in Figures 2 and 3 and Figure 6.
Author response image 1

Reaction time cumulative distribution functions (CDFs) and race model evaluation.
(a) CDFs of reaction times (RTs) for auditory (blue), visual (green), and audiovisual stimuli (red) during the multisensory discrimination task. The summed CDF of the auditory and visual conditions (dashed purple, CDF_Miller) represents the race model prediction under independent sensory processing. The dashed yellow line represents the CDF of reaction times predicted by the race model. According to the race model inequality, the CDF for audiovisual stimuli (CDF_AV) should always lie below or to the right of the sum of CDF_A and CDF_V. In this example, the inequality is violated at nearly t = 200 ms, where CDF_AV is above CDF_Miller. (b) Data from another animal, showing similar results. (c, d) CDFs of reaction times for two other animals. In these cases, the CDFs follow the race model inequality, with CDF_AV consistently lying below or to the right of CDF_A + CDF_V.
Author response image 2

Additional files
-
MDAR checklist
- https://cdn.elifesciences.org/articles/102926/elife-102926-mdarchecklist1-v1.docx
-
Source data 1
Source data contain most of data shown in Figures 1—7.
However, some exemplar neuron data were not properly saved in the Excel files. These datasets have been deposited separately in Mendeley Data for accessibility.
- https://cdn.elifesciences.org/articles/102926/elife-102926-data1-v1.xlsx
Download links
A two-part list of links to download the article, or parts of the article, in various formats.
Downloads (link to download the article as PDF)
Open citations (links to open the citations from this article in various online reference manager services)
Cite this article (links to download the citations from this article in formats compatible with various reference manager tools)
Auditory cortex learns to discriminate audiovisual cues through selective multisensory enhancement
eLife 13:RP102926.
https://doi.org/10.7554/eLife.102926.3


