Axon-specific microtubule regulation drives asymmetric regeneration of sensory neuron axons
- Nerve Regeneration Group, Instituto de Biologia Molecular e Celular (IBMC), Instituto de Investigação e Inovação em Saúde (i3S), University of Porto, Portugal
- Graduate Program in Molecular and Cell Biology, Instituto de Ciências Biomédicas Abel Salazar, University of Porto, Portugal
- Neurolipid Biology Group, Instituto de Biologia Molecular e Celular (IBMC), Instituto de Investigação e Inovação em Saúde (i3S), University of Porto, Portugal
- Advanced Imaging Unit, Instituto Gulbenkian de Ciência, Portugal
- Institute of Molecular Neurogenetics, Center for Molecular Neurobiology Hamburg, ZMNH, University Medical Centre Hamburg-Eppendorf, Germany
- Institute of Neuronal Cell Biology, Technical University of Munich, Munich, Germany; Munich Cluster for Systems Neurology (SyNergy), Germany
Figures
Figure 1 with 2 supplements
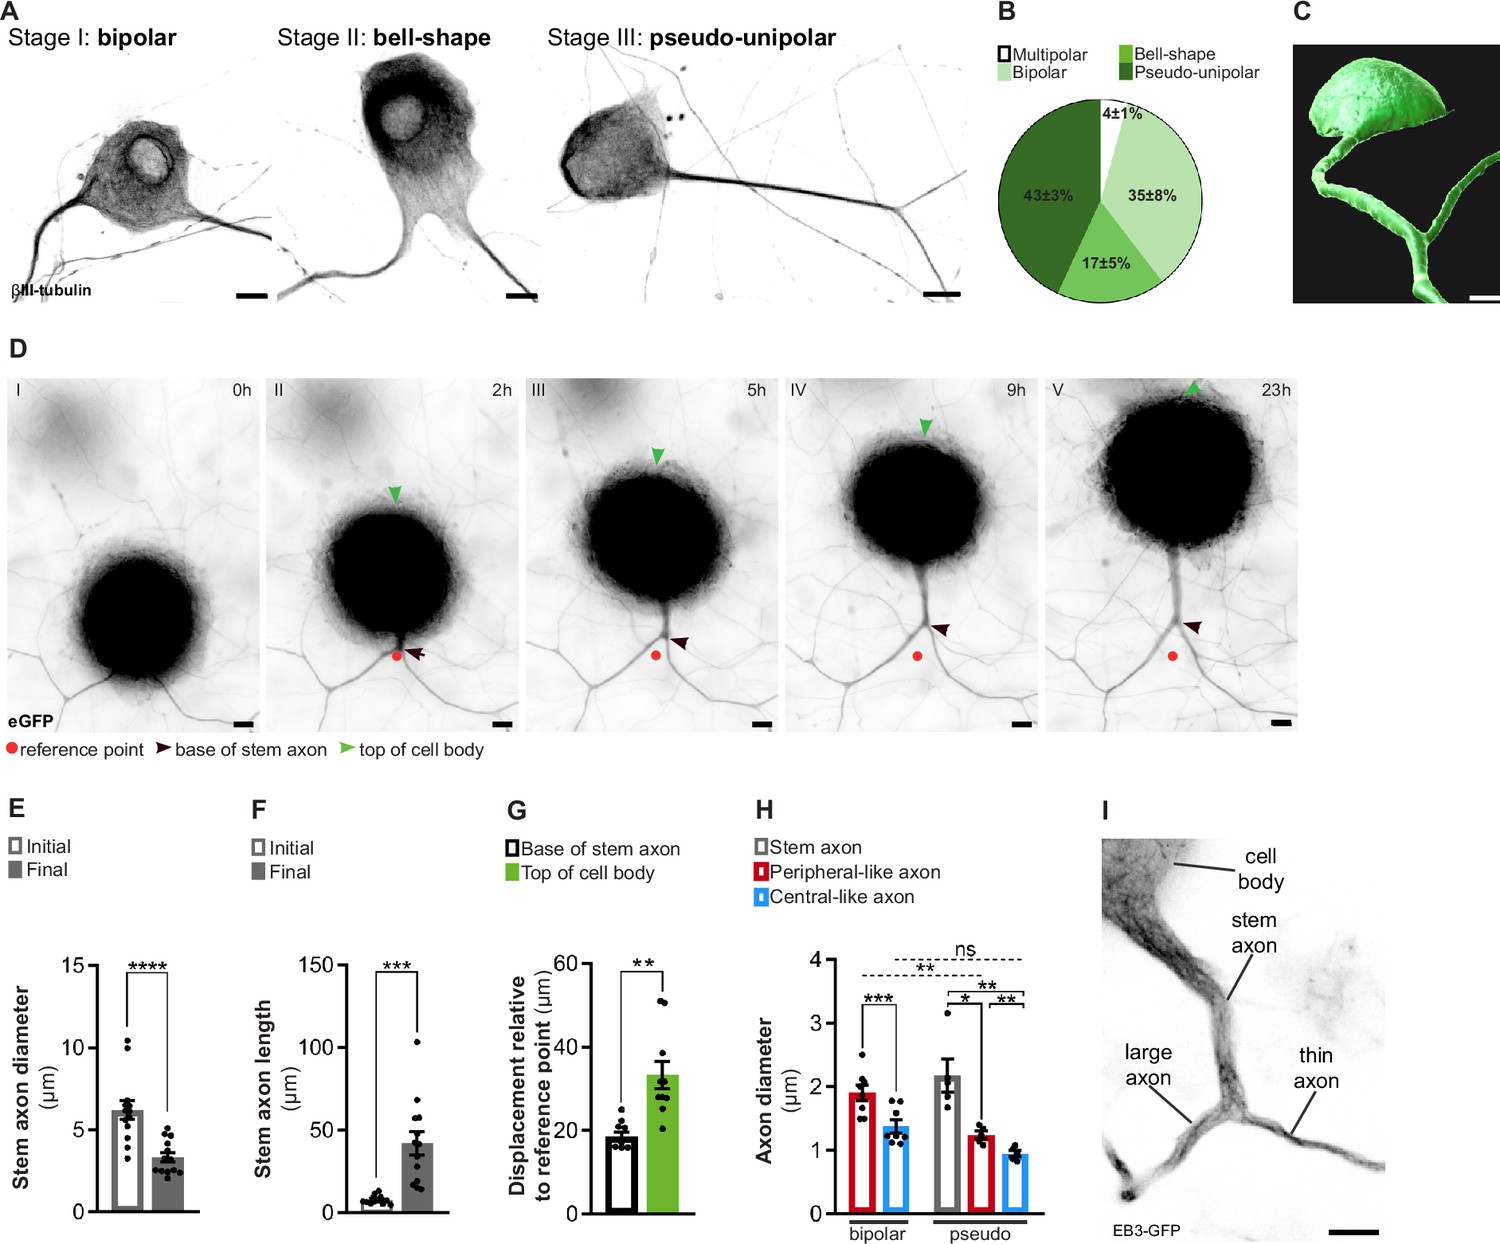
In vitro dorsal root ganglion (DRG) neurons recapitulate in vivo developmental stages.
(A) In vitro DRG neurons labeled with βIII-tubulin depicting different development stages. Scale bar, 10 µm. (B) Percentage of different DRG neuron morphologies at DIV21 (n = 3 independent experiments, 100 cells per experiment). (C) Imaris segmentation of a pseudo-unipolar DRG neuron transduced with AAV-CMV-eGFP. Scale bar, 7 µm. (D) In vitro DRG neurons transduced with AAV-CMV-eGFP depicting stem axon formation. Scale bar, 10 µm. (E, F) Stem axon diameter (E) and length (F) of DRG neuron axons from the formation of the stem axon (Initial) to the final stage of pseudo-unipolarization (Final) (n = 13 neurons; paired t-test, diameter ****p<0.0001, length ***p=0.0004). (G) Stem axon and cell-body displacement during pseudo-unipolarization (n = 13 neurons; paired t-test, **p=0.0020). (H) In vitro diameter of DRG axons; n = 5–8 independent experiments, 5–10 neurons/experiment; paired t-test in bipolar neurons, ***p=0.0003; repeated measures (RM) one-way ANOVA in pseudo-unipolar neurons, stem-peripheral *p=0.0196, stem-central **p=0.0069, peripheral-central **p=0.0048; for comparisons amongst peripheral and central-like axons from bipolar and pseudo-unipolar neurons, a two-way ANOVA was used (peripheral: **p=0.0039; central: p=0.9829). (I) In vitro pseudo-unipolar DRG neuron transduced with the lentivirus CMV-EB3-GFP depicting different axon diameter. Scale bar, 5 µm. Data are represented as mean ± SEM.
Figure 1—video 1
Segmentation of an in vitro pseudo-unipolar embryonic rat dorsal root ganglion (DRG) neuron expressing eGFP acquired using timelapse confocal microscopy.
An Imaris Surfaces tool was applied to extract a 3D object from the DRG neuron outer contour using an intensity threshold to distinguish cell from the background. Scale bar, variable throughout the video. Related to Figure 1C.
Figure 1—video 2
In vitro embryonic dorsal root ganglion (DRG) neurons assembling a stem axon.
Timelapse epifluorescence microscopy showing in vitro embryonic rat DRG neurons assembling a stem axon from a bipolar bell-shape DRG morphology into a pseudo-unipolar morphology at early (DIV 7–14, left) and late (DIV 14–21, right) DIVs. To identify their morphology, neurons express eGFP. Images were acquired every hour and play at 2.7 × 10⁻⁴ frames per second. Scale bar, 10 µm. Related to Figure 1D.
Figure 2 with 1 supplement
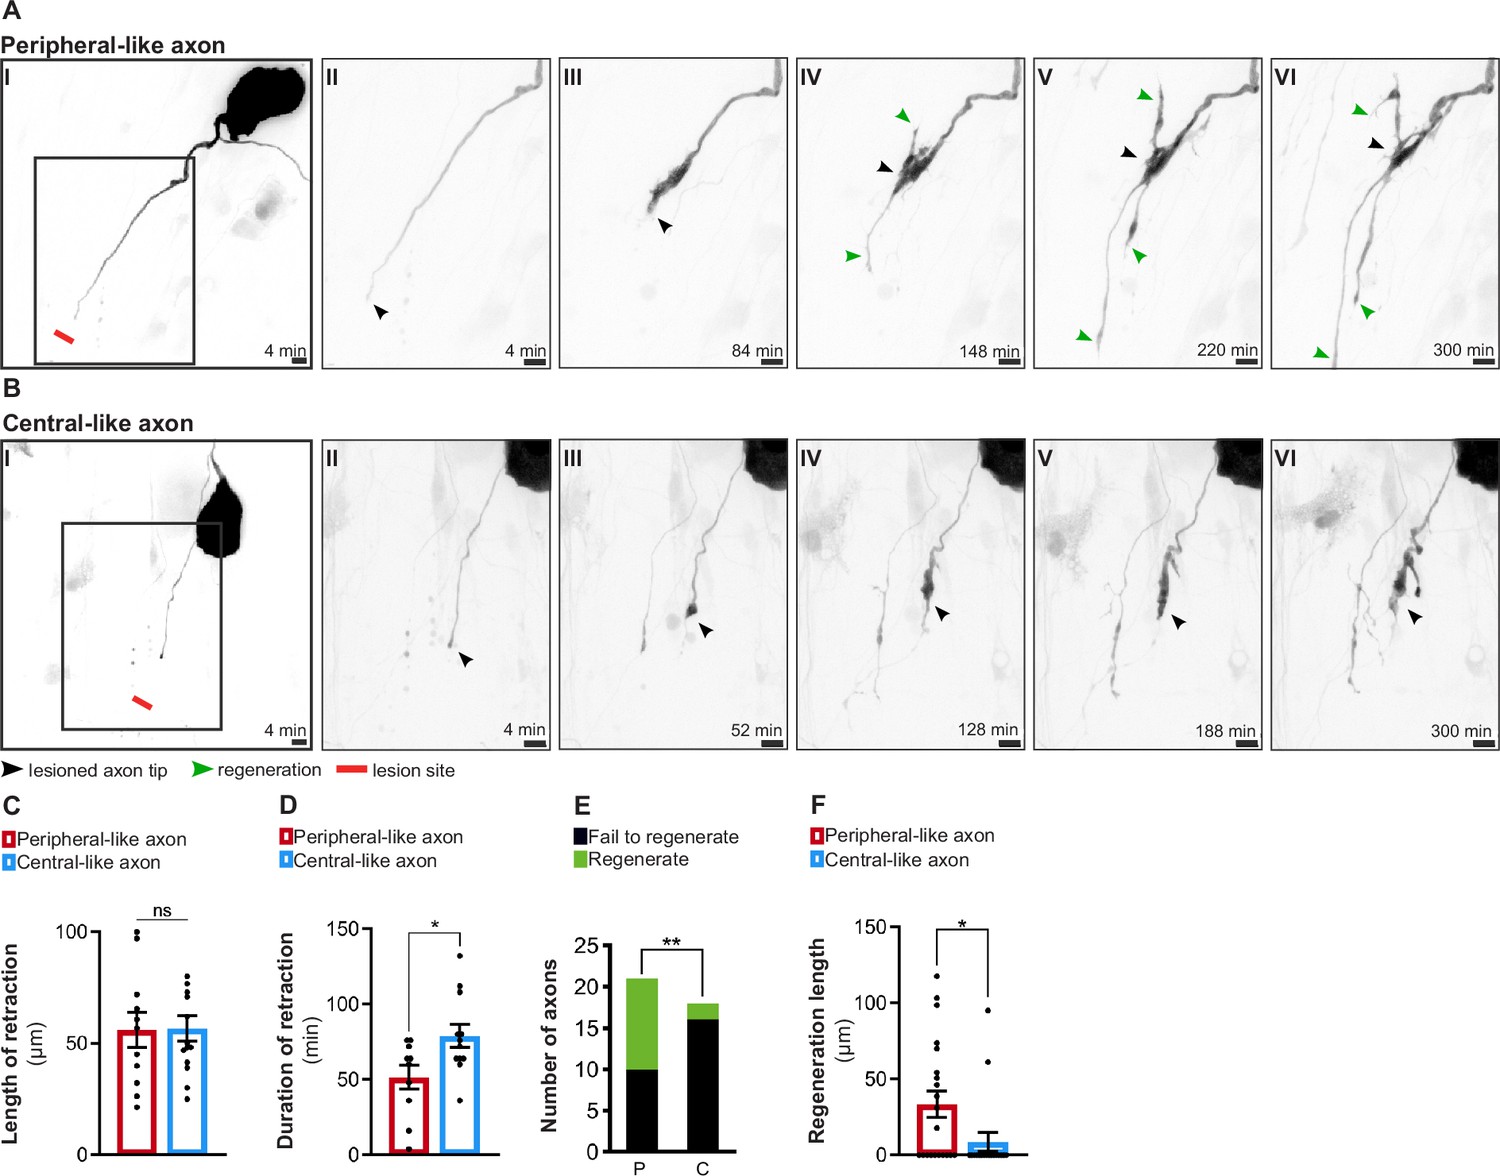
In vitro dorsal root ganglion (DRG) neurons recapitulate in vivo regenerative asymmetry.
(A, B) Live imaging of in vitro regeneration of a peripheral-like (A) and a central-like axon (B). Scale bar, 10 µm. The injury sites are marked by red lines; lesioned axon tips by black arrowheads and regenerating axons by green arrowheads. (C, D) Length (C) and duration (D) of axon retraction after laser axotomy (n = 10–14 axons, three independent experiments; unpaired t-test, length p=0.9541, duration *p=0.0228). (E) Number of regenerating and non-regenerating peripheral-like (P) and central-like (C) DRG axons. The chi-square test was used (five independent experiments, **p=0.0082). (F) Regeneration length of peripheral and central-like axons following laser axotomy (n = 18–21 axons, five independent experiments; unpaired t-test, *p=0.0297). Data are represented as mean ± SEM.
Figure 2—video 1
Laser axotomy of peripheral and central-like rat dorsal root ganglion (DRG) axons.
Timelapse spinning-disk confocal microscopy showing an in vitro pseudo-unipolar embryonic rat DRG neuron expressing eGFP. Peripheral-like and central-like axonal branches were injured 100–200 µm from the DRG T-junction with a 355 nm pulsed lased at a maximum of 50% laser power. Images were acquired every 4 min. The video plays at 4.1 × 10⁻³ frames per second. Scale bar, 10 µm. Related to Figure 2A and B.
Figure 3 with 3 supplements

Dorsal root ganglion (DRG) axons display asymmetric microtubule polymerization, attenuated by a conditioning lesion.
(A) In vitro pseudo-unipolar DRG neuron transduced with a Tom20-GFP lentivirus, labeling mitochondria. Scale bar, 5 µm. (B) Quantification of the anterograde mitochondria flux (n = 4 independent experiments, five DRGs/experiment; paired t-test, *p=0.0143). (C) EB3-GFP comet density in in vitro DRG axons (n = 6–7 independent experiments, 5–10 neurons/experiment; paired t-test in bipolar axons, **p=0.0038; repeated measures [RM] one-way ANOVA in pseudo-unipolar axons, stem-central *p=0.0221, peripheral-central *p=0.0171). (D) Kymographs of in vitro pseudo-unipolar DRG axons. (E) EB3-GFP comet velocity in in vitro pseudo-unipolar DRG axons (n = 6 independent experiments, 5–10 neurons/experiment; RM one-way ANOVA, stem-central *p=0.0443, peripheral-central *p=0.0183). (F) Representation of naive DRG neurons connected to the peripheral nerve (containing peripheral axons) and dorsal root (containing central axons). The dashed squares indicates the imaging locations. (G) Live imaging of DRG axons from Thy1-EB3-eGFP mice. Scale bar, 5 µm. (H) EB3-GFP comet density in DRG explants from naive mice (n = 12–17 animals; 3–6 axons/animal, **p=0.0037) and mice with a peripheral conditioning lesion (CL) (n = 9–10 animals, 3–5 axons/animal, p=0.1423). Two-way ANOVA; peripheral naive-peripheral CL, *p=0.0276; central naive central CL, **p=0.0026. (I) High-magnification electron microscopy images within individual naive DRG axons, depicting axonal microtubules (red arrowheads). Scale bar, 100 nm. (J) Total density of microtubules in naive DRG axons (n = 8 animals, 5–10 axons/animal; paired t-test, p=0.2299). (K) EB3-GFP comet velocity in DRG explants from naive mice (n = 11–15 animals, 3–6 axons/animal, **p=0.0048) and mice with peripheral CL (n = 8–9 animals, 3–5 axons/animal, **p=0.0035). Two-way ANOVA, peripheral naive-peripheral CL, ***p=0.0003; central naive-central CL, **p=0.0038. (L) Representation of a sciatic nerve injury to DRG neurons (conditioning lesion). The dashed square indicates the imaging location, while the dashed line and scissor marks the lesion site. (M) Total density of axonal microtubules in DRG peripheral and central axons after peripheral CL (n = 8 animals, five axons/animal; paired t-test, p=0.4624). Data are represented as mean ± SEM.
Figure 3—video 1
Mitochondria transport in in vitro dorsal root ganglion (DRG) neurons.
Timelapse confocal microscopy showing an in vitro pseudo-unipolar embryonic rat DRG neuron expressing Tom20-GFP to assess mitochondria axonal transport (white dots). Images were acquired every 2 s. The video plays at 0.5 frames per second. Scale bar, 5 µm. Related to Figure 3A.
Figure 3—video 2
Microtubule dynamics in in vitro dorsal root ganglion (DRG) neurons.
Timelapse confocal microscopy showing an in vitro pseudo-unipolar embryonic rat DRG neuron expressing EB3-GFP (dark dots) to assess microtubule dynamics. Images were acquired every 2 s. The video plays at 0.5 frames per second. Scale bar, 5 µm. Related to Figure 3C–E.
Figure 3—video 3
Microtubule dynamics in in vivo dorsal root ganglion (DRG) neurons.
Timelapse spinning-disk confocal microscopy showing in vivo adult peripheral and central DRG axons from Thy1-EB3-eGFP mice. The axon expresses EB3-eGFP (dark dots) to assess microtubule dynamics. Images were acquired every 2 s. The video plays at 0.5 frames per second. Scale bar, 5 µm. Related to Figure 3G.
Figure 4 with 2 supplements
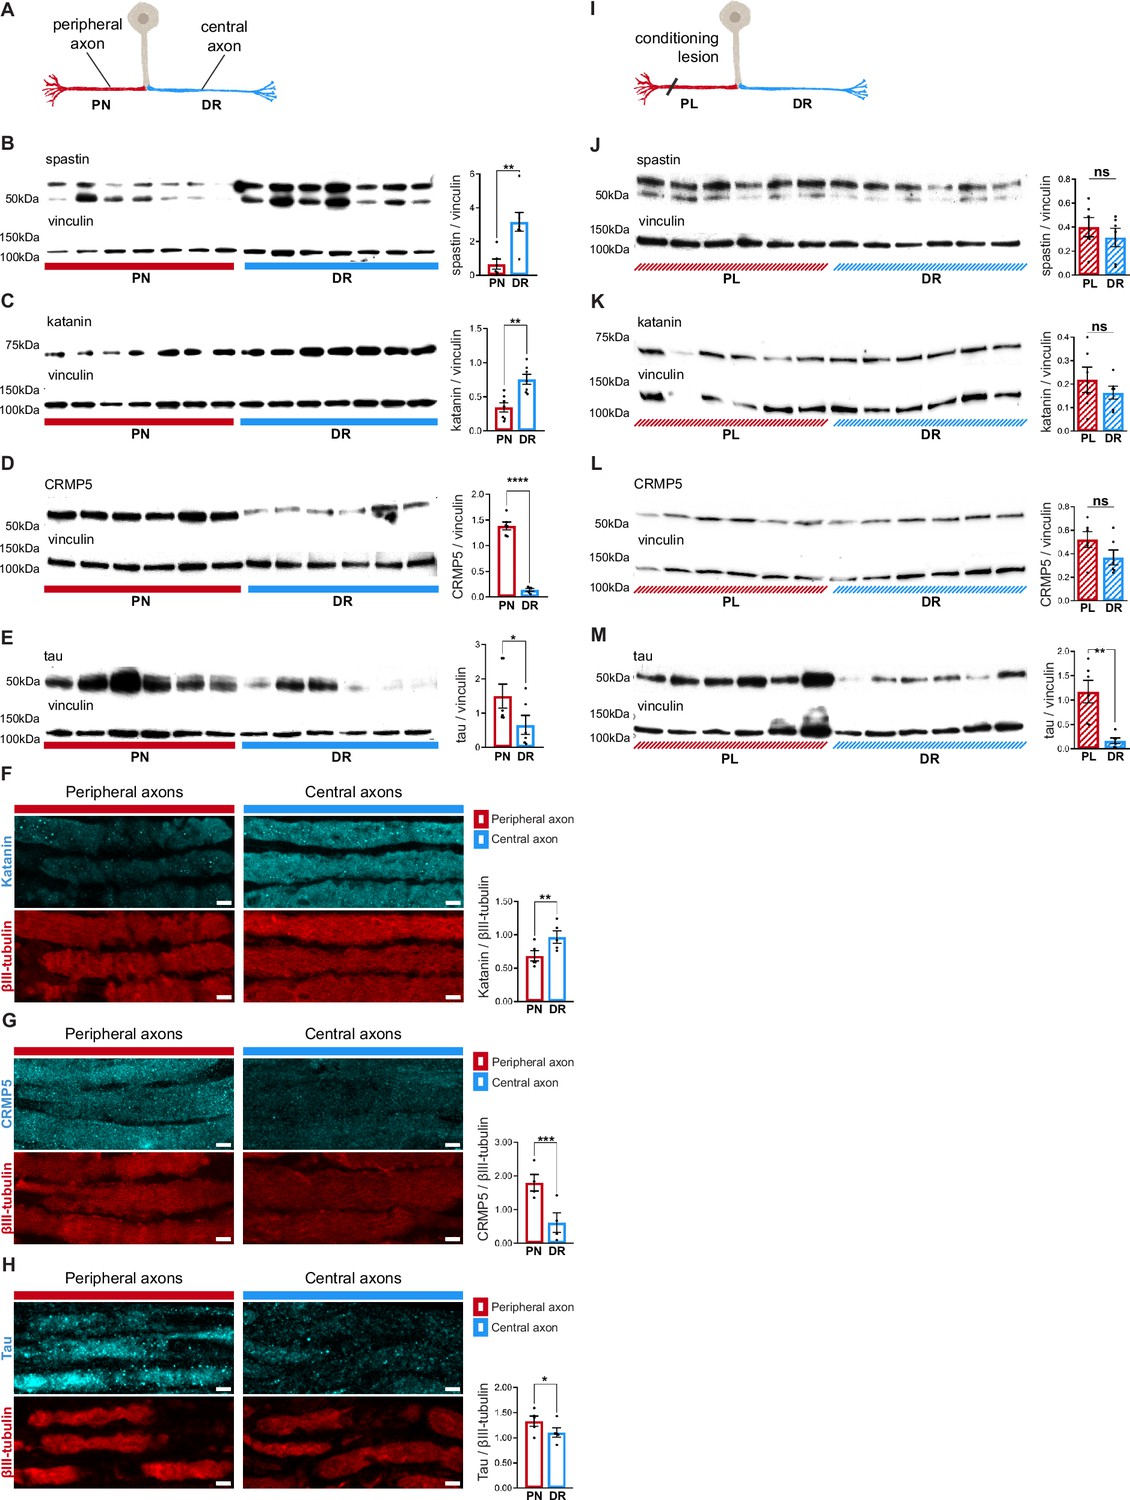
Dorsal root ganglion (DRG) axons have a distinctive microtubule-associated protein (MAP) signature that adapts upon conditioning lesion.
(A) Representation of a naive DRG neuron. Peripheral axons within the peripheral nerve (PN) are depicted in red and central axons within the dorsal root (DR) in blue. (B–E) Western blot analysis of the PN and DR (n = 5–7 animals) and respective quantification of (B) spastin (unpaired t-test, **p=0.0032), (C) katanin (paired t-test, **p=0.0063), (D) CRMP5 (unpaired t-test, ****p<0.0001), and (E) tau (Wilcoxon test, *p=0.0313) levels. (F–H) Immunofluorescence of (F) katanin and βIII-tubulin, (G) CRMP5 and βIII-tubulin, and (H) tau and βIII-tubulin in DRG axons (n = 4–5 animals) and respective quantification (katanin, paired t-test, **p=0.0021; CRMP5, paired t-test, ***p=0.009; tau, paired t-test, *p=0.0114). Scale bar, 5 µm. (I) Representation of a DRG neuron with a priming peripheral lesion (peripheral lesion [PL]). (J–M) Western blot of DRG PN and DR following PL (n = 6 animals) and respective quantification (n = 6 animals; paired t-test) showing (J) spastin (p=0.4085), (K) katanin (p=0.2661), (L) CRMP5 (p=0.1326), and (M) tau (**p=0.0052) levels. Data are represented as mean ± SEM.
-
Figure 4—source data 1
Original MAP western blots seen in Figure 4B–E and J–M, indicating the relevant bands.
- https://cdn.elifesciences.org/articles/104069/elife-104069-fig4-data1-v1.zip
-
Figure 4—source data 2
Original files for MAP western blots displayed in Figure 4B–E and J–M.
- https://cdn.elifesciences.org/articles/104069/elife-104069-fig4-data2-v1.zip
Figure 4—figure supplement 1
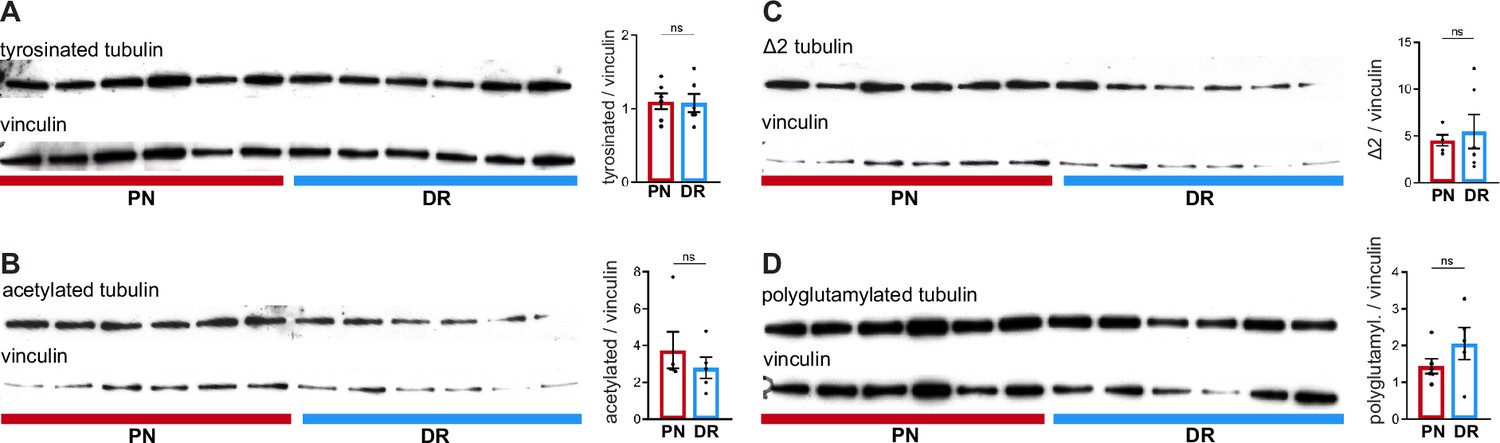
Peripheral and central dorsal root ganglion (DRG) axons show similar levels of tubulin post-translational modifications.
(A–D) Western blot analysis of DRG peripheral nerve (PN) and dorsal root (DR) and respective quantification of (A) tyrosinated tubulin (n = 6 animals; paired t-test, p=0.9075), (B) acetylated tubulin (n = 5 animals; Mann–Whitney U test, p=0.7302), (C) Δ2 tubulin (n = 5–6 animals; unpaired t-test, p=0.6639), and (D) polyglutamylated tubulin (n = 5–6 animals; unpaired t-test,, p=0.2052) expression levels. Data are represented as mean ± SEM.
-
Figure 4—figure supplement 1—source data 1
Original PTM western blots for Figure 4—figure supplement 1, indicating the relevant bands.
- https://cdn.elifesciences.org/articles/104069/elife-104069-fig4-figsupp1-data1-v1.zip
-
Figure 4—figure supplement 1—source data 2
Original files for the PTM western blots displayed in Figure 4—figure supplement 1.
- https://cdn.elifesciences.org/articles/104069/elife-104069-fig4-figsupp1-data2-v1.zip
Figure 4—figure supplement 2
Potential sorting mechanism at the dorsal root ganglion (DRG) T-junction.
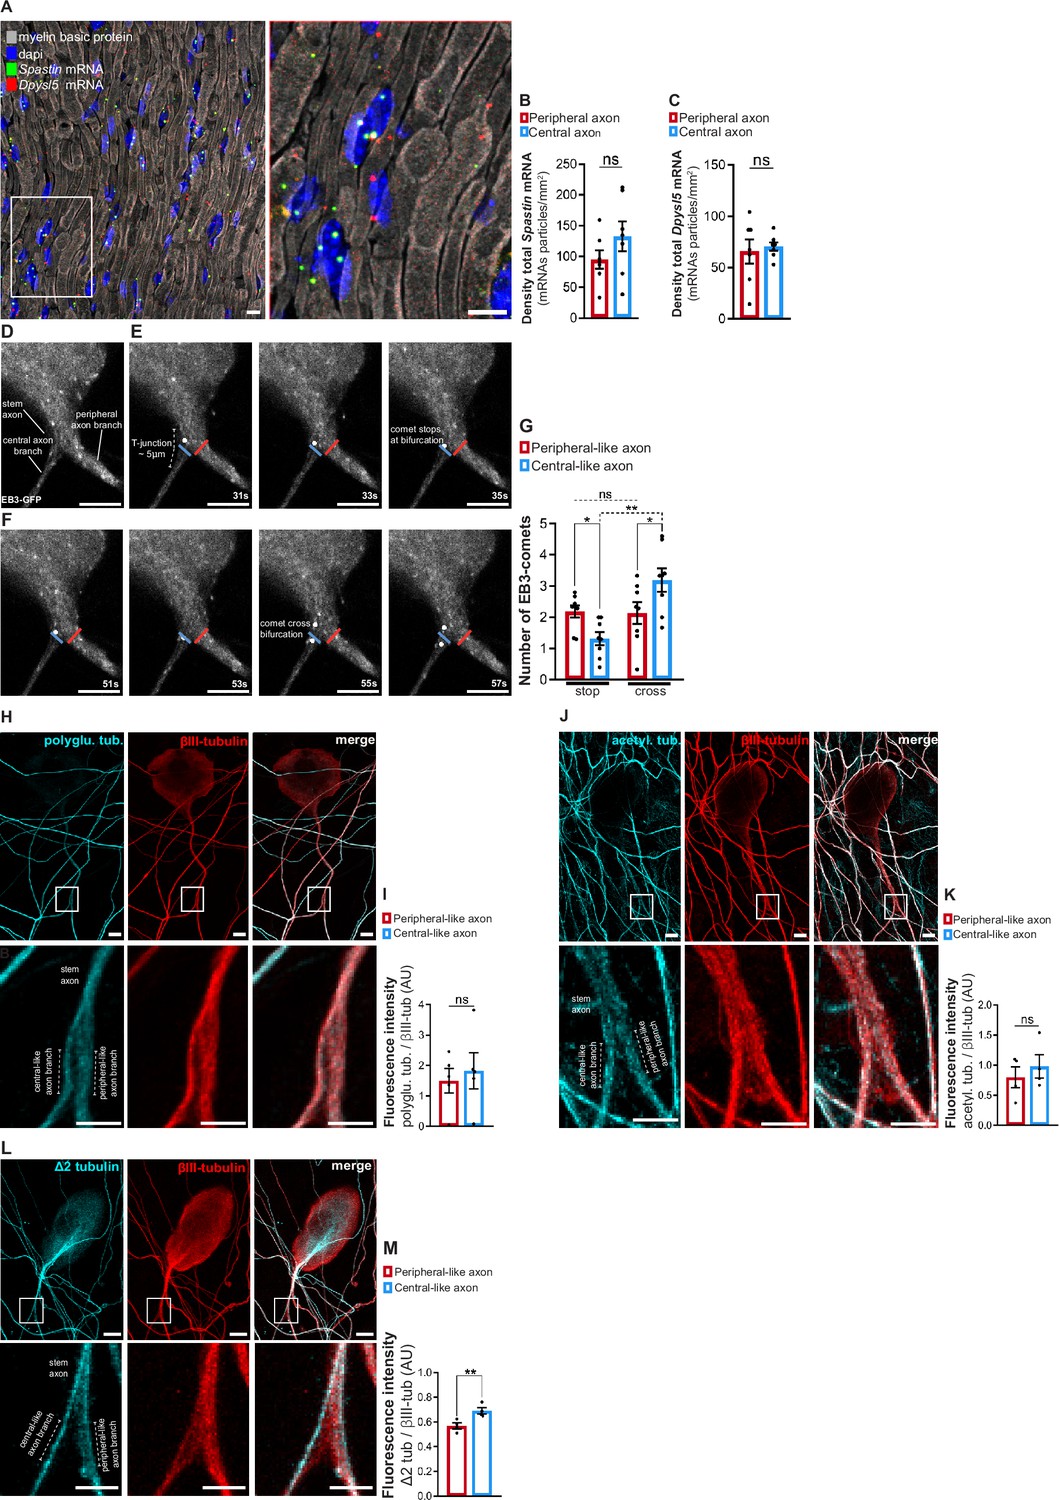
(A) Representative images of a peripheral DRG axon after performing RNAscope analysis to detect Spastin and Dpysl5 (CRMP5 mouse gene) mRNA particles. Scale bar, 10 µm. (B, C) The density of (B) total Spastin mRNA and (C) total Dpysl5 mRNA in the DRG peripheral nerve and dorsal root (n = 7 animals, three non-consecutive DRG peripheral nerve and dorsal root sections were analyzed per animal). Paired t-test, spastin: p=0.2112, CRMP5 p=0.7671. (D) In vitro pseudo-unipolar DRG neurons transduced with a CMV-EB3-GFP lentivirus. Scale bar, 5 µm. (E, F) Sequential images of EB3-GFP comets, either stopping (E) or crossing (F) the DRG T-junction. This analysis spanned a 5 µm region from the end of the DRG stem axon to the start of either the peripheral-like (red line) or central-like (blue line) axonal branch. Scale bar, 5 µm. (G) Number of EB3-GFP comets that either stop or cross the DRG-T junction (n = 8 independent experiments, 10 DRGs/experiment; RM two-way ANOVA, stop *p=0.0439, cross *p=0.0162, stop-cross peripheral p=0.9169, stop-cross central **p=0.0032). (H) Immunofluorescence of polyglutamylated tubulin and βIII-tubulin in DRG peripheral and central-like axonal branches. Scale bar, 10 µm, and close-up 5 µm. (I) Quantification of polyglutamylated tubulin fluorescence intensity normalized to βIII-tubulin (n = 5 independent experiments, eight pseudo-unipolar DRGs per experiment, paired t-test, p=0.2957). (J) Immunofluorescence of acetylated tubulin and βIII-tubulin in DRG peripheral and central-like axonal branches. Scale bar, 10 µm, and close-up 5 µm. (K) Quantification of acetylated tubulin fluorescence intensity normalized to βIII-tubulin (n = 4 independent experiments, eight pseudo-unipolar DRGs per experiment, paired t-test, p=0.2946). (L) Immunofluorescence of Δ2 tubulin and βIII-tubulin in DRG peripheral and central-like axonal branches. Scale bar, 10 µm, and close-up 5 µm. (M) Quantification of Δ2 tubulin fluorescence intensity (n = 4 independent experiments, eight DRGs/experiment; paired t-test, **p=0.0012). Data are represented as mean ± SEM.
Figure 5 with 1 supplement
Spastin deficiency is sufficient to abolish the asymmetry of dorsal root ganglion (DRG) axons.
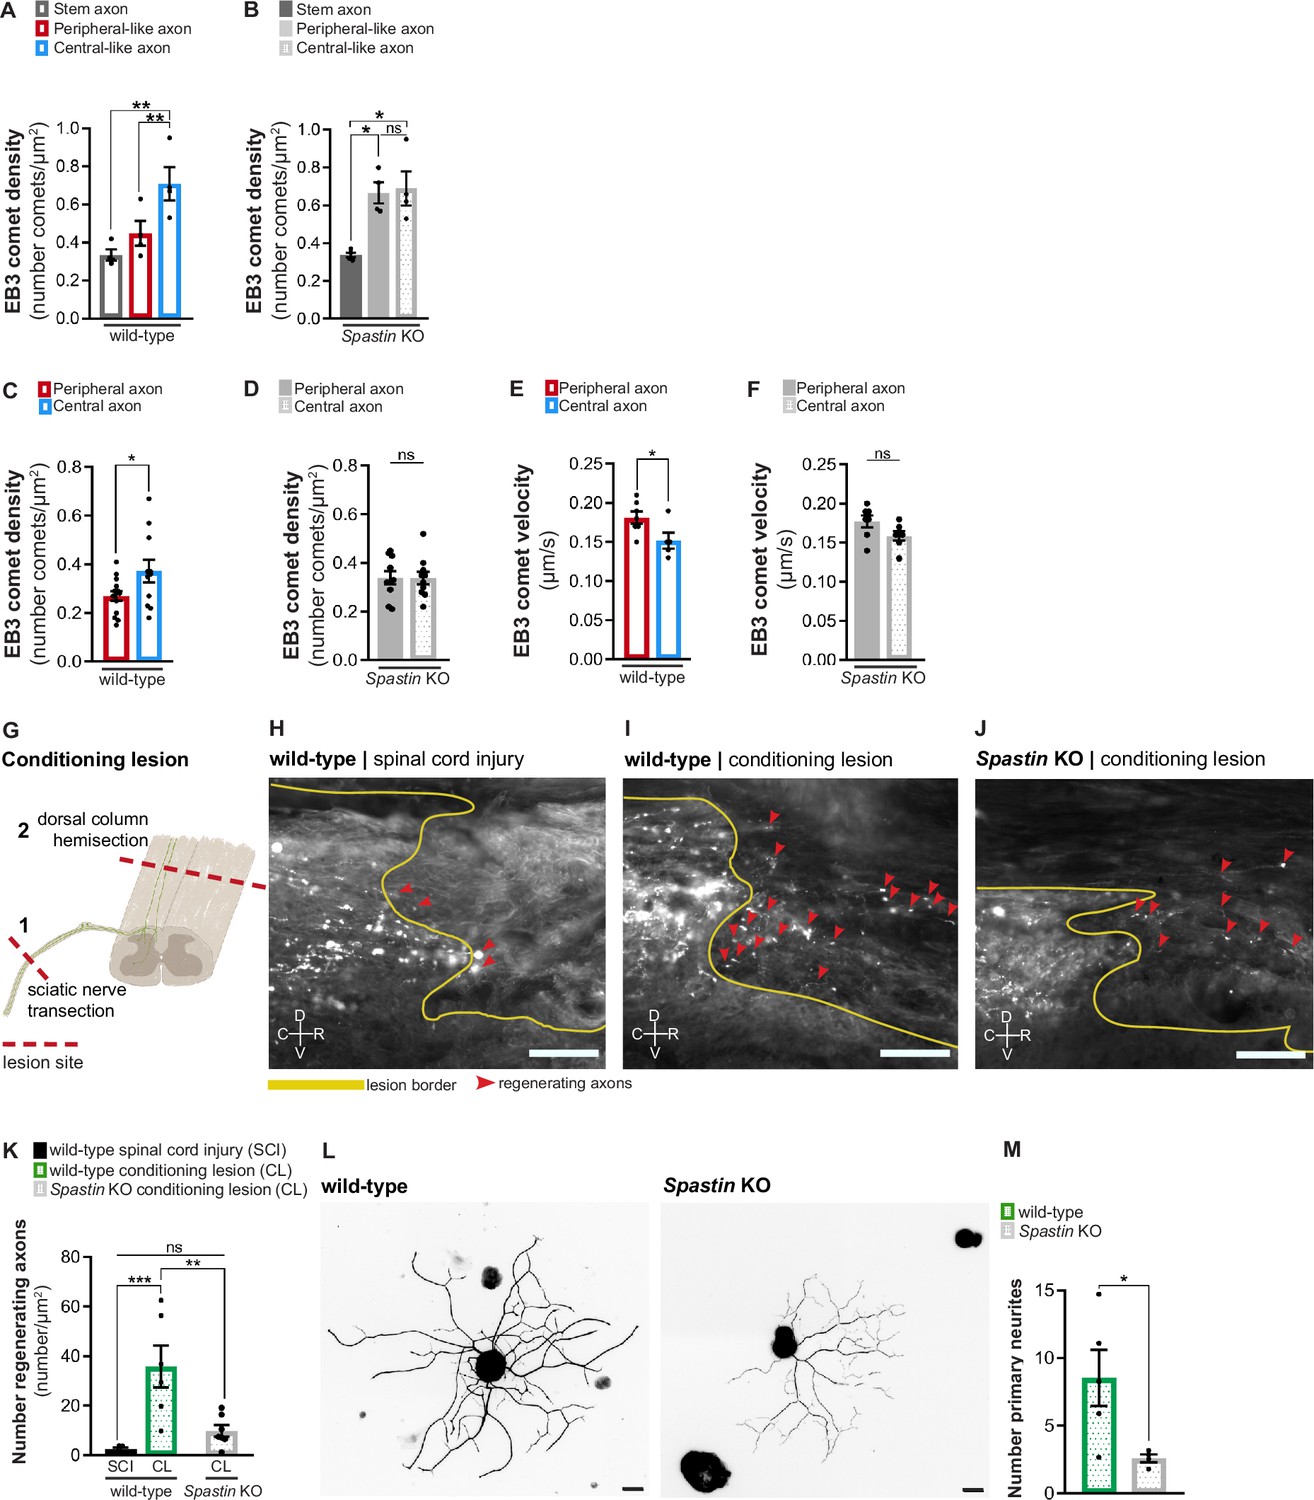
(A) Density of EB3-GFP comets in wild-type DRG axons in vitro (n = 4 independent experiments, 10 cells/experiment; repeated measures [RM] one-way ANOVA, stem-peripheral p=0.0536, stem-central **p=0.0082, peripheral-central **p=0.0027). (B) Density of EB3-GFP comets in Spastin knockout DRG axons in vitro (n = 4 independent experiments, 10 cells/experiment; RM one-way ANOVA, stem-peripheral *p=0.0168, stem-central *p=0.0250, peripheral-central p=0.8762). (C, D) EB3-eGFP comet density in (C) wild-type and (D) Spastin knockout mice (n = 10–14 animals; three axons/animal; unpaired t-test; wild-type, *p=0.0388; knockout, p=0.9792). (E, F) EB3-eGFP comet velocity in (E) wild-type and (F) Spastin knockout mice (n = 5–7 animals; three axons/animal; unpaired t-test; wild-type, *p=0.0405; knockout, p=0.0823). (G) Representation of the conditioning lesion (CL). A dorsal column hemisection is preceded by a sciatic nerve transection 1 week before. Lesion sites are indicated with dashed red lines and DRG axons in green. (H–J) Longitudinal spinal cord sections of (H) wild-type mice with spinal cord lesion or (I) CL and (J) Spastin knockout mice with CL. Dorsal column tract axons were traced with cholera toxin-B (white). The lesion border is highlighted by a yellow line. Regenerating axons are highlighted by red arrowheads. C, caudal; R, rostral; D, dorsal; V, ventral. Scale bar, 100 µm. (K) Number of regenerating axons in wild-type mice with spinal cord injury (n = 5 animals) and CL (n = 6 animals), and Spastin knockout with CL (n = 7 animals); six sections per animal. One-way ANOVA; wild-type SCI-CL, ***p=0.0005; wild-type-knockout CL, **p=0.0020; wild-type SCI-knockout CL, p=0.3335. (L) Representative in vitro wild-type and Spastin knockout adult DRG neurons labeled with βIII-tubulin. Scale bar, 30 µm. (M) Quantification of the number of primary neurites in adult wild-type and Spastin knockout DRG neurons. n = 4–5 independent experiments for wild-type and Spastin knockout; unpaired t-test; *p=0.0205. Data are represented as mean ± SEM.
Figure 5—figure supplement 1
Signs of axon degeneration are not observed in 15-week-old Spastin knockout animals.
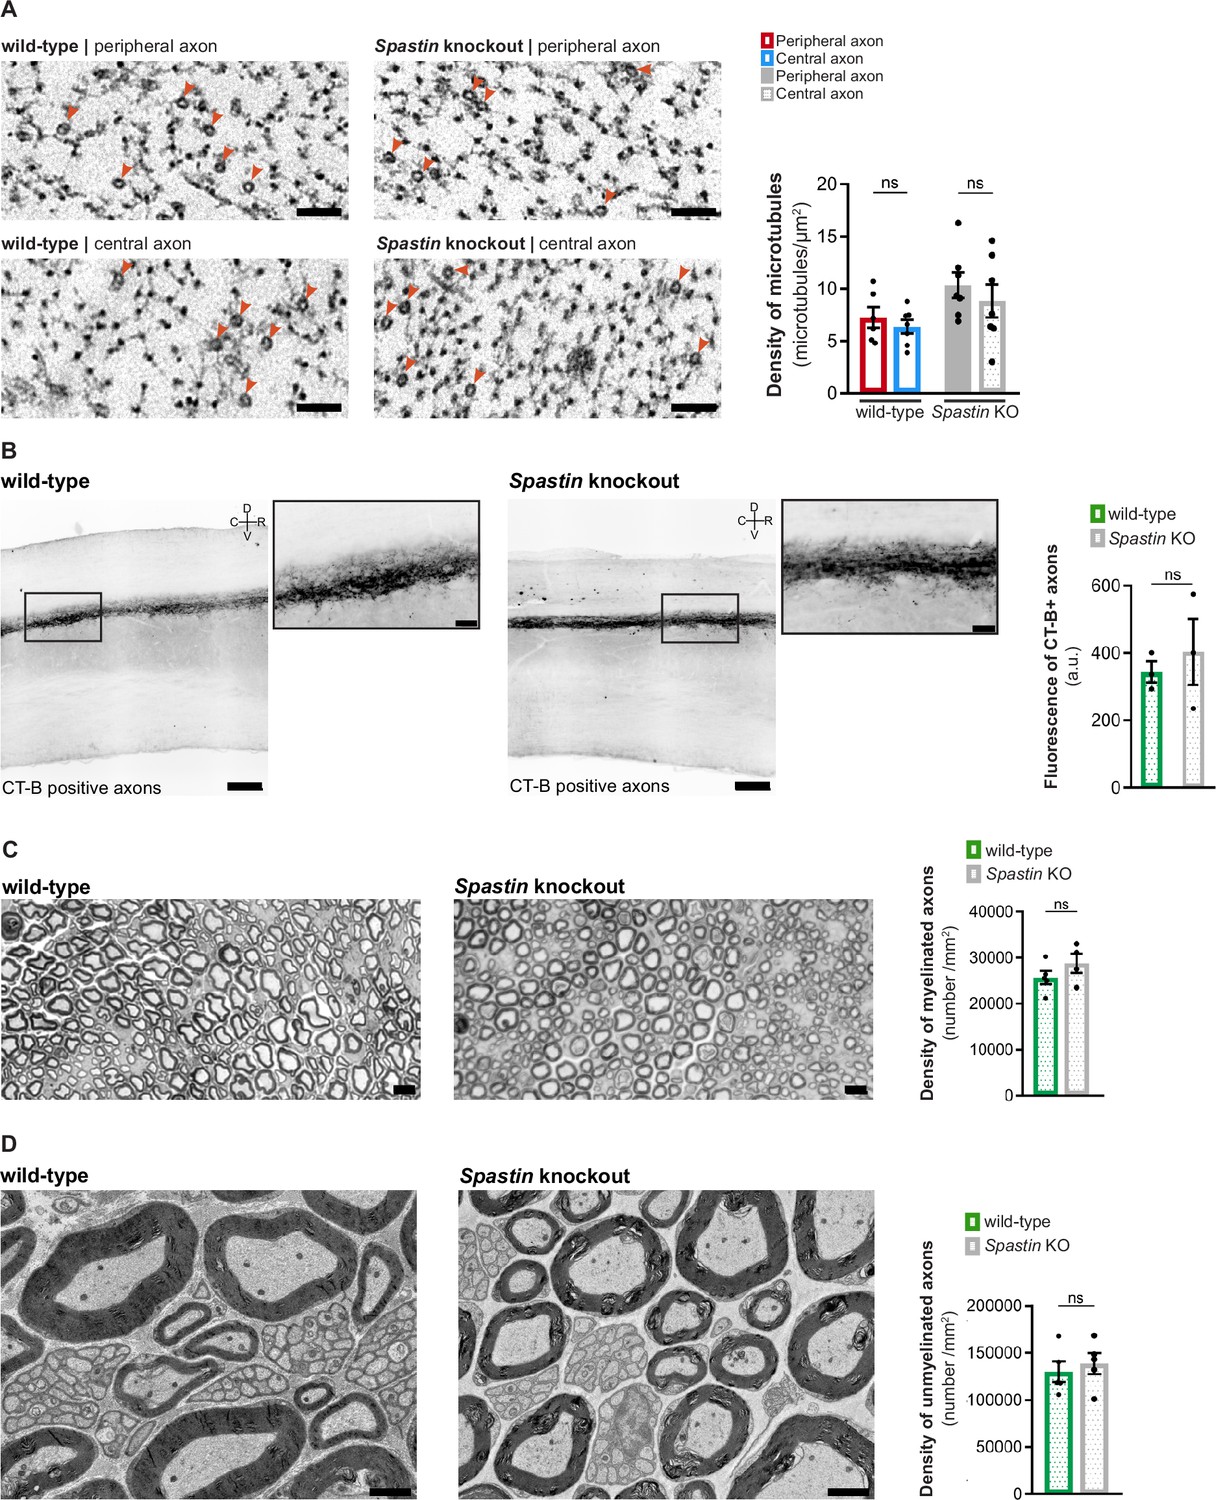
(A) Representative electron microscopy images (left) and respective quantification (right) of the total density of axonal microtubules in wild-type and Spastin knockout peripheral and central dorsal root ganglion (DRG) axons (n = 6–7 animals, up to 10 axons/animal). Two-way ANOVA followed by Fisher’s LSD post hoc test, p=0.6030 wild-type peripheral-central axons and p=0.3615 Spastin knockout peripheral-central axons. (B) Representative images (left) of the dorsal column tract central axons of naive 15-week-old wild-type and Spastin knockout animals traced with cholera toxin-B (black) injection (zoom-ins of boxed regions are provided; Scale bars: 200 µm and 50 µm in zoom-ins) and respective quantification (n = 3 animals; up to six spinal cord sections analyzed per animal; unpaired t-test, p=0.5918) (right). (C) Representative images of sciatic nerve semi-thin sections of naive 15-week-old wild-type and Spastin knockout animals (left; scale bar, 10 µm) and respective quantification of myelinated axons (n = 4–5 animals, all myelinated axons in a complete nerve cross-section were quantified; unpaired t-test, p=0.2455) (right). (D) Representative electron microscopy images of the sciatic nerve of naive 15-week-old wild-type and Spastin knockout animals (left; scale bar, 2 µm) and respective quantification of unmyelinated axons (n = 5 animals, unmyelinated axons inside Remak bundles were quantified; paired t-test, p=0.6315) (right). Data are represented as mean ± SEM.
Figure 6
Microtubules in dorsal root ganglion (DRG) axons are distinctively regulated both in vivo and in vitro.
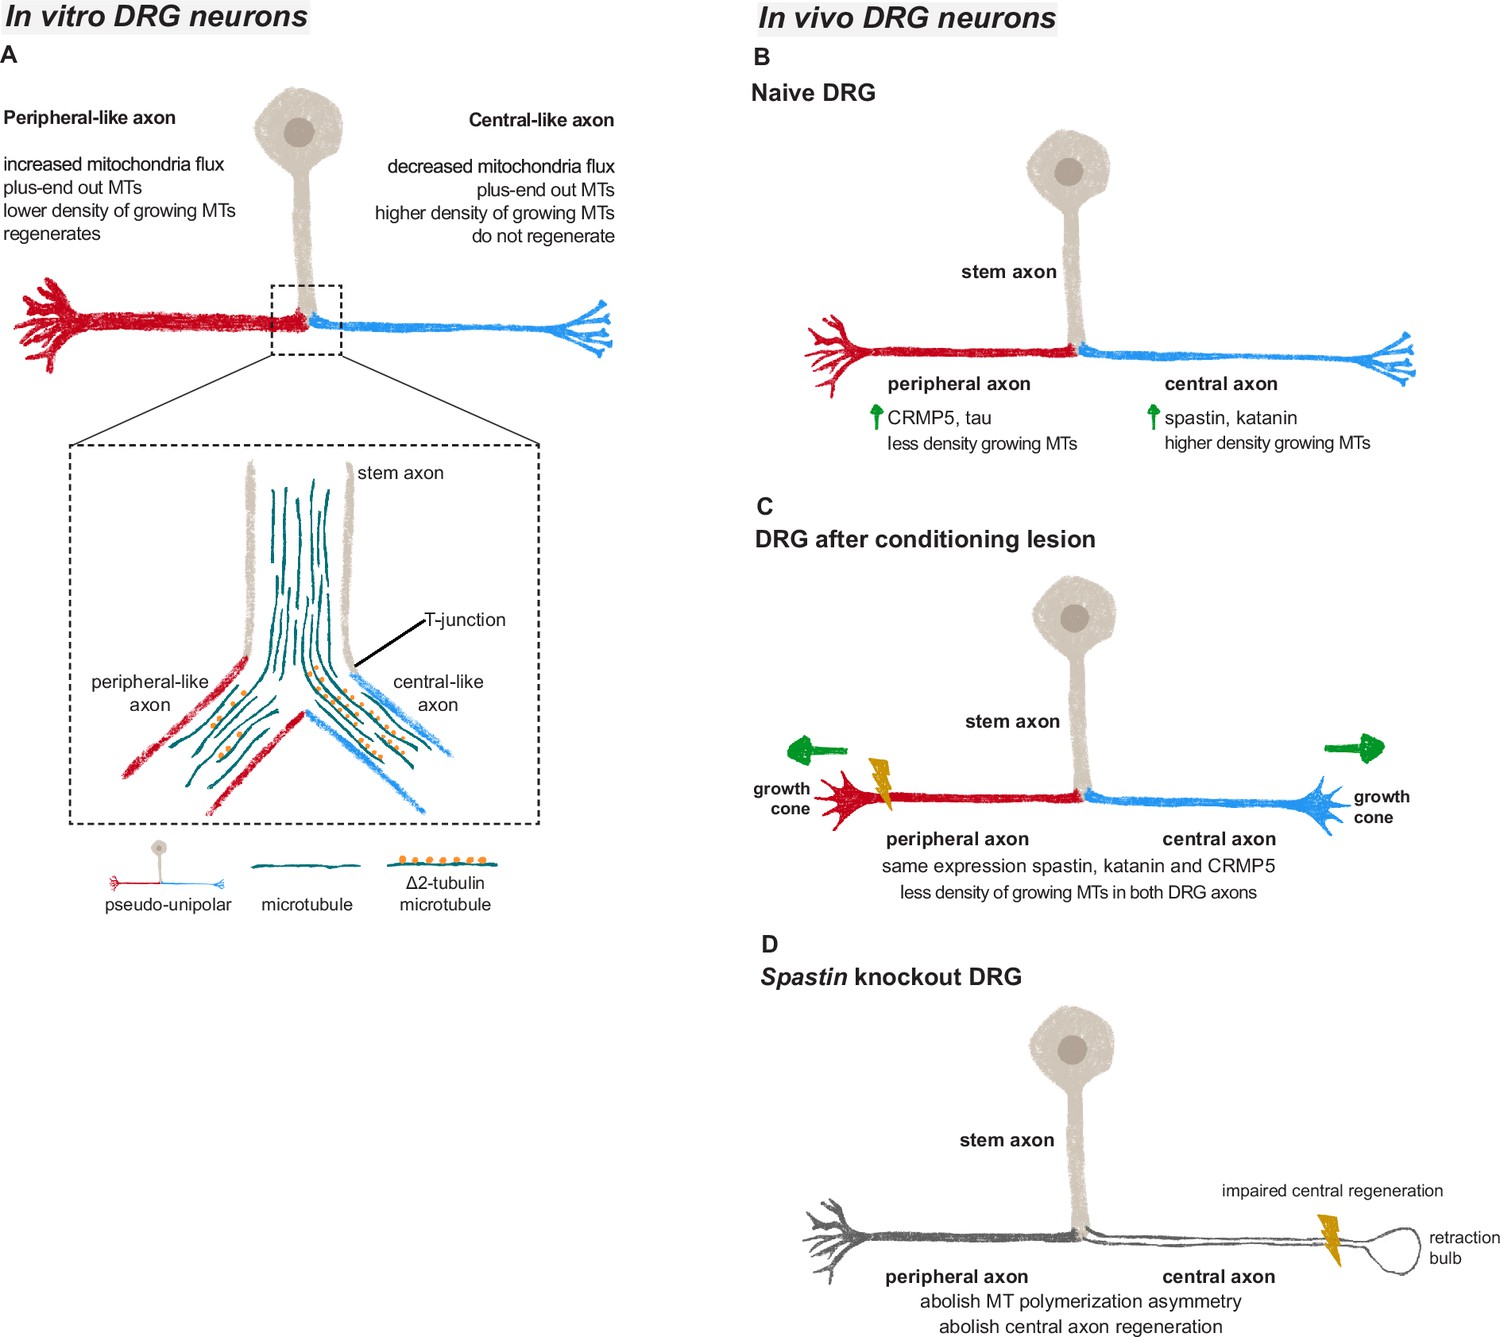
(A) In vitro DRG cultures replicate in vivo asymmetry in microtubule polymerization (established already at the bipolar stage) and reveal a potential cargo filtering mechanism operating at the DRG T-junction, where a higher continuum of microtubules from the stem axon to the central-like axonal branch is found, together with increased levels of Δ2 tubulin in the central-like axonal branch. (B) Under physiological conditions, peripheral DRG axons show a decreased density of growing microtubules when compared to central axons due to an asymmetric MAP signature. (C) After a peripheral conditioning lesion, the DRG axon MAP signature is remodeled, leading to a decrease in the density of growing microtubules and regeneration of both peripheral and central axons. (D) Perturbing the DRG MAP signature by knocking out Spastin abolishes DRG axon asymmetry and central axon regeneration following conditioning lesion.
Tables
Appendix 1—key resources table
| Reagent type (species) or resource | Designation | Source or reference | Identifiers | Additional information |
|---|---|---|---|---|
| Strain, strain background (Rattus norvegicus) | Wistar rats | Charles River | Strain Code 003 | |
| Strain, strain background (Mus musculus) | C57BL/6 | Charles River | Strain Code 027 RRID:MGI:2159769 | |
| Strain, strain background (M. musculus) | Thy1-EB3-eGFP | From Thomas Misgeld Group | ||
| Strain, strain background (M. musculus) | Spastin knockout | From Matthias Kneussel Group | ||
| Transfected construct (M. musculus) | Lentivirus CMV-EB3-GFP | Plasmid from Frank Polleux | Lentiviral construct to transduce DRG cells with EB3-GFP. | |
| Transfected construct (M. musculus) | AAVPHP.S-CMV-eGFP | VectorBuilder | Cat# VB010000-9394npt | AAV construct to transduce DRG cells with eGFP. |
| Transfected construct (M. musculus) | Lentivirus synapsin-Tom20-GFP | Charité NeuroCure, University of Berlin | Cat# BLV-569a | Lentiviral construct to transduce DRG cells with Tom20-GFP. |
| Antibody | Anti-tyrosinated tubulin [YL1/2] (rat monoclonal) | Abcam | Cat# ab6160 RRID:AB_305328 | WB (1:5000) |
| Antibody | Anti-acetylated tubulin (mouse monoclonal) | Sigma-Aldrich | Cat# T7451 RRID:AB_609894 | WB (1:10,000) |
| Antibody | Anti-Δ2 tubulin (rabbit polyclonal) | Millipore | Cat# AB3203 RRID:AB_177351 | IF cells (1:1000) WB (1:2000) |
| Antibody | Anti-polyglutamylated tubulin (rabbit polyclonal) | Adipogen | Cat# AG-25B-0030-C050 | IF cells (1:1000) WB (1:10,000) |
| Antibody | Anti-spastin (mouse monoclonal) | Santa Cruz | Cat# sc-81624 RRID:AB_2286628 | WB (1:500) |
| Antibody | Anti-katanin p60 (rabbit polyclonal) | Proteintech | Cat# 17560-1-AP RRID:AB_10694670 | IF tissue (1:500) WB (1:500) |
| Antibody | Anti-tau (mouse monoclonal) | Cell Signalling | Cat# 4019 | IF tissue (1:100) WB (1:1000) |
| Antibody | Anti-CRMP5 (rat monoclonal) | Santa Cruz | Cat# sc-58515 RRID:AB_782270 | IF tissue (1:200) WB (1:200) |
| Antibody | Anti-vinculin (rabbit monoclonal) | Invitrogen | Cat# 700062 | WB (3:10,000) |
| Antibody | Anti-CT-B primary (goat polyclonal) | List Biologicals | Cat# 703 RRID:AB_10013220 | IF tissue (1:30,000) |
| Antibody | Biotinylated horse anti-(goat polyclonal) | Vector Laboratories | Cat# BA-9500 RRID:AB_2336123 | IF tissue (1:30,000) |
| Antibody | Anti-myelin basic protein (rabbit polyclonal) | Proteintech | Cat# 10458-1-AP RRID:AB_2336123 | IF tissue (1:1000) |
| Antibody | Anti-βIII-tubulin (rabbit polyclonal) | Synaptic Systems | Cat# 302302 RRID:AB_10637424 | IF tissue (1:200) IF cells (1:1000) |
| Antibody | Anti-βIII-tubulin (mouse monoclonal) | Promega | Cat# G7121 RRID:AB_430874 | IF tissue (1:500) IF cells (1:1000) |
| Antibody | Alexa Fluor 647 anti-(rabbit polyclonal) | Jackson ImmunoResearch | Cat# 711-605-152 RRID:AB_2492288 | IF tissue and cells (1:500) |
| Antibody | Alexa Fluor 594 anti-(mouse polyclonal) | Jackson ImmunoResearch | Cat# 715-585-150 RRID:AB_2340854 | IF tissue (1:250) IF cells (1:500) |
| Antibody | Alexa Fluor 488 anti-(rabbit polyclonal) | Jackson ImmunoResearch | Cat# 711-545-152 RRID:AB_2313584 | IF tissue (1:250) IF cells (1:500) |
| Antibody | Alexa Fluor 594 anti-(rabbit polyclonal) | Invitrogen | Cat# A21207 | IF cells (1:500) |
| Sequence-based reagent | RNAscope Probe Mm-Dpysl5-C2 | Advanced Cell Diagnostics | Cat# 1112131-C2 | |
| Sequence-based reagent | RNAscope Probe Mm-Spast | Advanced Cell Diagnostics | Cat# 849171 | |
| Chemical compound, drug | Cholera toxin-B | List Biologicals | Cat# 103B | |
| Chemical compound, drug | Protease inhibitors | Roche | Cat# 04693124001 | |
| Chemical compound, drug | 4–20% acrylamide gels | Bio-Rad | Cat# 5671093 | |
| Chemical compound, drug | Nitrocellulose membranes | GE Healthcare Life Sciences | Cat# 10600013 | |
| Chemical compound, drug | M.O.M. blocking reagent | Vector Laboratories | Cat# MKB-2213, RRID:AB_2336587 | |
| Commercial assays or kit | Detergent Compatible Protein Assay | Bio-Rad | Cat# 5000116 | |
| Commercial assays or kit | RNAscope Intro Pack for Multiplex Fluorescent Reagent Kit v2- Mm | Advanced Cell Diagnostics | Cat# 323136 | |
| Software, algorithm | Image Lab Software for PC Version 6.1 | Bio-Rad | RRID:SCR_014210 | |
| Software, algorithm | IQ 2 software | Andor Technology | N/A | |
| Software, algorithm | Fiji/ImageJ 1.53t software | NIH | RRID:SCR_002285 | |
| Software, algorithm | Leica Application Suit X software | Leica | RRID:SCR_013673 | |
| Software, algorithm | Leica LasAF software Version 2.6.3.8173 | Leica | N/A | |
| Software, algorithm | Slidebook software Version 2022 | 3i | RRID:SCR_014423 | |
| Software, algorithm | IN Cell Developer Toolbox software | GE Healthcare | N/A | |
| Software, algorithm | Cell B software | Olympus | N/A | |
| Software, algorithm | Adobe Photoshop | Adobe | RRID:SCR_014199 | |
| Software, algorithm | GraphPad Prism 8 | GraphPad | RRID:SCR_002798 | |
| Other | PureBlu DAPI Nuclear Staining Dye | Bio-Rad | Cat# 1351303 | Highly pure formulation of DAPI (4',6-diamidino-2-phenylindole), a well-characterized blue-emitting fluorescent compound widely utilized for nuclear staining |
| Other | Alexa Fluor 568-streptavidin | Invitrogen | Cat# S11226 RRID:AB_2315774 | Streptavidin covalently attached to a fluorescent label (Alexa Fluor dye) IF tissue (1:1000) |
| Other | Opal Dye 520 | Akoya | Cat# FP1487001KT | Opal dyes are fluorescent dyes commonly used in multiplex immunofluorescence in a single tissue sample by using tyramide signal amplification IF tissue (1:750) |
| Other | Opal Dye 620 | Akoya | Cat# FP1495001KT | Opal dyes are fluorescent dyes commonly used in multiplex immunofluorescence in a single tissue sample by using tyramide signal amplification IF tissue (1:750) |
| Other | Glass-bottom 4-well chambered coverslips | Ibidi | Cat# 80427 | Chambered coverslip with 1.5H glass bottom enabling live cell imaging |
| Other | Glass-bottom 35 mm imaging dish | Ibidi | Cat# 81158 | 1.5H glass bottom used for live imaging |
| Other | Micro-feather ophthalmic scalpel | Delta Microscopes | Cat# 72045-45 | High-precision surgical blade with 45° used to perform spinal cord dorsal hemisection |
| Other | Fuji Medical X-Ray Film | Fujifilm | Cat# 16195209 | Blue sensitive universal film used for imaging chemiluminescent signals in western blot membranes |
| Other | Molecular Imager GS800 | Bio-Rad | Cat #170-7980 | Densitometer used for imaging and quantifying protein bands on X-ray films |
| Other | ChemiDoc Imaging System | Bio-Rad | Cat# 12003153 | Allows sensitive imaging of chemiluminescent western blots membranes |
Additional files
Download links
A two-part list of links to download the article, or parts of the article, in various formats.
Downloads (link to download the article as PDF)
Open citations (links to open the citations from this article in various online reference manager services)
Cite this article (links to download the citations from this article in formats compatible with various reference manager tools)
Axon-specific microtubule regulation drives asymmetric regeneration of sensory neuron axons
eLife 13:RP104069.
https://doi.org/10.7554/eLife.104069.3


