Lovastatin fails to improve motor performance and survival in methyl-CpG-binding protein2-null mice
- Istituto di Ricerche Farmacologiche Mario Negri, Italy
Figures
Figure 1
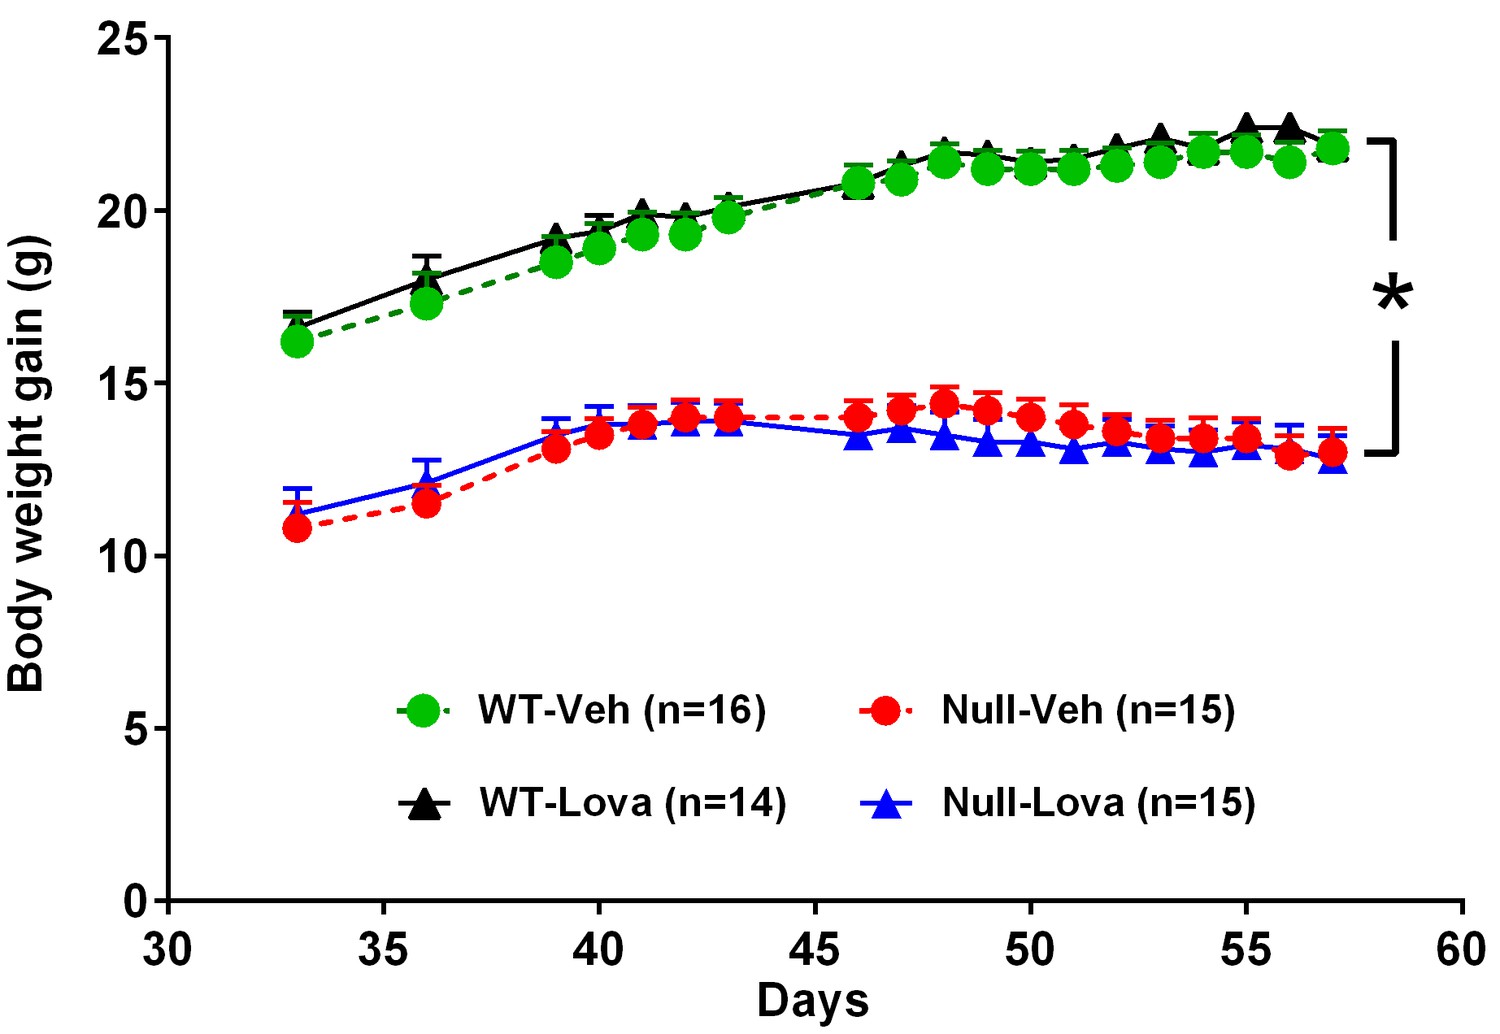
Body weight gain in Mecp2-null and WT mice and effect of lovastatin.
Mice were given vehicle (Veh) or 1.5 mg/kg lovastatin (Lova), twice weekly, from day 35 to 57. Body weight in Mecp2-null (Null) mice was significantly lower than in WT. Lovastatin had no significant effects on body weight gain in both genotypes. The number of mice per group is shown in parentheses. *p<0.05 vs. WT (Tukey’s test).
-
Figure 1—source data 1
Source file for body weight gain.
The excel file contains body weight gain of individual mice from postnatal day 35 to 57 for each experimental group.
- https://doi.org/10.7554/eLife.22409.003
Figure 2
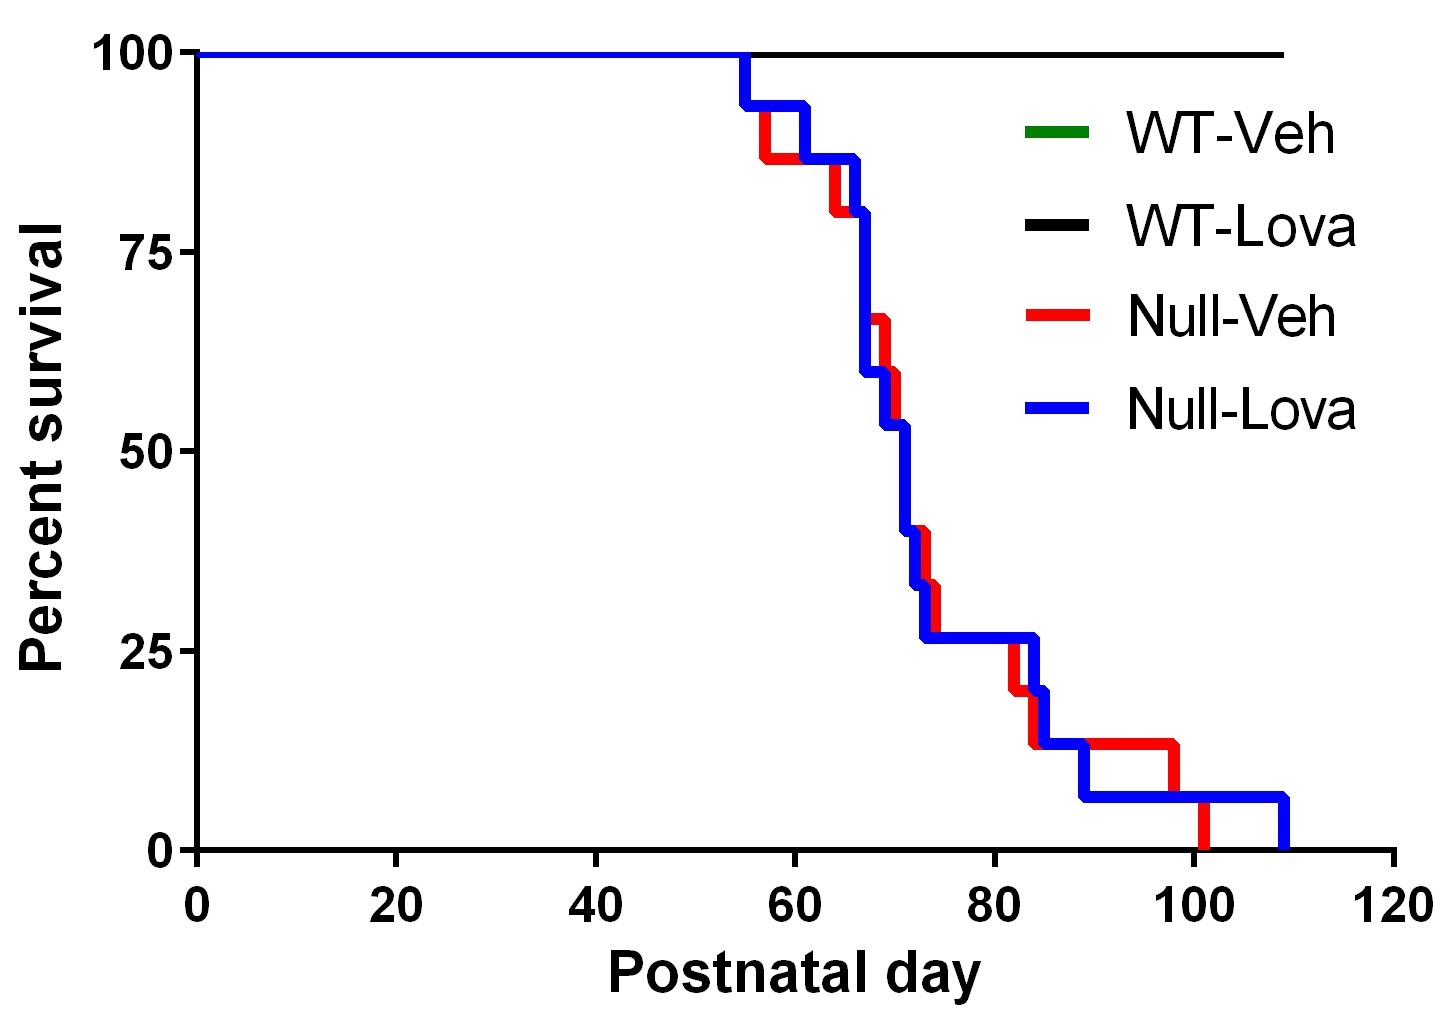
Survival curves.
Kaplan-Meier plot showing premature mortality in Mecp2-null (Null) and WT mice given vehicle (Veh) or lovastatin (Lova). Median survival was 71 days in both vehicle- and lovastatin-treated mice. No mortality was seen in WT mice given either vehicle or lovastatin.
Figure 3
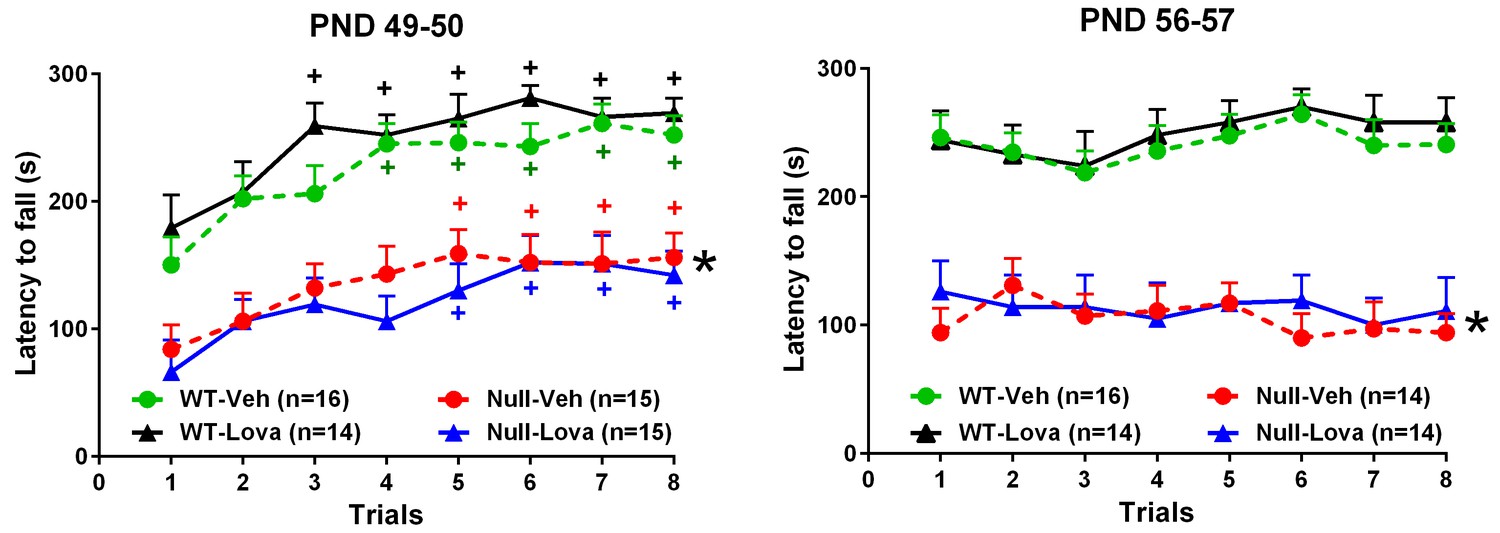
Rotarod.
Effect of lovastatin (Lova) and vehicle (Veh) in Mecp2-null (Null) and WT mice in the rotarod test. Starting on PND 35, mice were given Lova (1.5 mg/kg s.c) or Veh twice weekly and tested on the rotarod 24 hr (trials 1–4) and 48 hr (trials 5–8) after the last dose of the chronic schedule. The test was repeated one week later (PND 56 and 57). The number of mice in each group is shown in parentheses. Mutant mice displayed reduced motor performance compared to WT (*p<0.05 vs. WT mice, Tukey’s test), but improved their performance over repeated trials (+P < 0.05 vs. trial 1; Tukey’s test). Lovastatin had no significant effects on latency to fall at PND 49–50 and 56–57 in both genotypes.
-
Figure 3—source data 1
Source file for latency to fall in the rotarod test.
The source file contains latency to fall in seconds of individual mice exposed to rotarod test on PND49-50 (page 1) and PND 56–57 (page 2) for each trial. For each mice the ear tag number, treatment code (A or B corresponding to lovastatin and vehicle), genotype and cohort (cohort 2, 3, 4 and 5) is provided.
- https://doi.org/10.7554/eLife.22409.006
Figure 4
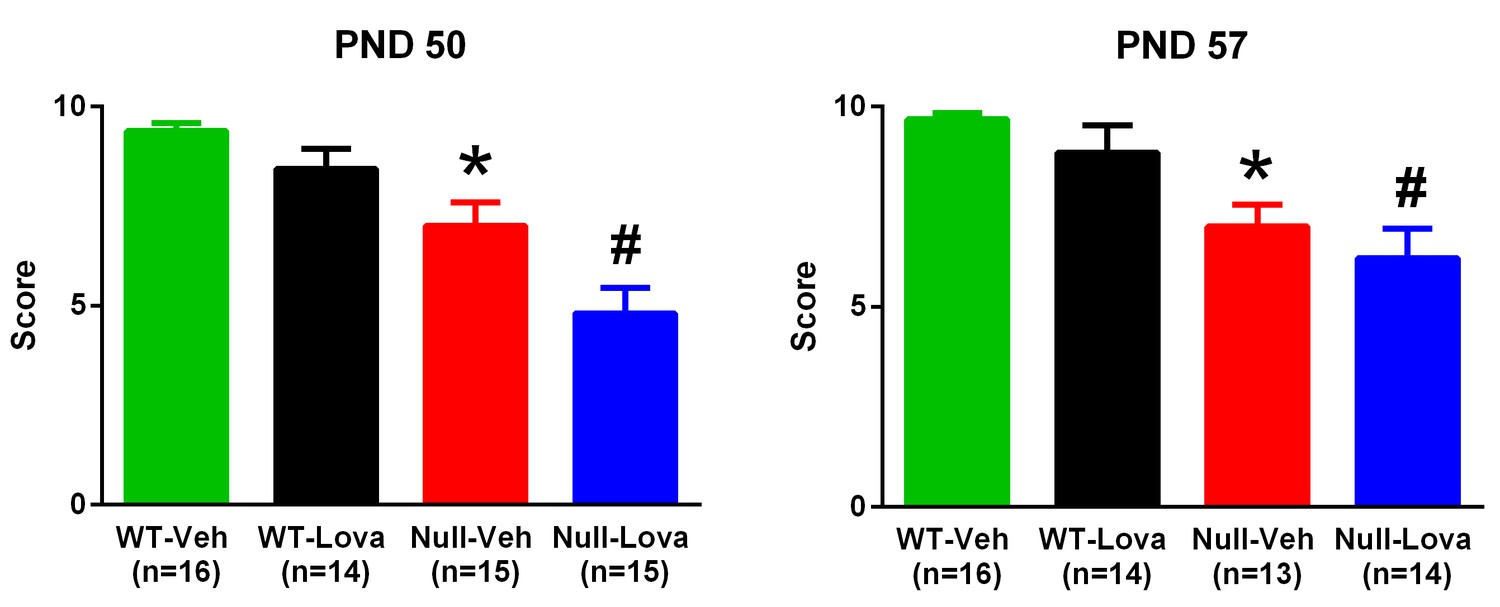
Hanging-wire test.
Thirty-five days old Mecp2-null (Null) and WT mice were given 1.5 mg/kg lovastatin (Lova) and Vehicle (Veh) twice weekly and their performance in the hanging-wire test was assessed on PND 50 and 57. The mice were the same as those used for the rotarod test. The number of mice in each group is shown in parentheses. *p=0.006 vs. WT-Veh, #p=0.0007 vs. WT-Lova (Dunn’s test). Lovastatin had no significant effects on the score at PND 49–50 and 56–57 in either genotype.
-
Figure 4—source data 1
Source file for hanging-wire scores.
The source file contains the scores of individual mice exposed to hanging-wire test on PND50 and PND 57. For each mice the ear tag number, treatment code (A or B corresponding to lovastatin and vehicle), genotype and cohort (2, 3, 4 and 5) is provided.
- https://doi.org/10.7554/eLife.22409.008
Figure 5
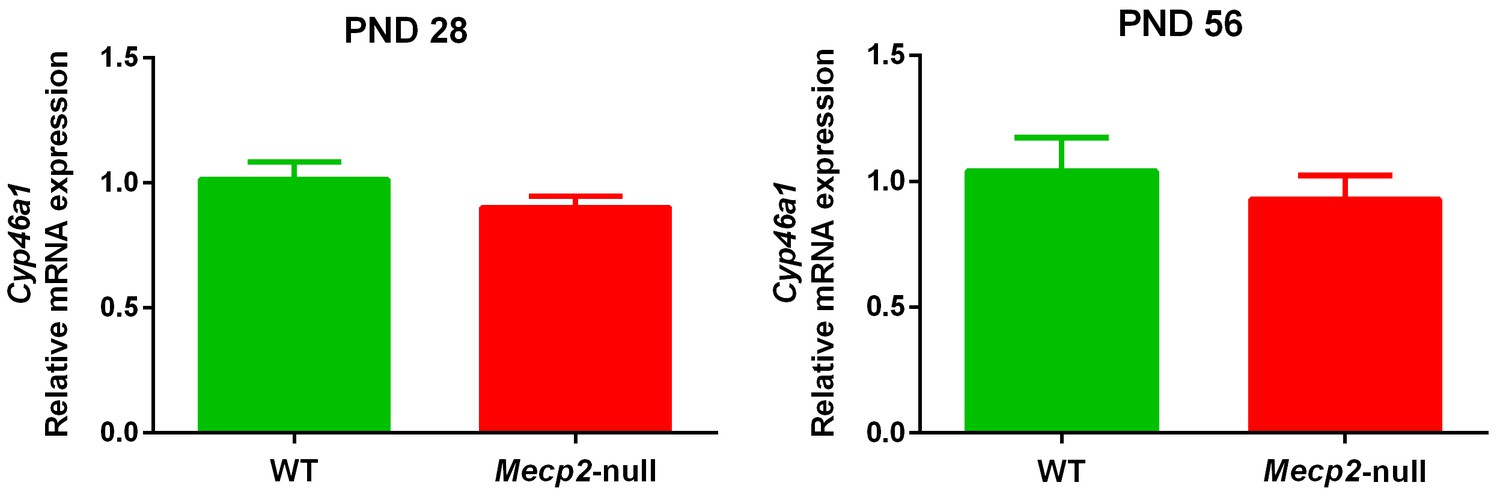
Cyp46a1 expression.
mRNA expression of Cyp46a1 in the brain of 28 (PND28) and 56 (PND56) day old Mecp2-null and WT male mice. Expression levels were relative to respective WT. Data are means ± SEM of 7 mice per group. No significant differences were observed between WT and Mecp2-null mice at PND28 (p=0.21) and PND56 (p=0.51) (Student’s t-test).
-
Figure 5—source data 1
Source file for brain mRNA expression of Cyp46a1.
The source file contains raw data and data processing for the calculation of brain mRNA expression of Cyp46a1 in individual wild type and Mecp2-null mice at PND28 and PND56.
- https://doi.org/10.7554/eLife.22409.014
Figure 6
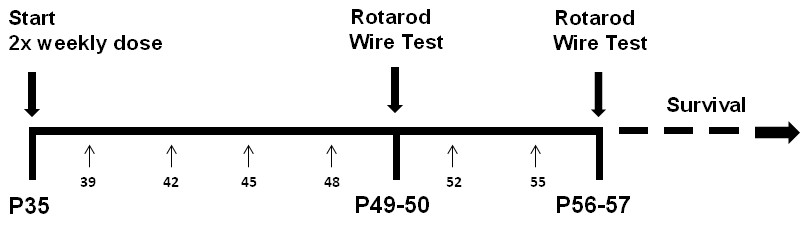
Lovastatin injection and behavioural testing schedule.
Treatment with 1.5 mg/kg lovastatin or vehicle subcutaneously started at postnatal day 35 (P35) and was repeated every 3–4 days. Small arrows and numbers below the horizontal line indicate the exact postnatal day. Rotarod was done on day 49 (trials 1–4) and 50 (trials 5–8) and repeated on days 56 and 57 (morning). Hanging-wire test was administered on day 50 and repeated on day 57 (afternoon). Last lovastatin injection was on day 55.
Tables
Table 1
Effect of Mecp2 deletion on serum and brain cholesterol levels.
Serum and brain levels of total cholesterol were expressed as mg/dL and mg/g, respectively. Cholesterol levels were measured in 28 (PND28) and 56 (PND56) day old Mecp2-null and WT mice. Food was removed from cage 6 hr before sacrifice. Data are means ± SEM of 5 mice per group. *p<0.05, **p<0.01 vs. WT (Student’s t-test).
| Genotype | Serum | Brain | ||
|---|---|---|---|---|
| PND 28 | PND 56 | PND 28 | PND 56 | |
| WT | 99.2 ± 6.8 | 90.8 ± 4.8 | 9.1 ± 0.3 | 10.9 ± 0.5 |
| Mecp2-null | 81.7 ± 2.0* | 66.5 ± 5.4** | 9.1 ± 0.5 | 10.3 ± 0.5 |
-
Table 1—source data 1
Source file for serum and brain levels of cholesterol.
The source file contains the concentrations of serum (mg/dL) and brain (mg/g) cholesterol in individual wild type and Mecp2-null mice at PND 28 and PND56.
- https://doi.org/10.7554/eLife.22409.010
Table 2
Effect of Mecp2 deletion on brain levels of 24S-OHC.
Brain levels of 24S-OHC, expressed as ng/mg of tissue, were measured in 28 (PND28) and 56 (PND56) day old Mecp2-null and WT male mice and in PND177 Mecp2+/- females and WT mice. Food was removed from cage 6 hr before sacrifice. Data are means ± SEM of 5–6 mice per group. **p<0.01, ***p<0.001 vs. WT (Student’s t-test).
| Genotype | Males | Females | |
|---|---|---|---|
| PND28 | PND56 | PND177 | |
| WT | 37.5 ± 0.8 | 38.4 ± 0.8 | 48.9 ± 0.7 |
| Mecp2 mutant | 36.1 ± 0.4 | 34.6 ± 0.6** | 43.0 ± 0.6*** |
-
Table 2—source data 1
Source file for brain levels of 24S-hydroxycholesterol.
The source file contains the concentrations of brain (ng/g) 24S-OHC in individual wild type and Mecp2-null male mice on PND28 and PND56 and WT and Mecp2+/- females on PND177. Each mice is identified by the ear tag number.
- https://doi.org/10.7554/eLife.22409.012
Additional files
-
Supplementary file 1
Instrumental conditions for the HPLC-MS analysis of hydroxysterols.
- https://doi.org/10.7554/eLife.22409.016
Download links
A two-part list of links to download the article, or parts of the article, in various formats.
Downloads (link to download the article as PDF)
Open citations (links to open the citations from this article in various online reference manager services)
Cite this article (links to download the citations from this article in formats compatible with various reference manager tools)
Lovastatin fails to improve motor performance and survival in methyl-CpG-binding protein2-null mice
eLife 5:e22409.
https://doi.org/10.7554/eLife.22409


