Neurobehavioral evidence of interoceptive sensitivity in early infancy
- Royal Holloway University of London, United Kingdom
- University of London, United Kingdom
- Birkbeck University of London, United Kingdom
Figures
Figure 1 with 2 supplements
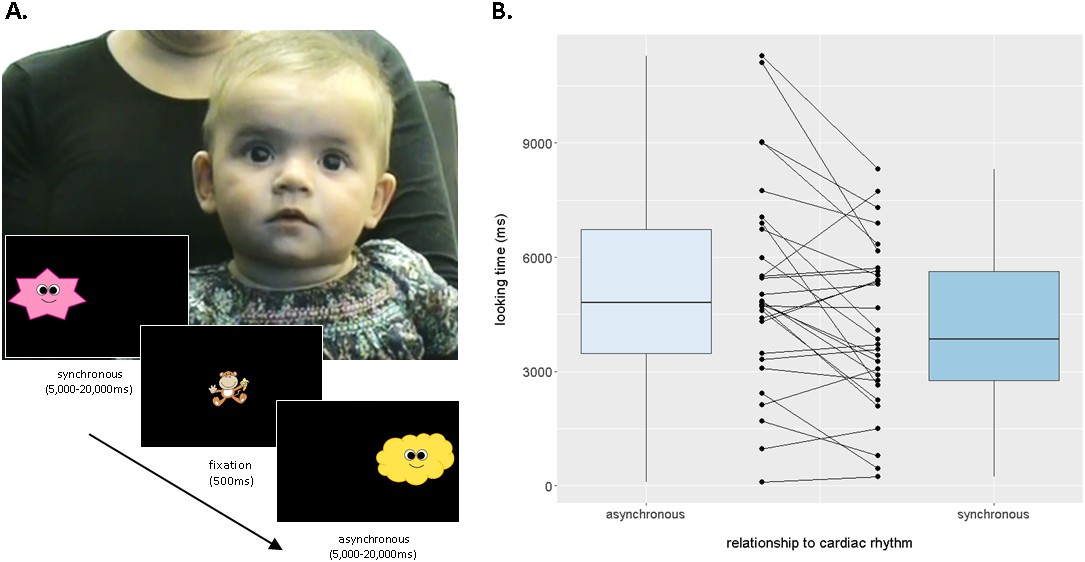
Infants differentiate between synchronous and asynchronous cardiac rhythms in a sequential looking paradigm (iBEAT task).
(A) iBEAT paradigm. Infants viewed trials alternating between synchronous and asynchronous cardiac rhythms, presented either on the left or right of the screen. Stimuli remained on the screen for 5000 ms, after which time its continued presentation depended on infant attention (max. 20,000 ms). Informed consent was obtained from the caregiver of the infant featured in Figure 1A. (B) Boxplot quantification of average looking times (ms) to stimuli that were asynchronous or synchronous with infants’ own cardiac rhythm (N = 29 infants, paired t-test, p=0.0029). Strip-chart points indicate pairs of raw data points from individual infants, reflecting individual differences in looking behaviours. Boxplot whiskers denote ±1.5*interquartile range limits.
-
Figure 1—source data 1
Mean looking times (ms) for individual infants for synchronous, asynchronous-faster, asynchronous-slower and (composite) asynchronous trials.
Data used for Figure 1B and Figure 1—figure supplement 1.
- https://doi.org/10.7554/eLife.25318.004
Figure 1—figure supplement 1
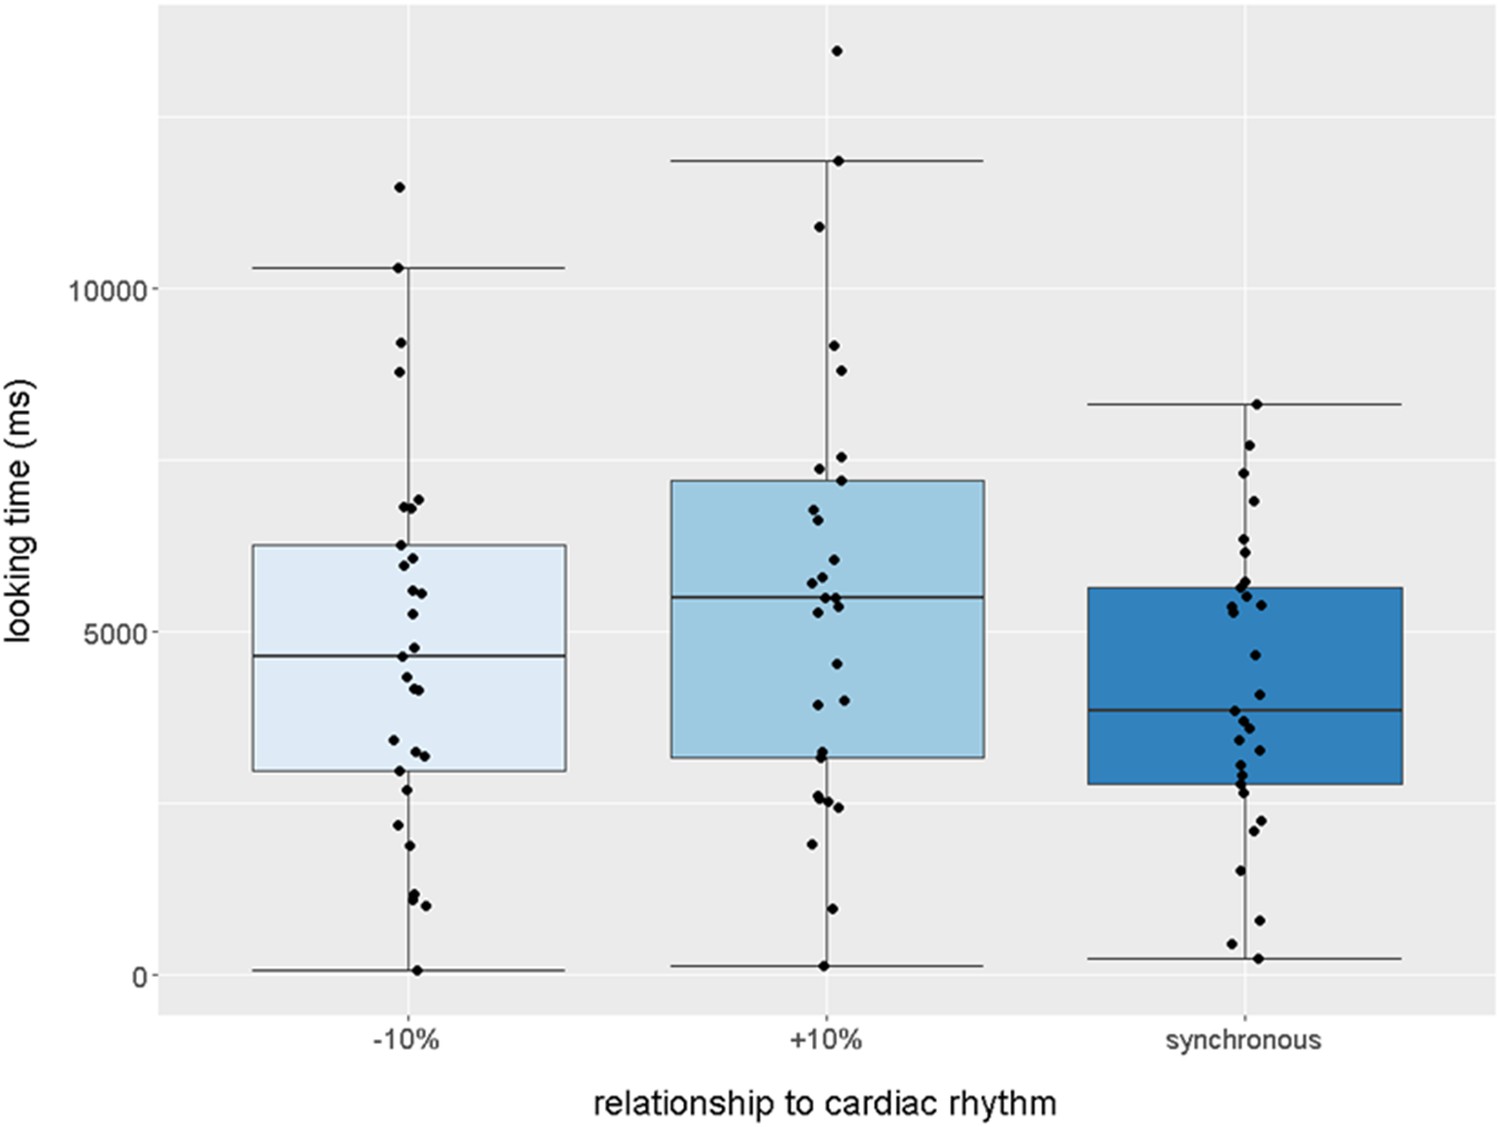
Boxplot quantification of average looking times (ms) to stimuli that were −10% (slower),+10% (faster), or synchronous with infants’ own cardiac rhythm (N = 29 infants, paired one-tailed t-tests, synchronous stimulus received less attention than both slower, p=0.029 and faster stimuli, p=0.0025).
Points indicate individual infants, boxplot whiskers denote ±1.5*interquartile range.
Figure 1—figure supplement 2
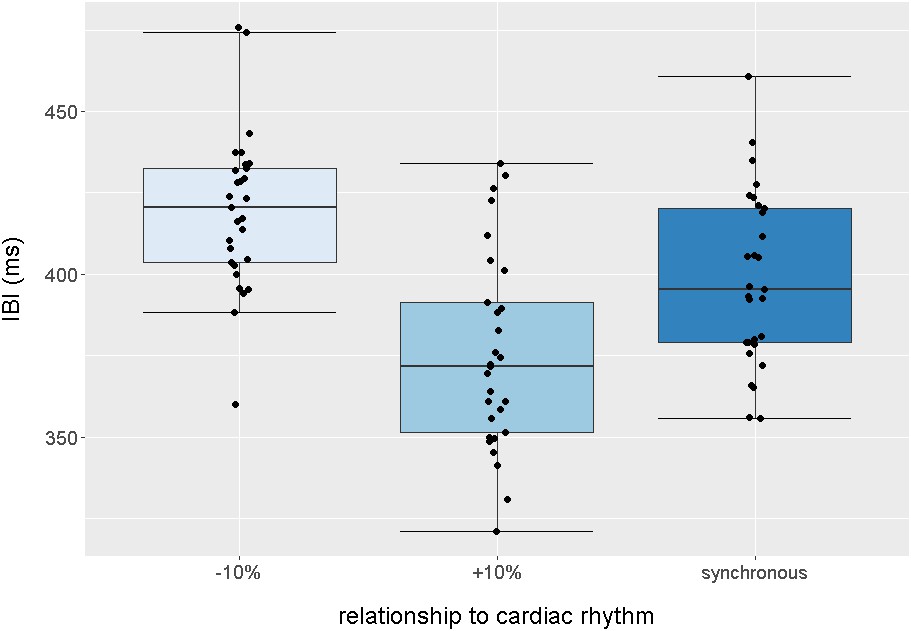
Boxplot quantification of average intervals (ms) between each audiovisual beat presented in the −10% (slower),+10% (faster) and synchronous trials, across the entire task.
Points indicate individual infants, boxplot whiskers denote ±1.5*interquartile range.
Figure 2 with 1 supplement
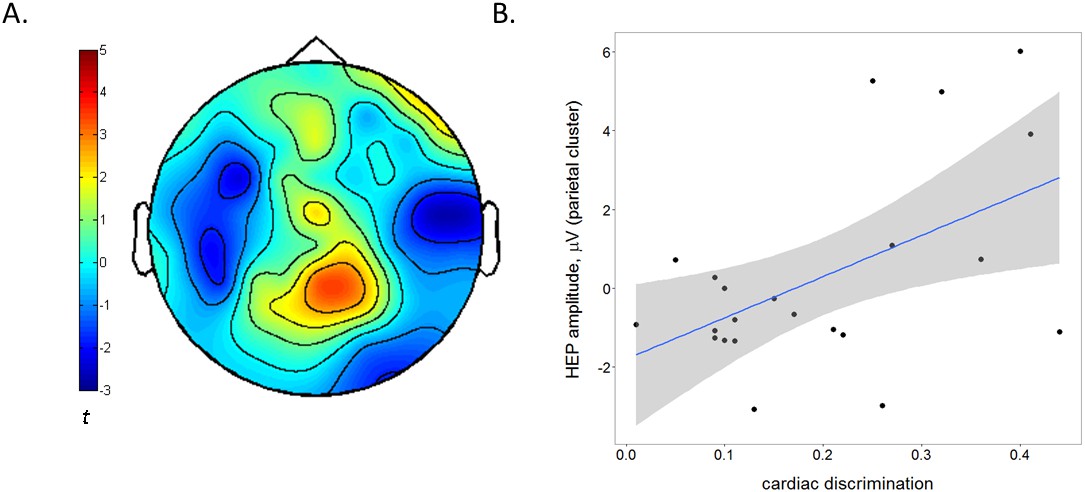
The amplitude of the Heartbeat Evoked Potential is related to individual differences in infants' behavioural cardiac discrimination.
(A) Topographical representation of the significant midline parietal cluster in which HEP positively correlated with cardiac discrimination on the iBEAT task (N = 22 infants, Monte-Carlo cluster regression, p=0.019). Colorbar represents cluster statistic (t). (B) Scatterplot illustrating the positive correlation between cardiac discrimination and HEP amplitude. Shaded area represents 95% confidence interval of fitted regression line, r = 0.52, p=0.013. HEP amplitude is the subject-wise average signal from the midline parietal cluster (P2, POz and Pz) across the 206–272 ms time window of all HEP segments (irrespective of emotion observation).
-
Figure 2—source data 1
Cardiac discrimination scores presented for each infant, alongside mean HEP amplitude from the parietal cluster (POz, Pz, P2) in μV.
Data used for Figure 2B.
- https://doi.org/10.7554/eLife.25318.008
Figure 2—figure supplement 1
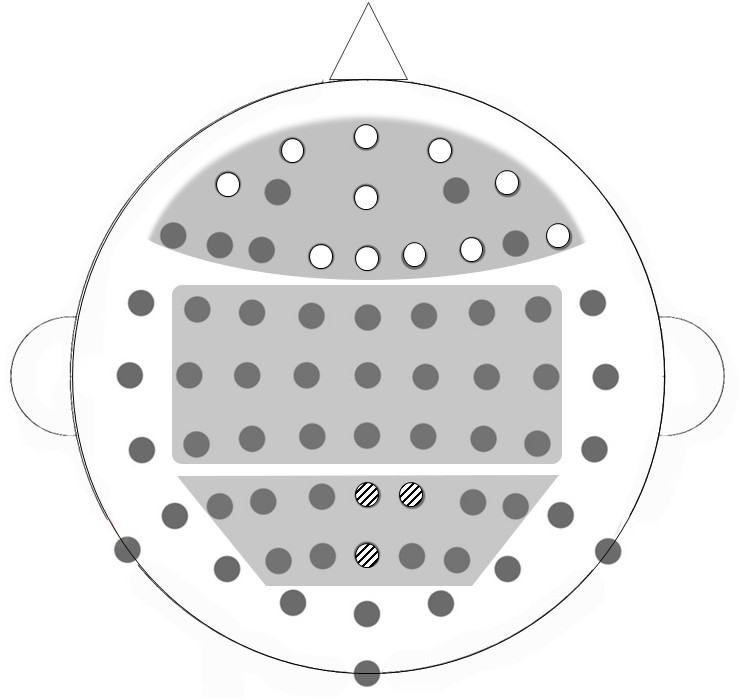
Broad bilateral ROIs selected for HEP analysis; frontal, central and parietal regions, illustrated on a BioSemi 64-channel 10/20 system.
Electrodes that were significantly modulated by emotional expression (F1, Fp1, Fp2, AF8, AF7, Fz, Fpz, AFz, F2, F4, F8) are highlighted in white; electrodes that were significantly related to cardiac discrimination in the iBEAT task (POz, Pz, P2) are highlighted with black stripes.
Figure 3

The Heartbeat Evoked Potential is modulated by infants' observation of negative emotional expressions.
(A) Average HEP amplitude (across representative frontal channels common to fear- and anger-specific clusters) for the four emotion conditions. Shaded region represents the time-window analysed. (B) Topographical representation of positive frontal clusters, showing significantly higher activity during negative emotion (i.e. fear and anger) versus neutral observation (N = 22 infants, Monte-Carlo cluster analysis, p≤0.002). Averaged across 150–300 ms period. Colour bar shows Monte-Carlo cluster statistic (t). (C) Average ECG signal across the four emotion observation conditions.
Tables
Table 1
Mean number of valid, artefact-free trials in the iBEAT task included in the final sample, for each age group and condition. Standard deviation from the mean indicated in brackets. This table relates to the data displayed in Figure 1.
| Average number of trials completed (SD) | |||
|---|---|---|---|
| Synchronous | Asynch - slower | Asynch - faster | Total |
| 7.18 (2.96) | 4.04 (1.62) | 3.82 (1.47) | 15.04 (4.87) |
Table 2
Mean number of trials, heartbeats and valid HEP segments extracted for each emotion condition (standard deviation in brackets), N = 22. This table relates to data displayed in Figure 3.
| Condition: | Happiness | Fear | Anger | Neutral |
|---|---|---|---|---|
| Average Number of Trials | 12.5 (3.6) | 12.4 (3.6) | 12.7 (3.7) | 12.7 (3.6) |
| Average Number of Heartbeats | 46.6 (12.6) | 45.8 (12.3) | 46.3 (12.7) | 47.4 (12.8) |
| Average Number of HEP segments | 22.0 (13.9) | 21.3 (13.9) | 23.8 (13.9) | 21.8 (15.0) |
Download links
A two-part list of links to download the article, or parts of the article, in various formats.
Downloads (link to download the article as PDF)
Open citations (links to open the citations from this article in various online reference manager services)
Cite this article (links to download the citations from this article in formats compatible with various reference manager tools)
Neurobehavioral evidence of interoceptive sensitivity in early infancy
eLife 6:e25318.
https://doi.org/10.7554/eLife.25318


