The last common ancestor of animals lacked the HIF pathway and respired in low-oxygen environments
- University of Southern Denmark, Denmark
- Ludwig-Maximilians-Universität München, Germany
- SNSB - Bayerische Staatssammlung für Paläontologie und Geologie, Germany
Figures
Figure 1 with 1 supplement
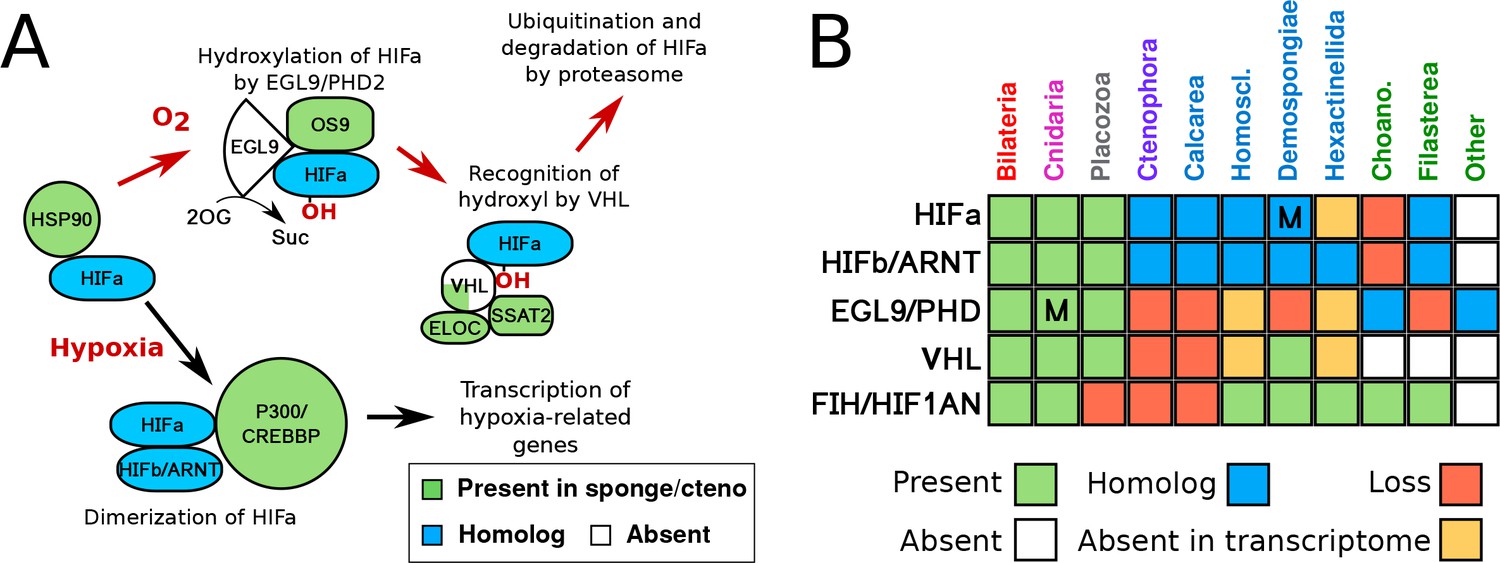
HIF pathway overview.
(A) Schematic of HIF pathway, based on Semenza (2007), showing conservation of components. Red arrows indicate the characterised oxygen-dependent pathway, which is predicted to be absent in sponges and ctenophores. (B) Presence-absence matrix of components of the HIF pathway across metazoans and other opisthokont groups. Labels for all four sponge classes are shown in blue. Abbreviations are: Homoscl., Homoscleromorpha; Choano., Choanoflagellata. Presence (green) refers to a 1-to-1 or 1-to-many ortholog of a protein of defined function. Homolog (blue) refers to a sister group position in trees before duplications with different or unknown functions (usually many-to-many). Secondary loss (red) refers to the gene missing in the clade, but homologs are found in non-metazoan phyla. Multiple lineage-specific duplications are indicated by the letter ‘M’. Individual gene trees are shown in Figure 2, Figure 2—figure supplement 1–3.
Figure 1—figure supplement 1

Sulfide metabolism pathway.
(A) Presence and absence of enzymes involved in metabolism of cysteine and sulfide. Labels for all four sponge classes are shown in blue. Abbreviations are: Homoscl., Homoscleromorpha; Choano., Choanoflagellata. Presence (green) refers to a 1-to-1 or 1-to-many ortholog of a protein of defined function. Homolog (blue) refers to a sister group position in trees before duplications with different or unknown functions (usually many-to-many). Secondary loss (red) refers to the gene missing in the clade, but homologs are found in non-metazoan phyla. (B) Schematic of sulfide oxidation pathway in the mitochondria.
Figure 2 with 3 supplements
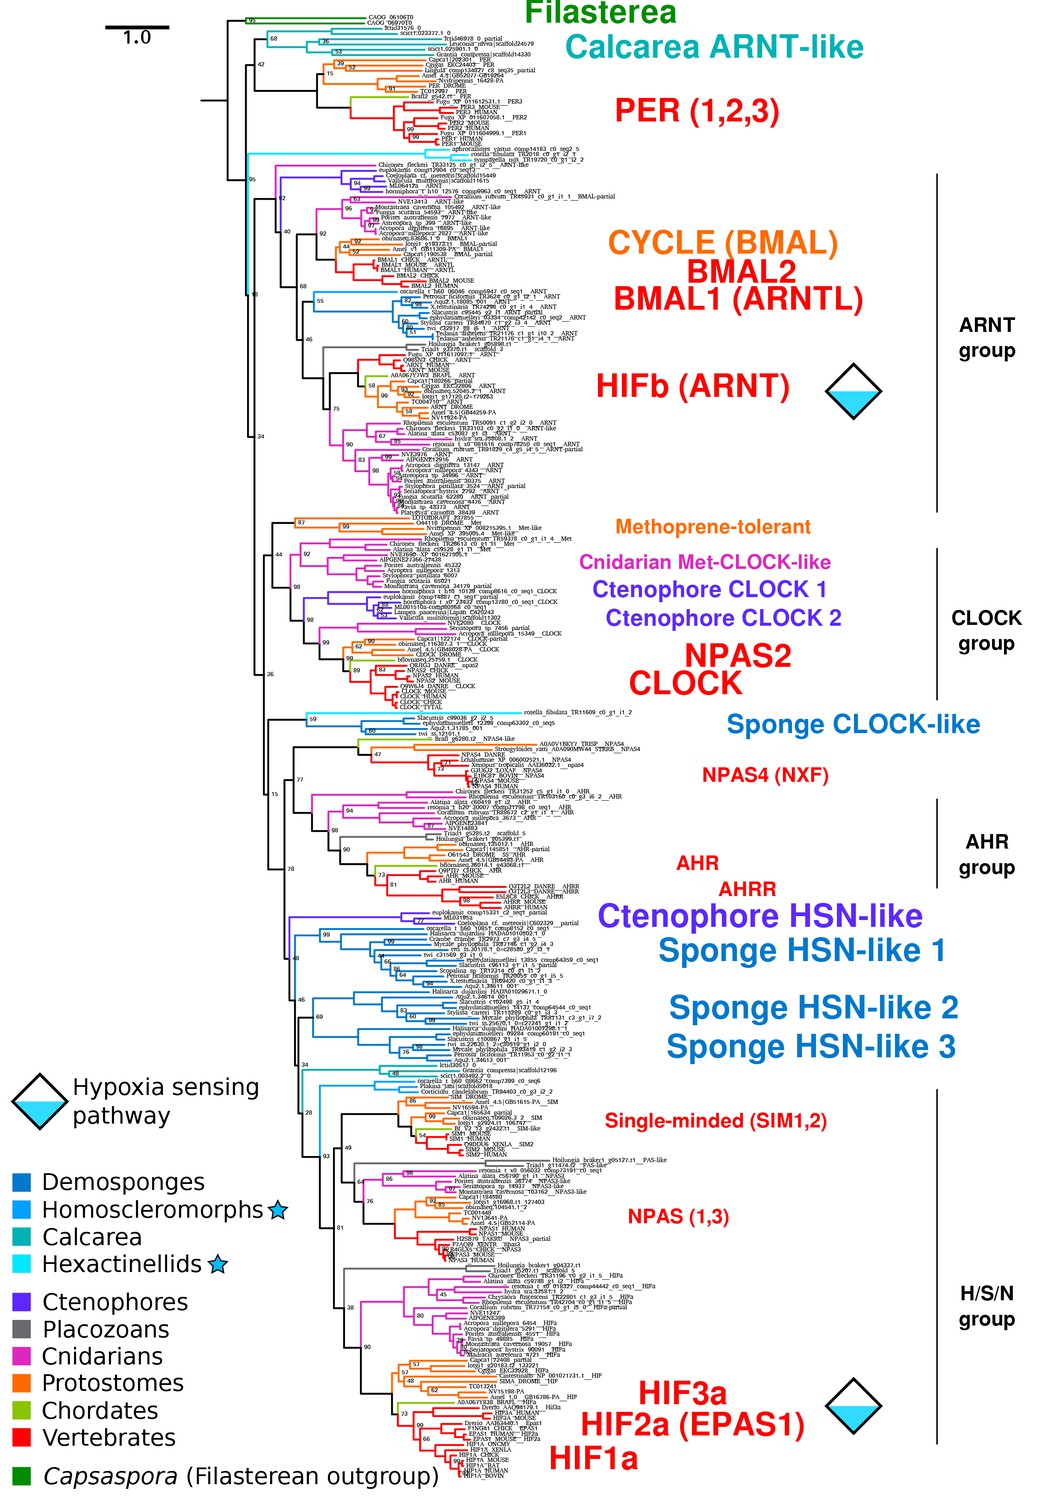
Complete bHLH-PAS tree.
Phylogenetic tree of bHLH-PAS proteins across metazoa, generated with RAxML using the PROTGAMMALG model. Bootstrap values of 100 are removed for clarity. Sponge classes represented only by transcriptomes are indicated by blue stars.
Figure 2—figure supplement 1
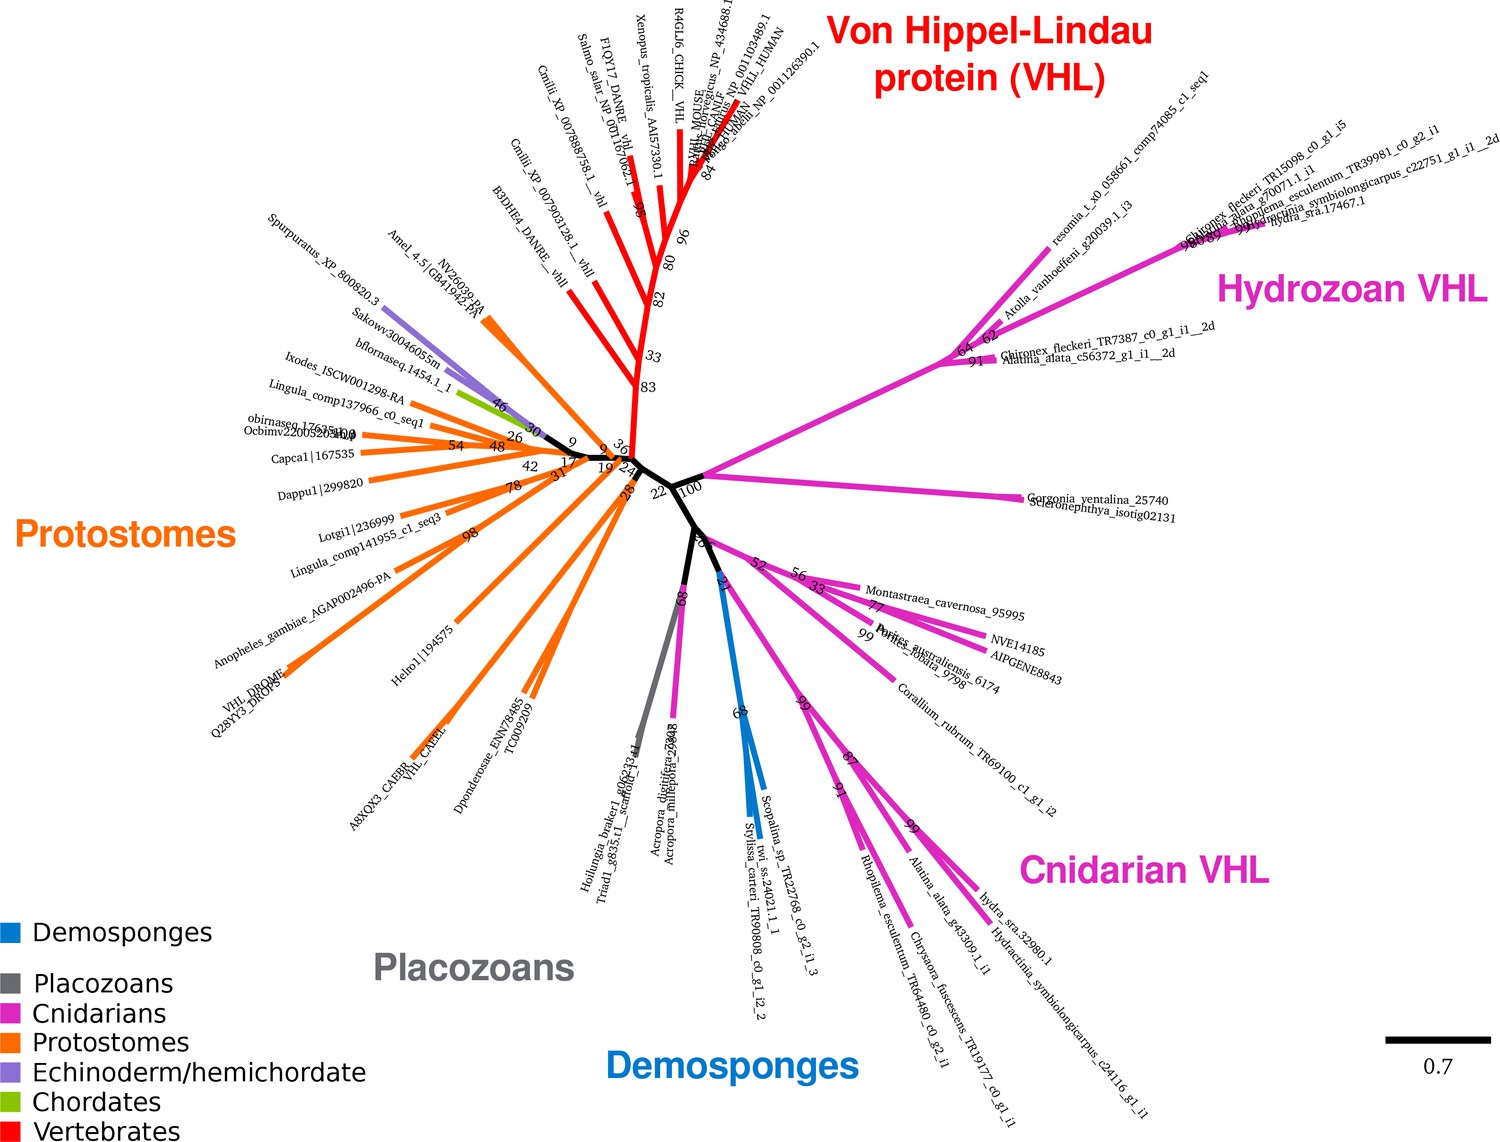
Von Hippel-Lindau protein tree.
Phylogenetic tree of VHL proteins across metazoa, generated with RAxML using the PROTGAMMALG model. Bootstrap values of 100 are removed for clarity.
Figure 2—figure supplement 2
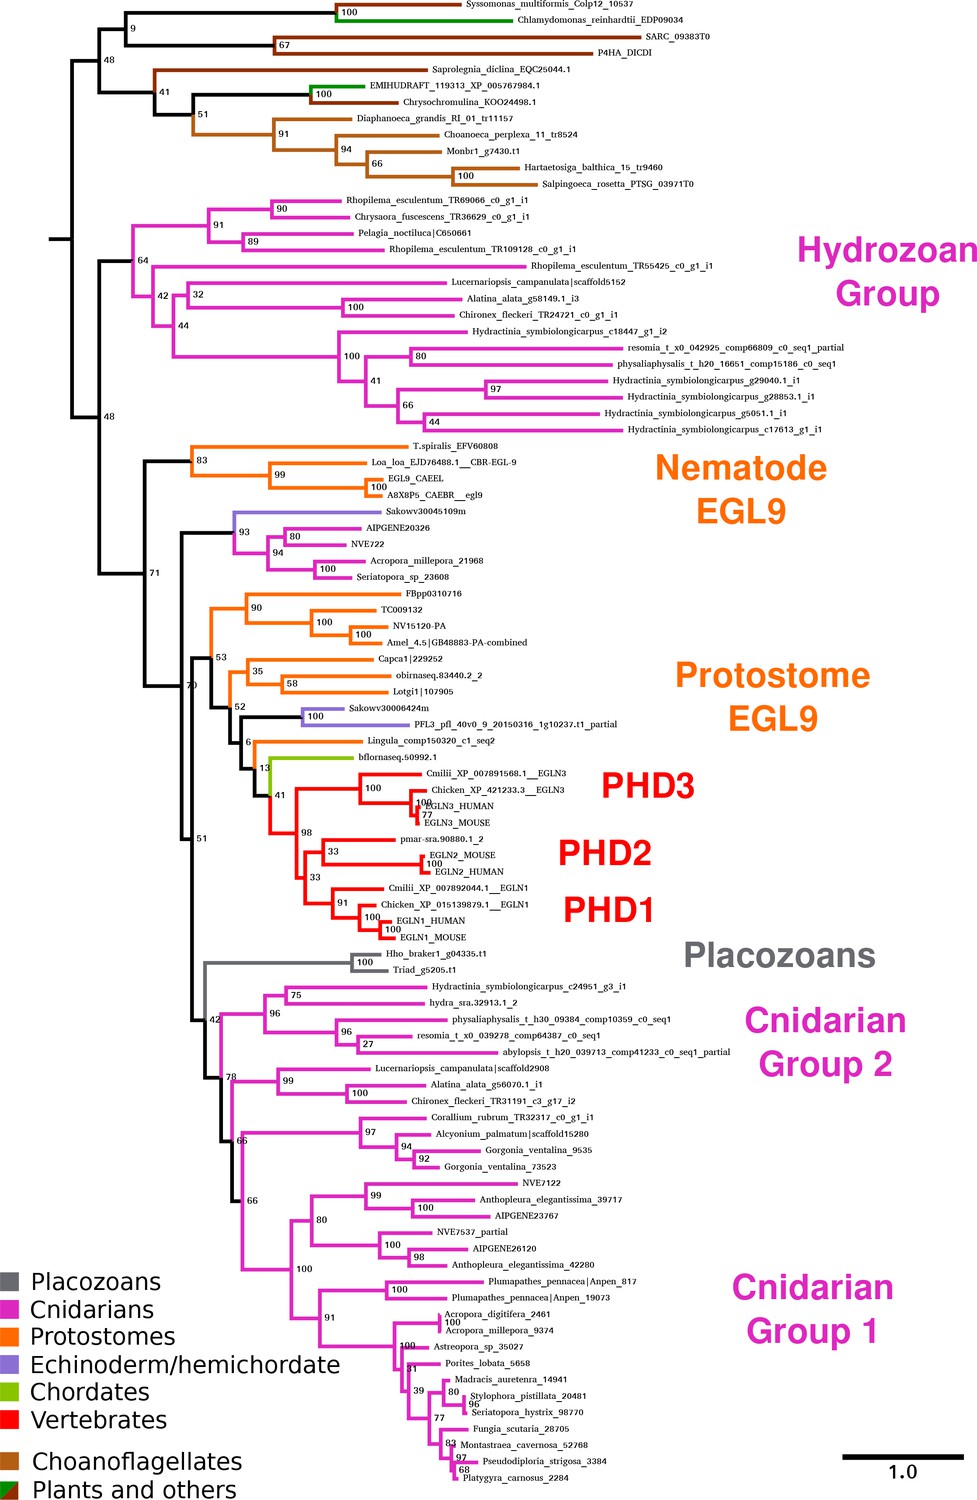
EGL9 protein tree.
Phylogenetic tree of EGL9 proteins across metazoa, generated with RAxML using the PROTGAMMALG model. Bootstrap values of 100 are removed for clarity.
Figure 2—figure supplement 3
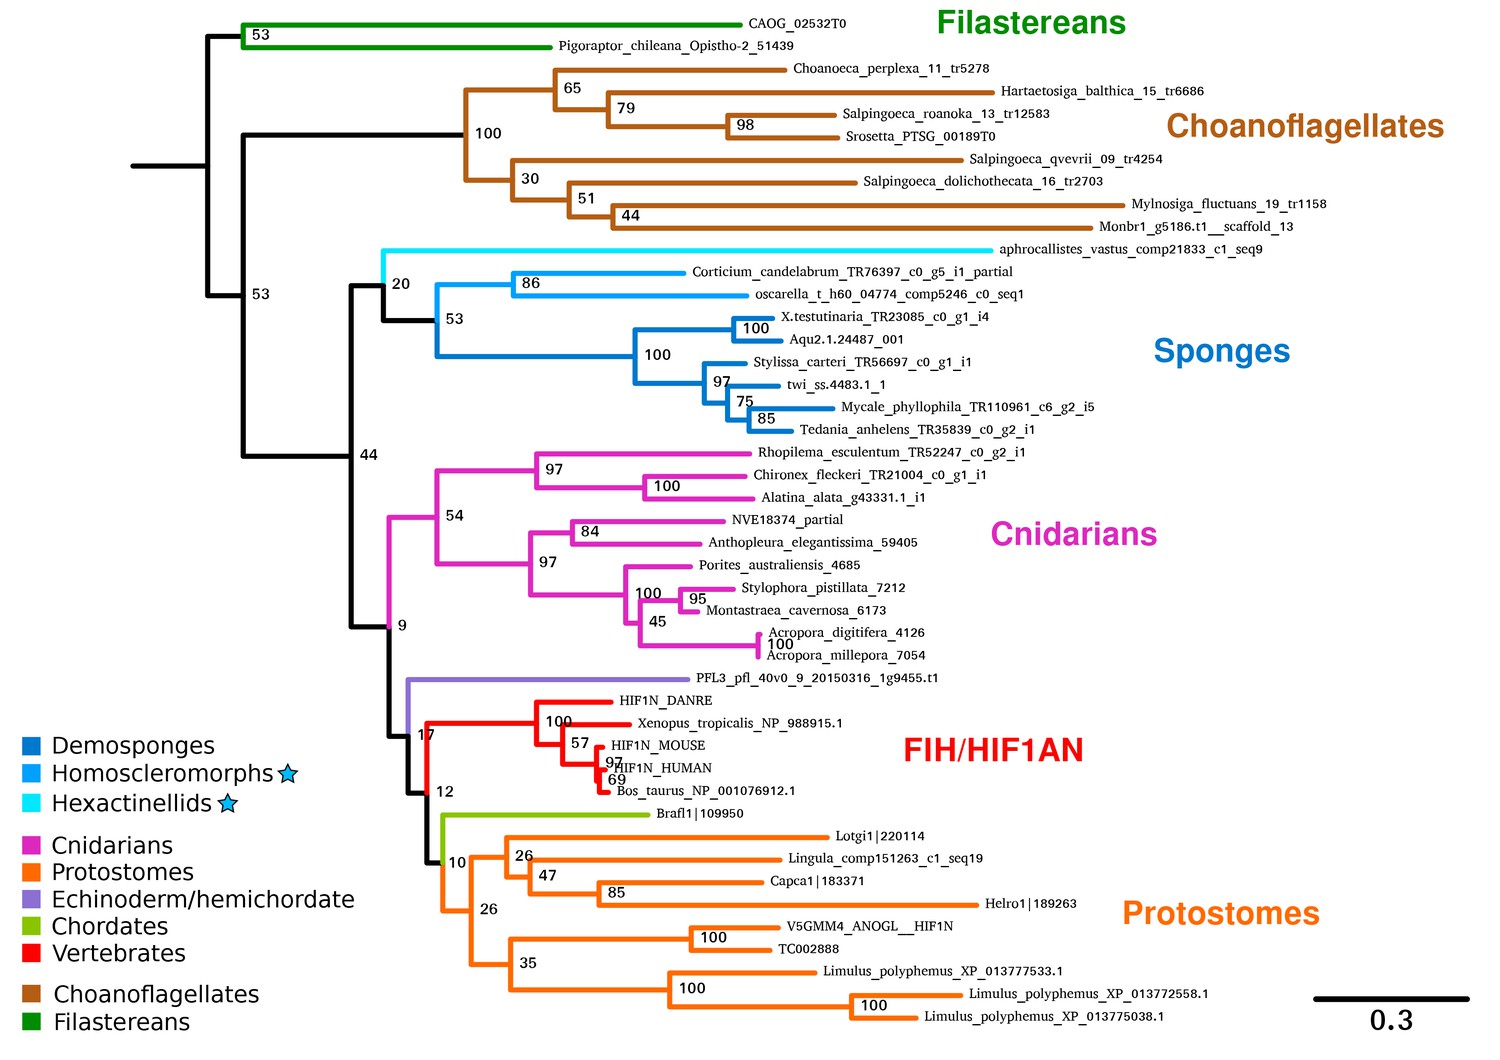
Factor-inhibiting-HIF tree.
Phylogenetic tree of FIH/HIF1AN proteins across metazoa, generated with RAxML using the PROTGAMMALG model. Bootstrap values of 100 are removed for clarity. Sponge classes represented only by transcriptomes are indicated by blue stars.
Figure 3
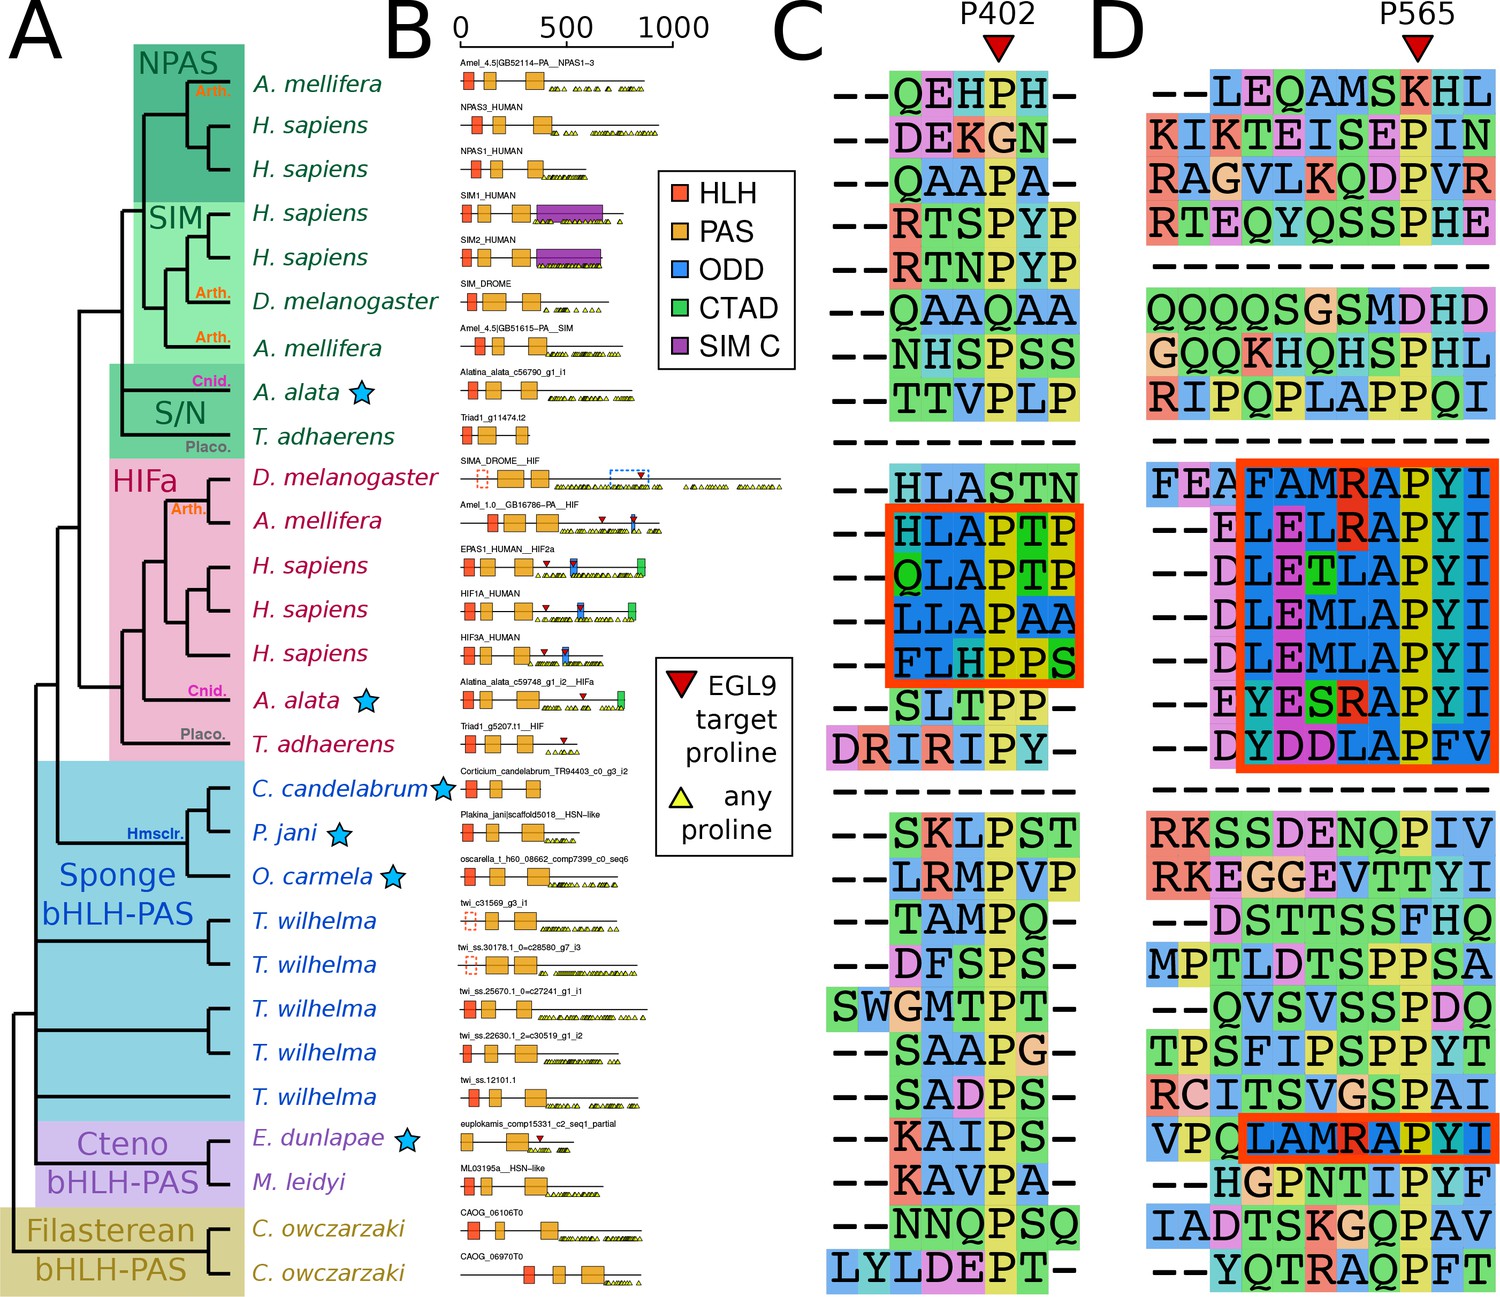
Domain organization of HIFa and related proteins.
(A) Schematic tree based on Figure 2. Blue stars indicate the sequence was derived from a transcriptome, rather than a genome. Abbreviations for certain phyla are: Arth, arthropods; Cnid, cnidarians; Placo, placozoans; Hmsclr, homoscleromorph sponges. (B) Domain organization of the proteins, identified by hmmscan against the PFAM database. Scale bar refers to length of the protein in amino acids. Some domains were not found, although were annotated in the SwissProt entries of the canonical proteins; these are shown as dashed lines. Prolines annotated as targets of EGL9 are shown in red triangles, while all prolines in the C-terminal domain of each protein are shown below each line as yellow triangles. (C) and (D), aligned positions surrounding P402 and P565 (in human HIF1a). The matching motifs are indicated by the red boxes.
Figure 4
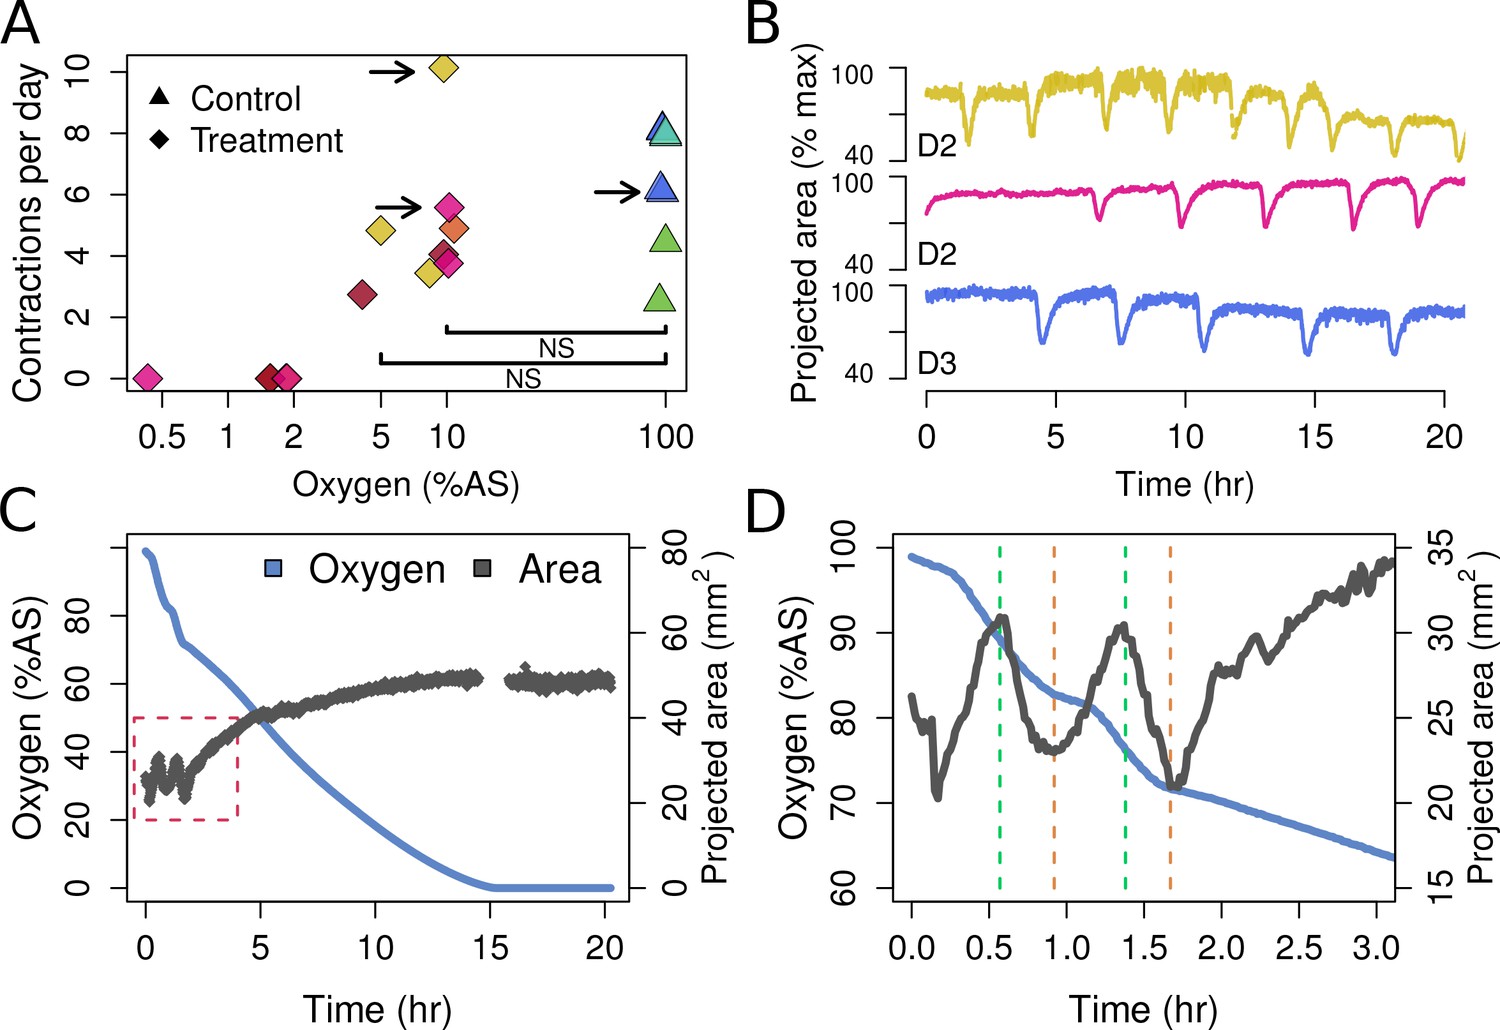
Contraction behavior.
(A) Contraction frequency (number of contractions per day) at different stable O2 levels. Each color shows a single individual across multiple treatment days; NS = not significant differences detected between the groups (i.e. 10% and 5% O2 vs. all control conditions). (B) Contraction traces of three representative sponges (shown by arrows in A) under normal O2 (blue) and hypoxia (yellow and magenta). (C) O2 levels and projected sponge area against time within a respiration vial, highlighting the changes in O2 uptake associated with sponge contraction cycles. O2 was measured, and the photos were taken, every 60 s. The gap at 15 hr was due to changes in ambient light. (D) Expansion of the red-box from part C to highlight the increased oxygen consumption during the contraction phases (between green and red lines).
Figure 5
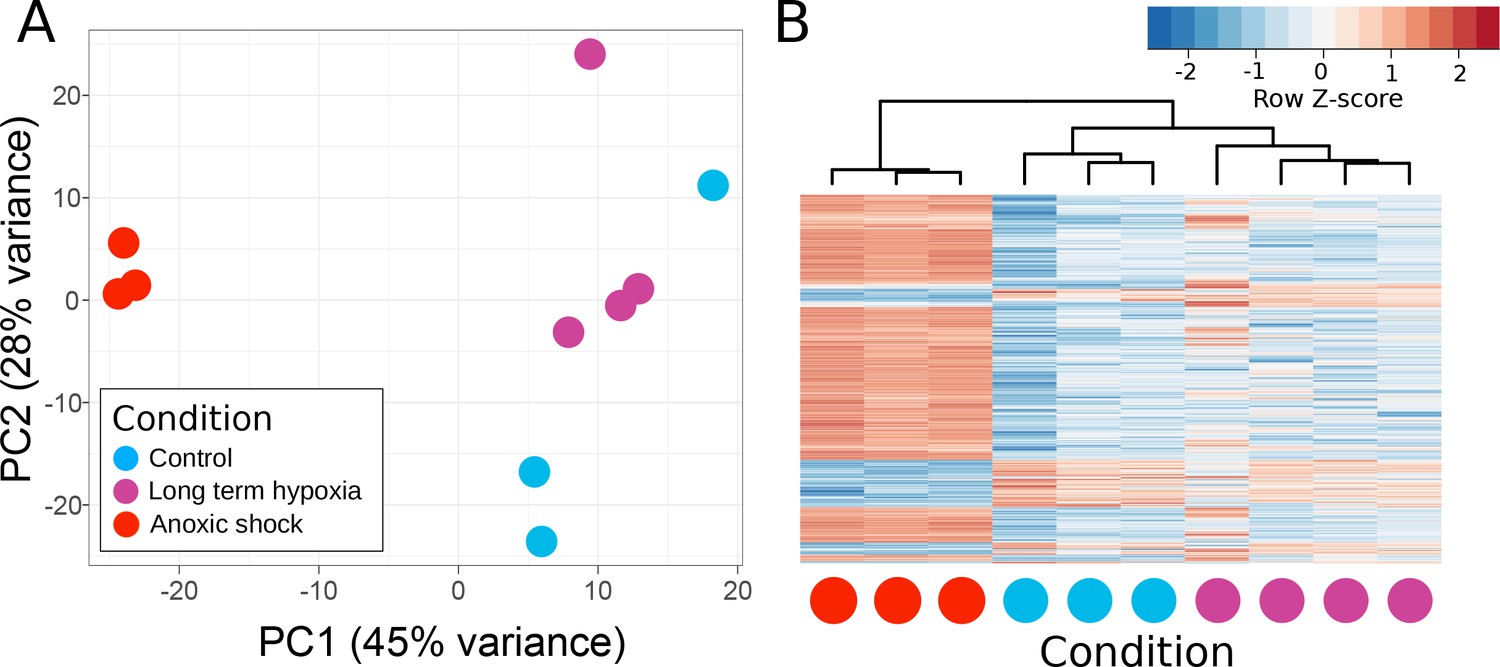
Principle components of T. wilhelma transcriptomes.
(A) PCA plot of variance of expressed genes, where each point represents the transcriptome from a single sponge specimen at the end of the experiment. Input data were normalized read-mapping counts per gene for each sample. Samples exposed to long term hypoxia were not significantly different (Adonis Pseudo-F = 1.6138, p=0.06) from controls. (B) Heatmap showing expression of the 739 differentially expressed genes across all samples and treatments. Red and blue intensities indicate differentially overexpressed and underexpressed genes, respectively.
Figure 6
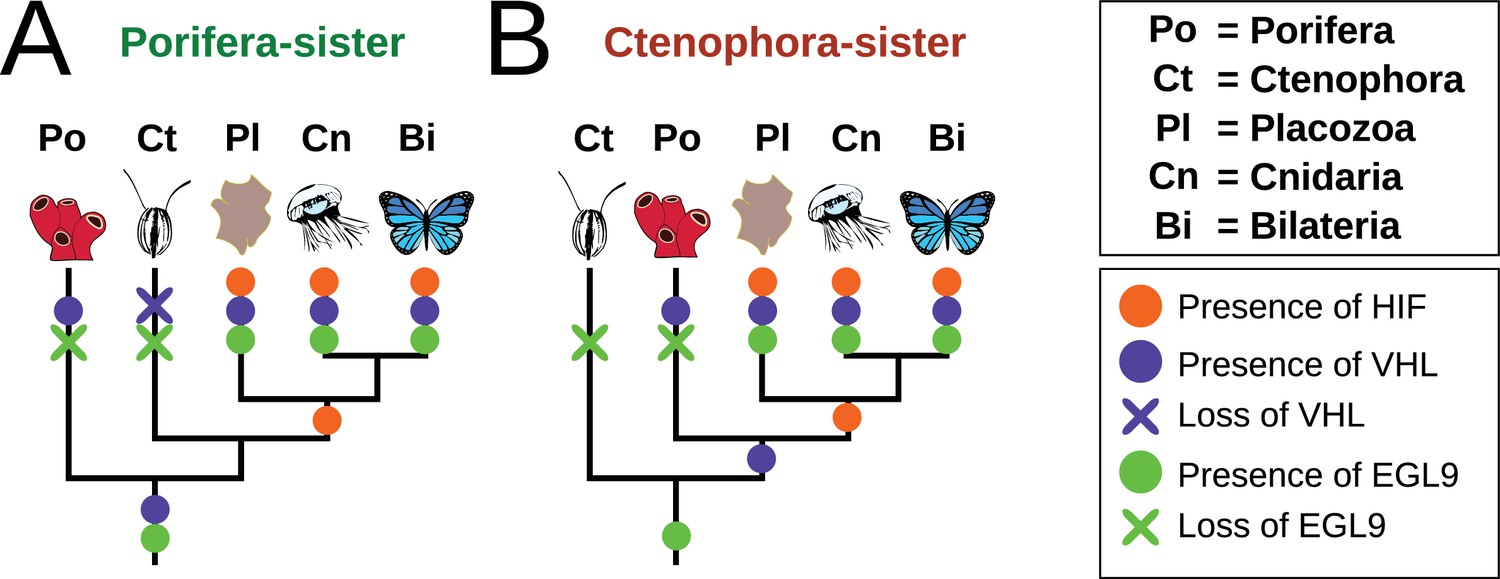
Summary schematic of the evolution and distribution of HIF pathway components in metazoans.
(A) Presence and predicted losses in a Porifera-sister topology and (B) Ctenophora-sister topology.
Videos
Video 1
Experimental video of Tethya wilhelma contracting at 21.1 µM O2 (10% atmospheric saturation at T = 26°C and S = 32) over the course of 8 hr.
https://doi.org/10.7554/eLife.31176.012Additional files
-
Supplementary file 1
Genomes and transcriptomes used for searches and gene trees
- https://doi.org/10.7554/eLife.31176.014
-
Supplementary file 2
Differentially expressed genes following the long-term hypoxia experiment
- https://doi.org/10.7554/eLife.31176.015
-
Supplementary file 3
Differentially expressed genes following the shock experiment
- https://doi.org/10.7554/eLife.31176.016
-
Transparent reporting form
- https://doi.org/10.7554/eLife.31176.017
Download links
A two-part list of links to download the article, or parts of the article, in various formats.
Downloads (link to download the article as PDF)
Open citations (links to open the citations from this article in various online reference manager services)
Cite this article (links to download the citations from this article in formats compatible with various reference manager tools)
The last common ancestor of animals lacked the HIF pathway and respired in low-oxygen environments
eLife 7:e31176.
https://doi.org/10.7554/eLife.31176


