Experimental evaluation of the importance of colonization history in early-life gut microbiota assembly
- University of Nebraska-Lincoln, United States
- University of Alberta, Canada
- Johns Hopkins University School of Medicine, United States
- Université du Québec à Montréal, Canada
- Eli Lilly & Co, United States
Figures
Figure 1 with 1 supplement
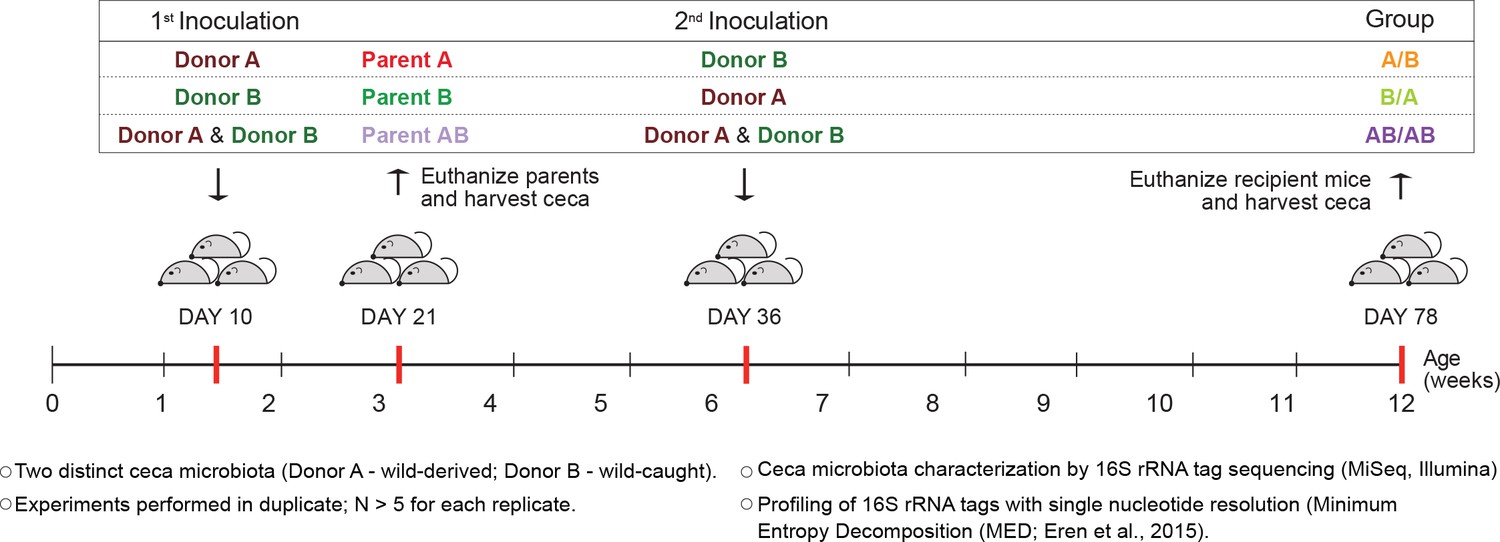
Experimental design to elucidate the importance of colonization history in ex-germ-free mice colonized with whole donor microbiomes.
Two distinct cecal microbial communities (Donors A and B) that originated from wild or wild-derived Mus musculus domesticus and were standardized in laboratory mice (see Figure 1—figure supplement 1) were inoculated into germ-free C57BL/6 mice in different order, A/B (A inoculated at day 10 ± 2, and B at day 36 ± 2), B/A (B inoculated at day 10 ± 2, and A at day 36 ± 2), and AB/AB (A and B inoculated together at both days 10 ± 2 and 36 ± 2). Cecal microbiota was characterized in samples collected in the former pubs at day 78 ± 2 and parent mice at day 21 ± 1 by 16S rRNA gene sequencing. Each experiment was done in duplicate (N ≥ 6 for each replicate).
Figure 1—figure supplement 1
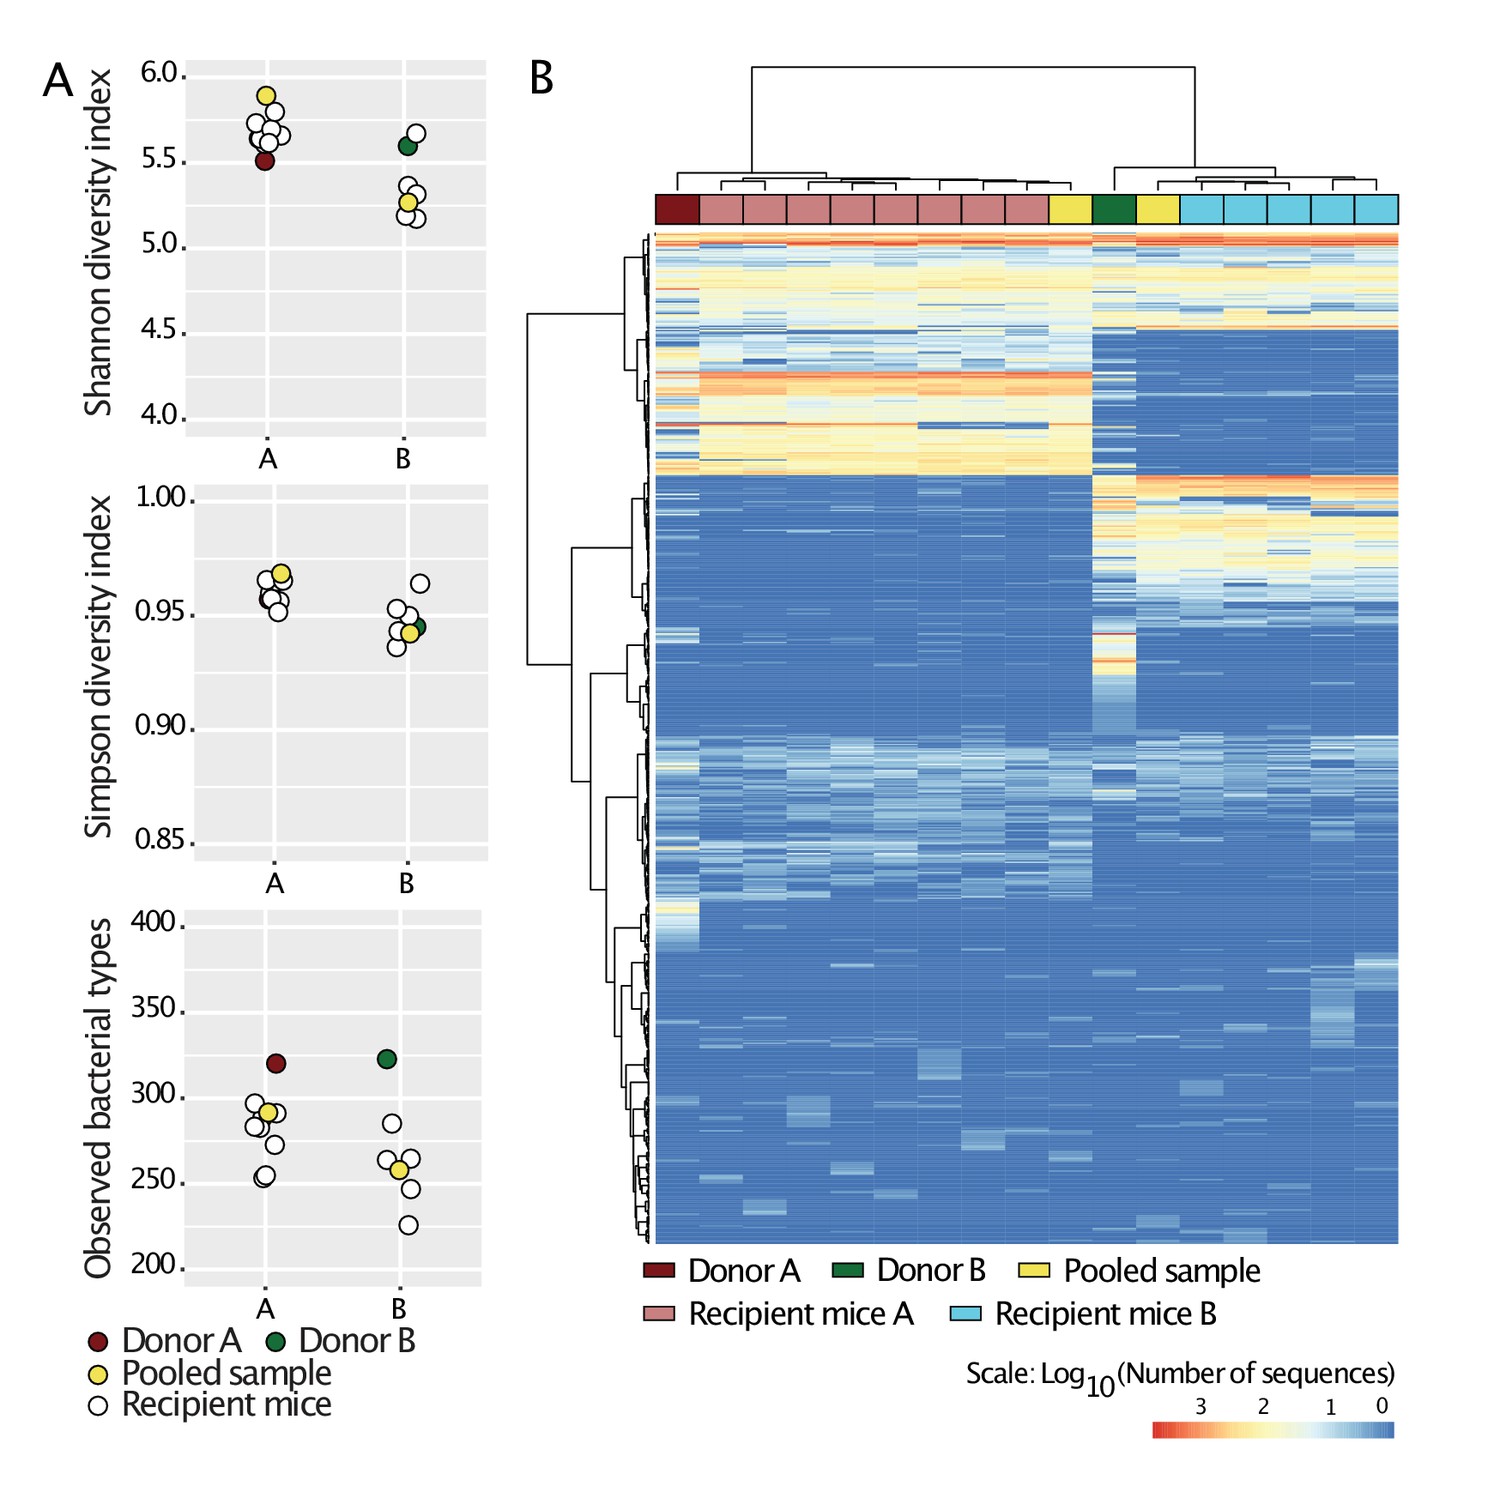
Standardization of donors’ microbiota in laboratory mice.
Cecal slurries from donors A and B were prepared in anaerobic conditions and gavaged into 4-week-old C57BL/6 germ-free mice (N = 8 for donor A, and N = 5 for donor B) housed in separate flexible plastic isolators. Four weeks after gavage, mice were euthanized and their ceca harvested. Cecal slurries of the recipient mice were collected under anaerobic conditions and pooled together for each donor. The cecal microbiota of Donors A and B, those of the recipient mice, and the pooled samples were characterized by 16S rRNA analysis. The pooled samples were then used in the experiments during the study and are referred to as Donors A and B. a, Alpha-diversity (Shannon, Simpson indices and number of observed bacterial types) of all samples. b, Heat-map based on Bray-Curtis dissimilarities of all samples.
Figure 2
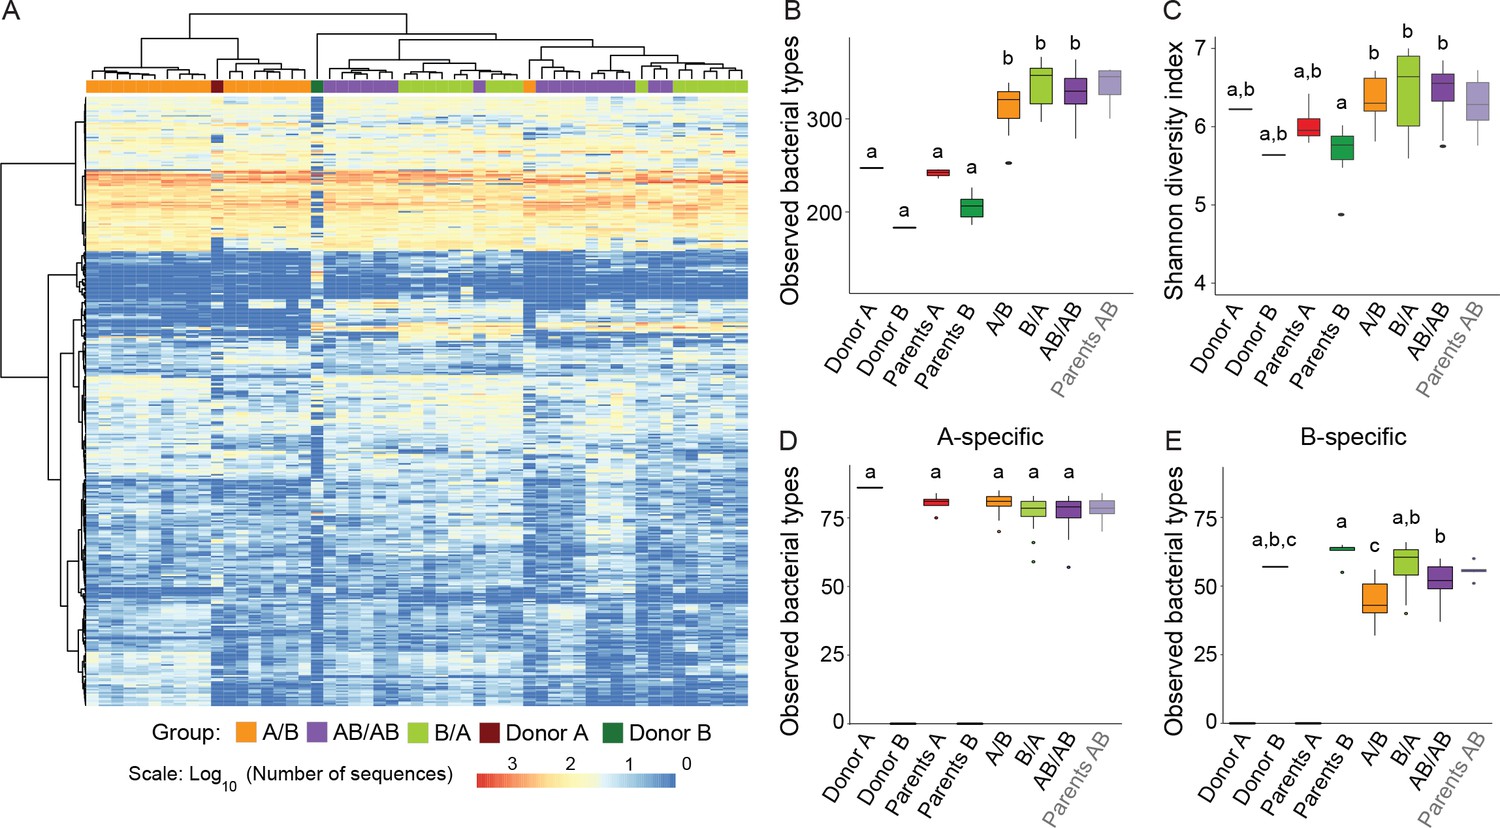
Cecal microbiota composition and diversity in donor and recipient mice in relation to colonization order.
(A) Heatmap of bacterial types in donor communities A and B and recipient A/B, B/A, and AB/AB mice; bacterial types (rows) and individual mice (columns) were clustered with the Ward's method. (B) Number of bacterial types in and (C) Shannon diversity index of the cecal bacterial communities in donor, parent, and recipient mice. (D and E) Number of bacterial types detected in recipient mice that were unique (specific) to donor c communities A and B . Each experiment was done in duplicate, Donor A (n = 1), Donor B (n = 1), parents A (n = 4), parents B (n = 8), parents AB (n = 6), recipient mice A/B (n = 18), B/A (n = 16), AB/AB (n = 17). In panels B-E, boxplots (ggplot in R) and results from ANOVA statistical analysis are shown (experimental groups that share the same letters are not significantly different, while those indicated with different letters are significantly different) (p<0.05). Parents AB are shown graphically as a reference but were not included in the statistical analysis.
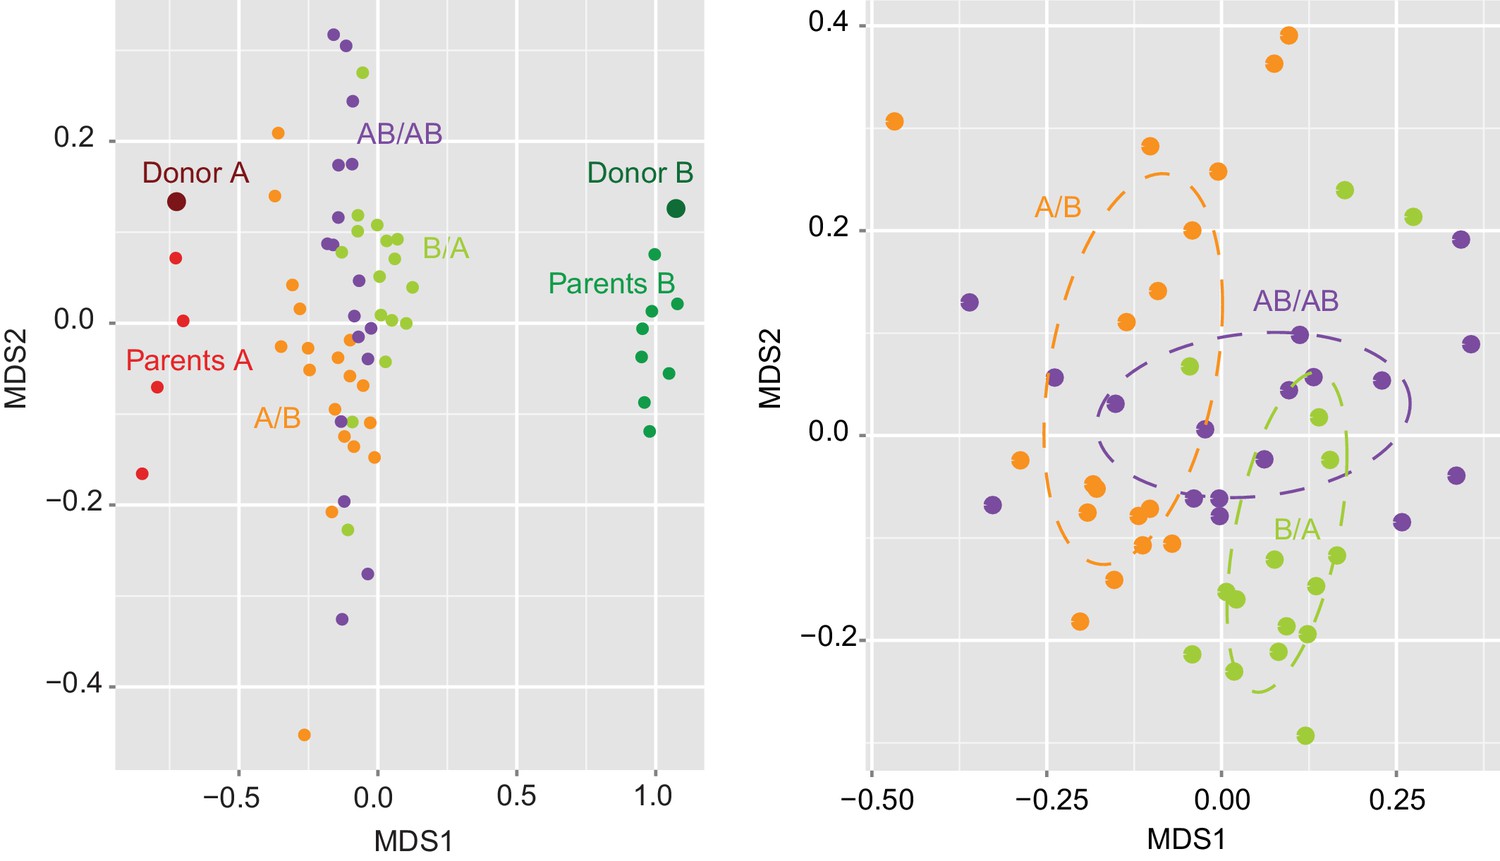
Figure 3 with 2 supplements
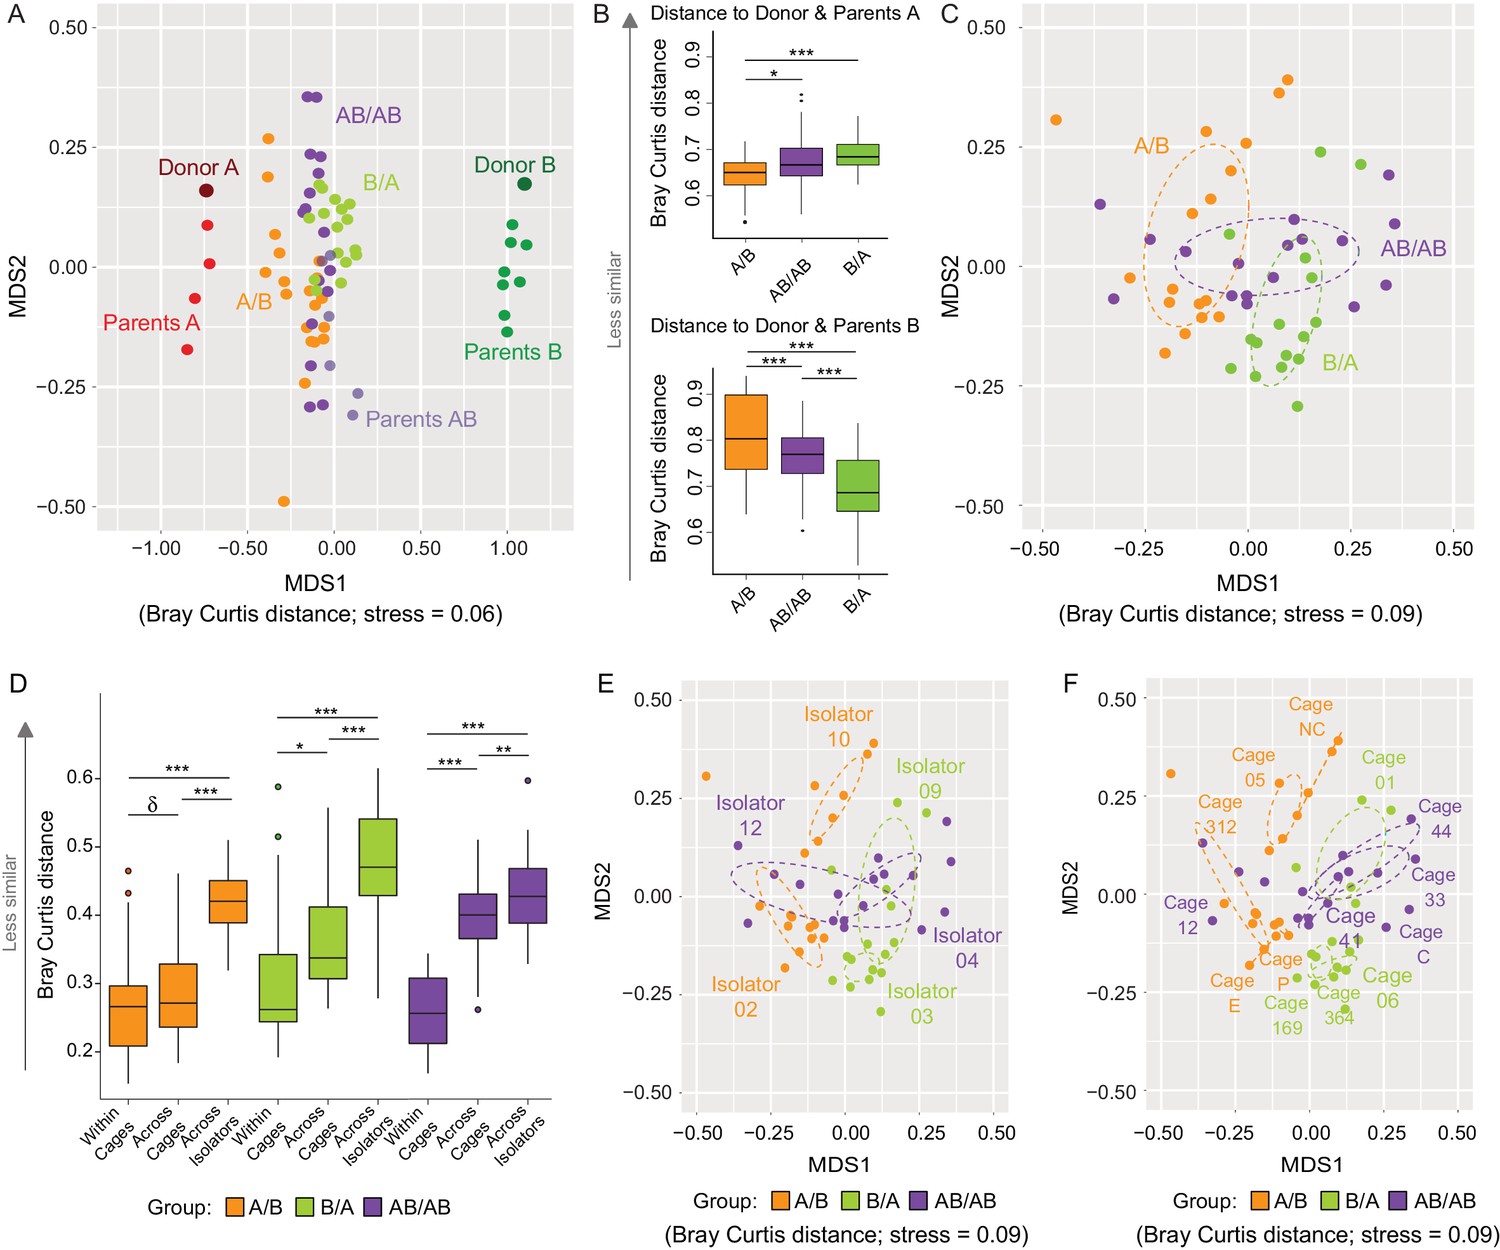
Effects of colonization order and dispersal limitations on the overall composition of the cecal microbiota.
(A) Non-metric multidimensional scaling (NMDS) plots based on Bray-Curtis dissimilarities of donors A and B, parents A and B, and recipient A/B, B/A, and AB/AB mice. (B) Average Bray Curtis dissimilarities between cecal bacterial communities in recipient mice with those of the donor and parent mice. (C) NMDS plots based on Bray-Curtis dissimilarities of recipient A/B, B/A, and AB/AB mice. (D) Average Bray-Curtis distances of the cecal microbiota profile of mice housed within the same cage, across cages within an isolator, and across isolators; statistical tests were performed within treatments to exclude the effect of colonization order. (E and F) NMDS plots (Bray-Curtis dissimilarity) with samples color-coded by treatment and grouped by the isolator or cages they were housed in. Each experiment was done twice, Donor A (n = 1), Donor B (n = 1), parents A (n = 4), parents B (n = 8), parents AB (n = 6), recipient mice A/B (n = 18), B/A (n = 16), AB/AB (n = 17), isolator 02 (n = 11), isolator 03 (n = 9), isolator 04 (n = 11), isolator 09 (n = 7), isolator 10 (n = 7), isolator 12 (n = 6), cages (n = 2–5). B and D show boxplots (ggplot in R), and the data was analyzed with ANOVA; ***p<0.001, **p<0.01, *p<0.05, δp<0.1.
Figure 3—figure supplement 1
Determination of the importance of colonization history in mouse experiments using whole donor microbiomes.
NMDS plot based on Jaccard dissimilarities of donors A (n = 1) and B (n = 1), parents A (n = 4) and B (n = 4), and A/B (n = 18), B/A (n = 16), and AB/AB (n = 17) mice.
Figure 3—figure supplement 2

Impact of dispersal limitation on gut microbiome composition.
NMDS plot (Jaccard dissimilarity) with samples color-coded by treatment and grouped by the isolators (a) or cages (b) they were housed in. (c) Boxplots of Jaccard distances of the microbiota profile of mice housed within the same cage, across cages within an isolator, and across isolators; ANOVA tests were done within treatments to exclude the effect of colonization order. ***p<0.001, **p<0.01, *p<0.05, δp<0.1.
Figure 4 with 1 supplement
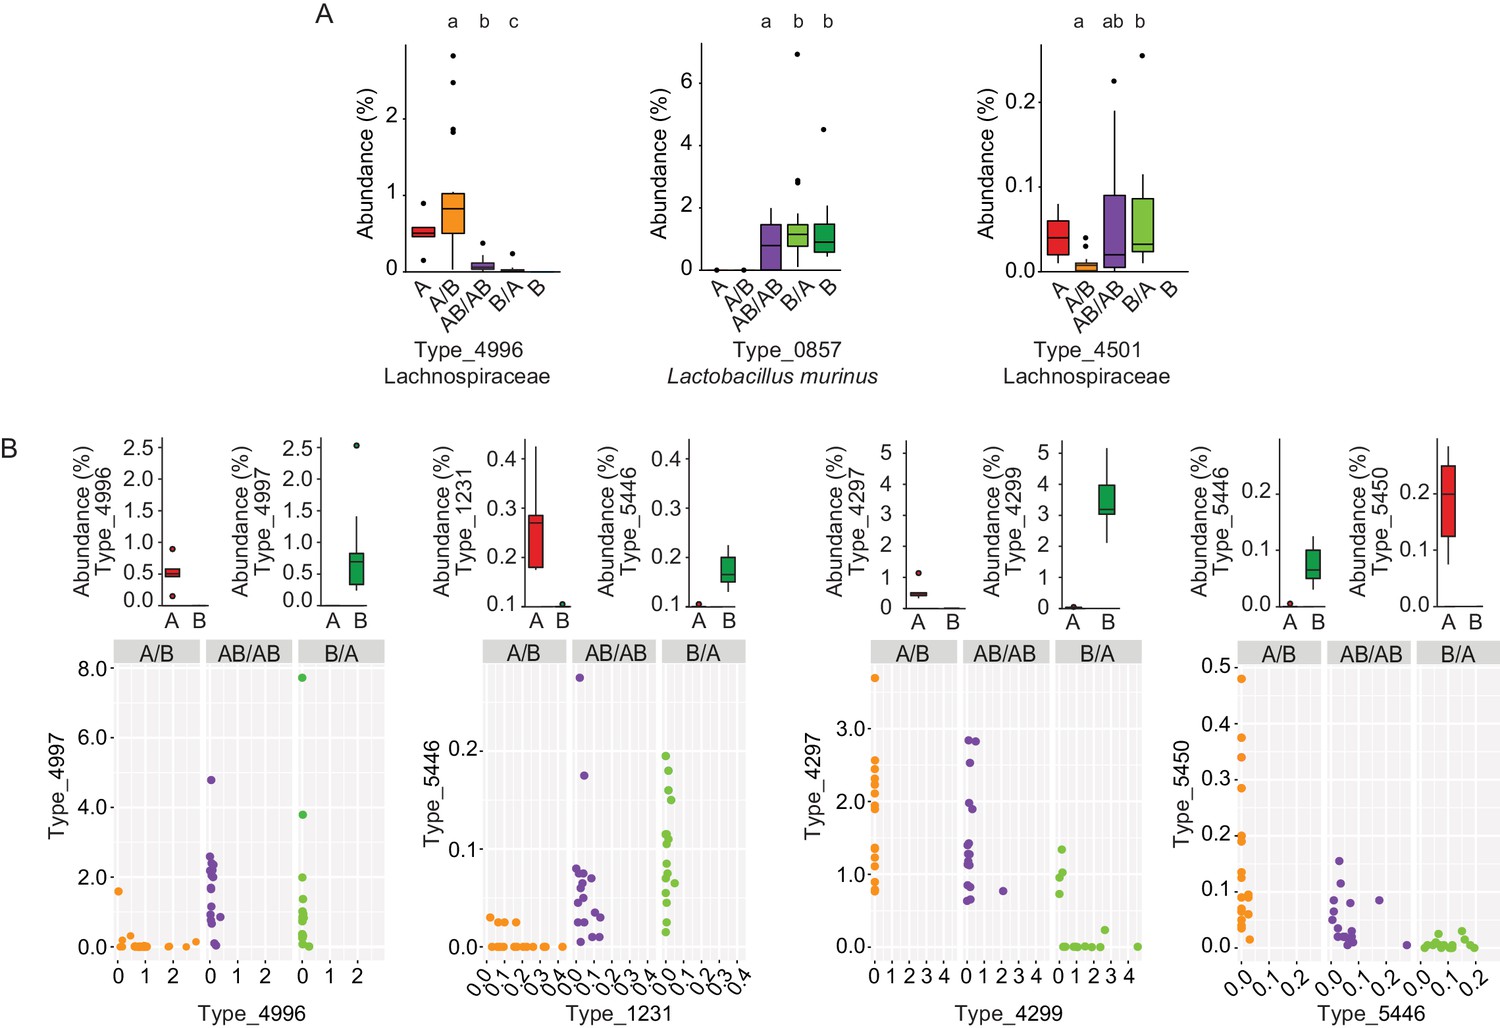
Bacterial types affected by colonization order and mechanisms of priority effects.
(A) Examples of bacterial types with an advantage when inoculated first (Type_4996 and Type_0857), indicative of inhibitory priority effect, and when inoculated second (Type_4501), indicative of facilitation. Different letters indicate statistically significant differences between groups (values of donors A and B were not included in the statistical analysis but were plotted as a reference). (B) Associations between bacterial types affected by colonization order with phylogenetically related types in the competing community. Type_4996 and Type_4997 (7 mismatches in 16S rRNA gene tag, >97% identity), Types_4297 and Types_4999 (1 mismatch in 16S rRNA gene tag, >99% identity), Type_5446 and Type_1231 (4 mismatches in 16S rRNA gene tag, >98% identity), and Type_5450 and Type_5446 (2 mismatches in 16S rRNA gene tag, >99% identity) show negative correlations, indicative of niche pre-emption. Each experiment was done in duplicate, Donor A (n = 1), Donor B (n = 1), recipient mice A/B (n = 18), B/A (n = 16), AB/AB (n = 17). In panel (A) and top graphs in panel (B), boxplots are generated in ggplot in R. In panel (A) results from ANOVA statistical analysis are shown (experimental groups that share the same letters above are not significantly different, while those indicated with different letters are significantly different)(p<0.05).
Figure 4—figure supplement 1
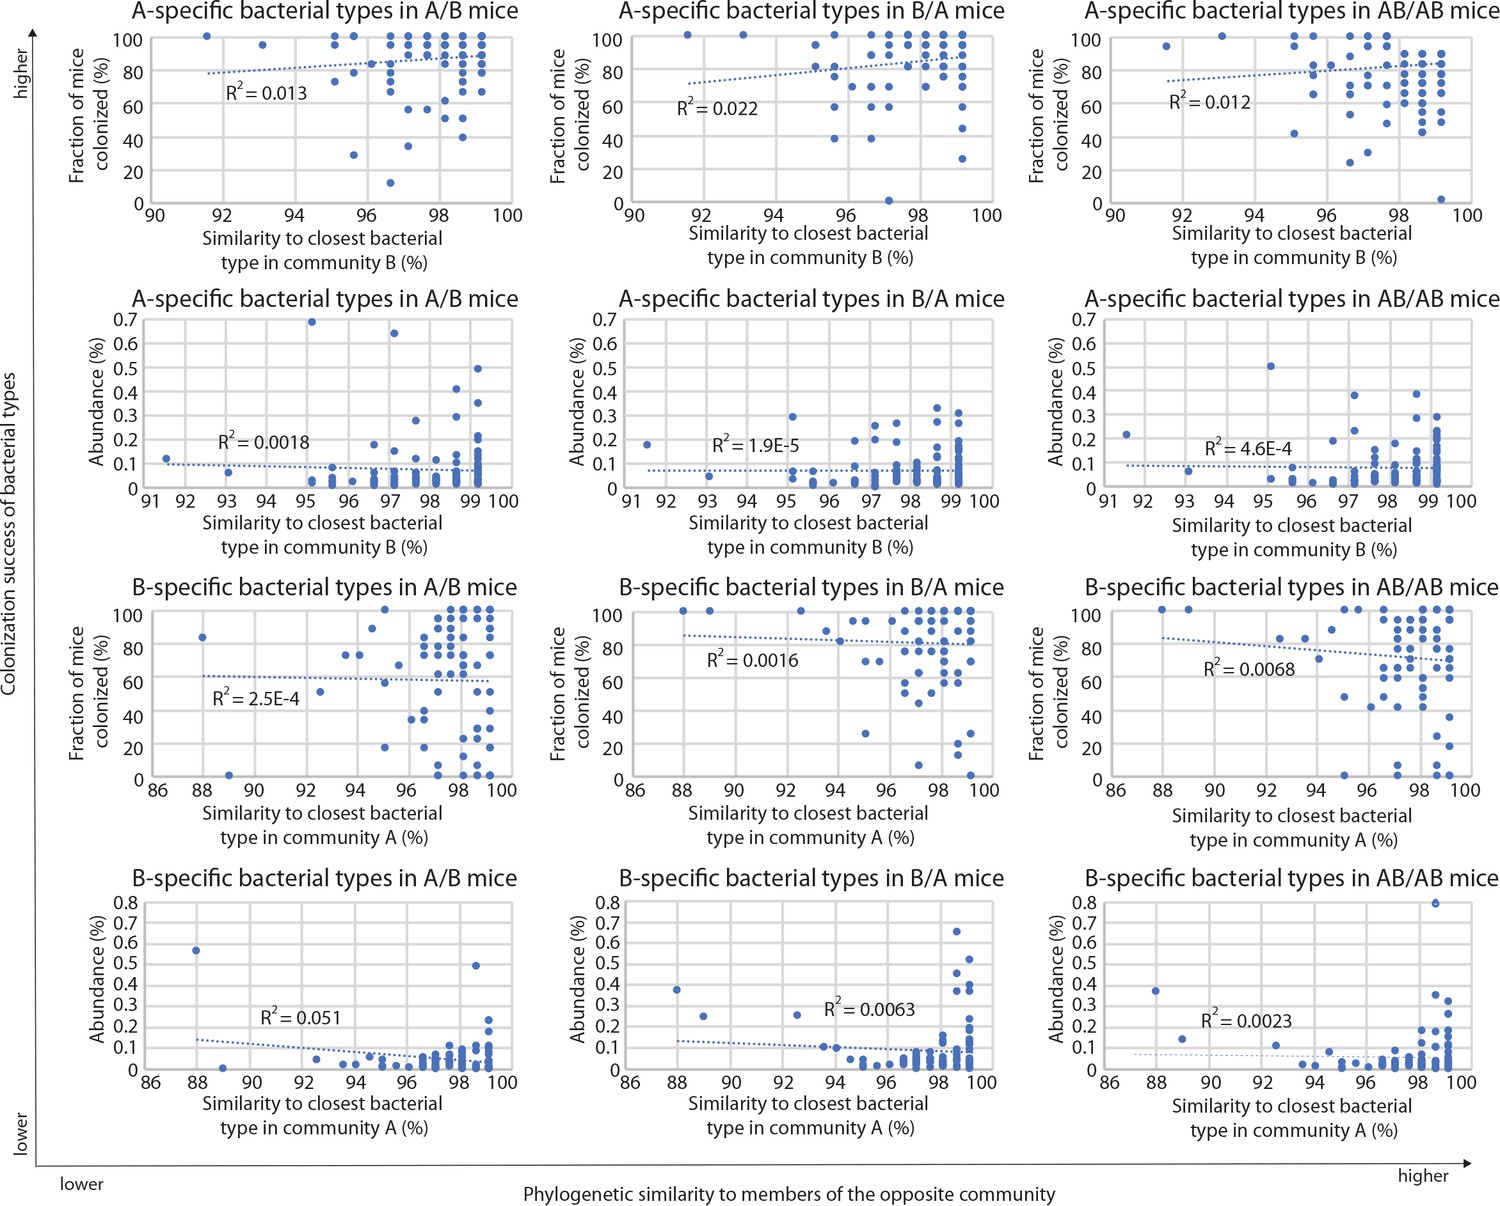
Correlations between A-specific and B-specific types in donor communities and the closest related types in the competing community, in the different groups of mice (A/B, B/A, and AB/AB).
R2 values of the corresponding linear regressions are included in each plot.
Figure 5

Arrival timing of specific colonists impact their own colonization success and the trajectory of cecal microbiota assembly.
(A) Experimental design. Lactobacillus reuteri Lpuph1, Lactobacillus johnsonii DPPM, Bacteroides vulgatus RJ2H1, and Clostridium cocleatum 29902T, were inoculated into mice at days 5 (n = 10), 14 (n = 22) and 36 ± 2 (n = 11) after birth, while a cecal microbial community (derived from C3H/HeN mice) was introduced at day 10 ± 1. Fecal samples were collected pre-treatment on the day of inoculation of the strain cocktail and weekly throughout 5 weeks post-inoculation. At day 78 ± 2 mice were euthanized and their ceca harvested for taxonomic characterization with MiSeq (Illumina) technology. (B) Cell numbers of the specific colonizers (determined by strain-specific qPCR) in fecal samples collected throughout a 5-week period following inoculation. (C) Abundance of bacterial types closest related to the specific colonizers in the donor cecal community based on 16S rRNA gene tag data. Type_3983 had 2 mismatches to C. cocleatum 29902T, while Type_3050 was identical to L. reuteri Lpuph1. The closest match to B. vulgatus RJ2H1 was Type_0558 and had 8 mismatches, while the closest bacterial type to L. johnsonii DPPM was Type_2116 with 15 mismatches. (D) Number of bacterial types and Shannon diversity index of the cecal microbiota in mice inoculated with the specific colonizers at days 5, 14 and 36 at age 78 days. E, NMDS plot (based on Bray-Curtis dissimilarity) showing cecal bacterial community at age 78 days in mice that received the four specific colonists at 5, 14, and 36 days of age. In panel (B) mean ±standard derivation of two replicates per experiment, and data were analyzed by ANOVA with interaction of time and treatment evaluated; different letters across time points or experimental groups represent significantly different values (p<0.05). In panels (C and D) boxplots are shown (ggplot in R). In panel D, ANOVA analysis was performed; results with no significant differences across treatments detected.
Figure 6 with 1 supplement
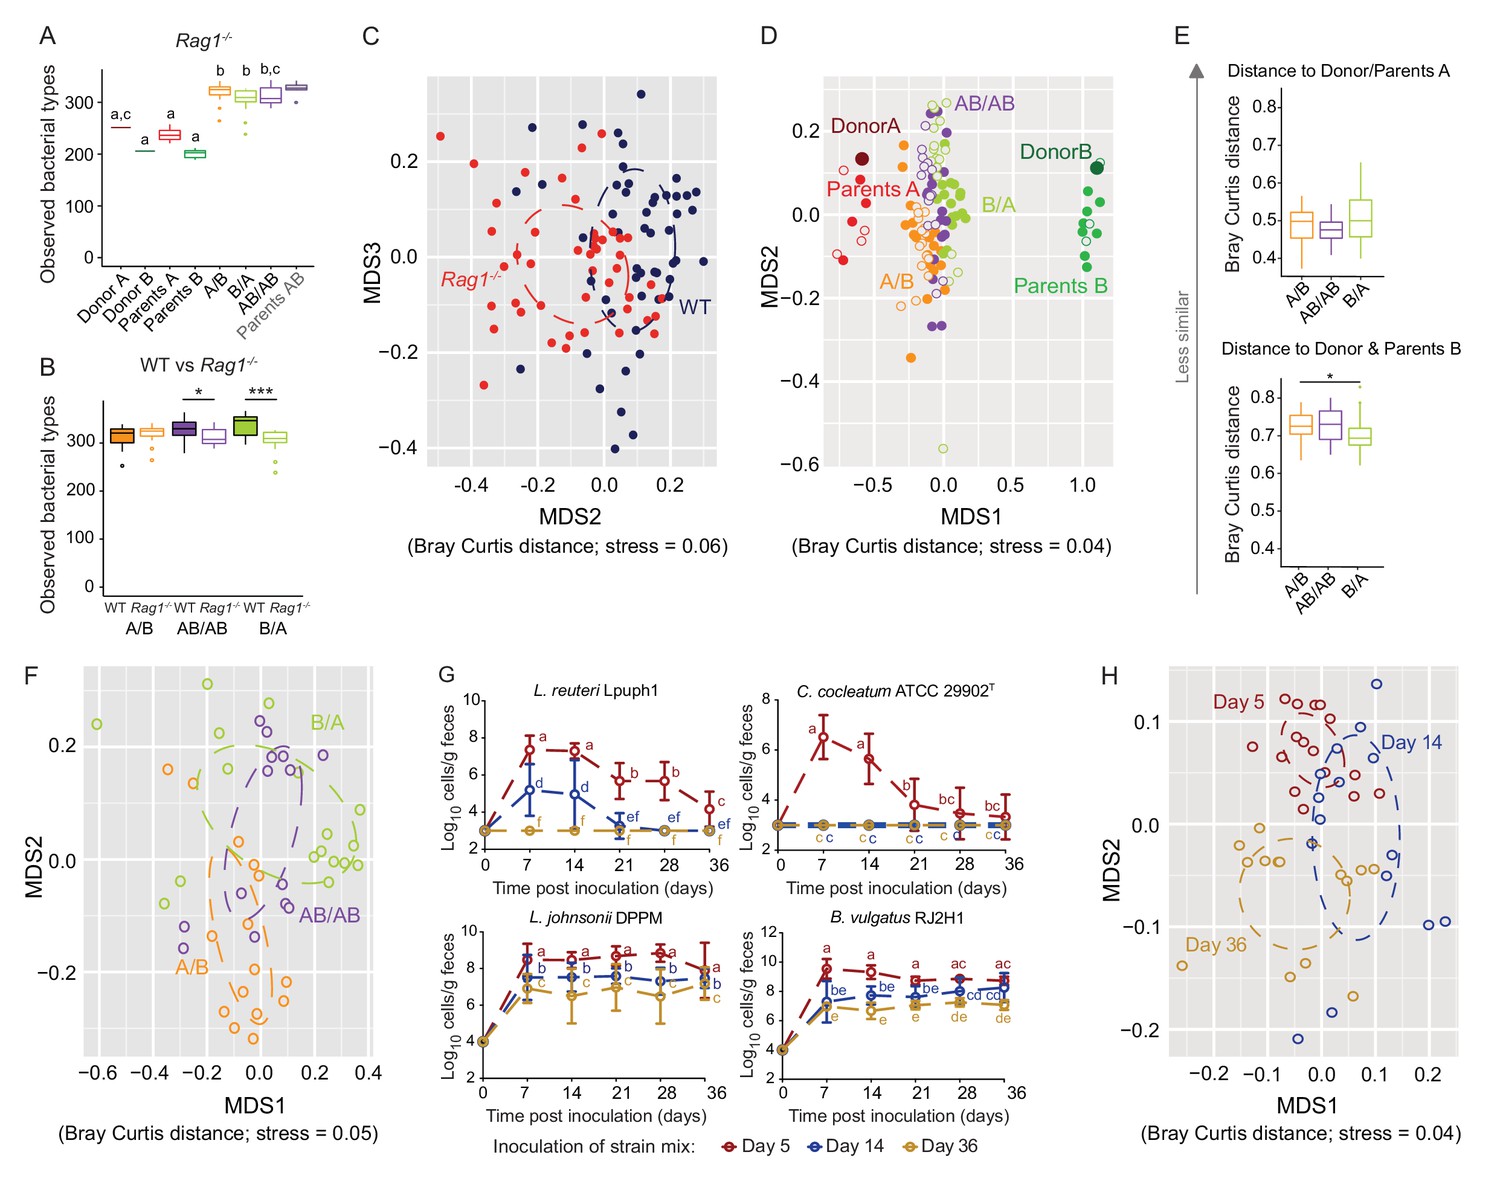
Determination of the role of colonization history in Rag1-/- mice.
(A) Boxplots showing the number of bacterial types in the donor A and B communities (shown are the donor mice; n = 1 each), the parents inoculated with A (n = 4) or B (n = 3), and recipient mice colonized with the donor communities in different order (A/B; n = 15), B/A; n = 17), and AB/AB; n = 14). (B) Boxplots of bacterial types in WT versus Rag1-/- mice. (C) NMDS plots based on Bray-Curtis dissimilarities of cecal microbiota of all experimental groups in WT (blue) and Rag1-/-(red) mice (n = 51, and n = 46, respectively). (D) NMDS plot based on Bray-Curtis dissimilarities in recipient WT (filled symbols) and Rag1-/-(open symbols) mice that received treatments A/B (n = 18 WT; n = 15 Rag1-/-), B/A (n = 16 WT; n = 17 Rag1-/-), and AB/AB (n = 17 WT; n = 14 Rag1-/-) together with donors A (n = 1) and B (n = 1) and parents A (n = 4 WT; n = 4 Rag1-/-) and B (n = 8 WT; n = 3 Rag1-/-). (E) Average Bray Curtis dissimilarities between cecal bacterial communities in recipient Rag1-/- mice with those of the donor and parent mice. (F), NMDS plots based on Bray-Curtis dissimilarities of cecal in Rag1-/- mice that received the A/B (n = 15), B/A (n = 17), and AB/AB (n = 14) treatments. (G) Absolute cell numbers of Lactobacillus reuteri Lpuph1, Lactobacillus johnsonii DPPM, Bacteroides vulgatus RJ2H1, and Clostridium cocleatum 29902T in fecal samples of Rag1-/- mice when inoculated into mice at days 5 (n = 16), 14 (n = 15) and 36 (n = 14)±2 days after birth, while a complex microbiota was established at day 10. (H), NMDS plot based on Bray-Curtis dissimilarity showing cecal bacterial community at 78 ± 2 days in Rag1-/- mice that received the four specific colonists at 5 (n = 16), 14 (n = 15) and 36 (n = 14)±2 days after birth. In panels (A and B), statistical analyses were done with ANOVA. In panel G, mean ±standard derivation of two replicates per experiment are shown, and data was analyzed by ANOVA with interaction of time and treatment. In panels (A and G), different letters across time points or experimental groups represent significantly different values (p<0.05). ***p<0.001, **p<0.01, *p<0.05, δ p<0.1.
Figure 6—figure supplement 1
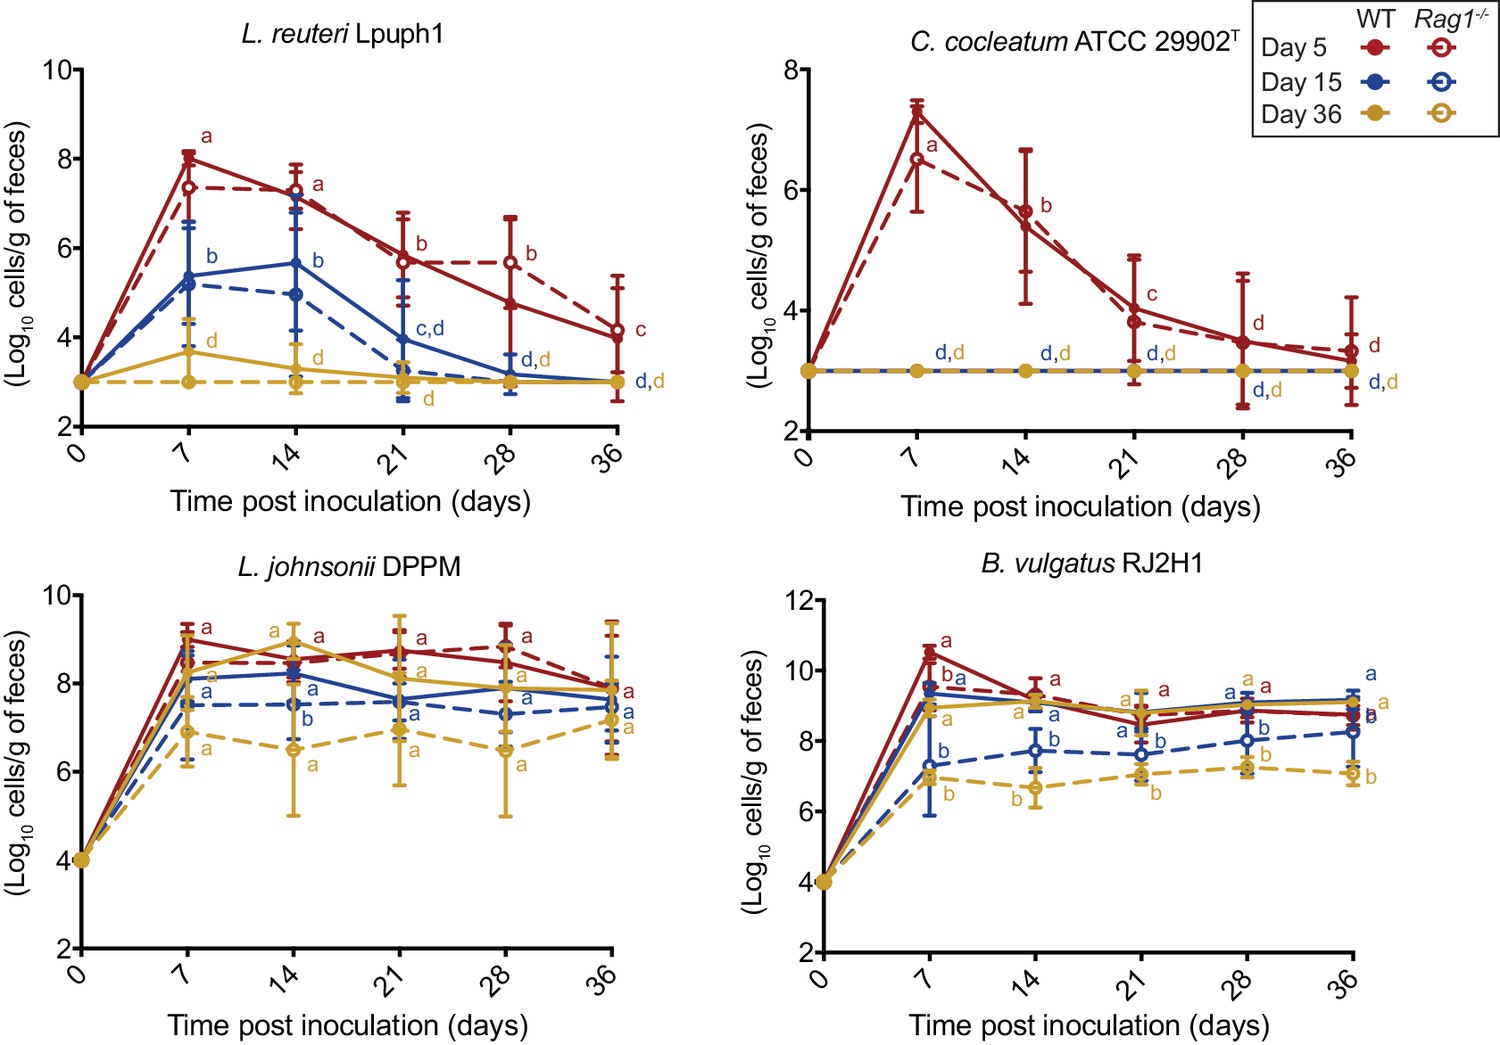
Comparison of fecal cell numbers of specific colonists in WT and Rag1-/- mice in relation to arrival timing.
Absolute abundances of Lactobacillus reuteri Lpuph1, Lactobacillus johnsonii DPPM, Bacteroides vulgatus RJ2H1, and Clostridium cocleatum 29902T in fecal samples of WT and Rag1-/- mice when inoculated into mice at day 5 (n = 10 WT; n = 16 Rag1-/-), day 14 (n = 22 WT; n = 15 Rag1-/-), and day 36±2 (n = 11 WT; n = 14 Rag1-/-) after birth. Mice received complex microbiota at day 10. Mean ± standard derivation of two replicates per experiment are shown.
Additional files
-
Supplementary file 1
Abundance (% of total sequences) of bacterial types significantly impacted by colonization order in WT mice.
Linear mixed model analysis was done to determine the effect of colonization order on community assembly (treatments A/B, AB/AB, B/A; values for A and B (both donor and parent mice) are given as a reference). Results are presented as mean ±standard deviation.
- https://doi.org/10.7554/eLife.36521.014
-
Supplementary file 2
Abundance (% of total sequences) of bacterial types significantly impacted by inoculation time of specific colonizing strains in WT mice, assessed through Random Forest analysis (Random Forest coefficient >2 was considered significant).
Results are presented as mean ±standard deviation).
- https://doi.org/10.7554/eLife.36521.015
-
Supplementary file 3
Abundance (expressed as percent of total sequences) of bacterial types significantly different between WT and Rag1-/-, for experiments when the effect of colonization order of two donor cecal communities on the final community composition was tested.
Results are presented as mean ±standard deviation.
- https://doi.org/10.7554/eLife.36521.016
-
Supplementary file 4
Abundance (% of total sequences) of bacterial types significantly impacted by colonization order in Rag1-/- and WT mice.
Statistical analyses were done for treatments A/B, AB/AB, B/A (A and B are given as a reference) using a linear mixed model with genetic background and colinization order as the main effects. Results are presented as mean ±standard deviation.
- https://doi.org/10.7554/eLife.36521.017
-
Supplementary file 5
Abundance (% of total sequences) of bacterial types significantly impacted by inoculation time of specific colonizing strains in Rag1-/- mice, assessed through Random Forest analysis (Random Forest coefficient ≥2 was considered significant).
Results are presented as mean ± standard deviation. Taxa in bold were also impacted in WT mice (Supplementary File 2)
- https://doi.org/10.7554/eLife.36521.018
-
Supplementary file 6
Primer-pair used for absolute quantification of the specific colonizer strains.
- https://doi.org/10.7554/eLife.36521.019
-
Transparent reporting form
- https://doi.org/10.7554/eLife.36521.020
Download links
A two-part list of links to download the article, or parts of the article, in various formats.
Downloads (link to download the article as PDF)
Open citations (links to open the citations from this article in various online reference manager services)
Cite this article (links to download the citations from this article in formats compatible with various reference manager tools)
Experimental evaluation of the importance of colonization history in early-life gut microbiota assembly
eLife 7:e36521.
https://doi.org/10.7554/eLife.36521


