Chronic optogenetic induction of stress granules is cytotoxic and reveals the evolution of ALS-FTD pathology
- St. Jude Children’s Research Hospital, United States
- Howard Hughes Medical Institute, United States
Figures
Figure 1 with 4 supplements
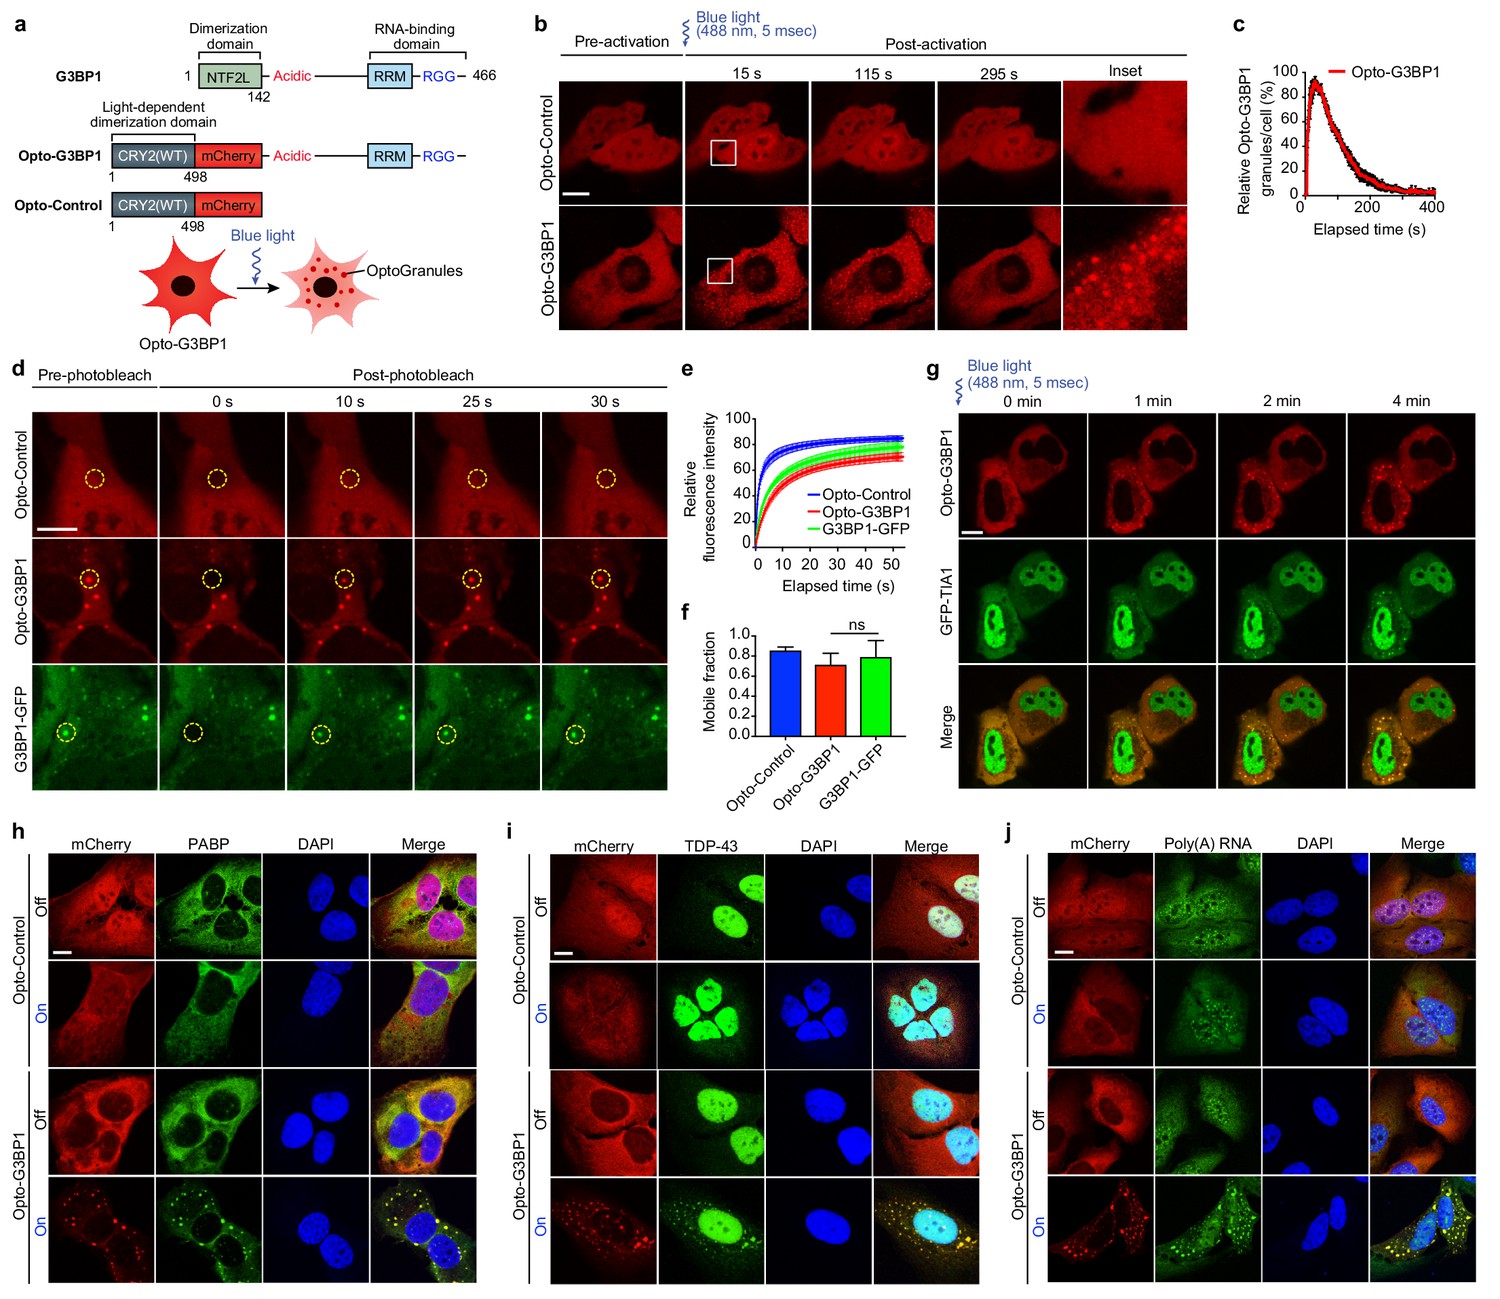
OptoGranules are light-inducible dynamic stress granules.
(a) Design of Opto-G3BP1 and Opto-Control constructs. (b) U2OS cells stably expressing Opto-Control or Opto-G3BP1 were stimulated with a single 5-msec pulse of 488 nm blue light (power density ~2.5 MW/cm2) in a defined ROI. Representative images are shown from n = 3 independent experiments. (c) Quantification of data in cells treated as in (b). Five cells with similar expression levels were counted. Granule numbers are shown relative to the granule number at the peak of OptoGranule assembly. Error bars represent s.e.m. (d-f) U2OS cells were stably transfected with Opto-Control or Opto-G3BP1, or stable Opto-G3BP1 cells were transiently transfected with G3BP1-GFP, and stimulated with a blue-light laser (power density ~4.5 W/cm2) for 3 mins. Regions marked with yellow circles were photobleached and monitored for fluorescence recovery. Data are shown as representative images (d), relative fluorescence intensity of photobleached region over time (e), and relative mobile fraction derived from (e) (f). For (e, f) n = 15 cells for Opto-Control; n = 12 for Opto-G3BP1; n = 14 for G3BP1-GFP. Data are representative of n = 3 independent experiments. Data shown as mean + s.d. ns, not significant by one-way ANOVA with Dunnett’s test. (g) U2OS cells transiently transfected with Opto-G3BP1 and the stress granule marker GFP-TIA1 were stimulated with a blue-light laser (power density ~2.5 MW/cm2) for 5 msec. Cells were sequentially imaged by 561 nm and 488 nm channels; we note that the 488 nm channel used for imaging also activates Opto-G3BP1 (power density 2.2 W/cm2). Representative images are shown from n = 3 independent experiments. (h-j) U2OS cells stably expressing Opto-Control or Opto-G3BP1 constructs were stimulated for 6 hr without or with continuous blue light (~2 mW/cm2) using custom-made LED arrays for global activation. Cells were immunostained with PABP antibody (h), TDP-43 antibody (i), or RNA fluorescence in situ hybridization using FAM-labelled oligo (dT)20 as a probe (j). Scale bars, 10 µm in all micrographs.
Figure 1—figure supplement 1
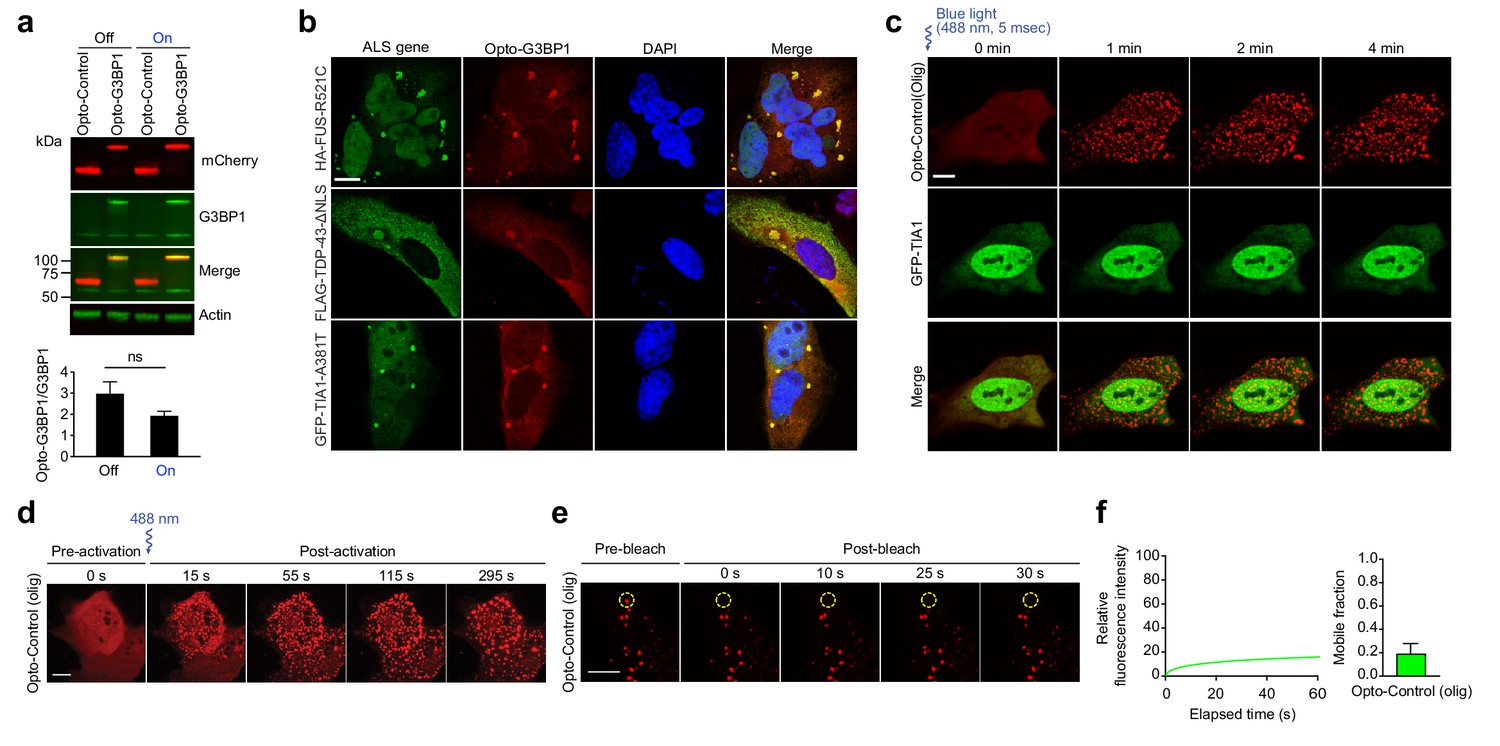
Opto-G3BP1 assembles light-dependent cytoplasmic clusters.
(a) Top: Immunoblot showing expression levels of mCherry (red) and G3BP1 (green) in U2OS cells stably expressing Opto-Control or Opto-G3BP1 with or without blue light stimulation. Bottom: Quantification of top immunoblot. Representative blot is shown from n = 3 independent experiments. Data shown as mean + s.e.m. ns, not significant by t-test. (b) U2OS stably expressing Opto-G3BP1 were transiently transfected with HA-FUS-R521C, FLAG-TDP-43-ΔNLS or GFP-TIA1-A381T. Representative images are shown from n = 3 independent experiments. c, U2OS cells were transiently transfected with Opto-Control (olig) and the stress granule marker GFP-TIA1 and stimulated with blue light for 5 msec (power density ~2.5 MW/cm2). Cells were sequentially imaged by 561 nm and 488 nm channels; we note that the 488 nm channel used for imaging also activates Opto-G3BP1 (power density 2.2 W/cm2). Representative images are shown from n = 3 independent experiments. (d) U2OS cells transiently transfected with Opto-Control (olig) were stimulated with a single 5-msec pulse of 488 nm blue light (power density ~2.5 MW/cm2) in a defined ROI. Representative images are shown from n = 3 independent experiments. (e-f) U2OS cells were transiently transfected with Opto-Control (olig) and stimulated with a 488 nm laser (power density ~4.5 W/cm2) for 3 mins. Regions marked with yellow circles were photobleached and monitored for fluorescence recovery. Data are shown as representative images and relative fluorescence intensity of photobleached region over time (e), and relative mobile fraction derived from n = 10 cells (f). Data are representative of n = 3 independent experiments. Data shown as mean +s.d. Scale bars, 10 μm in all micrographs.
Figure 1—figure supplement 2
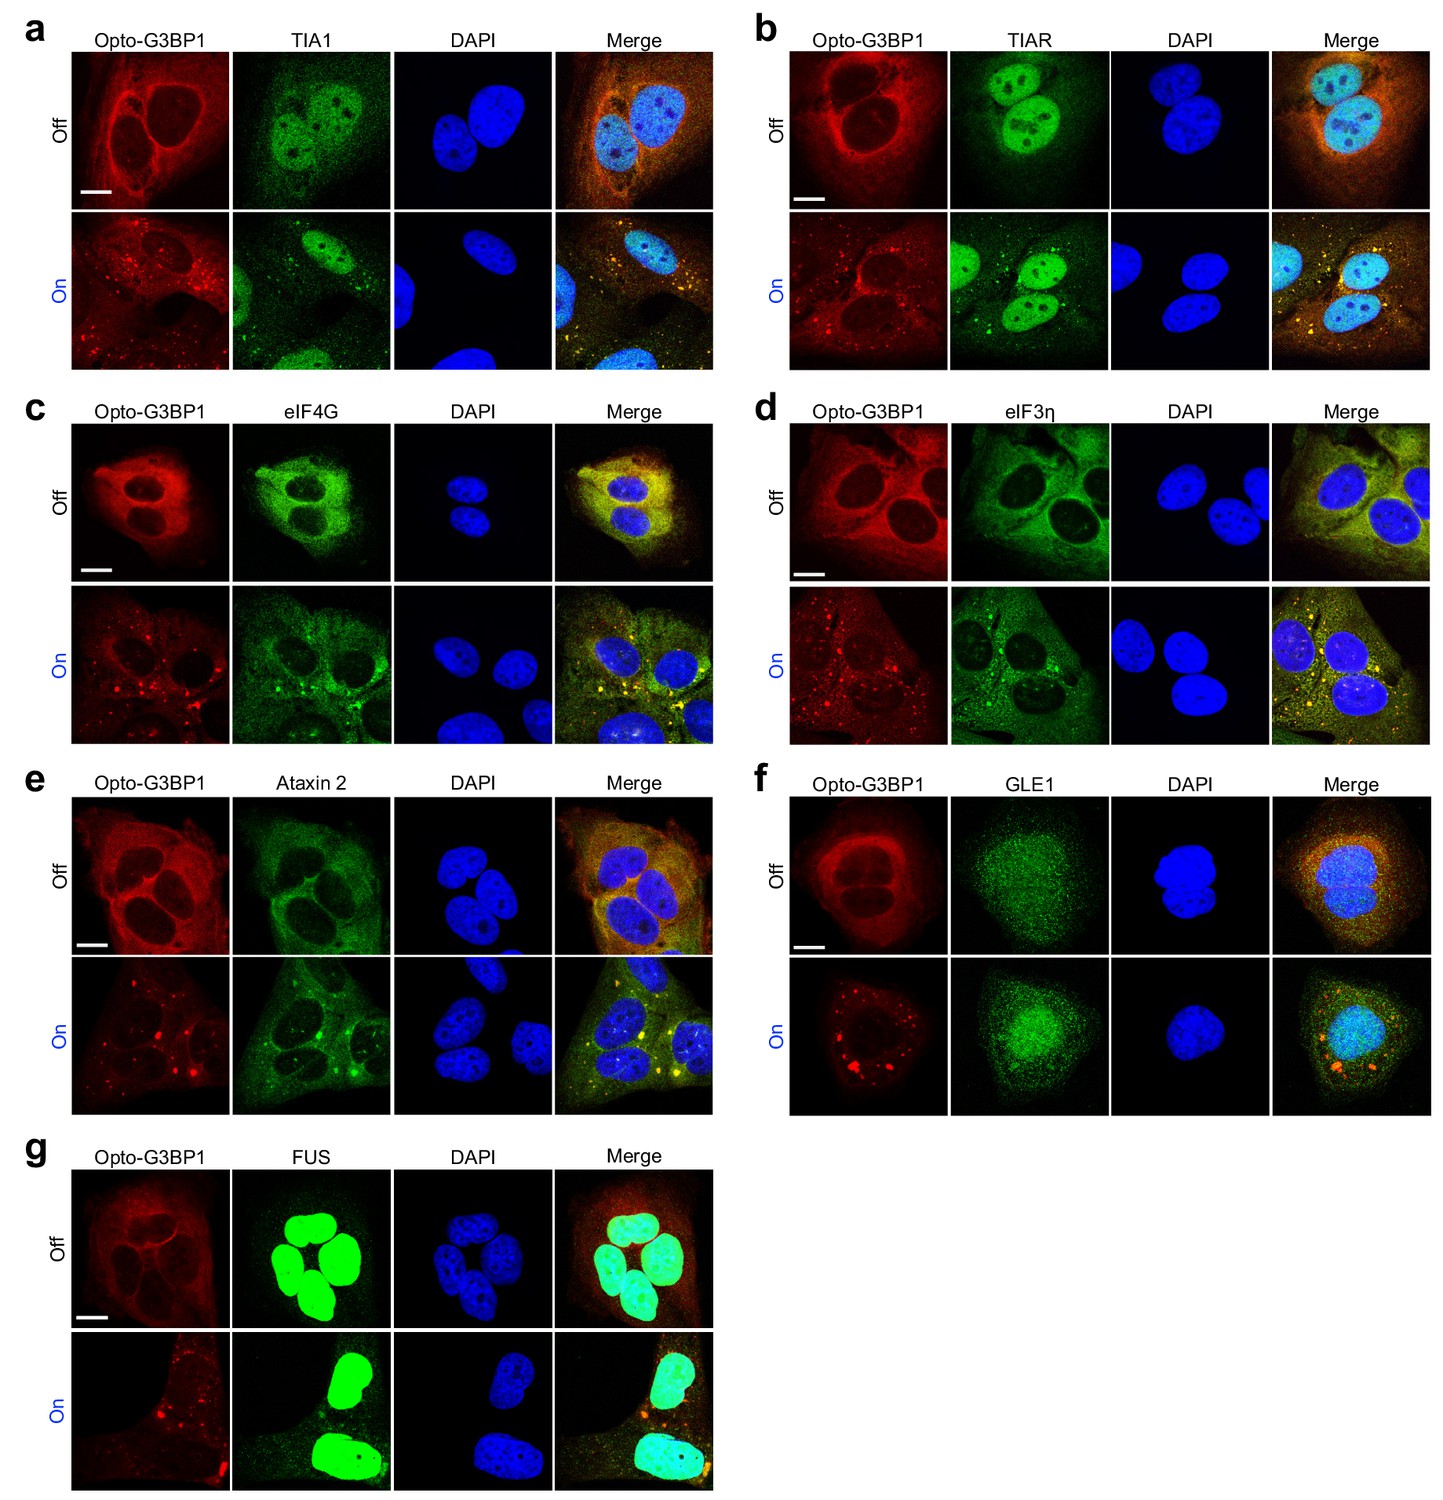
OptoGranules are light-inducible stress granules.
(a-g) U2OS cells stably expressing Opto-G3BP1 with or without continuous blue light (~2 mW/cm2) using custom-made LED arrays for 5 hr were immunostained with antibodies against TIA1 (a), TIAR (b), eIF4G (c), eIF3η (d), ataxin 2 (e), GLE1 (f), or FUS (g). Representative images are shown from n = 3 independent experiments. Scale bars, 10 μm in all micrographs.
Figure 1—figure supplement 3
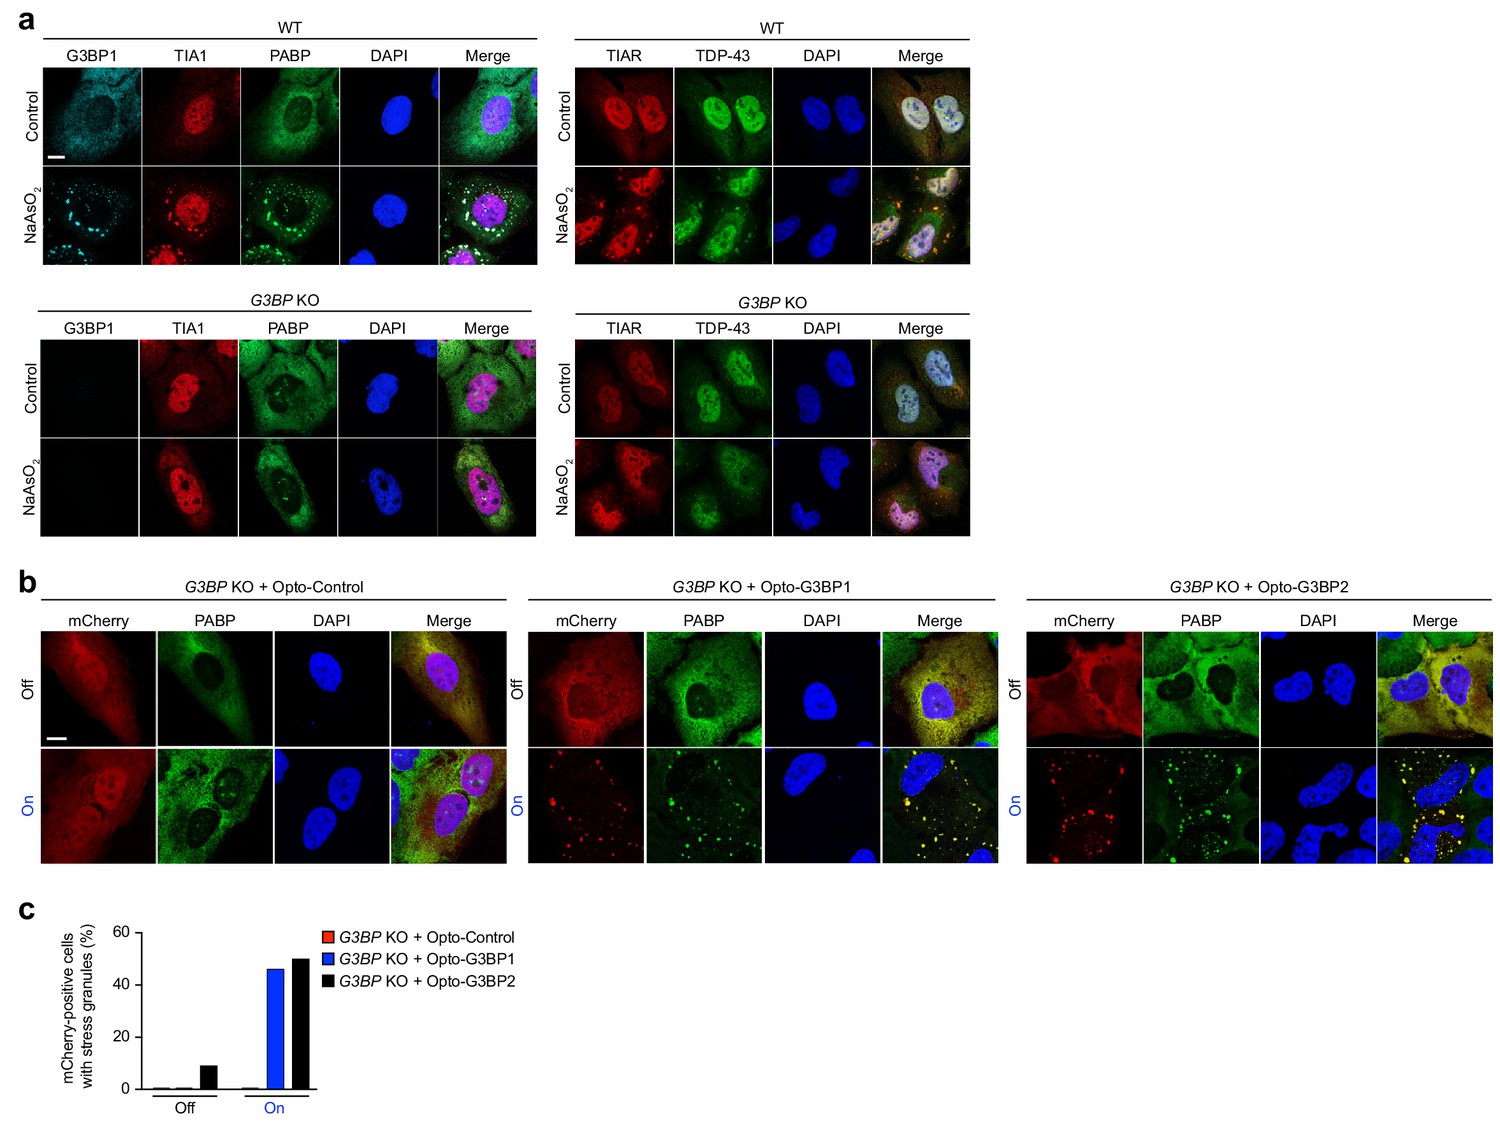
OptoGranules rescue stress granule formation in G3BP1/2 double KO cells.
(a-h,) (a) WT U2OS cells (top) and G3BP1/2 double KO U2OS cells (bottom) with or without sodium arsenite (0.5 mM NaAsO2, 45 min) treatment were immunostained for G3BP1 as well as stress granule markers TIA1, PABP, TIAR, and TDP-43. Representative images are shown from n = 3 independent experiments. (b) G3BP1/2 double KO cells transiently transfected with Opto-Control (left), Opto-G3BP1 (middle), or Opto-G3BP2 (right) constructs exposed to 6 hr continuous blue light (~2 mW/cm2) using custom-made LED arrays and immunostained for the stress granule marker PABP. Representative images are shown from n = 3 independent experiments. (c) Quantification of PABP-positive stress granules in (b). Data are representative of n = 3 independent experiments.
Figure 1—figure supplement 4
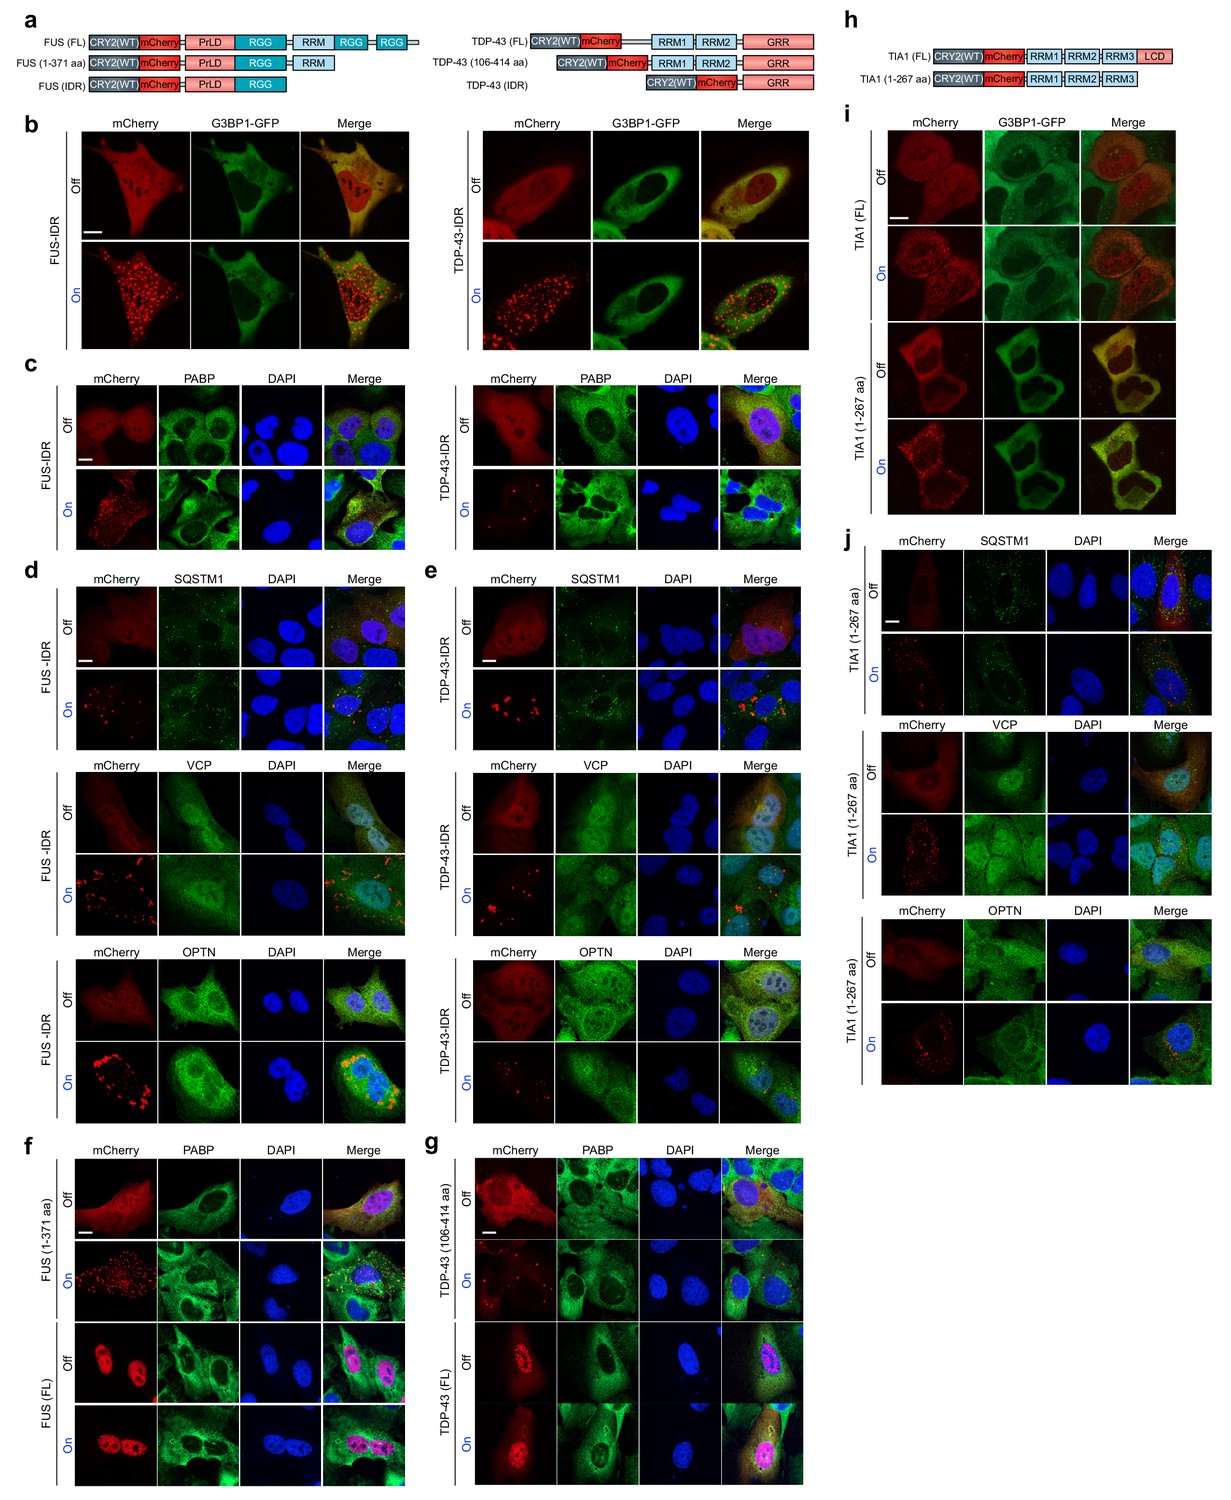
OptoDroplets are not stress granules.
(a) Schematic diagram of Opto-FUS (left) and Opto-TDP-43 (right) constructs. (b) U2OS cells were transiently co-transfected with stress granule marker G3BP1-GFP together with either Opto-FUS-IDR or Opto-TDP-43-IDR. Cells were stimulated with a blue light laser (power density ~2.5 MW/cm2) for 5 msec and imaged by 561 nm and 488 nm channels. Representative images are shown from n = 3 independent experiments. (c) U2OS cells were transiently transfected with Opto-FUS-IDR or Opto-TDP-43-IDR and imaged before and after continuous blue light (~2 mW/cm2) stimulation for 2 hr using custom-made LED arrays by immunostaining with antibodies against PABP. (d,e) U2OS cells were transiently transfected with Opto-FUS-IDR (d) or Opto-TDP-43-IDR (e) and imaged before and after continuous blue light (~2 mW/cm2) stimulation for 5 hr using custom-made LED arrays by immunostaining with antibodies against SQSTM1 (top), VCP (middle), or OPTN (bottom). (f,g) U2OS cells were transiently transfected with Opto-FUS (1–371 aa) or Opto-FUS (full-length) (f) or Opto-TDP-43 (106–414 aa) or Opto-TDP-43 (full-length) (g) and imaged before and after continuous blue light (~2 mW/cm2) stimulation for 2 hr using custom-made LED arrays by immunostaining with stress granule marker PABP. (h) Schematic diagram of Opto-TIA1 constructs. (i) U2OS cells were transiently co-transfected with Opto-TIA1 (full-length) or Opto-TIA1 (1–267 aa) and stress granule marker G3BP1-GFP, stimulated with a blue light laser (power density ~2.5 MW/cm2) for 5 msec, and imaged by 561 nm and 488 nm channels. (j) U2OS cells were transiently transfected with Opto-TIA1 (1–267 aa) and imaged before and after continuous blue light (~2 mW/cm2) stimulation for 5 hr using custom-made LED arrays by immunostaining with antibodies against SQSTM1 (top), VCP (middle), or OPTN (bottom). Representative images are shown from n = 3 independent experiments. Scale bars, 10 μm in all micrographs.
Figure 2 with 1 supplement

OptoGranule formation is dependent on the local concentration of activated G3BP1 and dependent on polysome disassembly, but independent of eIF2α phosphorylation.
(a) U2OS cells stably expressing Opto-G3BP1 were intermittently exposed to a blue-light laser (488 nm) for activation followed by image acquisition with a 561 nm channel. Blue light intensity was sequentially increased from top to bottom (488 nm power density measurement from top to bottom: 1%, 0.02 W/cm2; 5%, 0.04 W/cm2; 25%, 0.95 W/cm2; 75%, 5.5 W/cm2). Representative images are shown from n = 3 independent experiments. (b) Quantification of data in cells treated as in (a). Error bars represent s.d. (c) U2OS cells with different expression levels of Opto-G3BP1 were intermittently exposed to a 488 nm blue-light laser (90% laser power, power density 6.3 W/cm2) followed by image acquisition with a 561 nm channel. Relative expression levels from top to bottom: 0.19, 0.32, 0.78 and 1 a.u. Representative images are shown from n = 3 independent experiments. (d) Quantification of data in cells treated as in (c). (e) U2OS cells stably expressing Opto-G3BP1 were pre-treated with cycloheximide (CHX) or ISRIB for 30 min and then exposed to 45 min of sodium arsenite (0.5 mM NaAsO2) or 6 hr of continuous blue light (~2 mW/cm2) using custom-made LED arrays for global activation, and immunostained with PABP antibody. (f) Quantification of granule-positive cells from (e). Data are shown as mean ± s.e.m. from n = 3 independent experiments. ****p<0.0001; ns, not significant by one-way ANOVA with Tukey’s post-test. (g) Immunoblot showing phosphorylated eIF2α (P-eIF2α), eIF2α, and actin levels in cells treated with sodium arsenite (0.5 mM NaAsO2) for 45 min, exposed to 42°C heat shock for 1 hr, or activated with blue light for 6 hr. See also Figure 2—figure supplement 1 for sequential probe images. Scale bars, 10 μm in all micrographs.
Figure 2—figure supplement 1
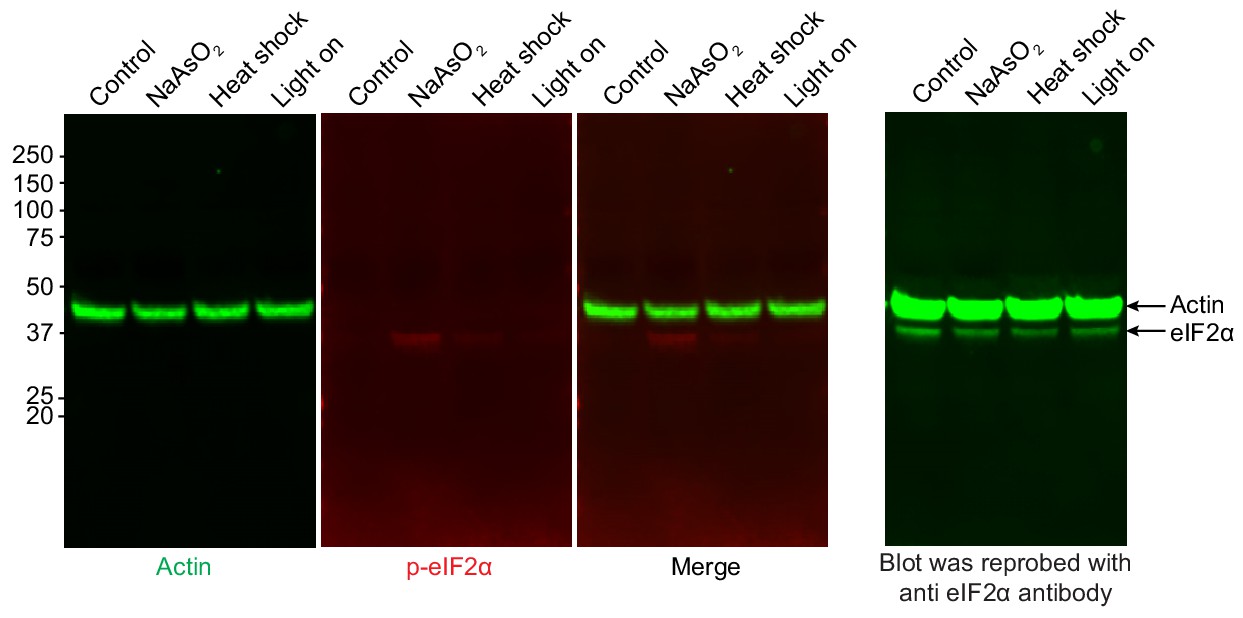
OptoGranule formation is independent of eIF2α phosphorylation.
Immunoblot showing phosphorylated eIF2α and actin levels in cells treated with sodium arsenite (0.5 mM NaAsO2) for 45 min, exposed to 42°C heat shock for 1 hr, or exposed to continuous blue light (~2 mW/cm2) stimulation for 6 hr using custom-made LED arrays. The first round of primary antibodies were anti-actin (goat) and anti-phospho-eIF2α (rabbit), which were developed using corresponding fluorescent secondary antibodies (actin: IRDye 800CW [green] donkey anti-goat; phospho-eIF2α: IRDye 680RD [red] donkey anti-rabbit). After an overnight wash, the membrane was reblotted with anti-eIF2α (mouse) primary antibody and IRDye 800CW (green) donkey anti-mouse secondary antibody.
Figure 3 with 1 supplement
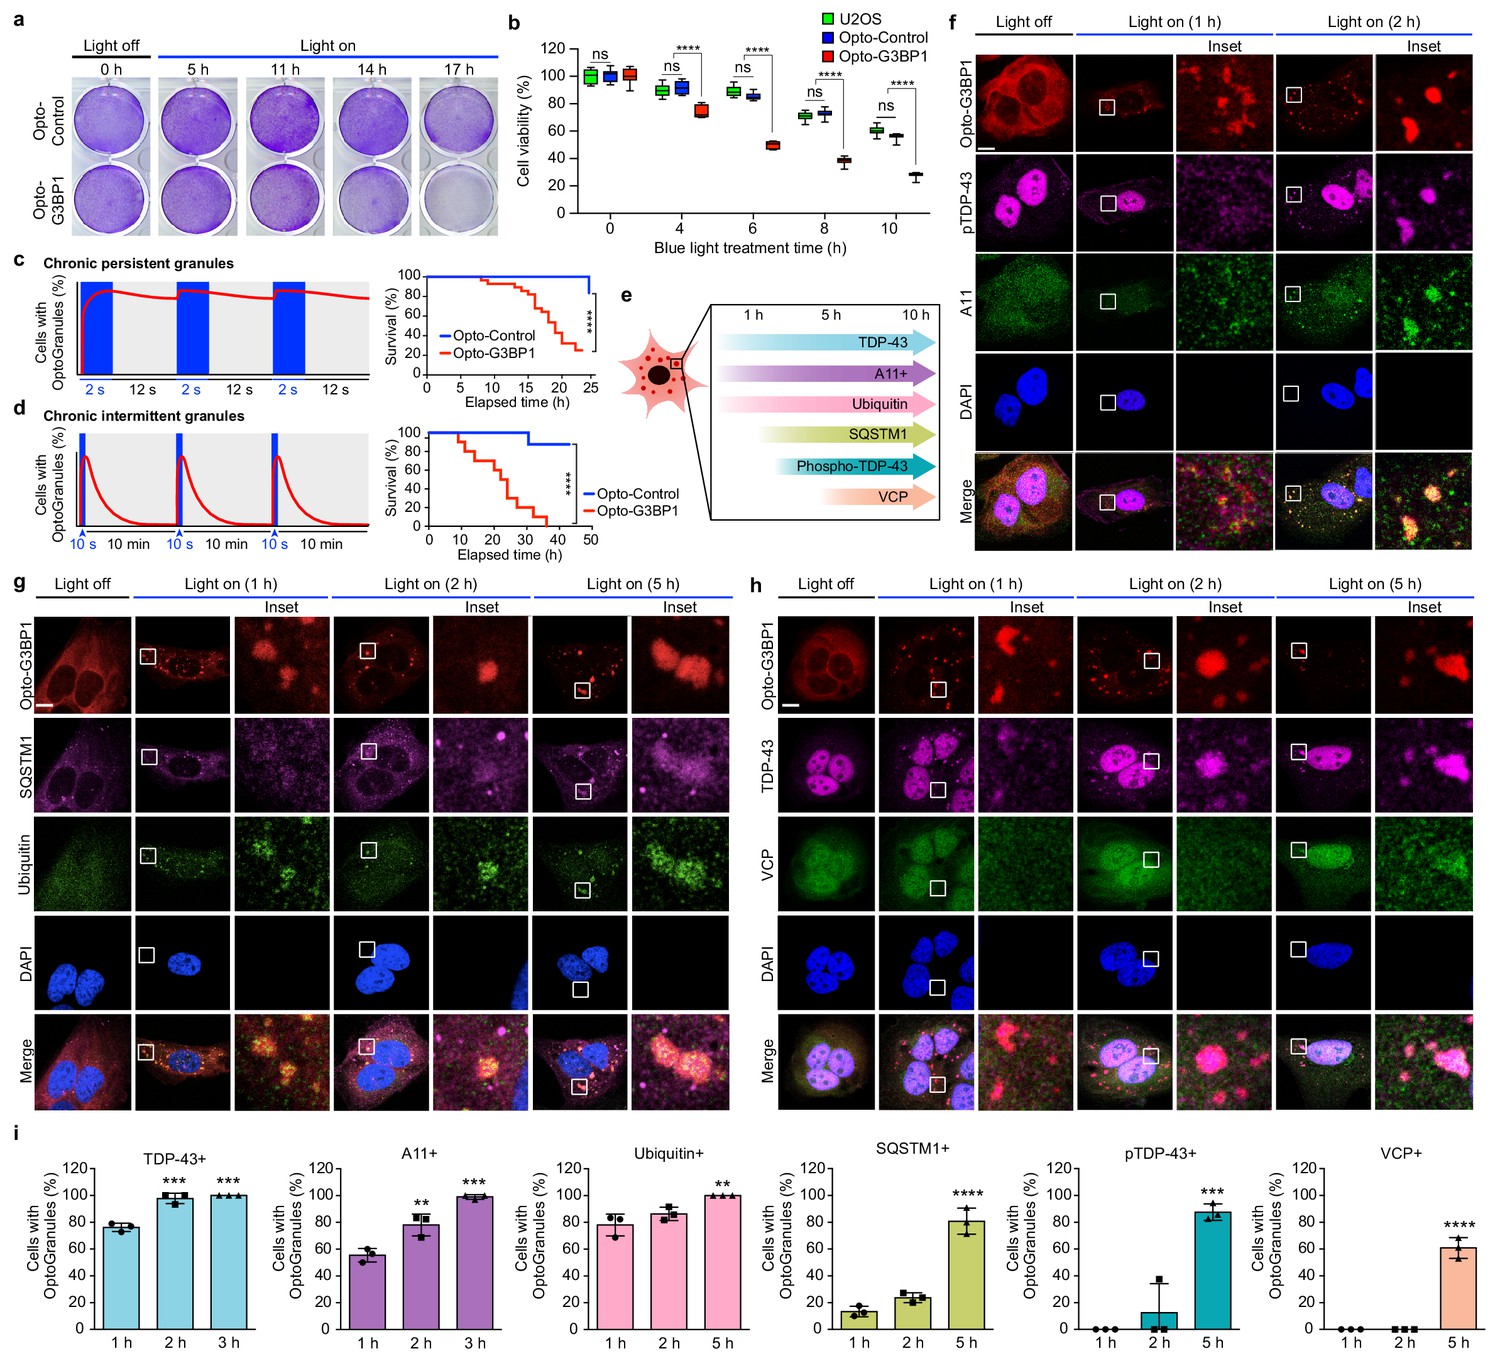
Persistent OptoGranules are cytotoxic and evolve to pathological inclusions.
(a,b) U2OS cells stably expressing Opto-Control or Opto-G3BP1 were stimulated with continuous blue light (~2 mW/cm2) for indicated times using custom-made LED arrays and viability was assessed by crystal violet staining (a) or CellTiter-Glo 2.0 luminescence (b). Whiskers represent minimum to maximum from n = 9 biological replicates. ****p<0.0001.; ns, not significant by two-way ANOVA with Tukey’s post-test. (c,d) U2OS cells stably expressing Opto-Control or Opto-G3BP1 were exposed to chronic persistent (c) or chronic intermittent (d) blue light (445 nm) stimulation with live-cell imaging (power density ~0.12 W/cm2) as illustrated in the schematic (left) and assessed for cell survival by counting living cells (right). Blue boxes in schematic indicate the timing of light induction; red line is an idealized graph of the cellular response. Chronic persistent paradigm: n = 26 for Opto-Control and n = 28 for Opto-G3BP1. Chronic intermittent paradigm: n = 7 for Opto-Control and n = 10 for Opto-G3BP1. Data are shown from n = 3 independent experiments. ****p<0.0001 by log-rank (Mantel-Cox) test. (e) Timeline of protein accumulation in OptoGranules in U2OS cells. (f-h) U2OS cells stably expressing Opto-G3BP1 were stimulated with continuous blue light (~2 mW/cm2) for indicated times using custom-made LED arrays and co-immunostained with p-TDP-43 and A11 antibodies (f), SQSTM1 and ubiquitin antibodies (g), or VCP and TDP-43 antibodies (h). (i) quantification of data from (f-h). Error bars represent s.e.m. Images in f-h are representative of n = 3 independent experiments. ***p=0.0002 (2 hr), ***p=0.0001 (3 hr) for TDP-43, **p=0.0048 (2 hr), ***p=0.0002 (3 hr) for A11, **p=0.0051 (5 hr) for ubiquitin, ****p<0.0001 for SQSTM1, ***p=0.0003 for pTDP-43, and ****p<0.0001 for VCP by one-way ANOVA with Dunnett’s test. Scale bars, 10 μm in all micrographs.
Figure 3—figure supplement 1
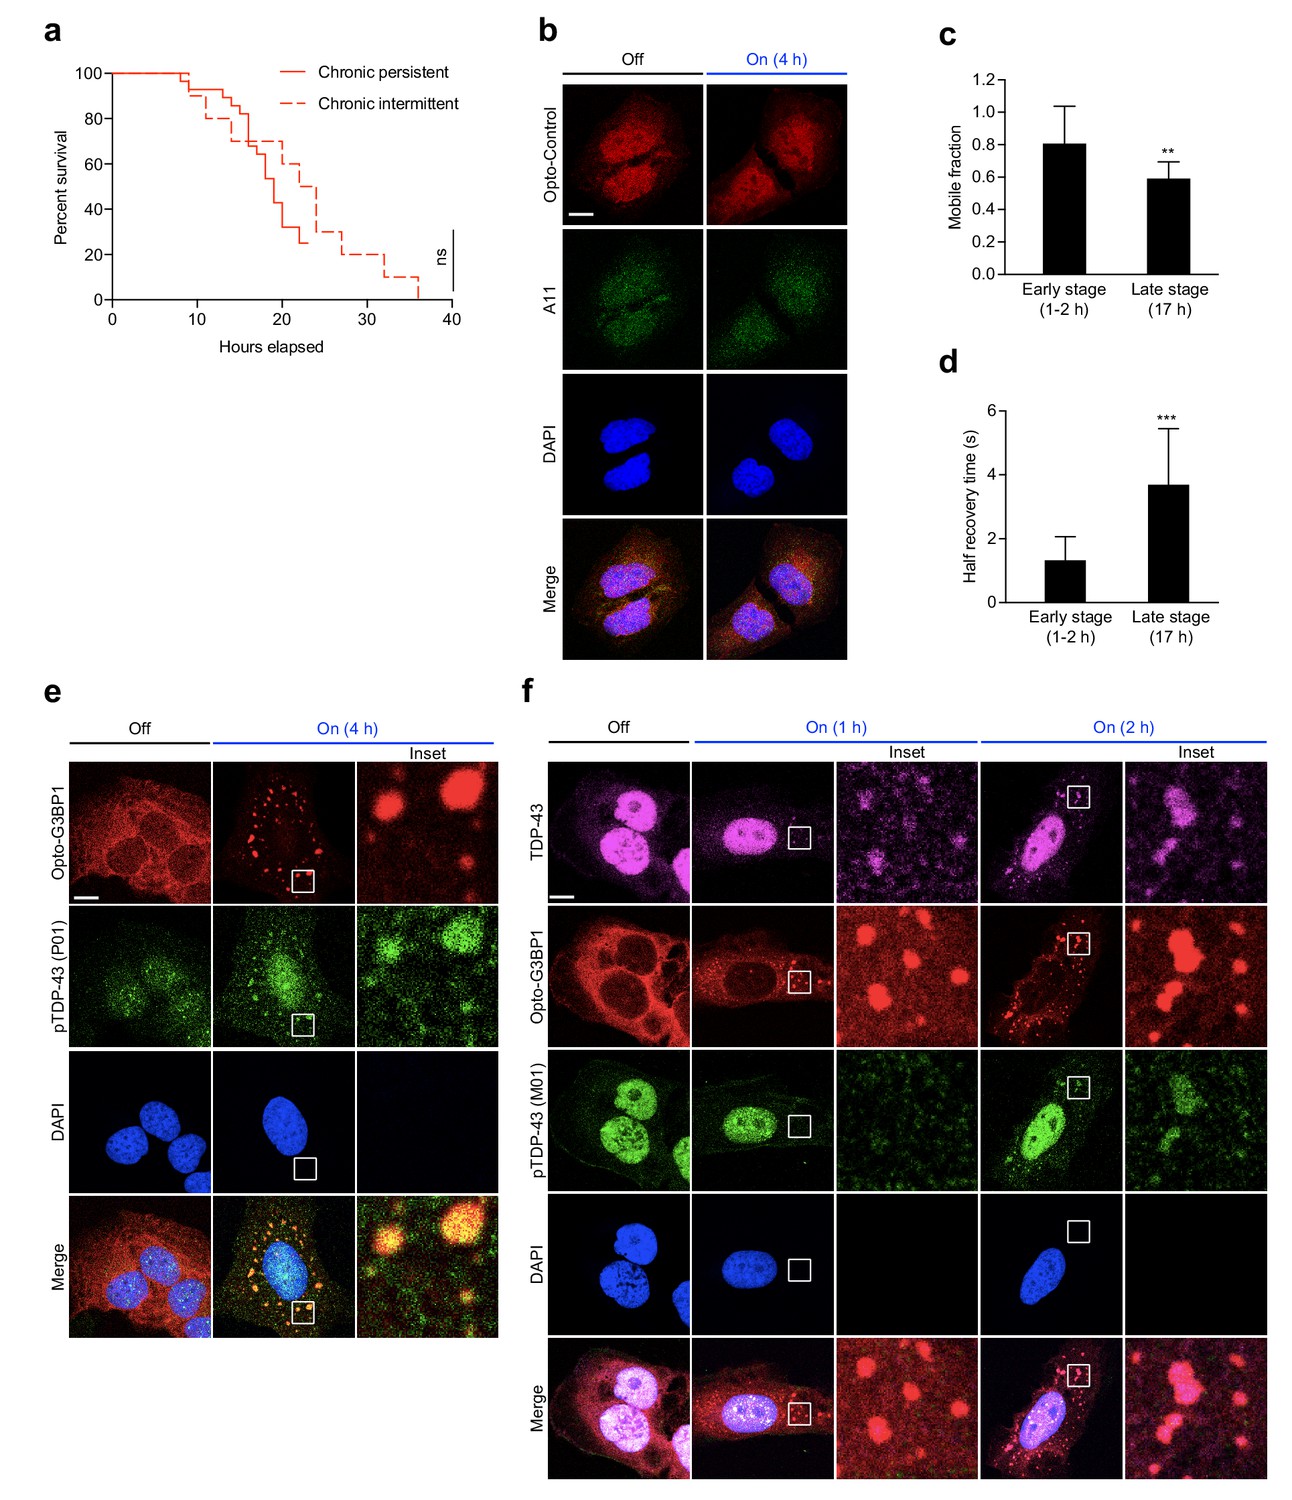
OptoGranules evolve to pathological inclusions.
(a) U2OS cells stably expressing Opto-G3BP1 were exposed to chronic persistent blue light stimulation (same data as shown in Figure 3c) or chronic intermittent blue light stimulation (same data as shown in Figure 3d). ns, not significant by log-rank (Mantel-Cox) test. (b) U2OS cells stably expressing Opto-Control were stimulated with continuous blue light (~2 mW/cm2) for 4 hr using custom-made LED arrays and then immunostained for A11. Representative images are shown from n = 3 independent experiments. (c-d) U2OS cells stably expressing Opto-G3BP1 were exposed to chronic persistent blue light stimulation with live cell imaging as shown in Figure 3c for 1–2 hr (early stage) or 17 hr (late stage). At indicated time points, the relative mobile fraction (c) and half recovery time (d) of Opto-G3BP1 were measured using FRAP. Error bars represent s.d. **p<0.01, ***p<0.001 by t-test. (e) U2OS cells stably expressing Opto-G3BP1 were stimulated with continuous blue light (~2 mW/cm2) for 4 hr using custom-made LED arrays and then immunostained for p-TDP-43 (P01). Representative images are shown from n = 2 independent experiments. (f) U2OS cells stably expressing Opto-G3BP1 were stimulated with continuous blue light (~2 mW/cm2) using custom-made LED arrays for indicated times and then co-immunostained for TDP-43 and p-TDP-43 (M01). Representative images are shown from n = 3 independent experiments. Scale bars, 10 μm in all micrographs.
Figure 4 with 2 supplements

Persistent OptoGranules are cytotoxic and evolve to pathological inclusions in human iPSC-derived neurons.
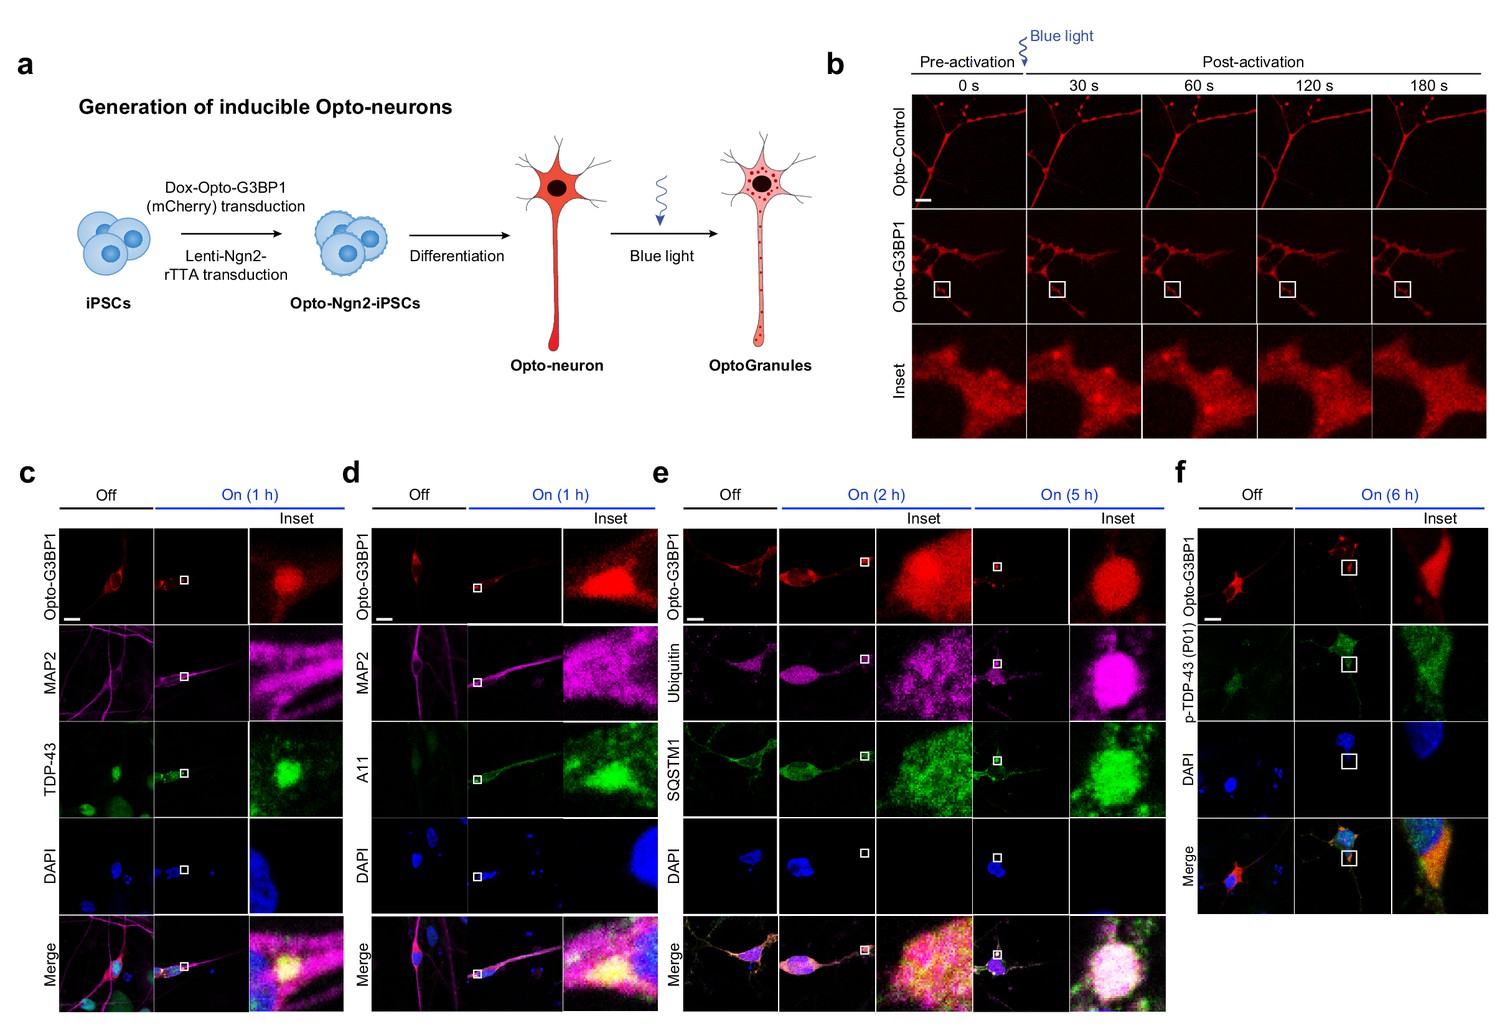
(a) Schematic illustrating generation of iPSC-derived neurons stably expressing Opto-G3BP1. (b) iPSC-derived neurons expressing Opto-Control (mRuby) or Opto-G3BP1 (mRuby) were intermittently exposed to a 488 nm blue-light laser (90% laser power, power density 6.3 W/cm2) followed by image acquisition with a 561 nm channel. Representative images are shown from n = 3 independent experiments. (c) iPSC-derived neurons expressing Opto-Control or Opto-G3BP1 were exposed to chronic persistent stimulation as in Figure 3c and survival was assessed by counting living cells. n = 35 cells for Opto-Control and n = 34 cells for Opto-G3BP1. Data are representative of n = 3 independent experiments. ****p<0.0001 by log-rank (Mantel-Cox) test. (d) Timeline of pathological protein accumulation in OptoGranules in iPSC-derived neurons. (e-h) iPSC-derived neurons expressing Opto-G3BP1 were stimulated with continuous blue light (~2 mW/cm2) for indicated times using custom-made LED arrays and co-immunostained with MAP2 and TDP-43 antibodies (e), MAP2 and A11 antibodies (f), MAP2 and p-TDP-43 (P01) antibodies (g), or ubiquitin and SQSTM1 antibodies (h). See also Figure 4—figure supplement 1e for line scans of images shown in (h).(i) quantification of data from e-h. Error bars represent s.e.m. Images in e-h are representative of n = 3 independent experiments. *p=0.0489 (2 hr), ***p=0.0001 (5 hr) for SQSTM1 and ****p<0.0001 for pTDP-43 by one-way ANOVA with Dunnett’s test. Scale bars, 10 μm in all micrographs.
Figure 4—figure supplement 1
iPSC-derived neurons form OptoGranules.
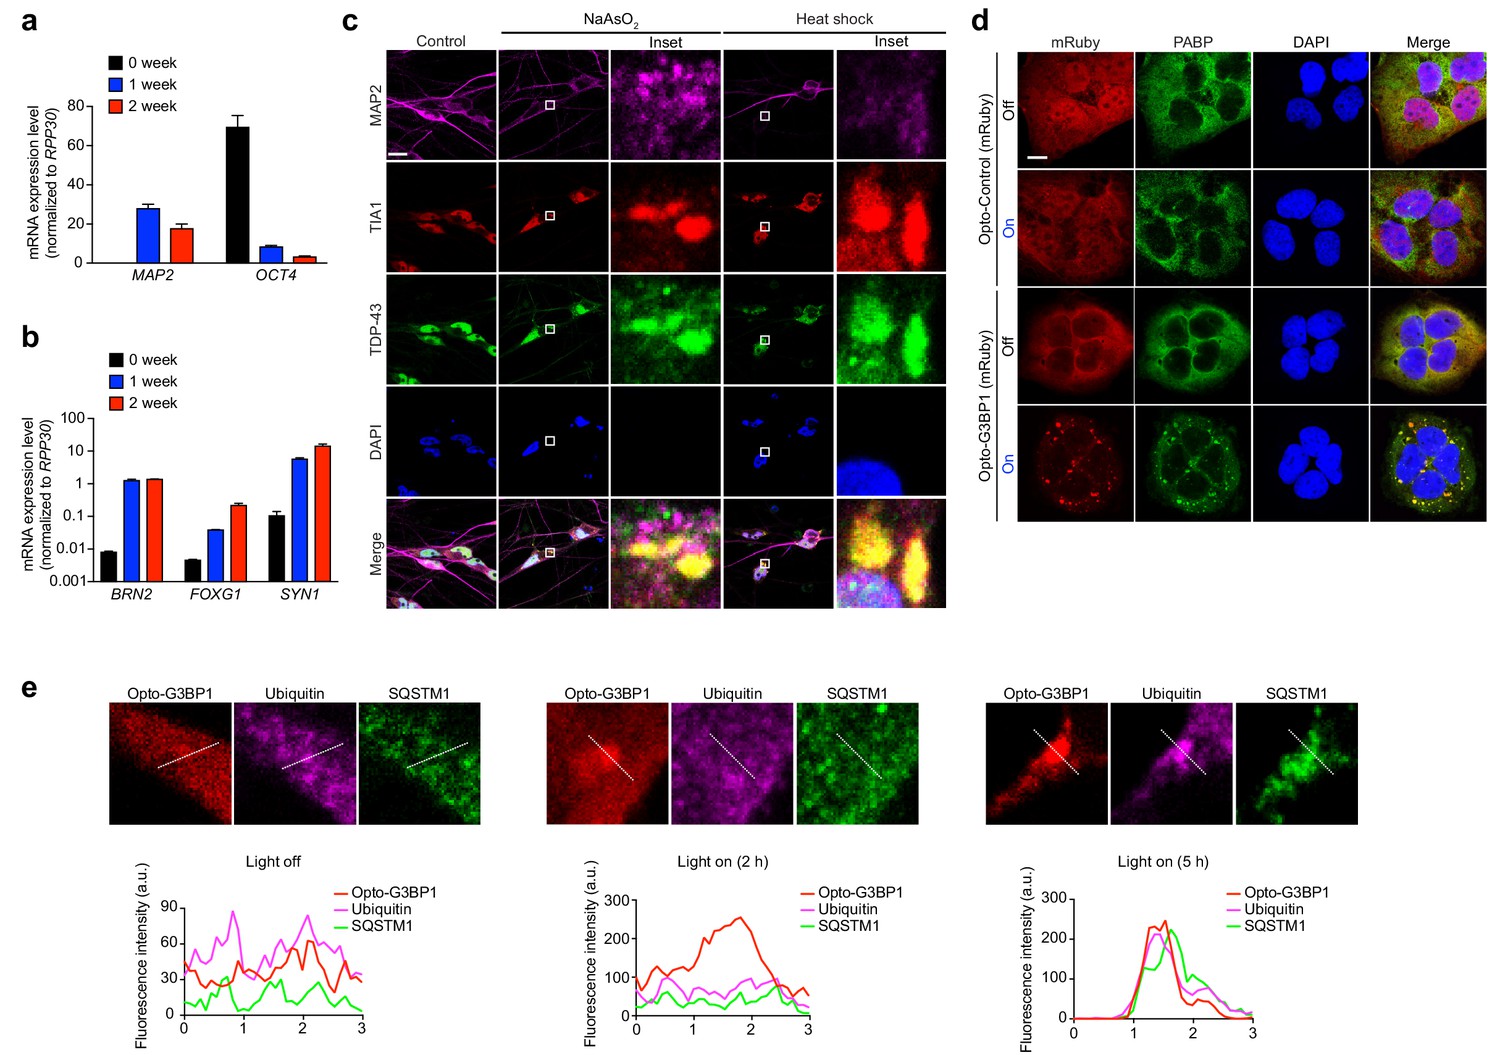
(ab) Quantification of mRNA levels in iPSC-derived neurons before or after 1 and 2 weeks of Ngn2 lentiviral infection. Levels are normalized for RPP30 mRNA levels as an internal control. Panel b is shown on a logarithmic scale. (c) iPSC-derived neurons were treated with 0.25 mM sodium arsenite for 30 min or 42°C heat shock for 1 hr and then immunostained for MAP2 along with stress granule markers TIA1 and TDP-43. (d) U2OS cells stably expressing Opto-Control (mRuby) or Opto-G3BP1 (mRuby) were stimulated with continuous blue light (~2 mW/cm2) for 2 hr using custom-made LED arrays and then immunostained for PABP. (e) Top: Enlarged images from Figure 4h. Bottom: Line scans indicate the degree of colocalization between Opto-G3BP1 (red), ubiquitin (violet), and SQSTM1 (green) in lines drawn within the magnified images. Images are representative of n = 3 independent experiments. Scale bars, 10 μm in all micrographs.
Figure 4—figure supplement 2
OptoGranules evolve to pathological inclusions in iPSC-derived neurons.
(a) Schematic illustrating generation of iPSC-derived neurons in which doxycycline induces both differentiation and Opto-G3BP1(mCherry) expression. (b) iPSC-derived neurons expressing doxycycline-inducible Opto-Control (mCherry) or Opto-G3BP1 (mCherry) were stimulated with one 5-msec pulse of a blue light laser (power density ~2.5 MW/cm2). Representative images are shown from n = 3 independent experiments. (c-f) iPSC-derived neurons expressing doxycycline-inducible Opto-G3BP1 (mCherry) were stimulated with continuous blue light (~2 mW/cm2) for indicated times using custom-made LED arrays and co-immunostained with MAP2 and TDP-43 antibodies (c), MAP2 and A11 antibodies (d), ubiquitin and SQSTM1 antibodies (e), or p-TDP-43 (P01) antibodies (f). Images in c-f are representative of n = 3 independent experiments. Scale bars, 10 μm in all micrographs.
Videos
Video 1
Opto-Control fails to assemble light-dependent cytoplasmic clusters.
U2OS cells stably expressing Opto-Control were stimulated with a single 5-msec pulse of 488 nm blue light (power density ~2.5 MW/cm2) in a defined ROI. See Video 2 for corresponding Opto-G3BP1 condition.
Video 2
Opto-G3BP1 assembles light-dependent cytoplasmic clusters.
U2OS cells stably expressing Opto-G3BP1 were stimulated with a single 5-msec pulse of 488 nm blue light (power density ~2.5 MW/cm2) in a defined ROI. Opto-G3BP1 assembles highly dynamic, liquid-like cytoplasmic granules, and these granules spontaneously disassemble over a period of approximately 5 min. See Video 1 for corresponding Opto-Control condition.
Video 3
Dynamic recruitment of the stress granule marker GFP-TIA1 into light-induced Opto-G3BP1 granules.
U2OS cells transiently transfected with Opto-G3BP1 and the stress granule marker GFP-TIA1 were stimulated with a blue-light laser (power density ~2.5 MW/cm2) for 5 msec. Cells were sequentially imaged by 561 nm and 488 nm channels; we note that the 488 nm channel used for imaging (power density 2.2 W/cm2) also activates Opto-G3BP1.
Video 4
Blue light activation fails to induce the assembly of OptoGranules in iPSC-derived neurons expressing Opto-Control.
iPSC-derived neurons expressing Opto-Control (mRuby) were intermittently exposed to a 488 nm blue-light laser (95% laser power, power density 6.5 W/cm2) followed by image acquisition with a 561 nm channel. See Video 5 for corresponding Opto-G3BP1 condition.
Video 5
Blue light activation induces the assembly of OptoGranules in iPSC-derived neurons expressing Opto-G3BP1.
iPSC-derived neurons expressing Opto-G3BP1 (mRuby) were intermittently exposed to a 488 nm blue-light laser (95% laser power, power density 6.5 W/cm2) followed by image acquisition with a 561 nm channel. See Video 4 for corresponding Opto-Control condition.
Tables
Key resources table
| Reagent type (species) or resource | Designation | Source or reference | Identifiers | Additional information |
|---|---|---|---|---|
| Cell line (Human) | U-2 OS | ATCC | HTB-96; RRID:CVCL_0042 | |
| Cell line (Human) | Lenti-X 293T(293LE) | Clontech | 632180; RRID: CVCL_4401 | |
| Cell line (Human) | iPSCs | Building a Kidney | BJFF6; RRID: CVCL_VU02 | |
| Recombinant DNA reagent | pCRY2PHR-mCherryN1 | Addgene | 26866; RRID:Addgene_26866 | |
| Recombinant DNA reagent | pCMV-CRY2-mCherry | Addgene | 58368; RRID:Addgene_58368 | |
| Recombinant DNA reagent | phND2-N174 | Addgene | 31822; RRID:Addgene_31822 | |
| Recombinant DNA reagent | pKanCMV-mClover3-mRuby3 | Addgene | 74252; RRID:Addgene_74252 | |
| Recombinant DNA reagent | pTight-hND2-N106 | Addgene | 31875; RRID:Addgene_31875 | |
| Recombinant DNA reagent | psPAX2 | Addgene | 12260; RRID:Addgene_12260 | |
| Recombinant DNA reagent | CRY2olig-mCherry | Addgene | 60032; RRID:Addgene_60032 | |
| Recombinant DNA reagent | pMD2.G | Addgene | 12259; RRID:Addgene_12259 | |
| Recombinant DNA reagent | linear hygromycin marker | Clontech | 631625; RRID:Addgene_60032 | |
| Antibody | goat polyclonal anti-β-actin | Santa Cruz Biotechnology | sc-1616; RRID: AB_630836 | (1:1000) |
| Antibody | mouse monoclonal anti-eIF2α | Santa Cruz Biotechnology | sc-133132; RRID: AB_1562699 | (1:1000) |
| Antibody | rabbit polyclonal anti-β-actin | Cell Signaling | 3597S; RRID: AB_390740 | (1:1000) |
| Antibody | rabbit polyclonal anti-mCherry | Abcam | 167453; RRID: AB_2571870 | (1:1000) |
| Antibody | mouse monoclonal anti-G3BP1 | BD Biosciences | 611126; RRID: AB_398437 | (1:1000) |
| Antibody | rabbit polyclonal anti-PABP | Abcam | ab21060; RRID: AB_777008 | (1:400) |
| Antibody | rabbit polyclonal anti-eIF4G | Santa Cruz Biotechnology | sc-11373; RRID: AB_2095750 | (1:400) |
| Antibody | rabbit polyclonal anti-TDP-43 | Proteintech | 12892–1-AP; RRID: AB_2200505 | (1:400) |
| Antibody | mouse monoclonal anti-phospho-TDP-43 (M01) | Cosmo Bio CO | TIP-PTD-MO1; RRID: AB_1961900 | (1:1000) |
| Antibody | rabbit polyclonal anti-phospho-TDP-43 (P01) | Cosmo Bio CO | TIP-PTD-PO1; RRID: AB_1961899 | (1:400) |
| Antibody | mouse monoclonal anti-VCP | BD Biosciences | 612183; RRID: AB_399554 | (1:100) |
| Antibody | rabbit polyclonal anti-amyloid-oligomer A11 | Thermo Fisher Scientific | AHB0052; RRID: AB_2536236 | (1:100) |
| Antibody | rabbit polyclonal anti-Ubiquitin | Dako | Z0458; RRID: AB_2315524 | (1:100) |
| Antibody | mouse monoclonal anti-p62 | Abcam | ab56416; RRID: AB_945626 | (1:400) |
| Antibody | mouse monoclonal anti-MAP2 | Sigma | M9942; RRID: AB_477256 | (1:400) |
| Antibody | goat polyclonal anti-TIA1 | Santa Cruz Biotechnology | sc-1751; RRID: AB_2201433 | (1:400) |
| Antibody | mouse monoclonal anti-TIAR | BD Biosciences | 610352; RRID: AB_397742 | (1:400) |
| Antibody | rabbit polyclonal anti-ataxin 2 | Proteintech | 21776–1-AP; RRID: AB_10858483 | (1:400) |
| Antibody | goat polyclonal anti-eIF3η | Santa Cruz Biotechnology | sc-16377; RRID: AB_671941 | (1:400) |
| Antibody | rabbit polyclonal anti- GLE1 | Abcam | ab96007; RRID: AB_10678755 | (1:400) |
| Antibody | rabbit polyclonal anti- FUS | Bethyl Laboratories | A300-302A; RRID: AB_309445 | (1:400) |
| Antibody | rabbit polyclonal anti- OPTN | Proteintech | 10837–1-AP; RRID: AB_2156665 | (1:400) |
| Commercial assay or kit | FuGENE 6 | Promega | E2691 | |
| Commercial assay or kit | NEBuilder HiFi DNA Assembly Master Mix kit | NEB | E2621 | |
| Commercial assay or kit | Q5 site-directed mutagenesis | NEB | E0054 | |
| Commercial assay or kit | RNA 3′ End Biotinylation Kit | Pierce | 20160 | |
| Commercial assay or kit | CellTiter-Glo 2.0 assay kit | Promega | G9242 | |
| Chemical compound, drug | ISRIB | Sigma | SML0843 | 200 nM |
| Chemical compound, drug | cycloheximide | Sigma | C4859 | 100 µg/ml |
| Chemical compound, drug | sodium arsenite | Sigma | 35000–1 L-R | 0.5 mM |
| Chemical compound, drug | hygromycin B | Thermo Fisher Scientific | 10687010 | 200 μg/ml |
| Chemical compound, drug | doxycycline hyclate | Sigma-Aldrich | D9891 | 1 µg/ml |
| Chemical compound, drug | puromycin | Thermo Fisher Scientific | A1113803 | 1 µg/ml |
| Software, algorithm | ImageJ | NIH | https://imagej.nih.gov/ij/, RRID:SCR_003073 | |
| Software, algorithm | GraphPad Prism | GraphPad Software Inc | http://www.graphpad.com/ scientific-software/prism/ RRID:SCR_002798 | |
| Software, algorithm | SlideBook 6 | Intelligent Imaging Innovations | https://www.intelligent-imaging.com/slidebook.php RRID:SCR_014300 | |
| Software, algorithm | Image Studio | LI-COR | https://www.licor.com/bio/products/software/image_studio_lite/?utm_source=BIO+Blog&utm_medium=28Aug13post&utm_content=ISLite1&utm_campaign=ISLite, RRID: SCR_014211 RRID:SCR_015795 | |
| Software, algorithm | LAS X Software | Leica | https://www.leica-microsystems.com/products/confocal-microscopes/p/leica-tcs-sp8/ RRID:SCR_013673 |
Additional files
-
Transparent reporting form
- https://doi.org/10.7554/eLife.39578.019
Download links
A two-part list of links to download the article, or parts of the article, in various formats.
Downloads (link to download the article as PDF)
Open citations (links to open the citations from this article in various online reference manager services)
Cite this article (links to download the citations from this article in formats compatible with various reference manager tools)
Chronic optogenetic induction of stress granules is cytotoxic and reveals the evolution of ALS-FTD pathology
eLife 8:e39578.
https://doi.org/10.7554/eLife.39578


