Replication Study: Melanoma exosomes educate bone marrow progenitor cells toward a pro-metastatic phenotype through MET
- Knockout and Tumor Model Center, Stanford Cancer Institute, United States
- System Biosciences LLC, United States
- The Institute for Stem Cell Biology and Regenerative Medicine, United States
- Stanford School of Medicine, United States
Figures
Figure 1 with 1 supplement
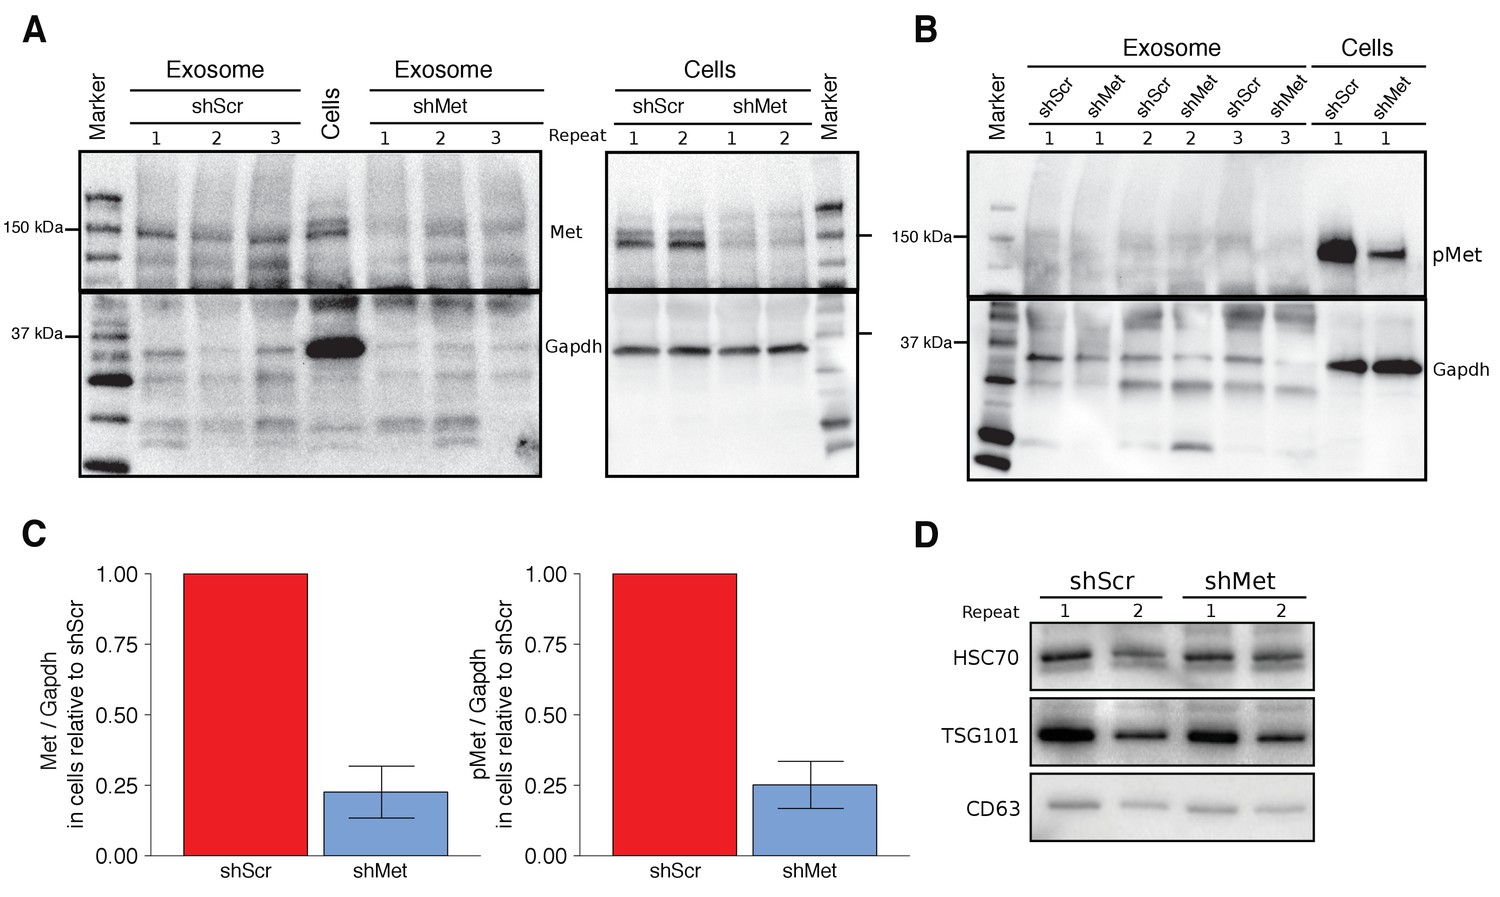
Characterization of shMet B16-F10 cells and exosomes.
B16-F10 cells engineered to express shScr or shMet were used to purify exosomes. (A) Representative Western blots of exosomes and B16-F10 cells expressing the indicated shRNA were probed with antibodies specific for total Met (top panel) and Gapdh (bottom panel). Membranes were cut at ~75 kDa so that Met and Gapdh could be probed in parallel. Repeat indicates the number of independently isolated exosome and cell lysate preparations from the same batch of infected cells. The fourth lane, labeled ‘Cells’ are lysate from B16-F10 cells expressing shScr. (B) Representative Western blots of exosomes and B16-F10 cells expressing the indicated shRNA were probed with antibodies specific for phosphorylated (Tyr 1234/1235) Met (pMet) (top panel) and Gapdh (bottom panel). Membranes were cut at ~75 kDa so that pMet and Gapdh could be probed in parallel. Repeat indicates the number of independently isolated exosome preparations from the same batch of infected cells. (C) Western blot bands were quantified for cells. Met or pMet levels were normalized to Gapdh, and protein expression presented relative to shScr conditions. Expression level of shScr condition was assigned a value of 1. Means reported and error bars represent SD. Results are from 3 independent biological repeats for Met expression and 4 independent biological repeats for pMet expression. Exploratory analysis: one-sample t-test on Met levels (Met/Gapdh) in shMet cells compared to a constant of 1 (shScr cells): t(2) = 8.41, p = 0.014, Bonferroni corrected p = 0.028, Cohen’s d = 4.85, 95% CI [0.55, 9.43]; one-sample t-test on pMet levels (Met/Gapdh) in shMet cells compared to a constant of 1 (shScr cells): t(3) = 8.94, p = 0.003, Bonferroni corrected p = 0.006, Cohen’s d = 4.47, 95% CI [1.02, 8.01]. (D) Representative Western blot of exosomes isolated from cells expressing the indicated shRNA probed with exosome markers Hsc70, Tsg101, and Cd63 specific antibodies. Experiment performed on 3 independent biological repeats for each condition from the same batch of infected cells. Additional details for this experiment can be found at https://osf.io/aqm2m/.
Figure 1—figure supplement 1
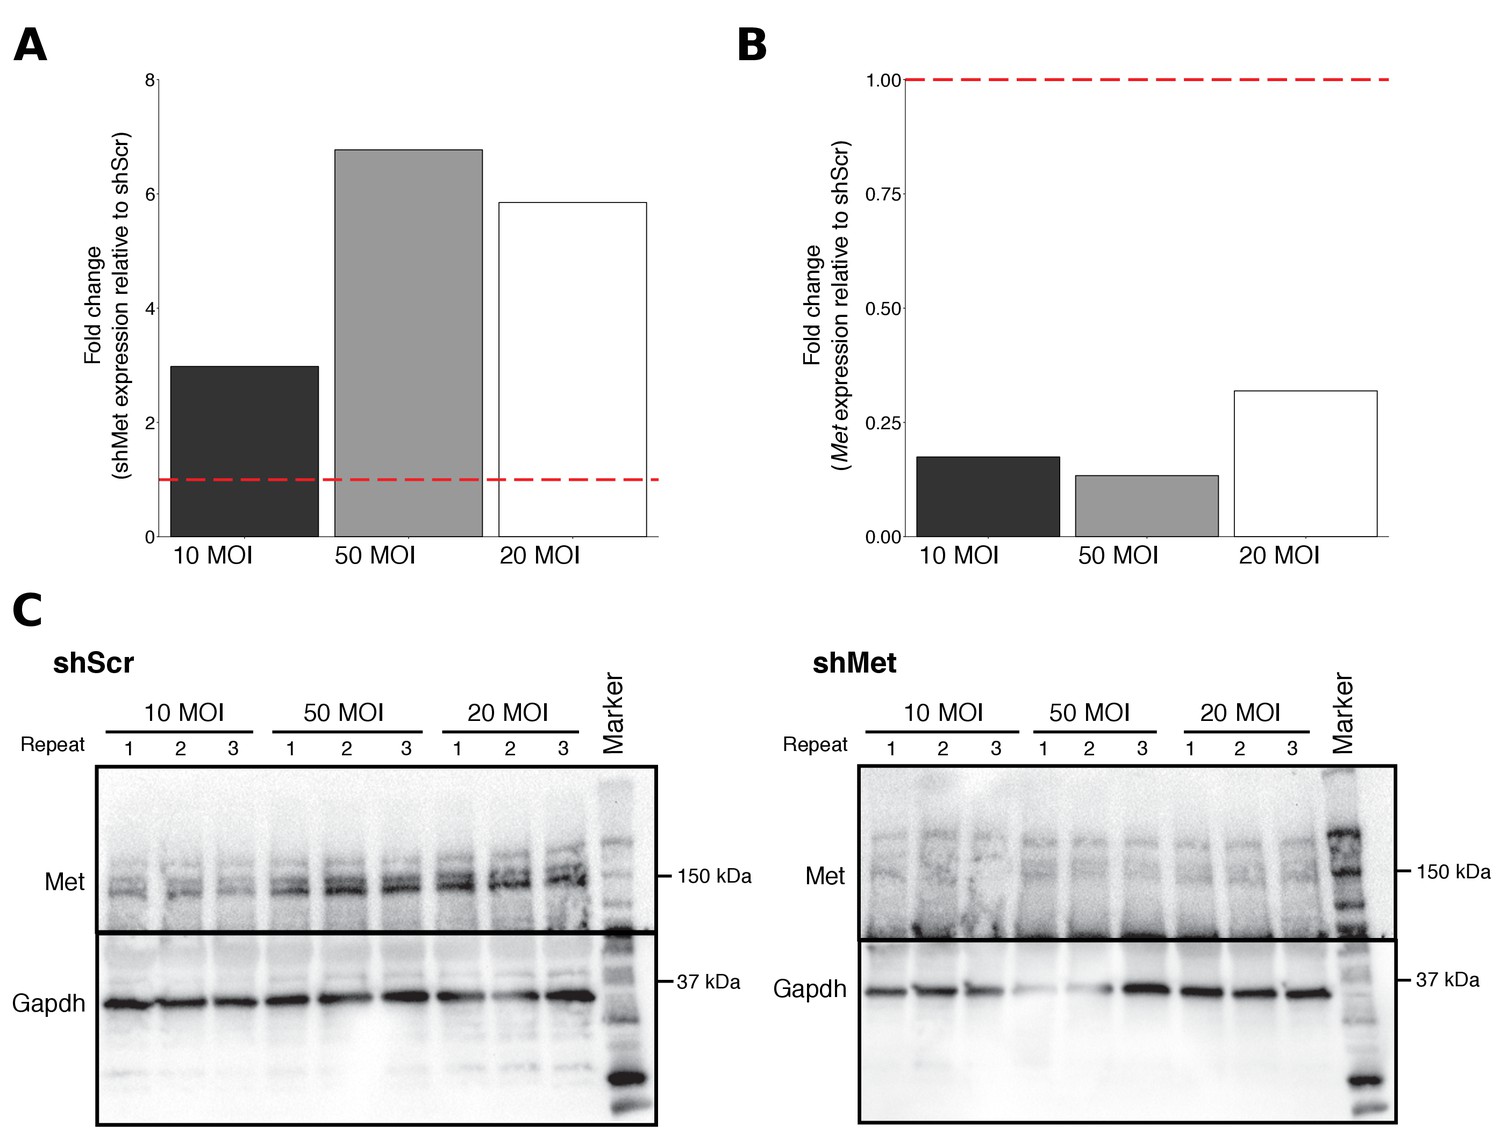
Multiplicity of infection (MOI) ratios tested for stable cell line generation.
B16-F10 cells infected with various MOI ratios were characterized for shMet, Met, and Met expression. (A) Relative expression levels of shMet (normalized to U6) was determined by qRT-PCR for each cell line. For each MOI tested, fold change in shMet expression in shMet cells relative to shScr cells was determined. Expression level of shScr cells was assigned a value of 1, which is indicated by the dashed line. Means reported from one biological repeat. (B) Relative expression levels of Met (normalized to Gapdh) was determined by qRT-PCR for each cell line. For each MOI tested, fold change in Met expression in shMet cells relative to shScr cells was determined. Expression levels of shScr cells was assigned a value of 1, which is indicated by the dashed line. Means reported from one biological repeat. (C) Western blots using anti-Met (top panel) and anti-Gapdh (bottom panel) antibodies. Membranes were cut at ~75 kDa so that Met and Gapdh could be probed in parallel. Repeat indicates the number of independently isolated cell lysate preparations from the same batch of infected cells. Additional details for this experiment can be found at https://osf.io/aqm2m/.
Figure 2 with 1 supplement
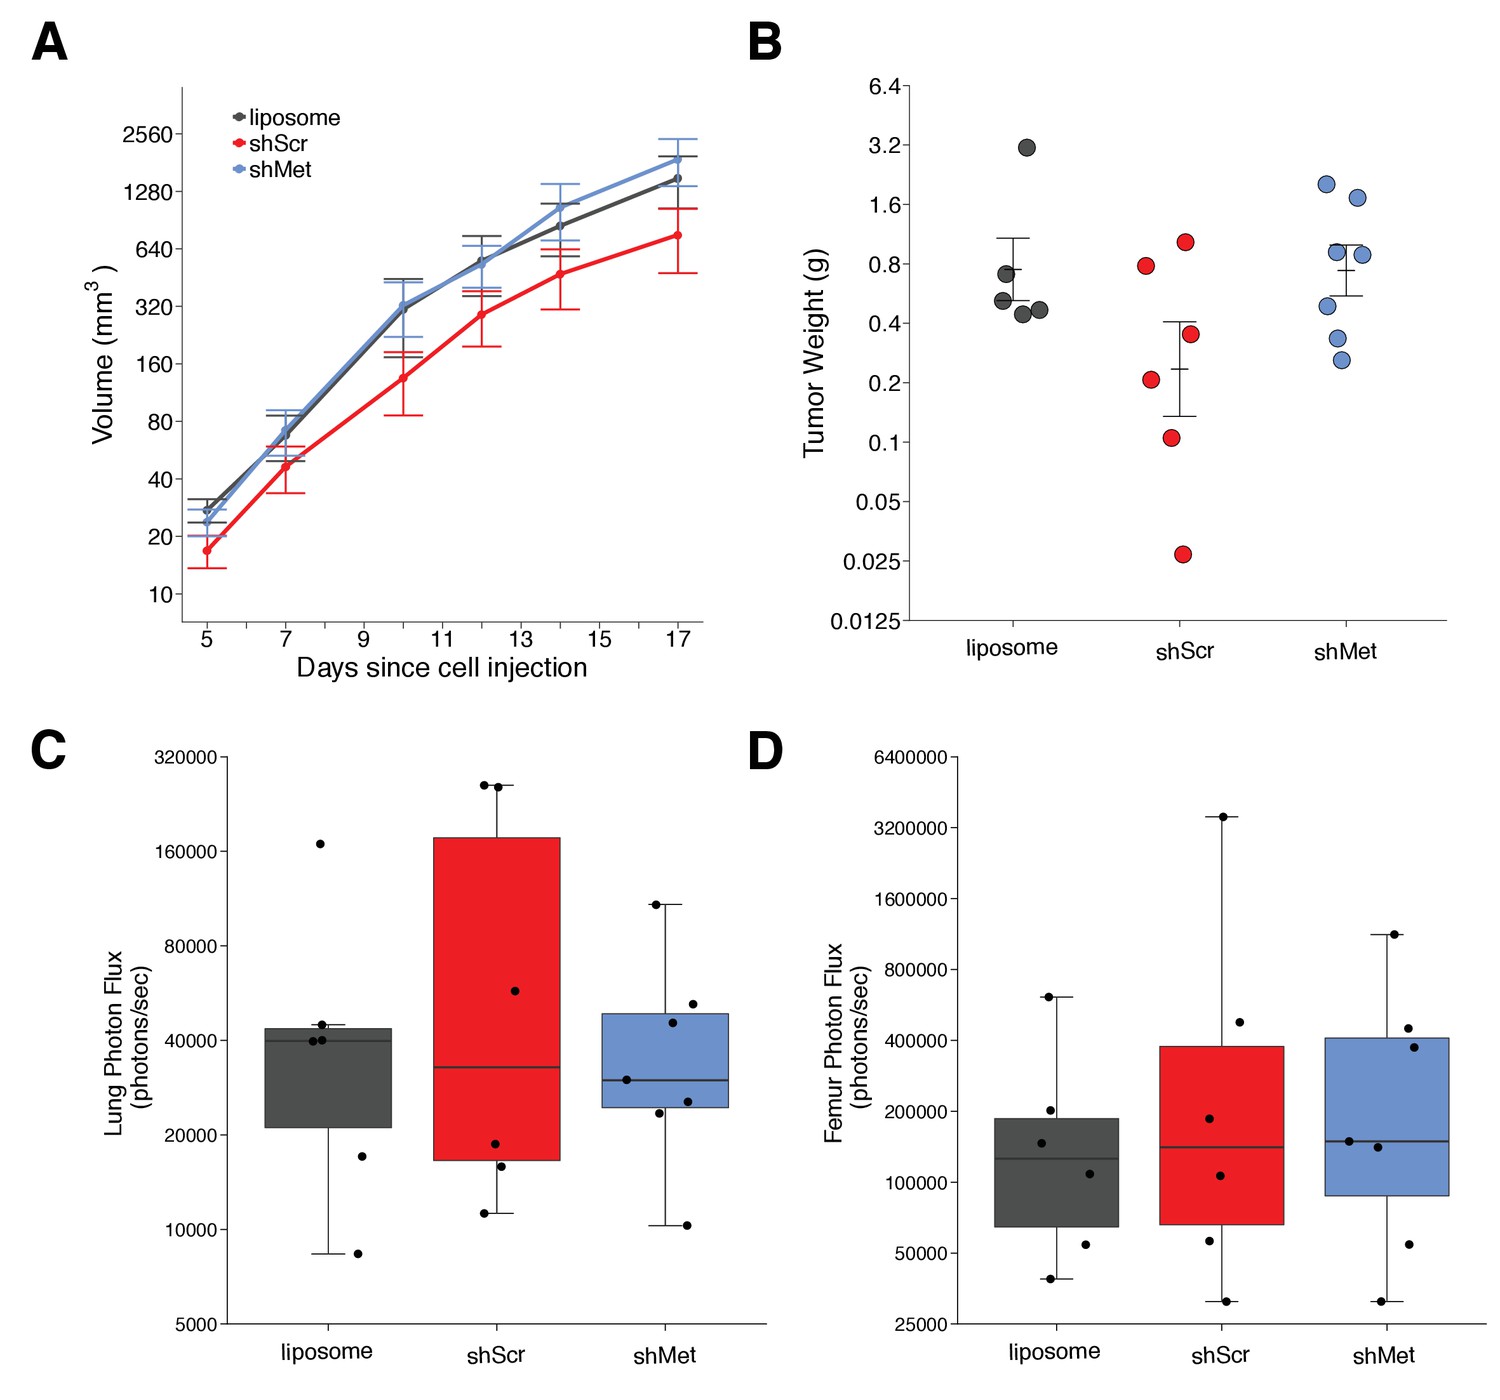
Primary tumor growth and metastatic burden of mice injected with exosomes.
Female C57BL/6 mice were subcutaneously injected with B16-F10-luciferase cells after 4 weeks of intravenous injections (3 times a week) of shScr exosomes, shMet exosomes, or synthetic liposomes. (A) Following primary tumor detection caliper measurements were taken 3 times a week and used to calculate tumor volume. Line graph of tumor volume (y-axis is natural log scale) with means reported and error bars representing s.e.m. Number of mice monitored per group: synthetic liposomes = 7, shScr = 7, shMet = 7. Of note, not all mice had detectable primary tumors at the first measurement, one of the mice injected with synthetic liposomes never formed a detectable primary tumor despite the presence of metastatic burden, and two mice (one injected with B16-F19 shScr exosomes and one injected with synthetic liposomes) were found dead before the end of the study (day 17). Individual mouse tumor volume data is reported in Figure 2 - figure supplement 1. (B) At the end of the experiment (day 18), primary tumors were excised and weighed. Dot plot with means reported as crossbars and error bars represent s.e.m. Number of primary tumor weights per group: synthetic liposomes = 5, shScr = 6, shMet = 7. Kruskal-Wallis test on all three groups: H(2) = 2.85, p = 0.24. Planned Wilcoxon-Mann-Whitney comparison between shScr and synthetic liposomes: U = 22, p = 0.247, Cliff’s d = 0.47, 95% CI [-0.28, 0.86]. Planned Wilcoxon-Mann-Whitney comparison between shScr and shMet: U = 32, p = 0.138, Cliff’s d = 0.52, 95% CI [-0.10, 0.85]. (C) Metastatic burden in lungs quantified by luciferin photon flux at 18 days after B16-F10-luc tumor cell injections. Box and whisker plot (y-axis is natural log scale) with median represented as the line through the box and whiskers representing values within 1.5 IQR of the first and third quartile. Individual data points represented as dots. Number of mice per group: synthetic liposomes = 6, shScr = 6, shMet = 7. One-way ANOVA on the luciferin photon flux values (natural log-transformed); F(2,16) = 0.226, uncorrected p = 0.800 with a priori alpha level of 0.025, Bonferroni corrected p > 0.99. Planned contrast between shScr and synthetic liposomes; Fisher’s LSD test; t(16) = 0.543, p = 0.594 with a priori alpha level of 0.025, Bonferroni corrected p > 0.99, Cohen’s d = 0.31, 95% CI [-0.83, 1.45]. Planned contrast between shScr and shMet; Fisher’s LSD test; t(16) = 0.620, p = 0.544 with a priori alpha level of 0.025, Bonferroni corrected p > 0.99, Cohen’s d = 0.34, 95% CI [-0.76, 1.44]. (D) Metastatic burden in femurs quantified by luciferin photon flux at 18 days after B16-F10-luc tumor cell injections. Box and whisker plot (y-axis is natural log scale) with median represented as the line through the box and whiskers representing values within 1.5 IQR of the first and third quartile. Individual data points represented as dots. Number of mice per group: synthetic liposomes = 6, shScr = 6, shMet = 7. One-way ANOVA on the luciferin photon flux values (natural log-transformed); F(2,16) = 0.190, uncorrected p = 0.829 with a priori alpha level of 0.025, Bonferroni corrected p > 0.99. Planned contrast between shScr and synthetic liposomes; Fisher’s LSD test; t(16) = 0.573, p = 0.575 with a priori alpha level of 0.025, Bonferroni corrected p > 0.99, Cohen’s d = 0.33, 95% CI [-0.82, 1.46]. Planned contrast between shScr and shMet; Fisher’s LSD test; t(16) = 0.105, p = 0.918 with a priori alpha level of 0.025, Bonferroni corrected p > 0.99, Cohen’s d = 0.06, 95% CI [-1.03, 1.15]. Additional details for this experiment can be found at https://osf.io/mzywk/.
Figure 2—figure supplement 1
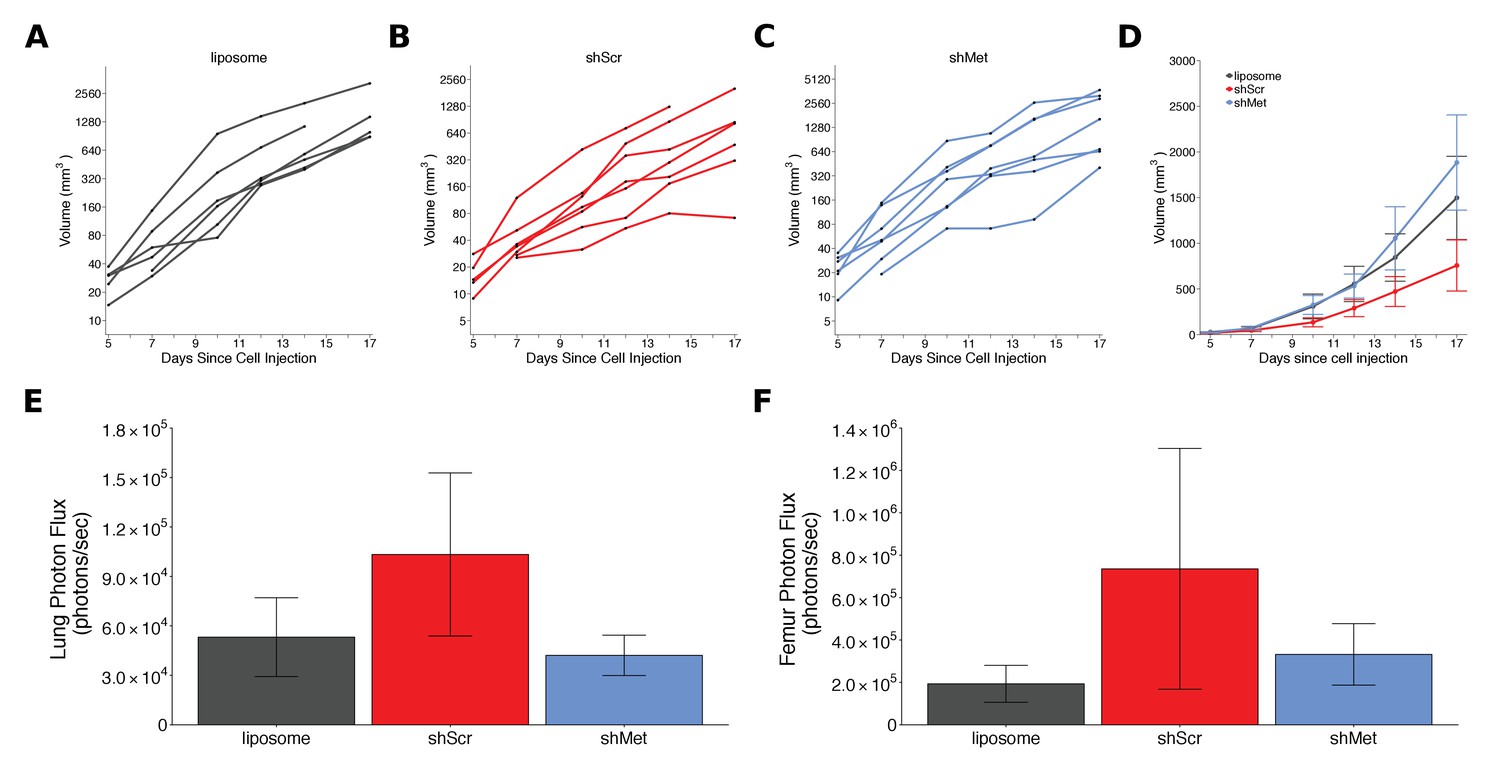
Alternative visualizations of tumor growth and metastatic burden.
This is the same experiment as Figure 2. (A-C) Line graphs (y-axis is natural log scale) of primary tumor volume plotted for each animal rather than averages. Number of mice same as Figure 2A. (D) Line graph of primary tumor volume data plotted on a linear scale with means reported and error bars representing s.e.m. Number of mice same as Figure 2A. (E) Lung metastatic burden data or (F) femur metastatic burden data with means reported and error bars representing s.e.m. Number of mice same as Figure 2C,D. Of note, although the data are not normal on a linear scale, which means presenting mean and s.e.m. is not appropriate, these box plots are presented to allow a direct comparison to how the original study data were presented. Additional details for this experiment can be found at https://osf.io/mzywk/.
Figure 3
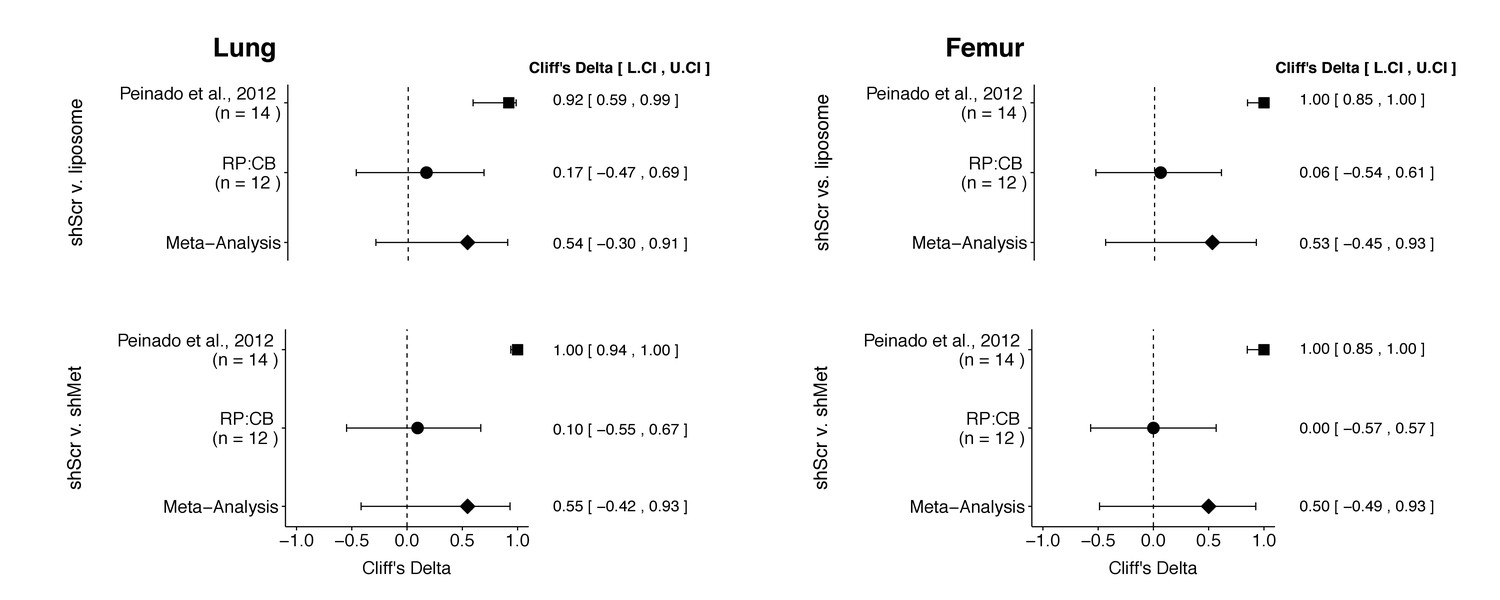
Meta-analyses of each effect.
Effect size (Cliff’s delta) and 95% confidence interval are presented for Peinado et al., 2012, this replication attempt (RP:CB), and a meta-analysis to combine the two effects. Cliff’s delta is a standardized measure of how often a value in one group is larger than the values from another group, with a larger positive value indicating a decrease in metastatic burden in animals injected with either shMet exosomes or liposomes compared to animals injected with shScr exosomes. Random effects meta-analysis: lung metastatic burden (shScr v. liposome, p = 0.149; shScr v. shMet, p = 0.226) and femur metastatic burden (shScr v. liposome, p = 0.264; shScr v. shMet, p = 0.317). Sample sizes used in Peinado et al., 2012 and this replication attempt are reported under the study name. Additional details for these meta-analyses can be found at https://osf.io/c69jx/.
Tables
Table 1
Nanosight analysis of exosomes.
Summary of exosome number and size distribution, with or without the finite track length adjustment (FTLA) algorithm, quantified by NanoSight analysis. All values (mean, SD, median, span, concentration (particles/ml)) are given as averages for preps generated during this study (n = 15 per cell line).
| Mean | Median | Sd | Span | Particles/mL | ||
|---|---|---|---|---|---|---|
| shMet | FTLA size distribution | 91.07 | 72.9 | 62.89 | 1.253 | 6.253e+11 |
| size distribution | 91 | 75 | 65.44 | 1.334 | 6.253e+11 | |
| shScr | FTLA size distribution | 88.47 | 71.8 | 56.04 | 1.211 | 9.477e+11 |
| size distribution | 88.67 | 73.67 | 61.8 | 1.321 | 9.477e+11 |
Key resources table
| Reagent type (species) or resource | Designation | Source or reference | Identifiers | Additional information |
|---|---|---|---|---|
| Strain, strain background (Mus musculus, C57BL/6, female) | C57BL/6 | Charles River | Strain code: 027; RRID: IMSR_CRL:27 | |
| Cell line (M. musculus) | B16-F10 | doi:10.1038/nm.2753 | RRID: CVCL_0159 | |
| Cell line (M. musculus) | B16-F10-luc | doi:10.1038/nm.2753 | expresses firefly luciferase | |
| Other | synthetic uniloamellar 100 nm liposomes | Encapsula NanoSciences | 13 mg/ml L-a-Phosplatydilcholine, 2.78 mg/ml cholesterol (7:3 molar ratio P:C) | |
| Sequence-based reagent | pGIPZ non-silencing shRNA lentiviral control particles | Dharmacon/GE Life Sciences | cat# RHS4348 | sense sequence: 5’-ATCTCGCTTGGGCGAGAGTAAG-3’ |
| Sequence-based reagent | pGIPZ mouse Met shRNA lentiviral particles | Dharmacon/ GE Life Sciences | cat# VGM5520- 200377256; clone ID: V3LMM_ 456078 | sense sequence: 5’-CCAGACTTTTCATACAAGA-3’ |
| Antibody | mouse anti-Hsc70 | Enzo Life Sciences | cat# ALX-804–067; RRID: AB_10538284 | 1:500 dilution in SuperBlock, O/N at 4 ˚C |
| Antibody | mouse anti-Tsg101 | Santa Cruz Biotechnology | cat# sc-7964; RRID: AB_671392 | 1:500 dilution in SuperBlock, O/N at 4 ˚C |
| Antibody | rabbit anti-Cd63 | System Biosciences | cat# EXOAB-CD63A-1; RRID:AB_2561274 | 1:1000 dilution in SuperBlock, O/N at 4 ˚C |
| Antibody | mouse anti-Met | Cell Signaling Technology | cat# 3127; RRID:AB_331361 | 1:1000 dilution in SuperBlock, O/N at 4 ˚C |
| Antibody | rabbit anti-pMet (Tyr 1234/5) | Cell Signaling Technology | cat# 3077; RRID:AB_2315156 | 1:1000 dilution in SuperBlock, O/N at 4 ˚C |
| Antibody | rabbit anti-Gapdh | Santa Cruz Biotechnology | cat# sc-25778; RRID:AB_10167668 | 1:1000 dilution in SuperBlock, O/N at 4 ˚C |
| Antibody | rabbit anti-pMet (Tyr 1234/5) | Thermo Fisher Scientific | cat# MA5-15083; RRID:AB_10983015 | 1:1000 dilution in SuperBlock, O/N at 4 ˚C |
| Antibody | HRP-conjugated sheep anti-mouse | GE Healthcare | cat# NA931; RRID:AB_772210 | 1:15,000 dilution in SuperBlock, 1 hr at RT |
| Antibody | HRP-conjugated donkey anti-rabbit | GE Healthcare | cat# NA934; RRID:AB_772206 | 1:15,000 dilution in SuperBlock, 1 hr at RT |
| Sequence-based reagent | shMet primer | this paper | Forward: 5’-CCAGACTTT TCATACAAGAATA-3’ | |
| Sequence-based reagent | universal reverse primer | QuantiMir Kit, System Biosciences | cat# RA420A-1 | |
| Sequence-based reagent | U6 primer | LncRNA Profiler qPCR Array Kit, System Biosciences | cat# RA900A-1 | |
| Sequence-based reagent | Met primer | this paper | Forward: 5’-CTGGACA GATTGTGGGAGTAAG −3’ | |
| Sequence-based reagent | Gapdh primer | LncRNA Profiler qPCR Array Kit, System Biosciences | cat# RA900A-1 | |
| Software, algorithm | ImageJ | doi:10.1038/nmeth.2089 | RRID:SCR_003070 | version 1.49 u |
| Software, algorithm | SDS | Applied Biosystems | RRID:SCR_015806 | version 2.4 |
| Software, algorithm | Nanoparticle tracking Analysis (NTA) | Nanosight | RRID:SCR_014239 | version 2.3 |
| Software, algorithm | Living Image | Caliper Life Sciences | RRID:SCR_014247 | version 4.4 |
| Software, algorithm | R Project for statistical computing | https://www.r-project.org | RRID:SCR_001905 | version 3.5.1 |
Additional files
-
Transparent reporting form
- https://doi.org/10.7554/eLife.39944.008
-
Reporting standard 1
The ARRIVE guidelines checklist.
- https://doi.org/10.7554/eLife.39944.009
Download links
A two-part list of links to download the article, or parts of the article, in various formats.
Downloads (link to download the article as PDF)
Open citations (links to open the citations from this article in various online reference manager services)
Cite this article (links to download the citations from this article in formats compatible with various reference manager tools)
Replication Study: Melanoma exosomes educate bone marrow progenitor cells toward a pro-metastatic phenotype through MET
eLife 7:e39944.
https://doi.org/10.7554/eLife.39944


