Decreased brain connectivity in smoking contrasts with increased connectivity in drinking
- Fudan University, China
- Ministry of Education, China
- University of Warwick, United Kingdom
- Oxford Centre for Computational Neuroscience, United Kingdom
- University of Cambridge, United Kingdom
- University of Chinese Academy of Sciences, China
- Xidian University, China
- Shanghai University Finance and Economics, China
- Beijing Institute of Genomics, Chinese Academy of Sciences, China
- King’s College London, United Kingdom
- University of Vermont, United States
- Institut National de la Santé et de la Recherche Médicale, INSERM Unit 1000 'Neuroimaging & Psychiatry', University Paris Sud – Paris Saclay, University Paris Descartes, Service Hospitalier Frédéric Joliot and GH Nord Essonne Psychiatry Department 91G16, France
- Université Paris-Saclay, France
- Technische Universität Dresden, Germany
- University of Electronic Science and Technology of China, China
Figures
Figure 1 with 4 supplements
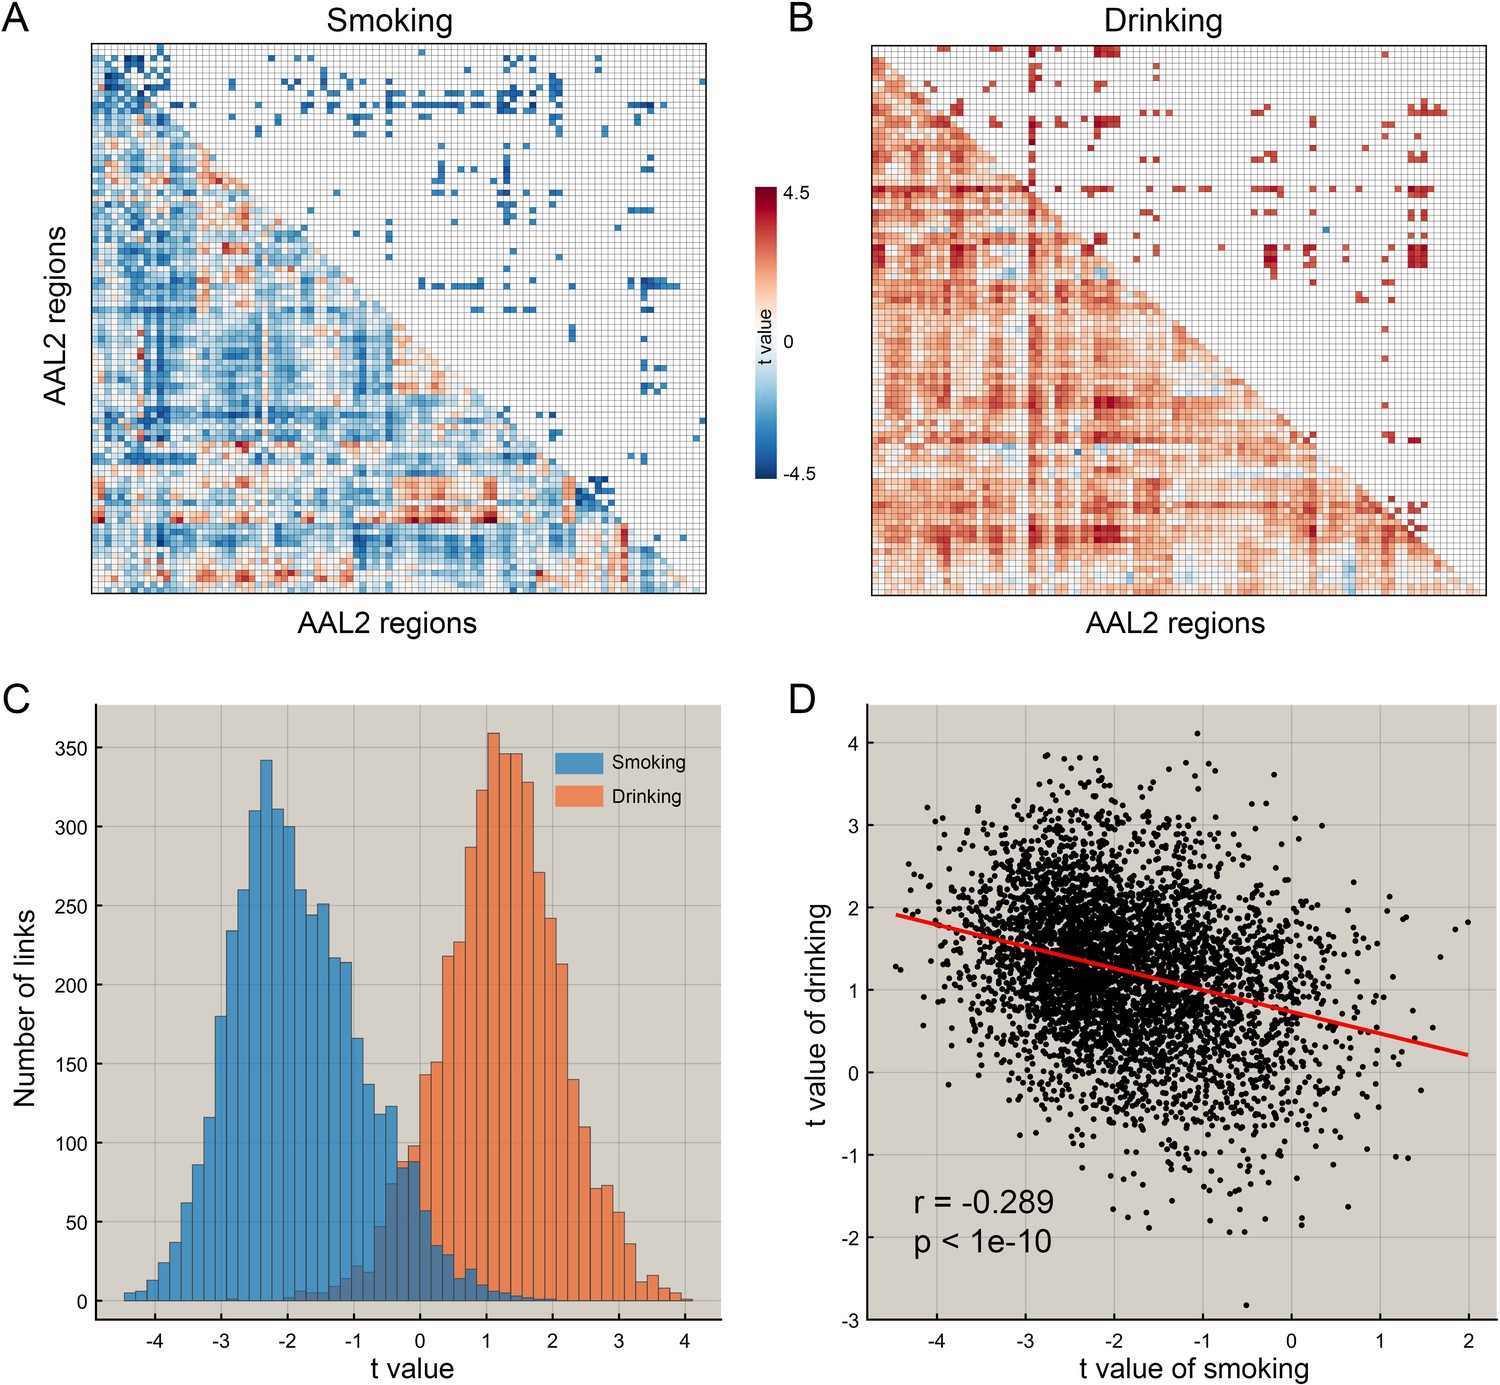
The difference of functional connectivity in smoking group and drinking group.
(A) The matrix of t values for the smoking group. The lower triangle matrix shows the functional connectivities significantly associated with smoking. The baseline for the smoking was the never smoking group. The upper triangle matrix shows the significant links after multiple comparison correction (FDR corrected, p<0.005; no positive link survived correction for multiple comparisons). The regions are the AAL2 regions in the order shown in Supplementary file 1. (B) The matrix of t values for the drinking group. The lower triangle matrix shows the functional connectivities significantly associated with the amount of drinking per day. The baseline for the drinking was the low drinking group. The upper triangle matrix shows the significant links after multiple comparison correction using FDR correction (FDR corrected, p<0.05). The regions are the AAL2 regions in the order shown in Supplementary file 1. (C) The distribution of t values for the two groups for all AAL2 functional connectivity links. (D) The correlation between the t values of the above contrasts for the drinking and smoking groups. A positive t value indicates a stronger FC in a substance use group compared to the control group here and in the other Figures.
Figure 1—figure supplement 1
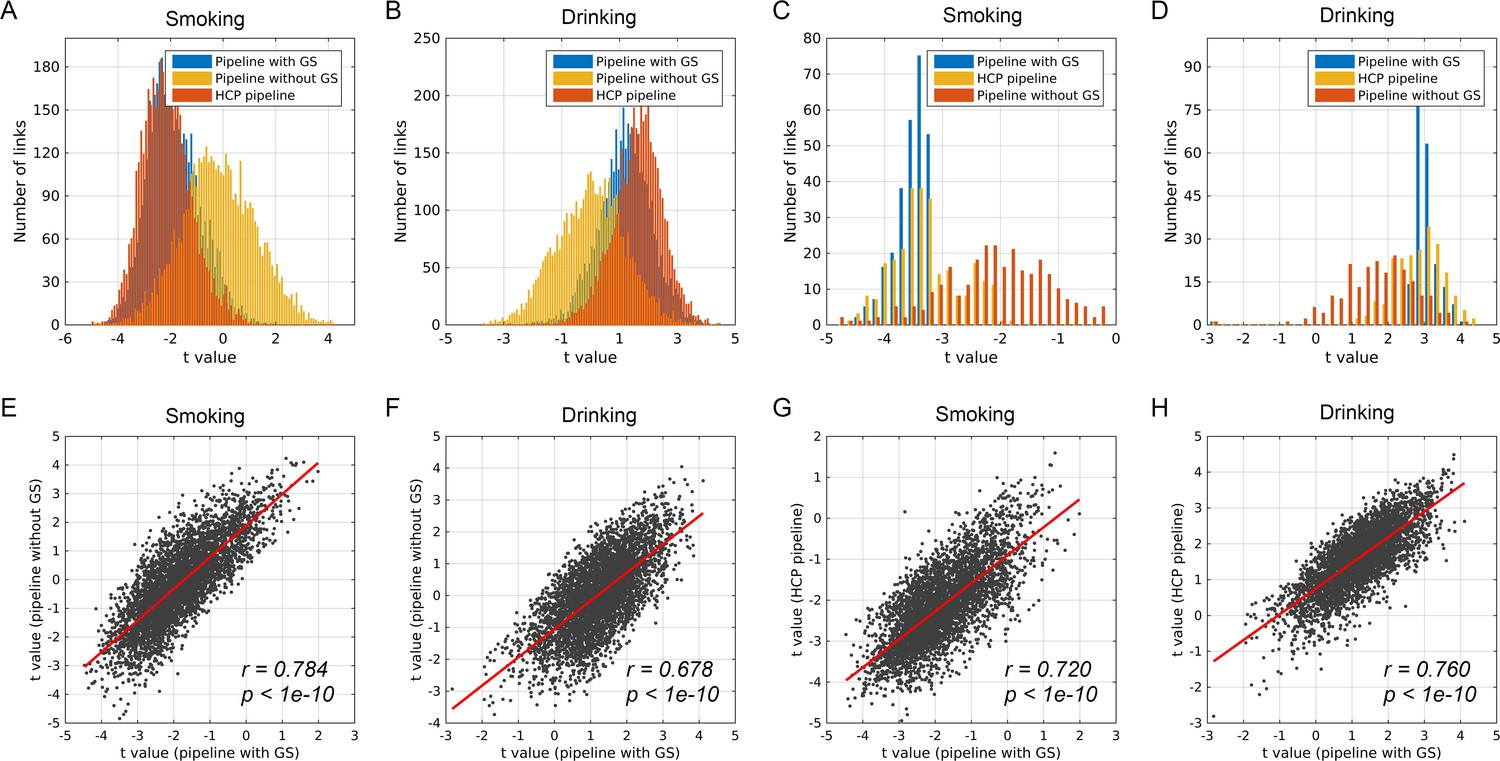
A comparison of the whole brain functional connectivity difference patterns between different pipelines of data preprocessing.
The upper figures show the distribution of t values of the whole brain links for three different pipelines of data preprocessing. (A) For smoking and (B) for drinking. (C, D) showed the distribution of t values of significantly different links for three different pipelines of data preprocessing. (E, F) show the correlation between the t value corresponding to the pipeline with GS (global signal) and the t value corresponding to the pipeline without the GS, that is with the global signal regressed out. (G, H) show the correlation between the t value corresponding to the pipeline with GS and the t value corresponding to the HCP pipeline.
Figure 1—figure supplement 2
Whole brain functional connectivity difference pattern using the fconn atlas (Shen et al., 2013) for comparison with the AAL2 atlas results shown in Figure 2.
We modified the fconn atlas so that it includes the AAL2 parcellation produced by Rolls et al. (2015) of the medial orbitofrontal cortex areas (OFC_med, OFC_ant, OFC_post, Rectus, and OLF) and lateral orbitofrontal cortex areas (OFC_lat, and IFG_orb). (A) The fconn areas with different functional connectivity (measured by the number of significant links p<0.001 and using a threshold of 20 links) involving that area, for the smoking group compared to the non-smoking group. (B) The same for the high drinking group compared to the low drinking group using a threshold of 10 links (p<0.001) within an area.
Figure 1—figure supplement 3
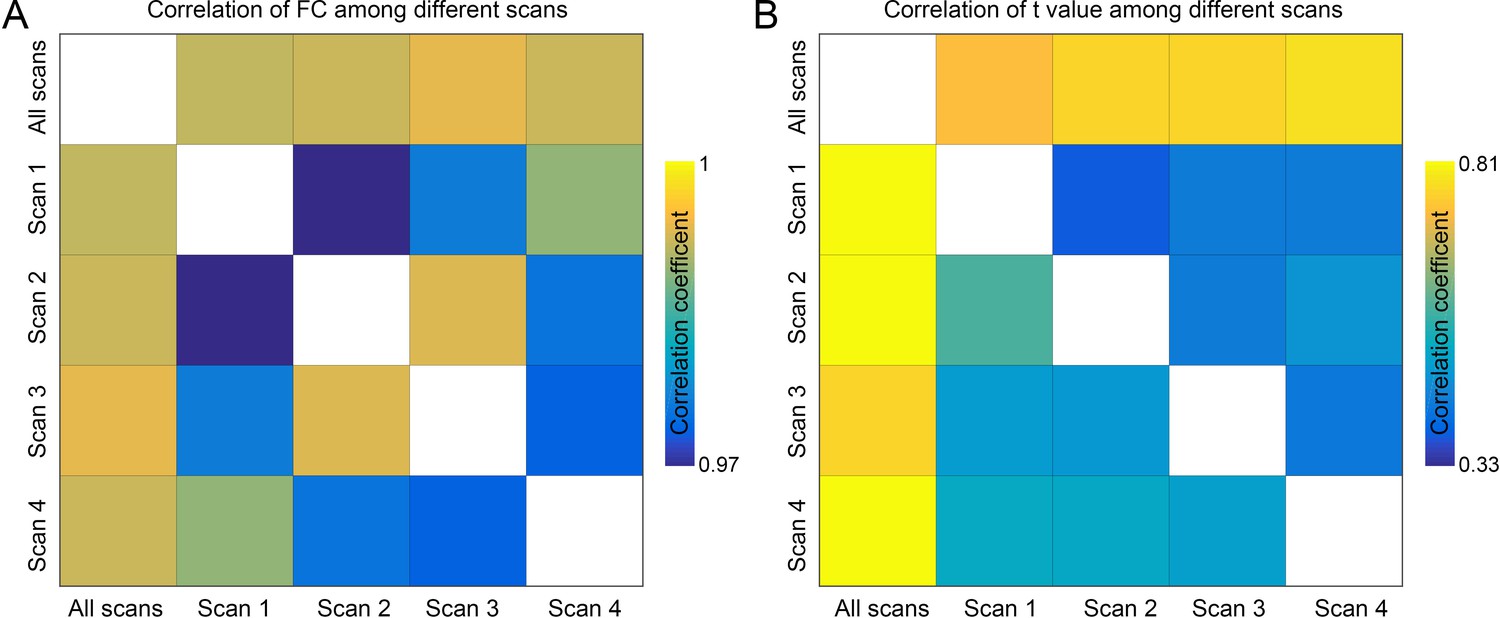
The correlation between four scans.
(A) The correlation of the strength of the whole brain functional connectivity between four scans. All the correlations between the different scans are larger than 0.98, which means that the whole brain functional connectivity pattern is very robust among the four sessions, even though these acquisitions have different phase encodings (LR and RL). (B) Comparison of whole brain functional connectivity difference pattern between the four scans. The lower triangle matrix shows the correlation of t values of the whole brain links based on the four scans in the smoking group. The upper triangle matrix shows the correlation of t values of the whole brain links based on the four scans in the drinking group.
Figure 1—figure supplement 4
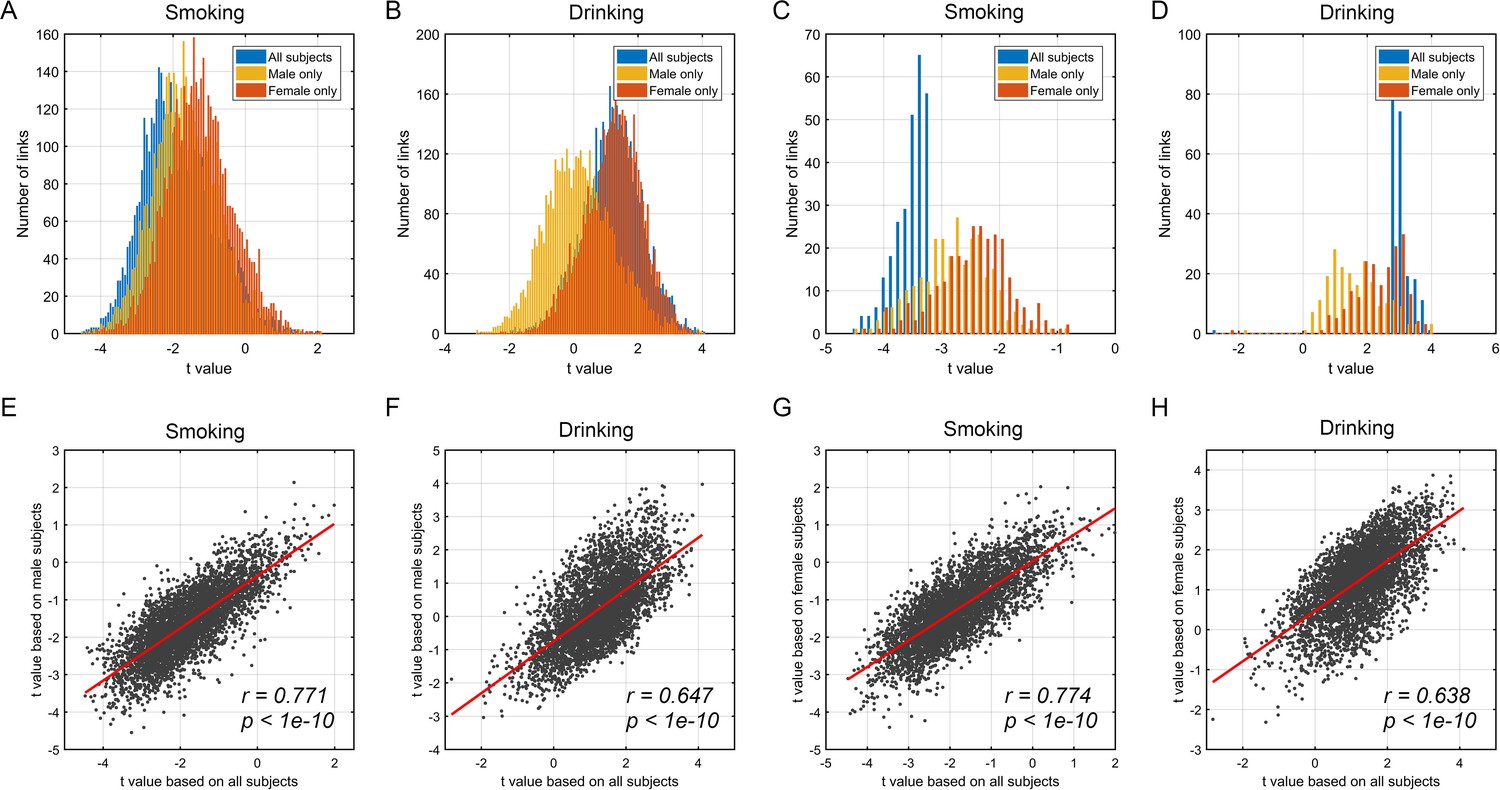
Comparison of whole brain functional connectivity difference patterns between male and female groups.
(A, B) show the distribution of t values of the whole brain links for three different groups: all participants, male, and female participants. (C, D) show the distribution of t values of the significantly different links for three different groups. (E, F) show the correlation between the t value of the whole brain links based on all participants and male participants. (G, H) show the correlation between the t value of the whole brain links based on all participants and female participants. For smoking, the distribution for all participants was close to that of the male FC distribution, and more males than females were smokers. For drinking, there was a larger FC difference in females than males, and this is reflected in the closeness of the distribution for all participants to that of females.
Figure 2
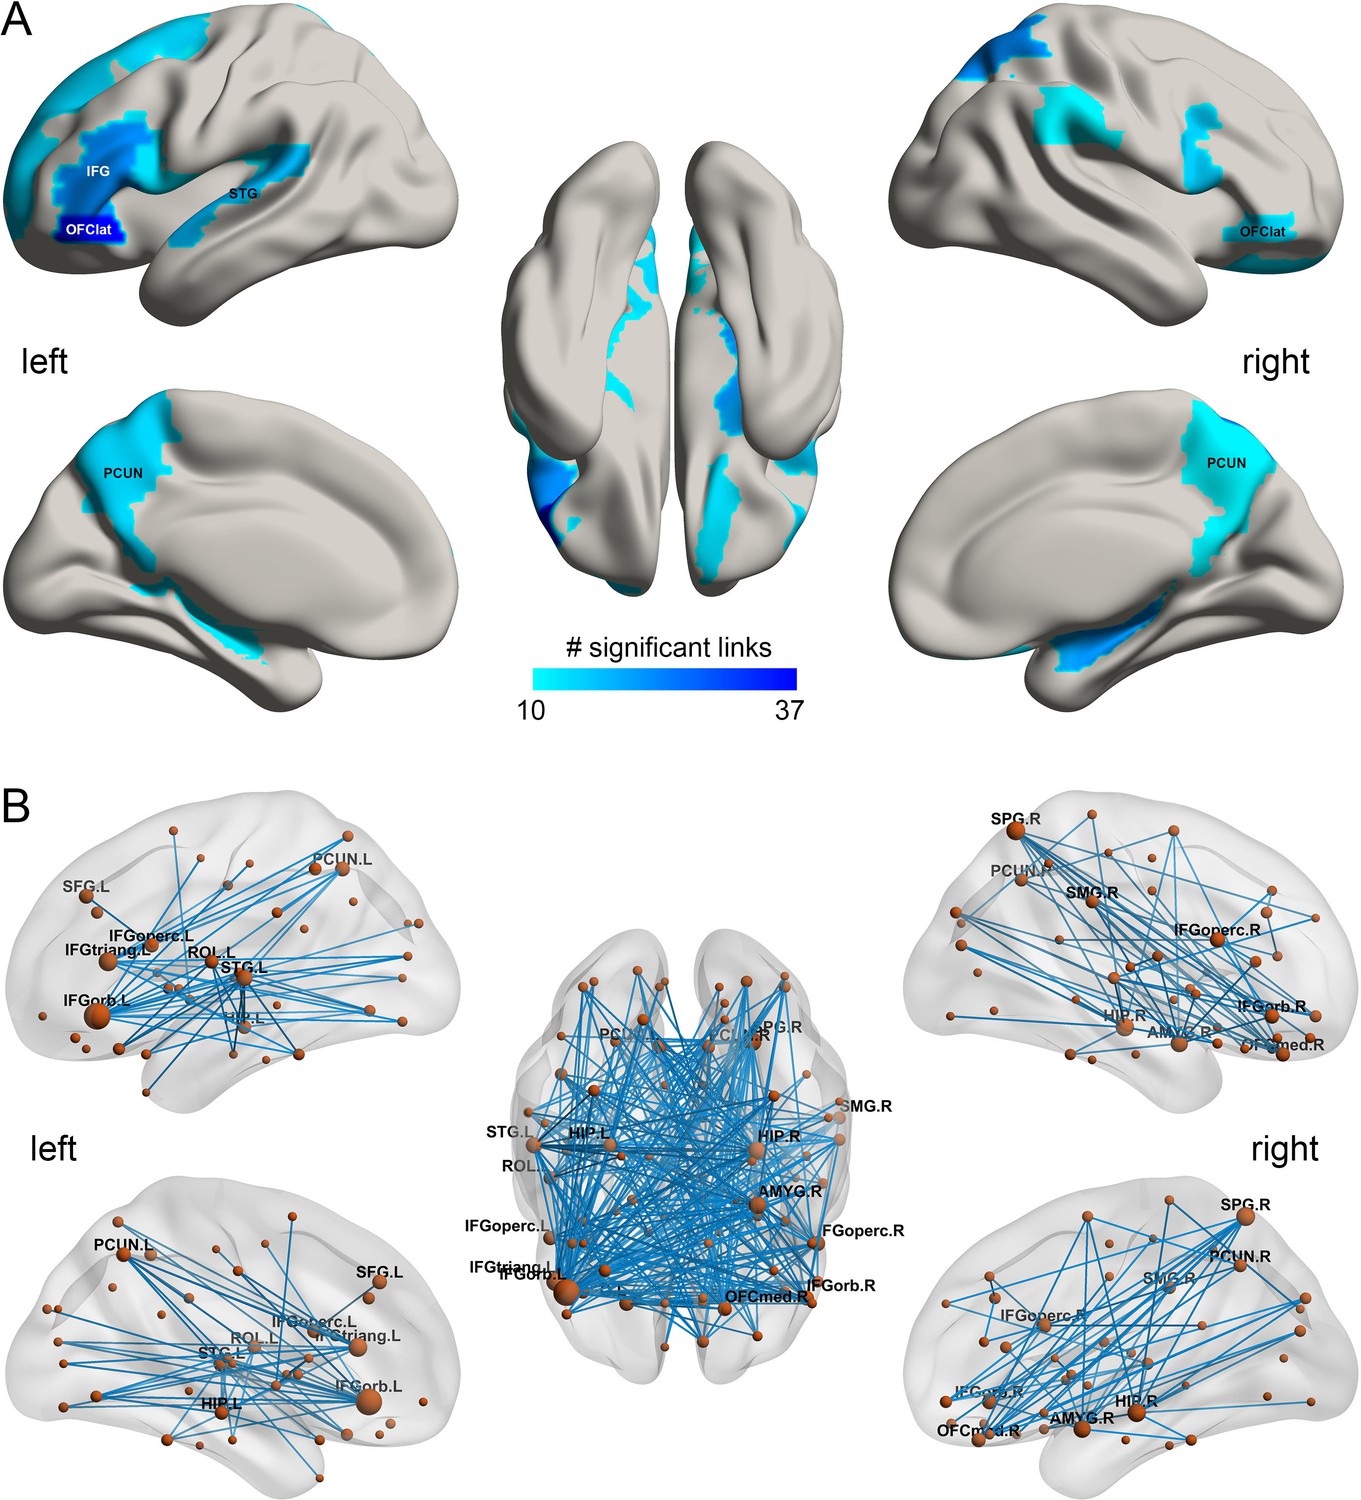
The smoking associated functional connectivities.
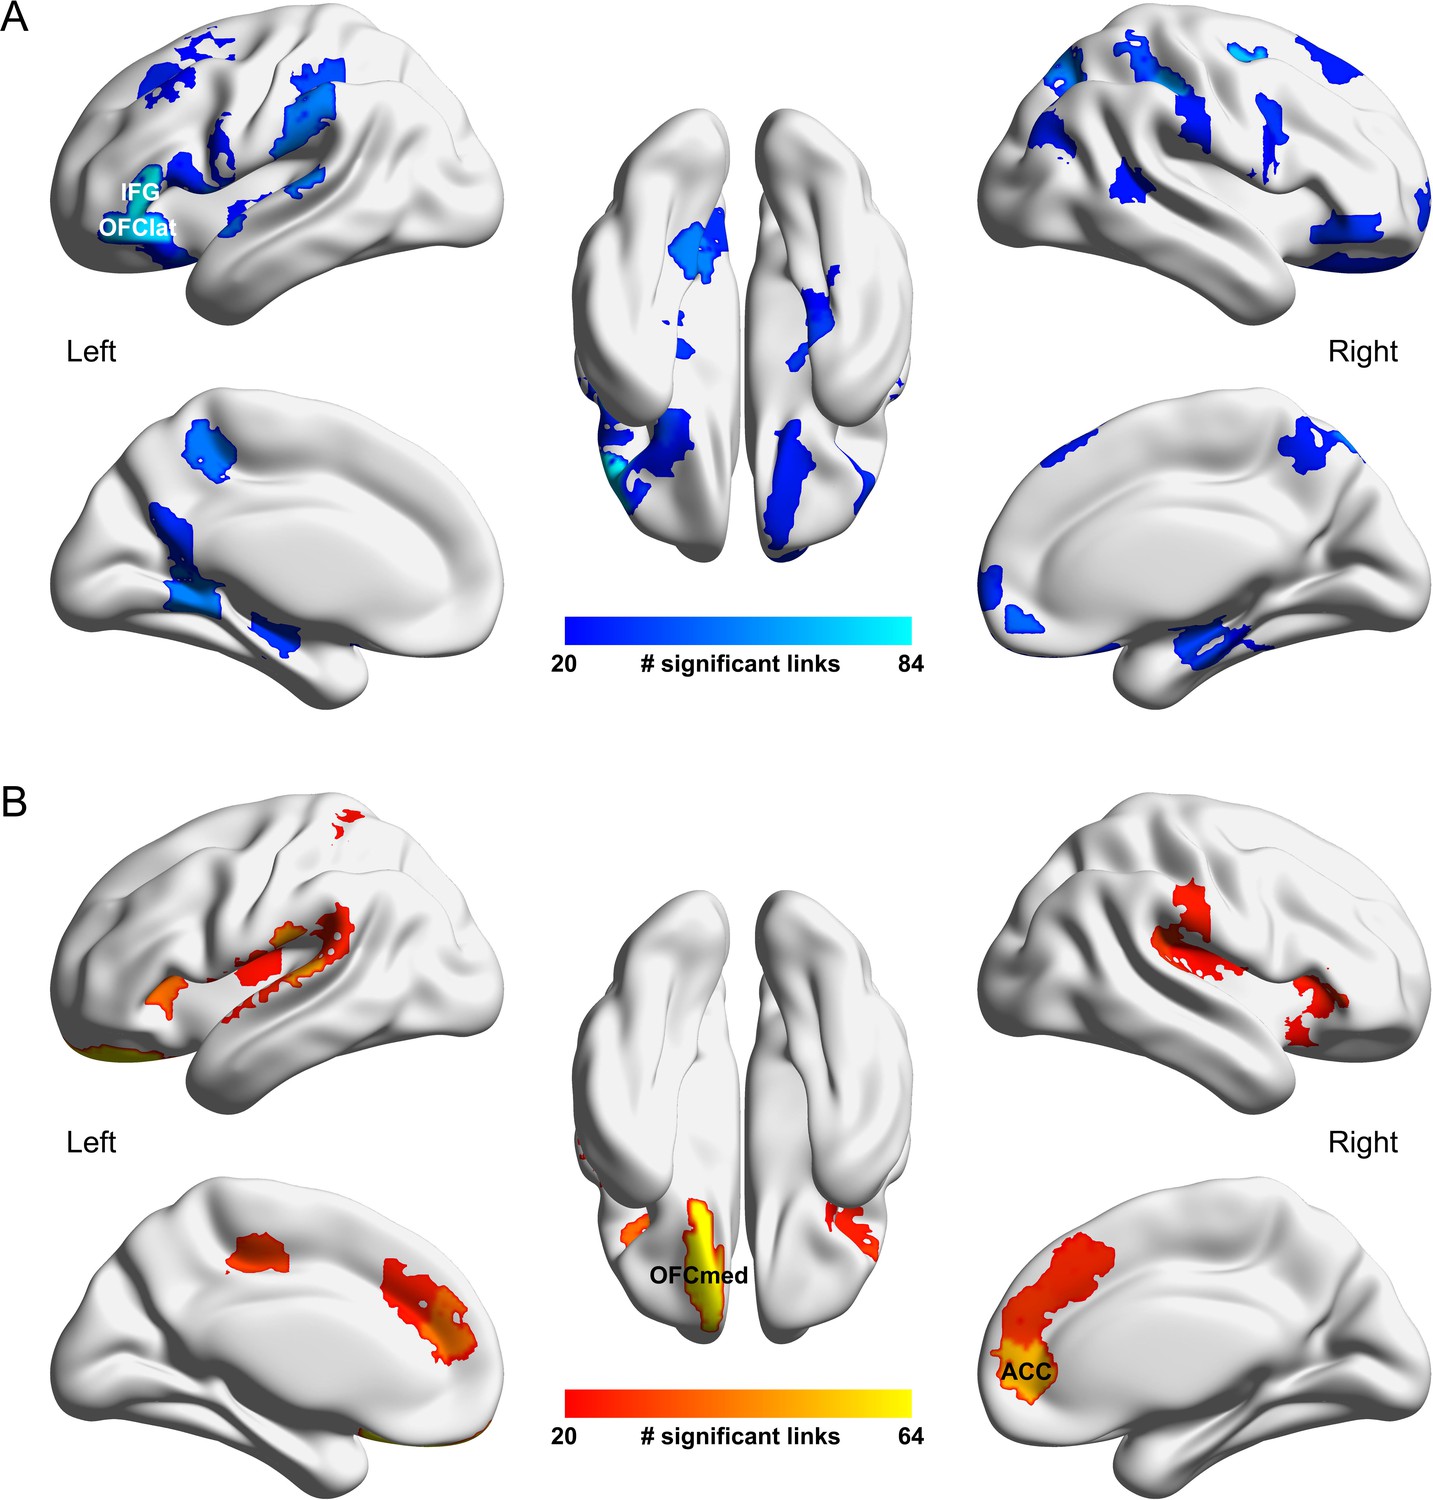
(A) The AAL2 areas with different functional connectivity (measured by the number of significant links FDR p<0.005) involving that area, using a threshold of 10 links for the smoking compared to the non-smoking group. IFG – inferior frontal gyrus; OFClat –lateral orbitofrontal cortex; PCUN – precuneus; STG – superior temporal gyrus. (B) Significant links (FDR p<0.005) between the AAL2 areas with blue showing a decrease for the smoking group compared to the non-smoking group. The left hemisphere is on the left of each brain diagram in this and other Figures.
-
Figure 2—source data 1
All significant links (FDR p<0.05) between the AAL2 areas for the smoking group.
- https://doi.org/10.7554/eLife.40765.010
Figure 3
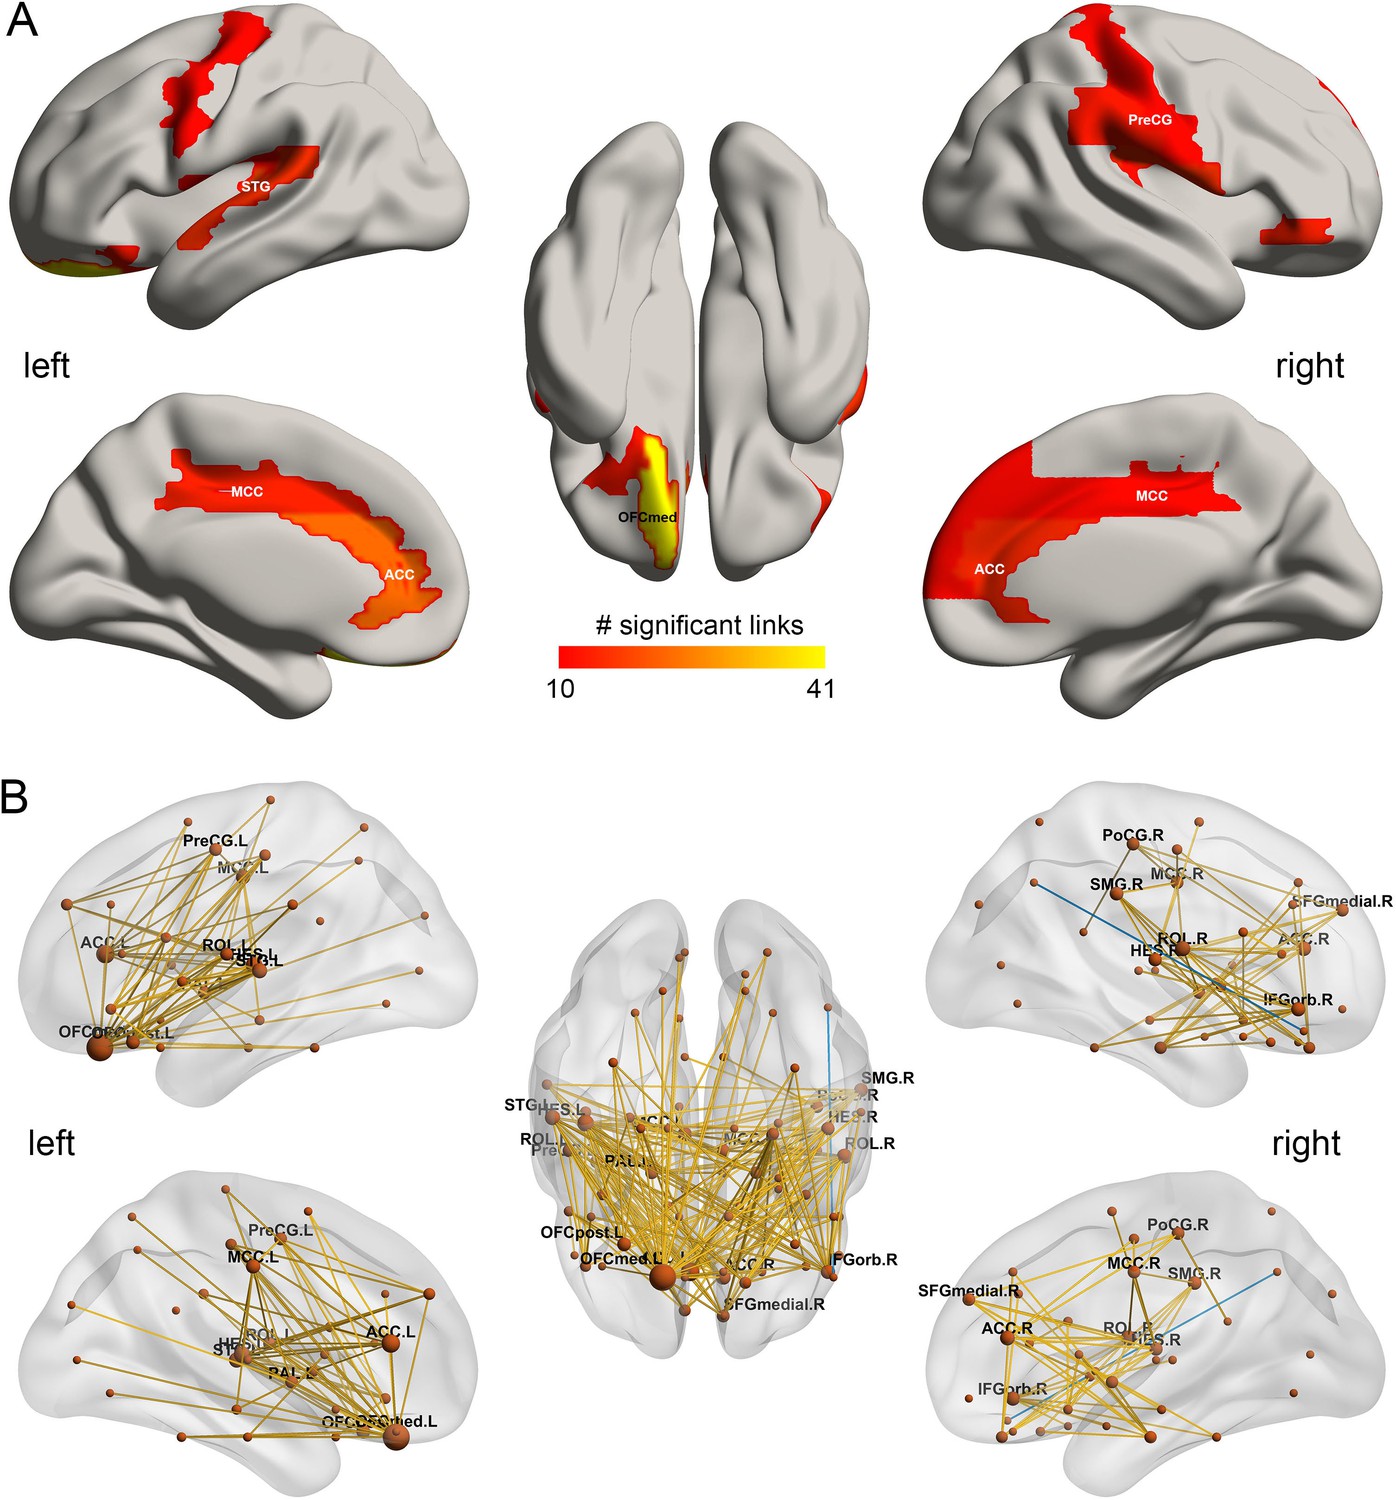
The drinking associated functional connectivities.
(A) The AAL2 areas with different functional connectivity (measured by the number of significant links FDR p<0.05) involving that area, using a threshold of 10 links for high drinking compared to the low-drinking group. OFCmed – medial orbitofrontal cortex; ACC – anterior cingulate gyri; MCC – middle cingulate gyri; PreCG – precentral gyrus; STG – superior temporal gyrus; (B) Significant links (FDR p<0.05) between the AAL2 areas with red showing a increase for the drinking group.
-
Figure 3—source data 1
All significant links (FDR p<0.05) between the AAL2 areas for the drinking group.
- https://doi.org/10.7554/eLife.40765.012
Figure 4
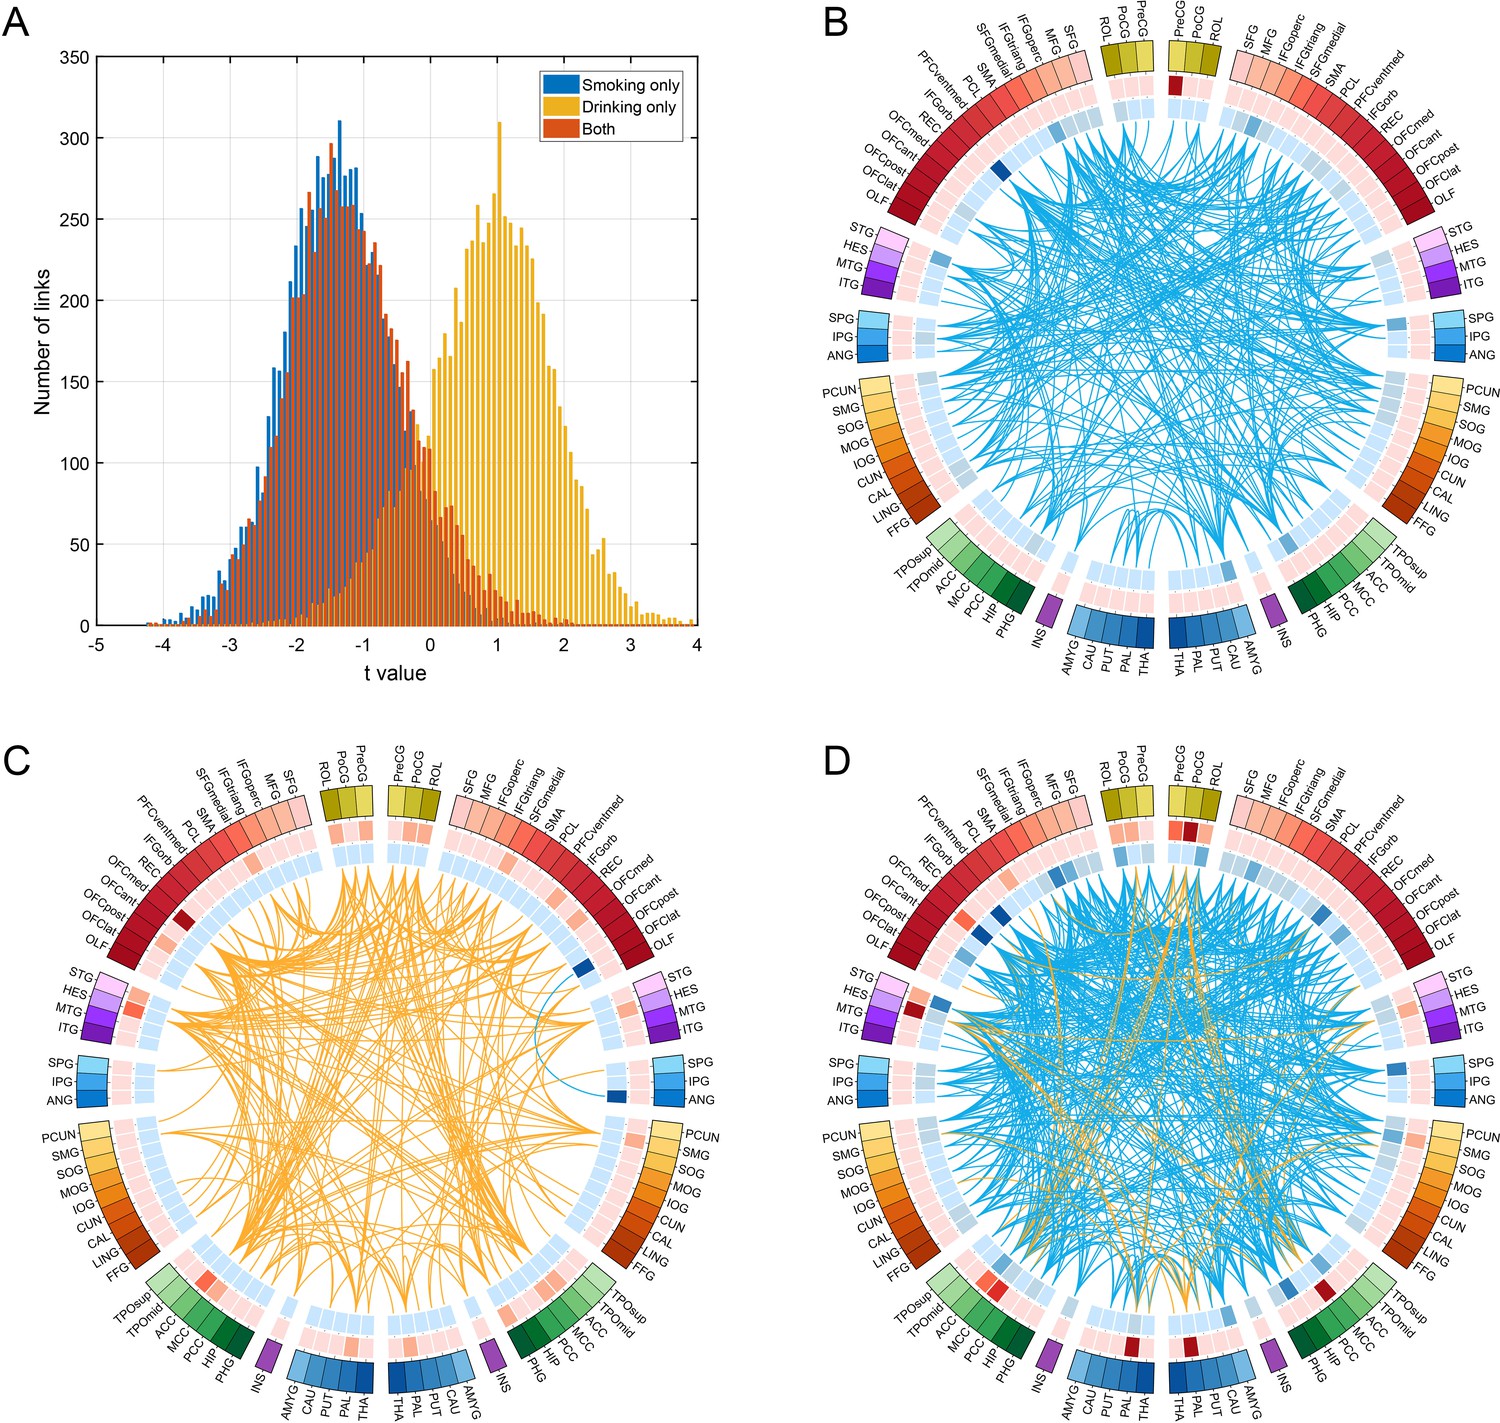
Comparison of functional connectivity in three groups (i.e smoking only n = 60, drinking only n = 219, and both smoking and drinking n = 143) using a common baseline comparison group (a no smoking and low drinking group n = 198) from the HCP dataset.
(A) shows the distribution of t values of all the links for all AAL2 areas for the three comparisons. A positive t value indicates a stronger FC in a substance use group compared to the control group. For B-D, only the significantly different links identified in the HCP dataset as shown in Figure 3 are considered. (B) shows that all these links are decreased in the smoking only group. (C) shows that all these links are higher in the drinking only group. (D) shows that there are both higher and lower links in the group that both smokes and drinks.
-
Figure 4—source data 1
For the FC links identified as involved in smoking: comparison of functional connectivity between three groups: smoking only; drinking only; and both smoking and drinking.
- https://doi.org/10.7554/eLife.40765.014
-
Figure 4—source data 2
For the FC links identified as involved in drinking: comparison of functional connectivity between three groups: smoking only; drinking only; and both smoking and drinking.
- https://doi.org/10.7554/eLife.40765.015
Figure 5
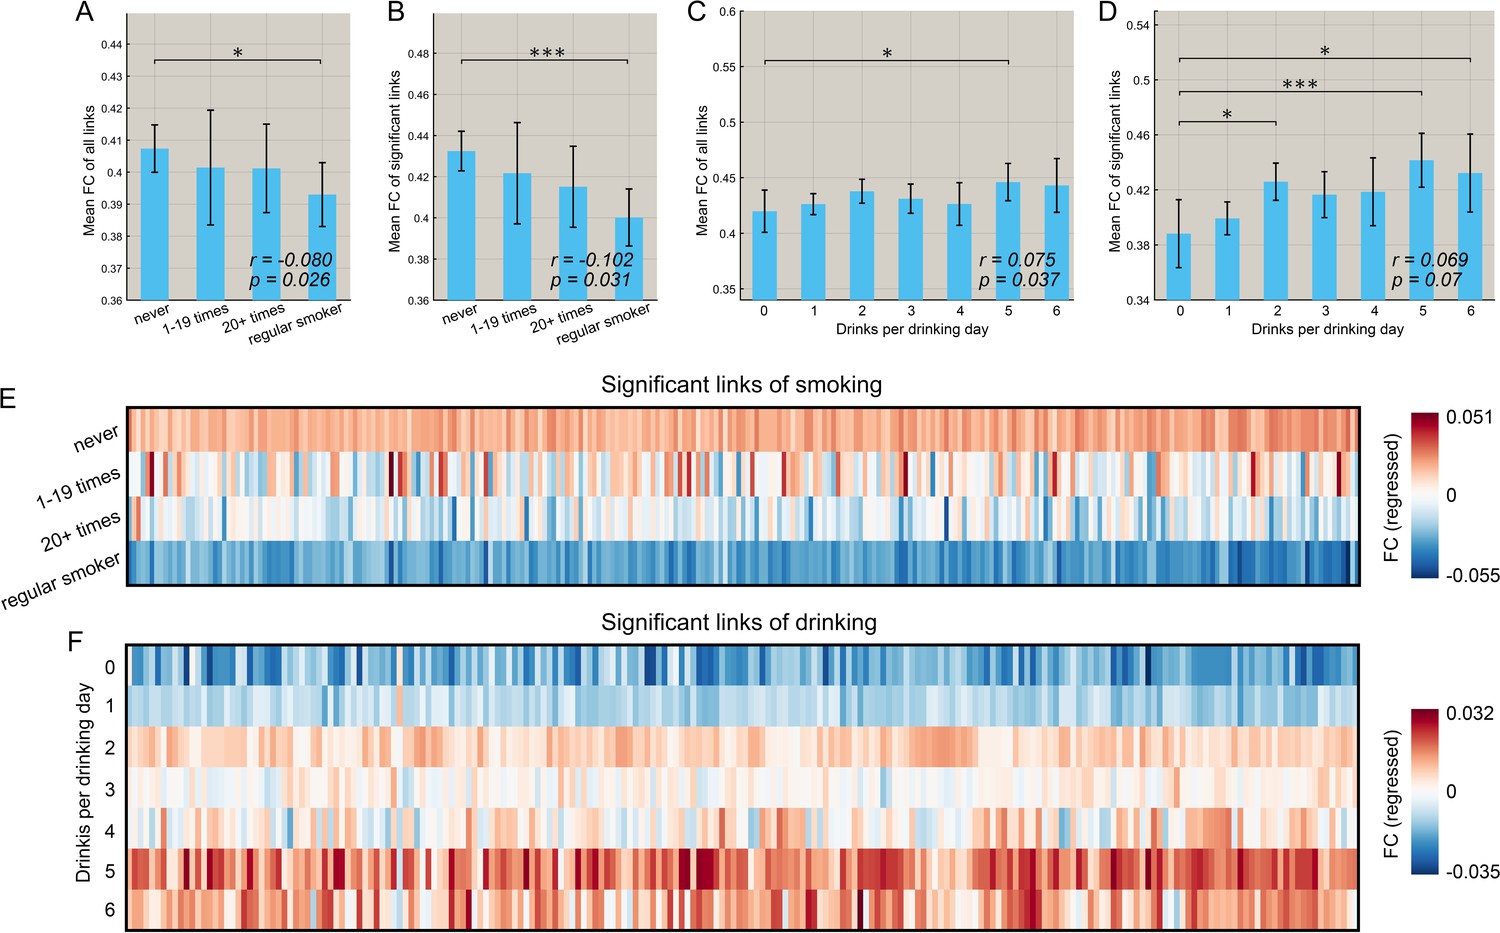
Correlation between the strength of functional connectivity and the amount of substance use behavior.
(A) Comparison of the mean strength of all functional connectivities in subgroups that smoked for different numbers of times. The error bars show the standard error of the mean (SEM) in this and other Figures. The mean strength of all functional connectivities in the regular smoking group is significantly lower than in the non-smoking group (p=0.026). The correlation between the strength of FC links and the amount of substance use behavior are shown in the lower right corner (same for other figures). (B) Comparison of the mean strength of significantly different functional connectivities in subgroups who had smoked for different numbers of times. The mean strength of significantly different functional connectivities of the regular smoking group is significantly lower than for the non-smoking group (p=0.031). (C) Comparison of the mean strength of all functional connectivities in subgroups with different amounts of drinking. (D) Comparison of the mean strength of significantly different functional connectivities in subgroups with different amount of drinking. The relation between the strength of the different FCs and the smoking history (E) and the amount of drinking (F). The FCs are those that are significantly different between the substance use and control groups as shown in Figures 2 and 3. * indicates p<0.05, **p<0.005 and ***p<0.0005.
Figure 6
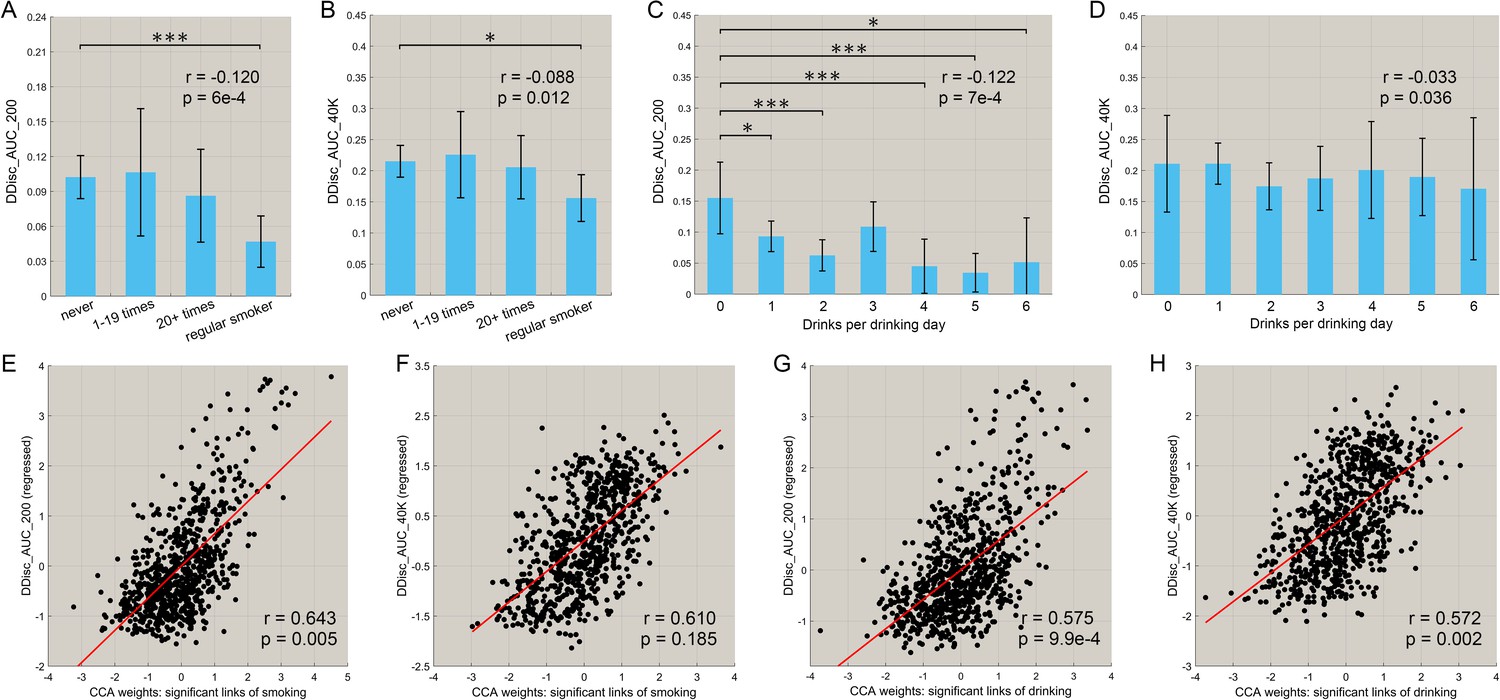
Correlation between the strength of functional connectivity and temporal discounting behavior (impulsivity).
(A, B) The delay discounting score for different subgroups with different frequencies of smoking. A low score reflects choices for immediate reward as compared with longer term reward. The delay discounting scores are significantly lower in the regular smoking group compared with the non-smoker group. The correlations between the delay discounting scores and the amount of substance use behavior are shown in the top right corner (with the same for the other figures). The error bars show the standard error of the mean (SEM) in this and other Figures. (C, D) The delay discounting scores for subgroups with different amounts of drinking. The delay discounting scores are significantly lower in the high drinking group compared with the low drinking group. (E, F) The canonical correlation between the delay discounting score and the strength of the significantly different links in the smoking dataset. The scatter plot shows the delay discounting score versus the functional connectivity weights, with one point per participant. The high correlation shown here indicates a significant co-variation between the FCs and the delay discounting score. (G, H) The same for the drinking group. (* indicates p<0.05, **p<0.005 and ***p<0.0005).
Figure 7
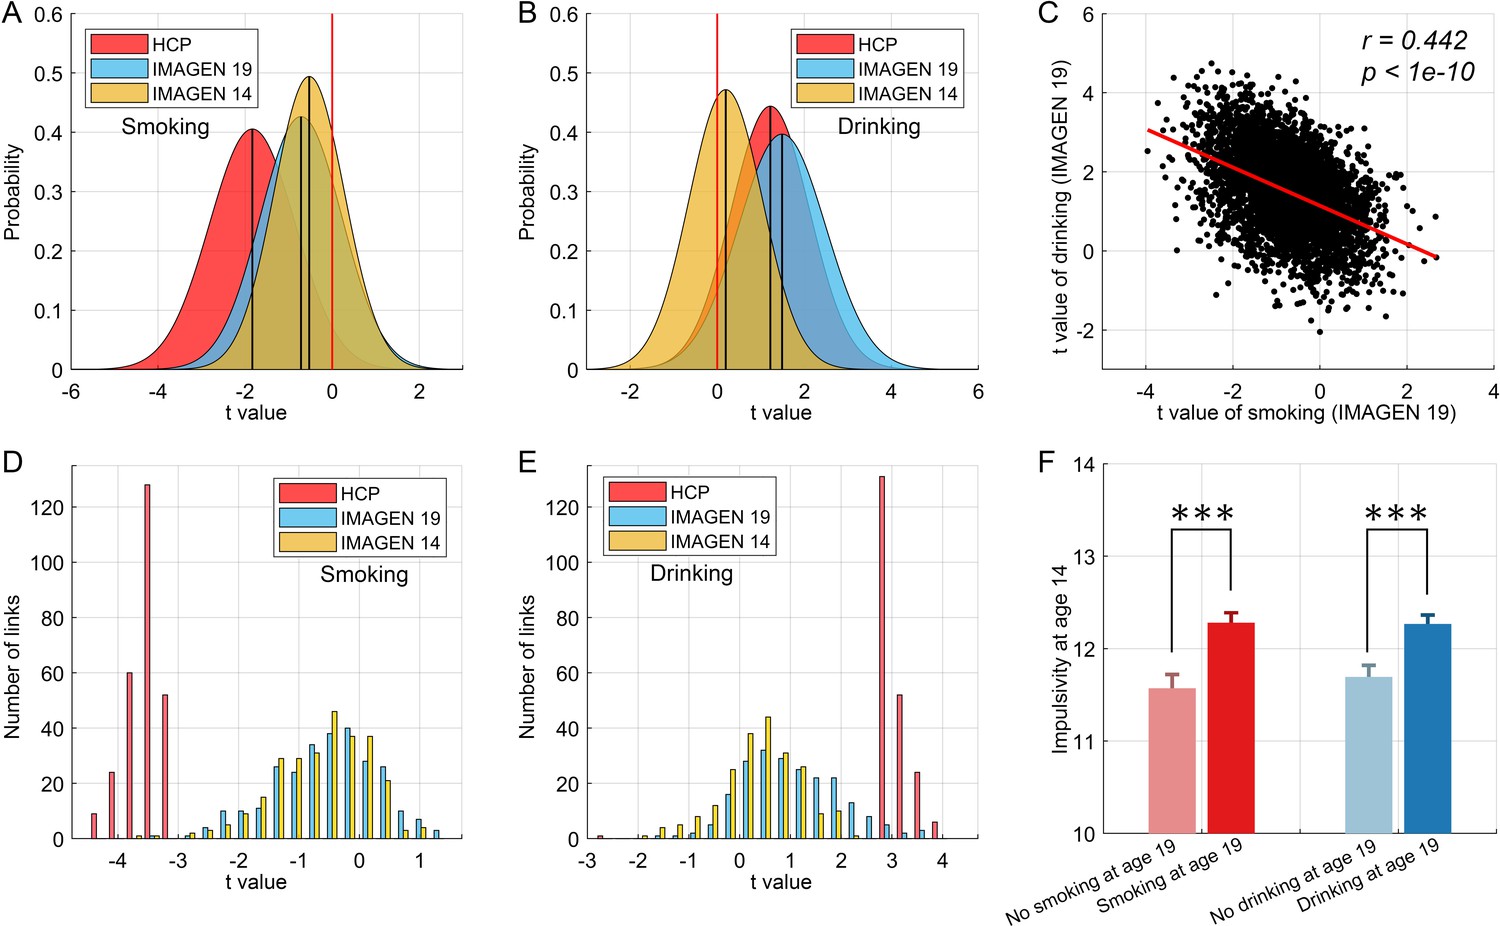
Cross-validation and causality analysis using the IMAGEN dataset.
(A) The distribution of t values of all brain links in the three datasets (i.e. HCP, and IMAGEN at age 14 and 19) for smoking. (B) The same for the drinking group. The overall change pattern identified in the HCP dataset, that is decreased FC in smoking and increased FC in drinking, is consistent in the IMAGEN dataset. This is useful cross-validation. (C) The correlation between the t values of the contrasts for the drinking and smoking groups involving all links in the brain. (D) The distribution of t values of the significant links identified in the HCP dataset for all three datasets (i.e. HCP, IMAGEN at age 14 and 19) for smoking. (E) The same for the drinking group. (F) The results for impulsivity at age 14 from the IMAGEN dataset. This shows that the 14 year olds who will smoke at age 19 (n = 421) have higher impulsivity than those who will not smoke at 19 (n = 184) (t = −3.72, p=2.20 × 10⁻⁴). The 14 year olds who will drink at age 19 (n = 527) have higher impulsivity than those who will not drink at 19 (n = 298) (t = −3.67, p=2.60 × 10⁻⁴). ***p<0.001.
Tables
Table 1
Top 30 Functional Connectivity links with t and p values for Smoking and Drinking.
A negative t value indicates reduced FC relative to the control group.
| Smoking | |||||||
|---|---|---|---|---|---|---|---|
| Functional connectivity | p value | t value | Functional connectivity | p value | t value | ||
| Frontal_Sup_2_L | OFCmed_R | 9.63E-06 | -4.464 | Frontal_Inf_Orb_2_L | Rolandic_Oper_R | 6.60E-05 | -4.019 |
| Frontal_Sup_2_L | Frontal_Mid_2_R | 1.23E-05 | -4.409 | Parietal_Sup_R | Precuneus_L | 6.74E-05 | -4.014 |
| Frontal_Sup_2_L | Frontal_Inf_Oper_R | 1.57E-05 | -4.354 | Frontal_Sup_2_L | Parietal_Sup_R | 7.11E-05 | -4.001 |
| Frontal_Inf_Orb_2_L | Temporal_Sup_R | 1.85E-05 | -4.317 | Frontal_Inf_Orb_2_L | Occipital_Mid_R | 7.60E-05 | -3.984 |
| Frontal_Inf_Orb_2_L | SupraMarginal_R | 2.02E-05 | -4.297 | Frontal_Sup_2_R | Frontal_Inf_Oper_R | 7.75E-05 | -3.980 |
| Frontal_Inf_Oper_R | Frontal_Inf_Tri_L | 2.26E-05 | -4.271 | Frontal_Inf_Orb_2_L | Insula_R | 7.95E-05 | -3.973 |
| Caudate_L | Pallidum_L | 2.42E-05 | -4.255 | Caudate_R | Putamen_R | 7.99E-05 | -3.972 |
| Caudate_L | Putamen_L | 2.87E-05 | -4.216 | Frontal_Mid_2_L | Frontal_Inf_Oper_R | 8.07E-05 | -3.970 |
| Hippocampus_L | Temporal_Sup_L | 3.37E-05 | -4.179 | Frontal_Inf_Orb_2_R | Parietal_Sup_L | 8.59E-05 | -3.955 |
| Frontal_Inf_Orb_2_L | Parietal_Sup_R | 3.78E-05 | -4.152 | Amygdala_R | Temporal_Sup_R | 8.94E-05 | -3.945 |
| Frontal_Med_Orb_R | Parietal_Sup_R | 3.86E-05 | -4.147 | Frontal_Inf_Oper_L | OFClat_R | 9.31E-05 | -3.935 |
| Frontal_Inf_Orb_2_L | Temporal_Sup_L | 4.59E-05 | -4.106 | Frontal_Inf_Orb_2_L | Rolandic_Oper_L | 9.37E-05 | -3.933 |
| Frontal_Inf_Tri_L | SupraMarginal_R | 4.90E-05 | -4.090 | Frontal_Inf_Tri_L | Precuneus_R | 9.54E-05 | -3.929 |
| OFCmed_R | Parietal_Sup_R | 5.11E-05 | -4.080 | Frontal_Inf_Oper_L | Cingulate_Ant_R | 1.01E-04 | -3.914 |
| Frontal_Inf_Orb_2_L | Amygdala_R | 5.41E-05 | -4.067 | Frontal_Sup_2_R | Frontal_Mid_2_R | 1.02E-04 | -3.912 |
| Drinking | |||||||
| Functional connectivity | p value | t value | Functional connectivity | p value | t value | ||
| Precentral_L | OFCmed_L | 6.02E-04 | 3.445 | Cingulate_Ant_L | Postcentral_L | 3.42E-04 | 3.598 |
| Precentral_R | OFCmed_L | 2.41E-04 | 3.689 | Cingulate_Mid_L | Postcentral_L | 1.86E-04 | 3.756 |
| Rolandic_Oper_R | OFCmed_L | 1.28E-04 | 3.851 | OFCmed_L | Postcentral_R | 4.73E-04 | 3.511 |
| Olfactory_L | OFCmed_L | 4.35E-05 | 4.112 | Cingulate_Ant_L | Postcentral_R | 2.72E-04 | 3.658 |
| Rectus_R | OFCmed_L | 3.25E-04 | 3.611 | Cingulate_Mid_L | Postcentral_R | 1.94E-04 | 3.745 |
| Frontal_Mid_2_R | OFCmed_R | 6.10E-04 | 3.442 | Cingulate_Ant_L | SupraMarginal_R | 5.47E-04 | 3.472 |
| OFCmed_L | OFCpost_L | 4.25E-04 | 3.540 | OFCmed_L | Heschl_L | 1.36E-04 | 3.834 |
| Precentral_L | Cingulate_Ant_L | 4.52E-04 | 3.523 | Cingulate_Ant_L | Heschl_L | 1.55E-04 | 3.803 |
| Precentral_R | Cingulate_Ant_L | 2.50E-04 | 3.680 | Cingulate_Mid_L | Heschl_L | 5.02E-04 | 3.495 |
| Rolandic_Oper_L | Cingulate_Ant_L | 4.44E-04 | 3.528 | Cingulate_Mid_R | Heschl_L | 4.19E-04 | 3.544 |
| Rolandic_Oper_R | Cingulate_Ant_L | 1.45E-04 | 3.819 | SupraMarginal_R | Heschl_L | 2.68E-04 | 3.661 |
| Insula_R | Cingulate_Ant_L | 5.27E-04 | 3.481 | SupraMarginal_R | Heschl_R | 3.72E-04 | 3.575 |
| Rolandic_Oper_R | Cingulate_Ant_R | 5.22E-04 | 3.484 | Cingulate_Ant_L | Temporal_Sup_L | 1.49E-04 | 3.812 |
| OFCmed_L | Cingulate_Ant_R | 5.34E-04 | 3.478 | Cingulate_Ant_R | Temporal_Sup_L | 5.61E-04 | 3.464 |
| Precentral_R | Cingulate_Mid_L | 5.75E-04 | 3.458 | Cingulate_Mid_R | Temporal_Sup_L | 4.55E-04 | 3.521 |
Table 2
The demographic characteristics of participants.
https://doi.org/10.7554/eLife.40765.019| Basic information | |||||||
|---|---|---|---|---|---|---|---|
| Age (year) | Gender (Male/Female) | Handedness | Race (White/Others) | Education (years) | BMI | Head motion | BPDiastolic |
| 28.7813.696 | 368/463 | 65.84243.911 | 617/214 | 14.9171.798 | 26.5135.238 | 0.3520.135 | 76.64110.512 |
| BPSystolic | Total gray matter volume | DDisc_AUC_200 | DDisc_AUC_40K | Total white matter volume | |||
| 123.70214.013 | 684867.965398.2 | 0.2540.201 | 0.4990.287 | 444066.855413.1 | |||
| Smoking information | |||||||
| SSAGA_TB_Smoking_History | SSAGA_TB_Yrs_Smoked | SSAGA_TB_Yrs_Smoked | SSAGA_FTND_Score | SSAGA_HSI_Score | SSAGA_TB_ Age_1 st_Cig | SSAGA_TB_Reg_CPD | SSAGA_TB_Hvy_CPD |
| 461/370 | 13.8344.006 | 13.834.01 | 2.0631.871 | 1.5711.369 | 16.3372.303 | 10.0986.163 | 12.4397.253 |
| Drinking information | |||||||
| SSAGA_Alc_12_Drinks_Per_Day | SSAGA_Alc_12_Frq | SSAGA_Alc_12_Frq_Drk | SSAGA_Alc_12_Max_Drinks | SSAGA_Alc_Hvy_Frq | SSAGA_Alc_D4_Dp_Sx | SSAGA_Alc_D4_Ab_Dx | SSAGA_Alc_Hvy_ Drinks_Per_Day |
| 2.2711.580 | 4.3511.530 | 3.1140.863 | 2.8301.817 | 3.4381.777 | 0.5180.799 | 1.5931.422 | 3.3671.745 |
| Marijuana Use information | |||||||
| SSAGA_Mj_Use (No/Yes) | SSAGA_Mj_Ab_Dep (No/Yes) | SSAGA_Mj_Age_1 st_Use | SSAGA_Mj_Times_Used | ||||
| 379/452 | 750/81 | 2.612 0.935 | 1.398 1.693 | ||||
| The comparison of demographic characteristics of different sub-groups | |||||||
| Non-smoker | Regular Smoker | Statistic*/p value | Low Drinker | High Drinker | Statistic*/p value | ||
| Number of participants | 417 | 203 | / | 311 | 470 | / | |
| Age | 28.50 ± 3.70 | 29.62 ± 3.58 | −3.57/0.0004 | 29.28 ± 3.63 | 28.49 ± 3.70 | 2.94/0.0034 | |
| Gender (male/female) | 162/255 | 105/98 | 9.23/0.0024 | 97/214 | 249/221 | 36.01 / < 0.0001 | |
| Handedness | 67.42 ± 41.64 | 64.19 ± 45.92 | 0.88/0.381 | 67.77 ± 43.86 | 64.34 ± 44.26 | 1.06/0.288 | |
| Race (white/others) | 301/116 | 163/40 | 4.77/0.029 | 219/92 | 369/101 | 6.59/0.010 | |
| SSAGA_Educ | 15.23 ± 1.66 | 14.15 ± 1.91 | 7.21 / < 0.0001 | 15.17 ± 1.74 | 14.79 ± 1.83 | 2.91/0.004 | |
| BMI | 26.65 ± 5.46 | 26.57 ± 4.73 | 0.19/0.852 | 26.19 ± 5.54 | 26.77 ± 4.92 | −1.52/0.129 | |
| Head Motion | 0.087 ± 0.031 | 0.095 ± 0.038 | −2.63/0.009 | 0.085 ± 0.032 | 0.090 ± 0.033 | −1.09/0.057 | |
| BPDiastolic | 76.42 ± 10.20 | 77.14 ± 10.42 | −0.82/0.410 | 75.45 ± 10.62 | 77.61 ± 10.15 | −2.86/0.004 | |
| BPSystolic | 122.8 ± 13.88 | 125.5 ± 13.86 | −2.26/0.024 | 121.9 ± 13.34 | 125.2 ± 13.99 | −3.33/0.0009 | |
| DDisc_AUC_200 | 0.264 ± 0.199 | 0.202 ± 0.166 | 3.83/0.0001 | 0.274 ± 0.210 | 0.232 ± 0.186 | 2.90/0.0039 | |
| DDisc_AUC_40K | 0.510 ± 0.286 | 0.438 ± 0.278 | 2.95/0.0033 | 0.516 ± 0.291 | 0.480 ± 0.280 | 1.75/0.081 | |
| SSAGA_TB_Smoking_History (never/used) | 417 | 203 | / | 113/98 | 251/219 | 21.91 / < 0.0001 | |
| SSAGA_TB_Yrs_Smoked | / | 13.87 ± 3.98 | / | 13.20 ± 4.70 | 14.15 ± 3.61 | −1.56/0.119 | |
| SSAGA_Alc_12_Drinks_Per_Day | 1.978 ± 1.478 | 2.842 ± 1.756 | −6.41 / < 0.0001 | 0.823 ± 0.382 | 3.223 ± 1.320 | −31.2 / < 0.0001 | |
| SSAGA_Alc_12_Frq | 4.717 ± 1.356 | 3.980 ± 1.668 | 5.88 / < 0.0001 | 5.03 ± 1.29 | 3.91 ± 1.51 | 10.73 / < 0.0001 | |
| SSAGA_Mj_Use (never/used) | 256/161 | 29/74 | 122.0 / < 0.0001 | 173/138 | 162/308 | 34.21 / < 0.0001 | |
| SSAGA_Mj_Times_Used | 0.779 ± 1.273 | 2.783 ± 1.800 | −15.97 / < 0.0001 | 1.016 ± 1.458 | 1.777 ± 1.791 | −6.245 / < 0.0001 | |
-
Values are n or mean ± SD. The fractions provided in the some rows show the numbers of individuals who did not had the property shown in the column/the number who did. *: A group difference (independent samples t test or χ2 test). BPDiastolic: Blood Pressure – Systolic; BPSystolic: Blood Pressure – Diastolic; DDisc_AUC_200: Delay Discounting: Area Under the Curve (AUC) for Discounting of $200; DDisc_AUC_40K: Delay Discounting: Area Under the Curve for Discounting of $40,000; PMAT24_A_CR: Penn Progressive Matrices: Number of Correct Responses; PMAT24_A_RTCR: Penn Progressive Matrices: Median Reaction Time for Correct Responses; Flanker_AgeAdj: NIH Toolbox Flanker Inhibitory Control and Attention Test: Age-Adjusted Scale Score; ListSort_AgeAdj: NIH Toolbox List Sorting Working Memory Test: Age-Adjusted Scale Score; PicSeq_AgeAdj: NIH Toolbox Picture Sequence Memory Test: Age-Adjusted Scale Score; SCPT_TP: Short Penn Continuous Performance Test: True Positives = Sum of CPN_TP and CPL_TP; SSAGA_TB_Smoking_History: Smoking history: never smoked (0), experimented 1–19 times (1), experimented 20–99 times (2), regular smoker (3); SSAGA_TB_Yrs_Smoked: Years smoked (1–5 years = 5; 6–10 = 10; 11–15 = 15; 16+ = 18); SSAGA_FTND_Score: Fagerstrom FTND (test for nicotine dependence) score: 4 + indicative of dependence;>6 recoded as 6); SSAGA_HSI_Score: Fagerstrom HSI Score: HSI measure of tobacco dependence; SSAGA_TB_Age_1 st_Cig: For regular smokers, age first smoked a cigarette (even a puff); SSAGA_TB_Reg_CPD: Cigarettes per day when smoking regularly; SSAGA_TB_Hvy_CPD: Cigarettes per day during heaviest period; SSAGA_Alc_12_Drinks_Per_Day: Drinks consumed per drinking day in past 12 months: 0, 1, 2, 3, 4, 5–6 = 5, 7+ = 6; SSAGA_Alc_12_Frq: Frequency of any alcohol use in past 12 months; SSAGA_Alc_12_Frq_Drk: Frequency drunk in past 12 months; SSAGA_Alc_12_Max_Drinks: Max drinks in a single day in past 12 months; SSAGA_Alc_Hvy_Frq: Frequency of any alcohol use, heaviest 12 month period; SSAGA_Alc_D4_Dp_Sx: Number of DSM4 Alcohol Dependence Criteria Endorsed; SSAGA_Alc_D4_Ab_Dx: DSM4 Alcohol Abuse Criteria Met; SSAGA_Alc_Hvy_Drinks_Per_Day: Drinks per day in heaviest 12 month period; SSAGA_Mj_Use: Ever used marijuana: no = 0; yes = 1; SSAGA_Mj_Ab_Dep: Participant meets DSM criteria for Marijuana Dependence; SSAGA_Mj_Age_1 st_Use: Age at first marijuana use:<=14 = 1; 15–17 = 2; 18–20 = 3;>=21 = 4; SSAGA_Mj_Times_Used: Times used marijuana: never used = 0; 1–5 = 1; 6–10 = 2; 11–25 = 3; 26–50 = 3; 51–100 = 3; 101–999 = 4; 1000–2000 = 5;>2000 = 5. For more details for each term, it is available on the website: https://wiki.humanconnectome.org/display/PublicData/HCP+Data+Dictionary+Public-+500+Subject+Release
Additional files
-
Supplementary file 1
The anatomical regions defined in each hemisphere and their label in the automated anatomical labelling atlas AAL2.
Column four provides a set of possible abbreviations for the anatomical descriptions.
- https://doi.org/10.7554/eLife.40765.020
-
Supplementary file 2
The demographic characteristics of participants from the IMAGEN dataset.
- https://doi.org/10.7554/eLife.40765.021
-
Transparent reporting form
- https://doi.org/10.7554/eLife.40765.022
Download links
A two-part list of links to download the article, or parts of the article, in various formats.
Downloads (link to download the article as PDF)
Open citations (links to open the citations from this article in various online reference manager services)
Cite this article (links to download the citations from this article in formats compatible with various reference manager tools)
Decreased brain connectivity in smoking contrasts with increased connectivity in drinking
eLife 8:e40765.
https://doi.org/10.7554/eLife.40765


