Optogenetic control shows that kinetic proofreading regulates the activity of the T cell receptor
- University of Freiburg, Germany
- German Cancer Research Center, Germany
- University of Heidelberg, Germany
- Wageningen University and Research, Netherlands
- University of Düsseldorf, Germany
Figures
Figure 1
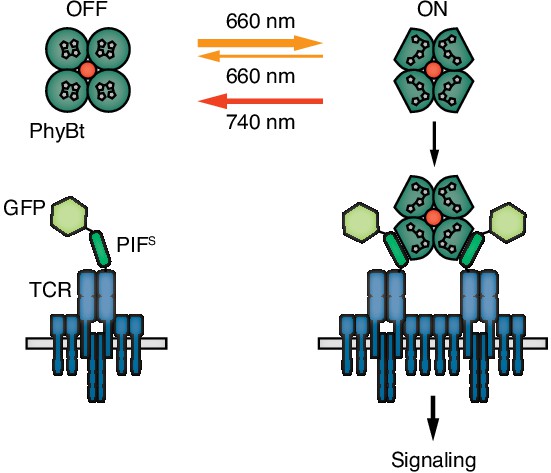
Engineering a light-controlled switch for the ligand-TCR interaction: the opto-ligand-TCR system.
Light of 660 nm and 740 nm wavelength reversibly switches PhyB between the OFF and ON states. In the ON state PhyB tetramers (PhyBt) bind to and cluster GFP-PIFS-TCRs leading to signaling and the activation of the T cell. The red dot indicates the fluorophore-coupled streptavidin tetramer.
Figure 2
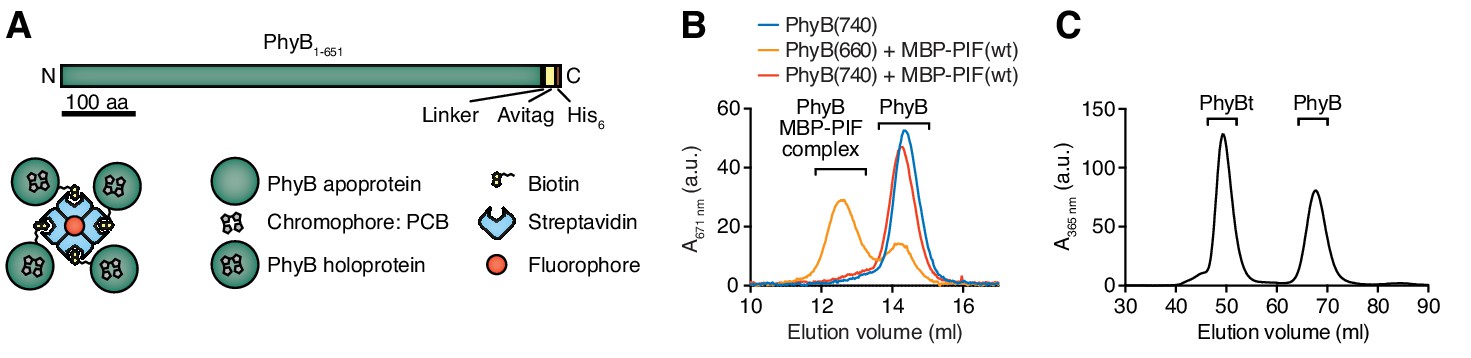
Production of PhyB tetramers.
(A) Schematics of the PhyB1-651 construct and the PhyB tetramers. PCB = phycocyanobilin. (B) Purified PhyB was illuminated with 660 nm light [PhyB(660)] and added in a 1:2 molar ratio to MBP-PIF(wt). The proteins were separated by gel filtration and PhyB was detected by its absorbance at the isosbestic point of 671 nm. PhyB molecules around 14.5 ml elution volume are the free PhyB molecules and the ones around 12.5 ml are the PhyB-MBP-PIF complexes. As controls, PhyB illuminated with 740 nm light [PhyB(740)] plus MBP-PIF(wt) and PhyB alone was only detected at 14.5 ml elution volume. Results show one experiment of n > 3. (C) Affinity chromatography-purified PhyB was mixed in a 10:1 molar ratio with streptavidin-DyLight650, incubated for 2 hr at room temperature and the formed PhyB tetramers (PhyBt) were isolated from monomers using size-exclusion chromatography. The elution of PhyB was monitored via its absorbance at 365 nm. Results show one experiment of n > 3.
Figure 3 with 1 supplement
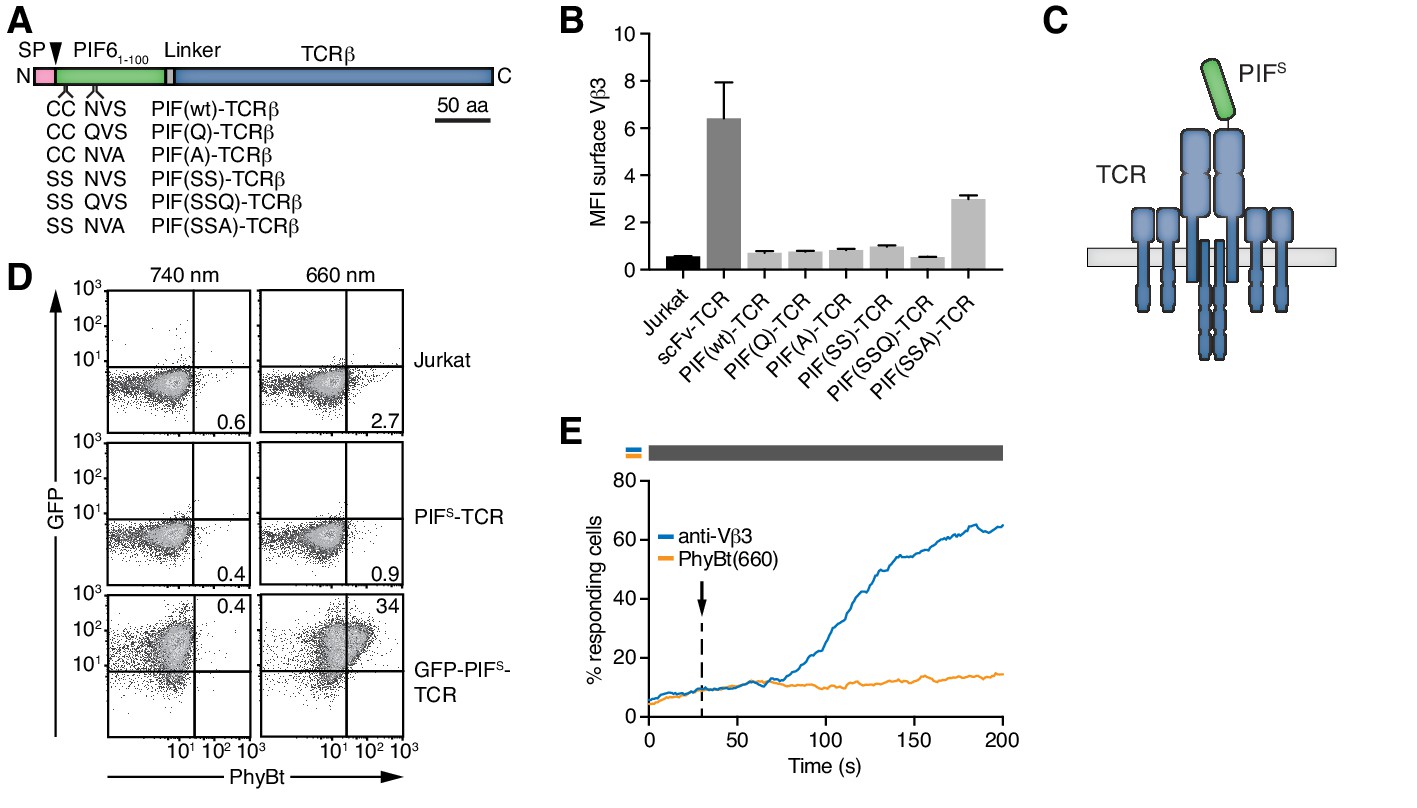
Selection of PIFS that can be expressed together with the TCR.
(A) Schematics of the PIF-TCRβ constructs, including wild-type and mutant PIF. SP depicts the signal peptide and the arrow the signal peptidase cleavage site. The schematic constructs are drawn to scale with the scale bar indicated. (B) The presence of the different PIF-TCRs and a single chain variable fragment (scFv)-TCR on the cell surface was measured in lentivirally transduced Jurkat cells together with the parental cell line using an anti-Vβ3 antibody (Jovi3) via flow cytometry. The median fluorescence intensity (MFI) averaged for three experiments ± SEM is depicted. (C) Scheme of PIFS-TCRβ as integrated into the TCR. (D) 100 nM phycoerythrin (PE)-labeled PhyBt pre-illuminated with 660 nm or 740 nm light were incubated with Jurkat, PIFS-TCR Jurkat and GFP-PIFS-TCR cells and binding detected by flow cytometry. Numbers depict the % of cells in the respective quadrant. Results show one experiment of n = 3. (E) PIFS-TCR cells were labeled with Indo-1 and calcium influx measured by flow cytometry. 100 nM PhyBt(660) (orange) or 1 µg/ml anti-Vβ3 antibody (blue) were added as stimuli. Their addition is marked by an arrow and the illumination procedure by a bar above the graph (grey = dark). Results show one experiment of n > 3.
Figure 3—figure supplement 1
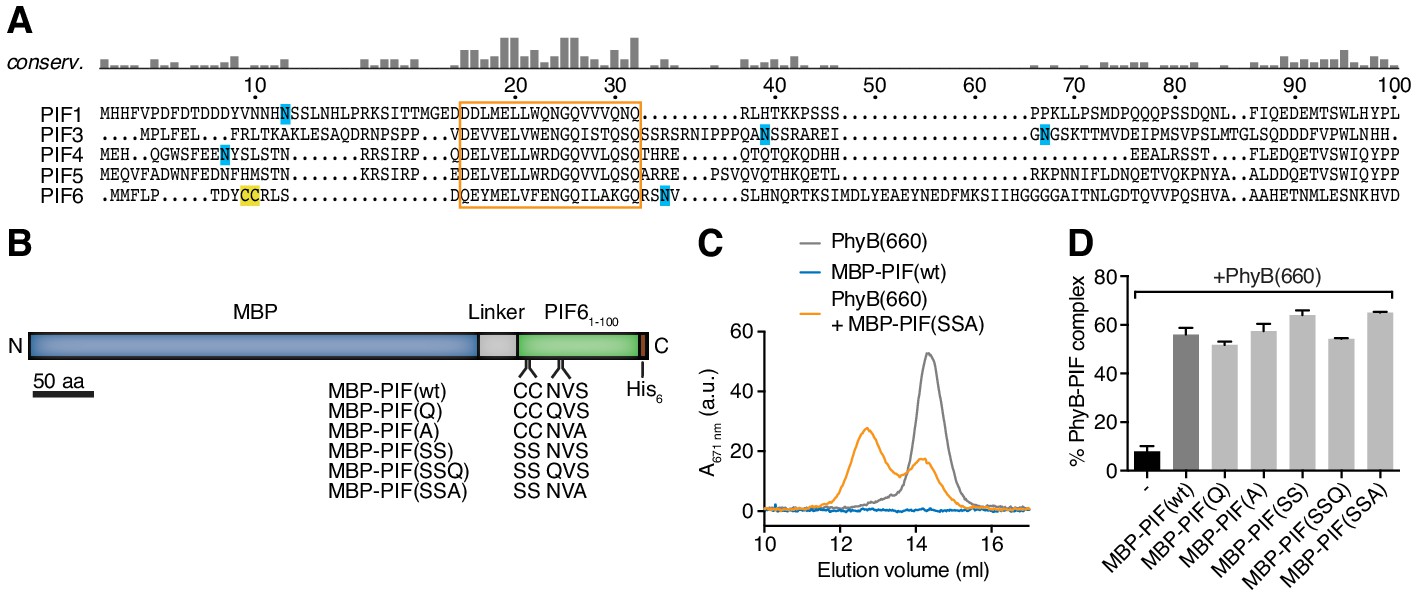
Mutations of the Cys and N-linked glycosylation site in PIF6.
(A) The first 100 amino acids of different PIF proteins from A. thaliana were aligned using MUSCLE. Cysteines are marked in yellow and asparagines that are used for N-linked glycosylation in blue. The highly conserved region that most likely constitutes the PhyB-binding site (Khanna et al., 2004) is boxed and was not mutated. The residue numbering is based on PIF6. (B) We fused the maltose-binding protein (MBP) of E. coli to the first 100 amino acids of PIF6 (PIF61-100) and a His6-tag for purification. We mutated Cys9, Cys10, Asn35 or Ser37 and the resulting mutant MBP-PIF61-100 molecules are shown alongside the wild-type MBP-PIF61-100 molecule. (C) 200 µg recombinant PhyB (see Figure 2) was illuminated with 660 nm light [PhyB(660)] and added in a 2:1 molar ratio to MBP-PIF(SSA). The mixture was incubated for 60 min at room temperature. We used a molar excess of PhyB to not saturate PIF-binding to PhyB. The proteins were then separated by gel filtration using a Superdex 200 10/300 GL column and PhyB was detected by its absorbance at 671 nm (grey line). PhyB molecules around 14.5 ml elution volume are the free PhyB molecules and the ones around 12.5 ml are the PhyB-MBP-PIF complexes, showing that approximately 60% of the PhyB molecules were PIF bound under these conditions. As controls, MBP-PIF alone did not absorb at 671 nm and PhyB alone was only detected at 14.5 ml elution volume. One representative experiment is depicted of n = 3. (D) Quantification of the binding data from (C) using all MBP-PIF variants, demonstrating that all mutants bound similarly to PhyB(660) as the wild-type MBP-PIF. Shown are the mean of 3 independent experiments ± SEM.
Figure 4
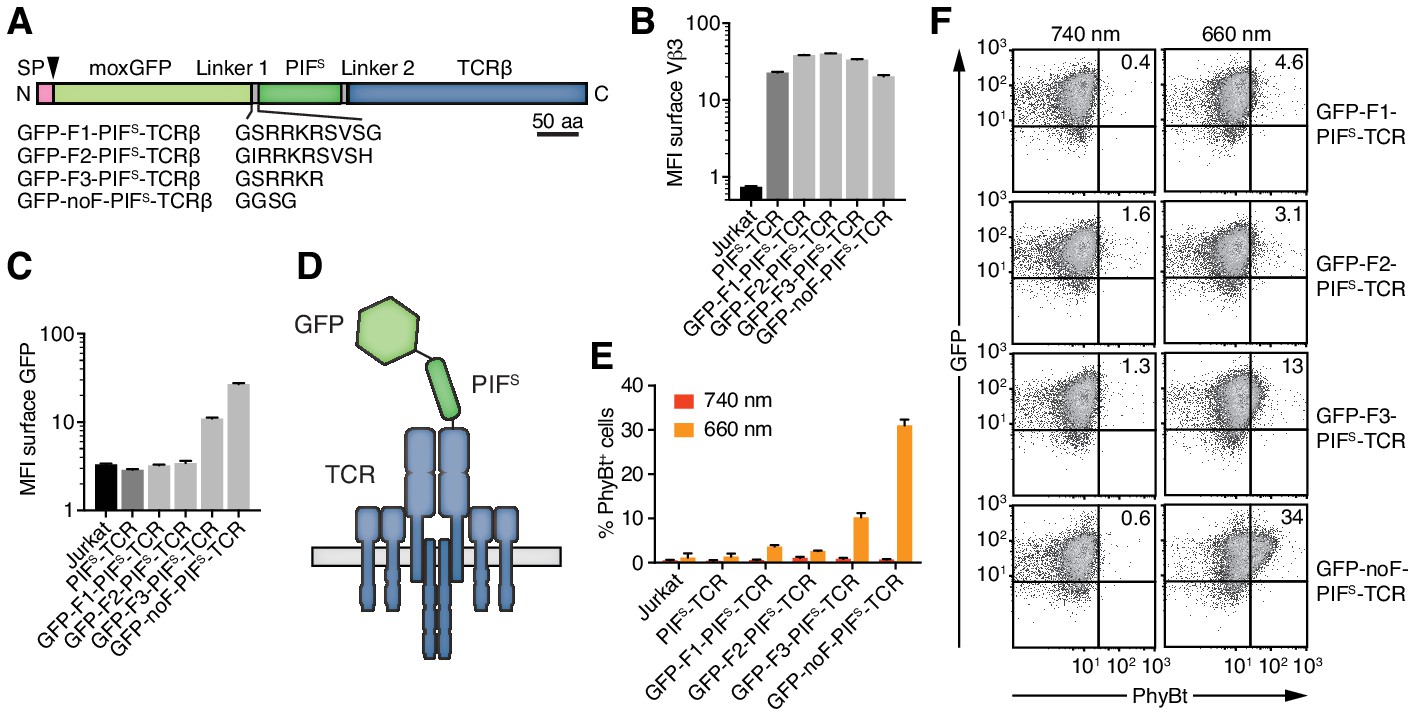
Engineering of the GFP-PIFS-TCR.
(A) Schematics of the GFP-PIFS-TCRβ constructs, including three different furin cleavage sites (F1, F2, F3) or omitting any cleavage site (noF). SP depicts the signal peptide, the arrow the signal peptidase cleavage site and moxGFP the monomeric GFP optimized for an oxidative environment. (B) The surface expression of the different GFP-PIFS-TCRs and PIFS-TCR was measured in transduced Jurkat cells together with the parental cell line using an anti-Vβ3 antibody (Jovi3) via flow cytometry. (C) Analogous to (B), the amount of GFP was quantified on the surface of the different transductants using a polyclonal anti-GFP antibody via flow cytometry. (B) and (C) depict the median fluorescence intensity (MFI) averaged for three measurements ± SEM. (D) Scheme of GFP-PIFS-TCRβ as integrated into the TCR. (E) 100 nM phycoerythrin (PE)-labeled PhyBt pre-illuminated with 660 nm or 740 nm light were incubated with the cells indicated and binding was detected by flow cytometry. One experiment out of three is depicted displaying the average of quadruplicates ± SEM. (F) Together with Figure 3D these are the GFP vs PhyBt plots of the experiment quantified in (E).
Figure 5 with 1 supplement
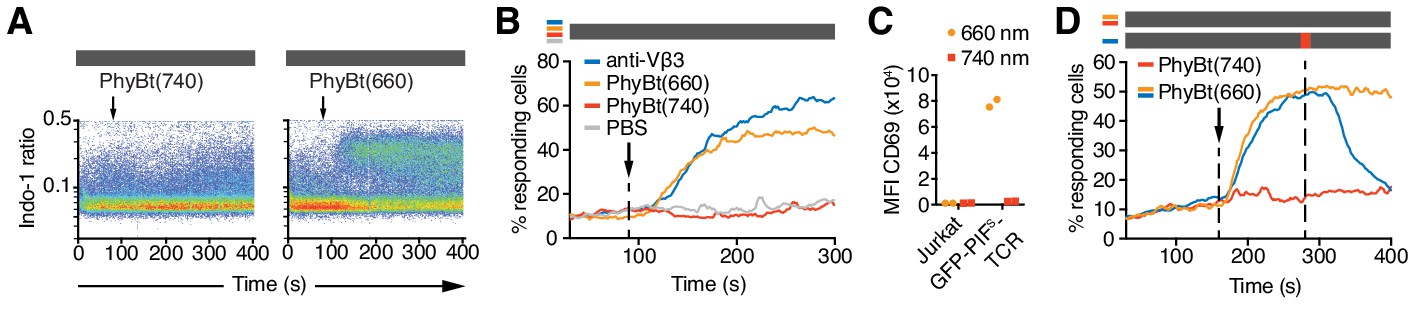
The opto-ligand-TCR can be switched ON and OFF.
(A) GFP-PIFS-TCR cells were labeled with Indo-1 and calcium influx measured by flow cytometry. The arrow marks the addition of the stimuli indicated, and the grey rectangle the absence of any light. Results show one experiment of n > 3. (B) Calcium influx into GFP-PIFS-TCR cells stimulated with anti-Vβ3, PhyBt(660), PhyBt(740) or PBS was measured as in (A). Results show one experiment of n > 3. (C) GFP-PIFS-TCR Jurkat cells were incubated with PhyBt bound to sepharose beads after a 30 s 660 nm or 740 nm light pulse for 6 hr. Expression of CD69 was quantified by flow cytometry using an APC-labeled anti-CD69 antibody. Data points depict two experiments. (D) Calcium influx was measured as in (A). PhyBt(660) induced calcium influx (blue and orange lines). After 2 min a 1 s short pulse of 100% intensity 740 nm light (red break in the grey bar) terminated the calcium response (blue line). Addition of PhyBt(740) did not induce calcium influx (red line). Results show one experiment of n > 3.
Figure 5—figure supplement 1
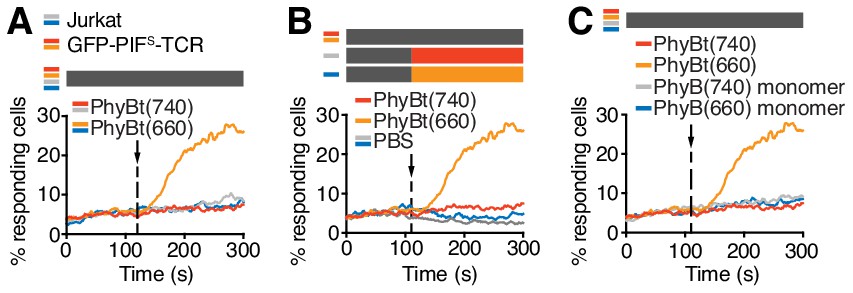
Characterization of the optogenetic PhyBt - GFP-PIFS-TCR system.
(A) Calcium influx was only seen in cells expressing GFP-PIFS-TCR and treated with PhyBt(660) (orange line). Cells lacking GFP-PIFS-TCR (parental Jurkat, grey and blue lines) or treatment with PhyBt(740) (red line) did not lead to intracellular calcium mobilization. Stimuli addition is marked by an arrow and the illumination procedure by a bar above the graph (grey = dark); One representative experiment is depicted of n = 2. (B) Treatment of GFP-PIFS-TCR cells with 660 or 740 nm light alone in the absence of PhyBt did not induce calcium influx (grey and blue lines). Addition of PhyBt(660) elicited a calcium response, whereas PhyBt(740) did not. Stimuli addition is marked by an arrow and the illumination procedures by bars above the graph (grey = dark, orange = 660 nm, red = 740 nm); One representative experiment is depicted of n = 3. (C) In contrast to PhyBt(660) (orange line) the PhyB(660) monomers (blue line) did not stimulate calcium influx in the GFP-PIFS-TCR cells. As controls, both PhyB forms illuminated with 740 light (red and grey lines) did not evoke any calcium influx; One representative experiment is depicted of n = 3. Panels A, B and C are from the same experiment.
Figure 6 with 1 supplement
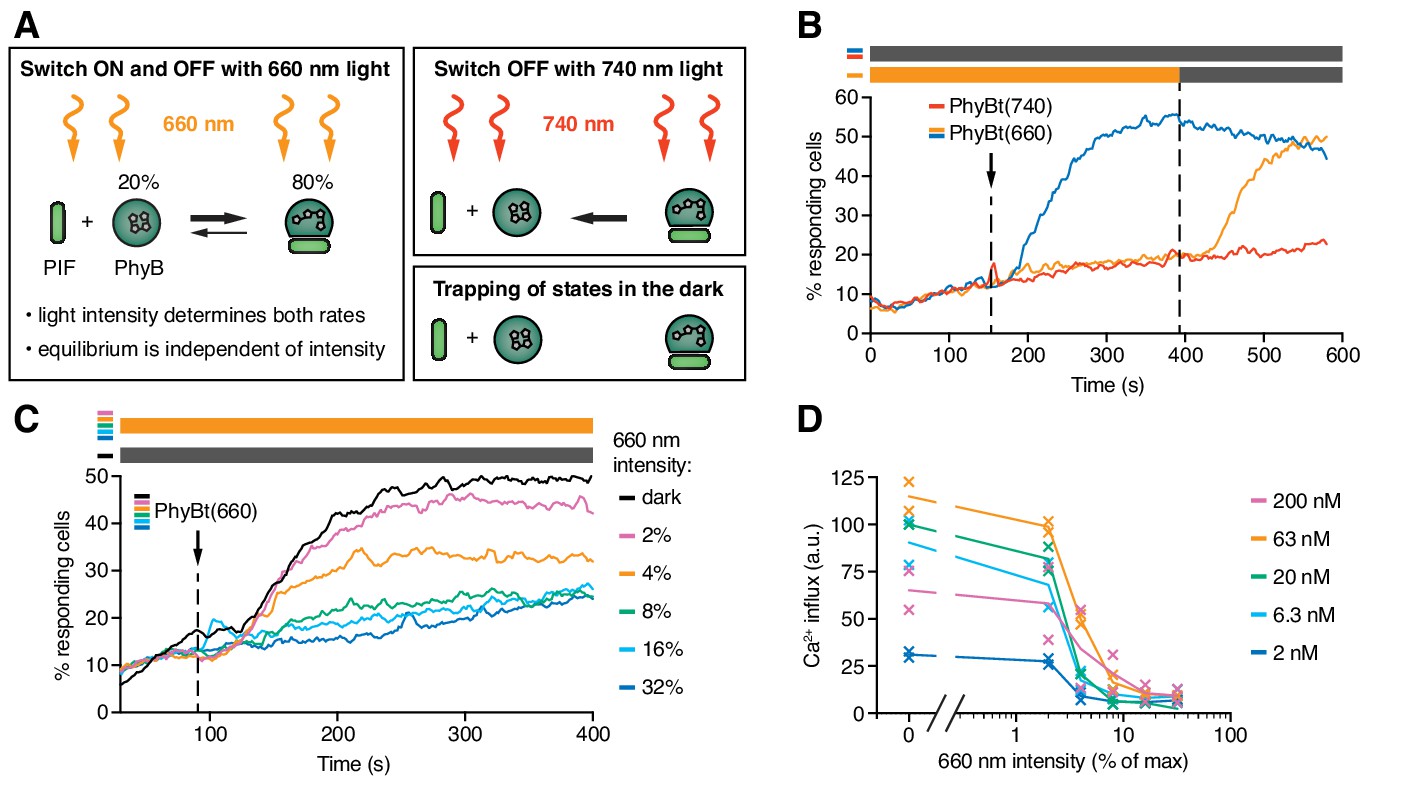
The half-life of the ON state of PhyB determines TCR signaling.
(A) Schematics of the different PhyB conversions under 660 nm and 740 nm light. In the dark the PhyB states do not change in the timescales relevant for this work. (B) Calcium influx was measured as in Figure 5. GFP-PIFS-TCR cells were constantly illuminated with 100% intensity 660 nm light (orange line). After 150 s PhyBt(660) was added (arrow) and after 390 s the light was switched off. As controls, PhyBt(660) (blue line) or PhyBt(740) (red line) was added to the cells in the dark. The bars represent the illumination procedure during the measurement (grey = dark, orange = 660 nm light). (C) 20 nM PhyBt(660) was added (arrow) after 90 s to GFP-PIFS-TCR cells continuously illuminated with 660 nm light of the depicted intensities. Results in (B) and (C) show one experiment of n > 3. (D) Quantification of experiments done as in (C) with the indicated PhyBt concentrations. Duplicates are shown with connecting lines going through the mean.
-
Figure 6—source data 1
Calcium influx quantification data at steady-state.
- https://doi.org/10.7554/eLife.42475.011
Figure 6—figure supplement 1
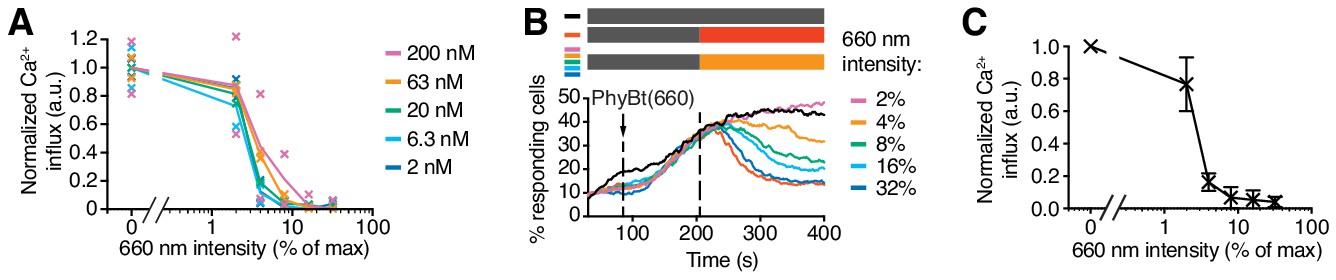
Use of the 660 nm light intensity to tune GFP-PIFS-TCR signaling.
(A) A threshold of the 660 nm light intensity to induce a calcium response. The data from Figure 6D were normalized for each PhyBt concentration by setting the value of dark (0% intensity) to 1.0 and value of 32% intensity to 0 to better visualize the overlap of the different curves. Duplicates are shown with connecting lines going through the mean. (B) Calcium influx was measured as in Figure 5. After 85 s of measurement 20 nM PhyBt(660) was added (arrow) to GFP-PIFS-TCR cells in the dark. After 205 s cells were illuminated with 660 nm light of the depicted intensities, or with 740 nm light (red line). As a control, cells were kept in the dark (black line). The result shows one representative experiment of n = 3. (C) Quantification of experiments done as in (B) using normalization as in (A). Shown are the mean of 3 independent experiments ± SEM.
Figure 7 with 5 supplements

T cells exploit a kinetic proofreading mechanism.
(A) The PhyB ON-OFF cycle, binding of PhyB ON to the TCR and kinetic proofreading (KPR) were combined into one model. (B) In this model the effective off-rate is a linear function, and (C) the effective affinity is the reciprocal of a linear function, of the 660 nm light intensity. (D) A likelihood ratio test (null hypothesis: τKPR = 0, i.e., no KPR; alternative hypothesis: τKPR > 0) strongly supports the existence of a KPR mechanism. (E) The amount of PhyBt bound to the GFP-PIFS-TCR cells and (F) calcium influx at different continuous 660 nm light intensities (from Figure 6D) and different PhyBt concentrations are plotted. The line and shaded area represent the fit and the estimated uncertainties of the KPR model. The data points represent the mean ±SEM of 6–9 replicates in (E), or individual data points of two experiments in (F).
Figure 7—figure supplement 1
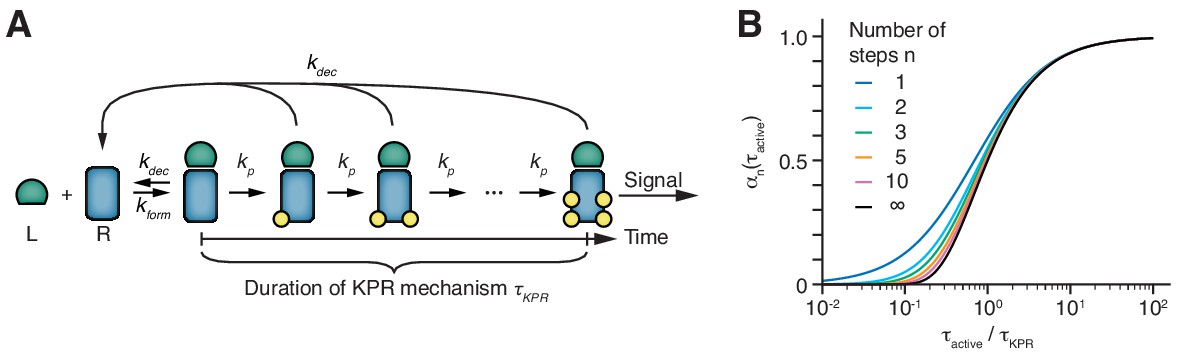
The duration of the kinetic proofreading mechanism is the principal parameter.
(A) Basic scheme of kinetic proofreading (KPR) according to McKeithan (McKeithan, 1995). Upon formation of an active TCR conformation (rate kform), the receptor has to undergo n modification steps, each with the same rate kp, in order to establish a signal. If the active conformation decays at any stage (rate kdec), all modifications are removed rapidly. The time span from forming an active TCR conformation (i.e., from the second binding event of the bivalent ligand binding) to signal initiation is termed the KPR duration τKPR. (B) The fraction of signaling receptors among all receptors in the active conformation in dependence on the half-life of the active conformation τactive = ln(2)/kdec, expressed relative to the duration of the KPR mechanism τKPR. Shown are curves that share the same KPR duration but differ in the number of steps.
Figure 7—figure supplement 2
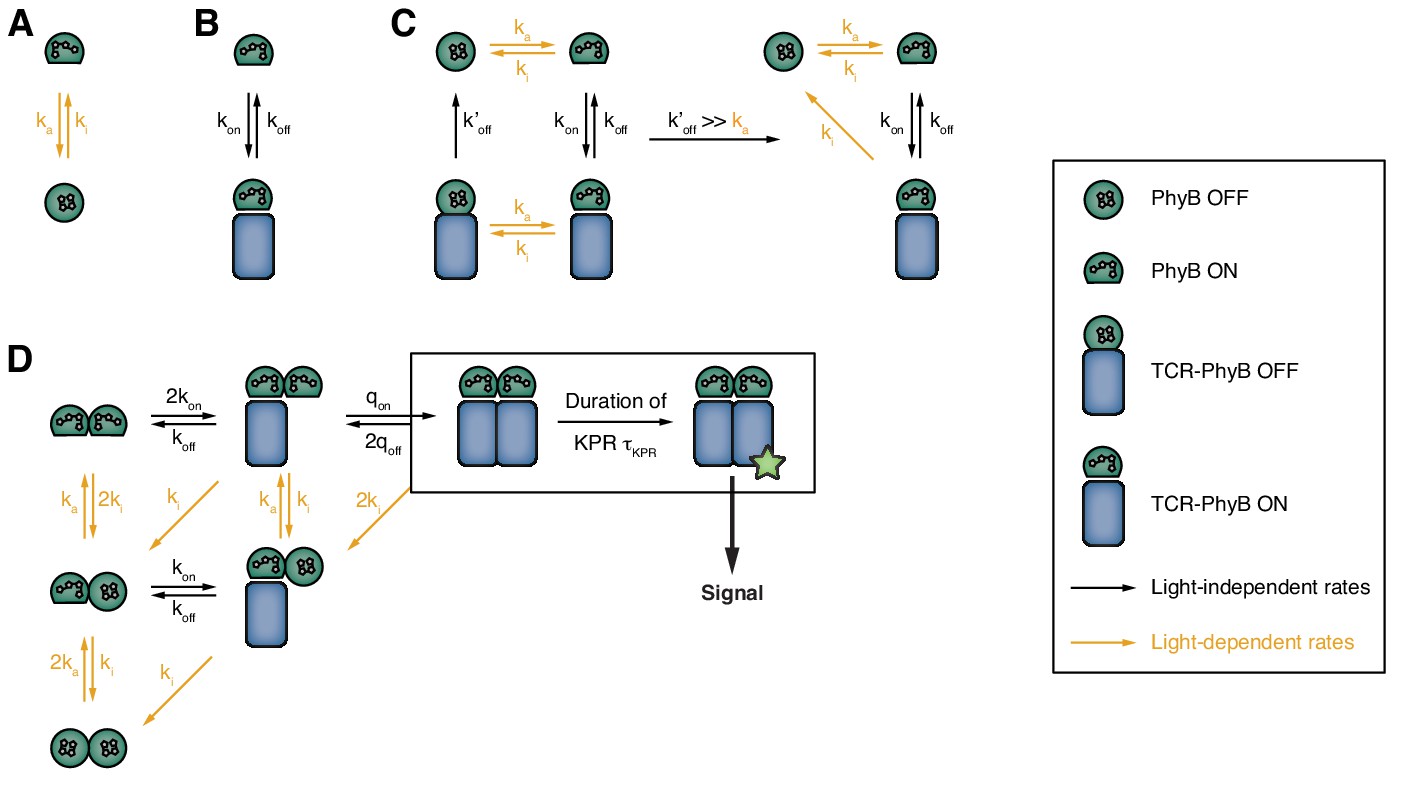
Consecutive setup of the binding model.
(A) PhyB can reversibly interconvert between the ON and the OFF state. (B) Only the PhyB in the ON state can bind to GFP-PIFS-TCRs. (C) If exposed to light, PhyB ON can convert to PhyB OFF while still in complex with a GFP-PIFS-TCR (left). Because dissociation in this state is very fast, conversion into PhyB OFF effectively increases the off-rate of the GFP-PIFS-TCRs-PhyB ON complex (right). (D) Extension of the model to account for the oligomeric structure of the PhyB ligands. Since TCRs are required to be cross-linked for signaling in our experimental setup, only multivalently bound PIF-TCRs can induce an intracellular signal.
Figure 7—figure supplement 3
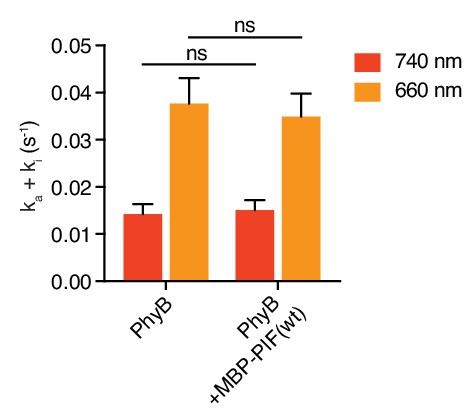
Photoconversion rates of PhyB are independent of PIF binding.
Photoconversion rates of PhyB were measured in the presence or absence of MBP-PIF(wt) by tracking the fraction of converted PhyB every 10 s using absorbance spectra acquisition. Conversion from a pool of solely PhyB OFF to PhyB ON and vice versa (the latter starting with the achievable 4:1 ON:OFF ratio) was induced by illumination with 70 µmol m−2 s−1 660 nm (orange bars) or 740 nm (red bars) light. MBP-PIF(wt) binding to PhyB did not influence the photoconversion rate. Shown are the mean ±SEM of three independent experiments, tested with two-way ANOVA. P-value with vs without MBP-PIF(wt) is 0.52.
Figure 7—figure supplement 4
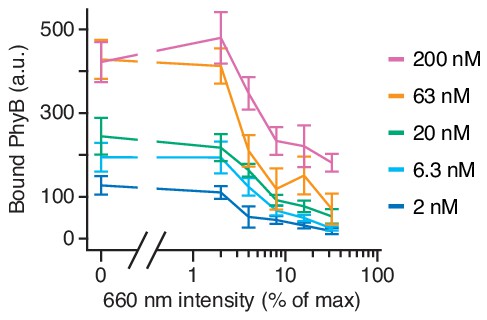
Amount of PhyBt bound to GFP-PIFS-TCR inversely correlates with 660 nm light intensity.
Amount of bound PhyBt on the surface of GFP-PIFs-TCRs under different continuous 660 nm light intensities and PhyBt concentrations as indicated. PhyBt(660) were added to the cells under continuous 660 nm light and incubated for 90 s at 37°C. Subsequently, samples were washed in the dark and the tetramer fluorescence (DyLight650 at streptavidin) analyzed by flow cytometry. Connecting lines going through the mean of 6–9 replicates, error bars depicting the SEM.
-
Figure 7—figure supplement 4—source data 1
Quantification data of surface-bound PhyBt.
- https://doi.org/10.7554/eLife.42475.017
Figure 7—figure supplement 5
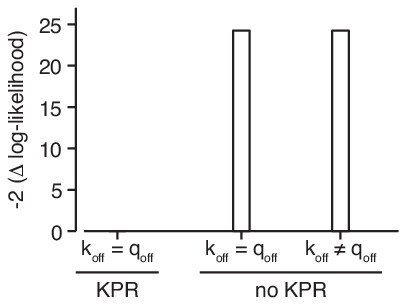
The data strongly support kinetic proofreading.
Kinetic proofreading (KPR) is required to explain the data if the off-rates of mono- and multivalent binding (koff respectively qoff) are the same. Allowing the off-rates to be distinct from each other in the absence of KPR does not improve the fit.
Figure 8 with 1 supplement
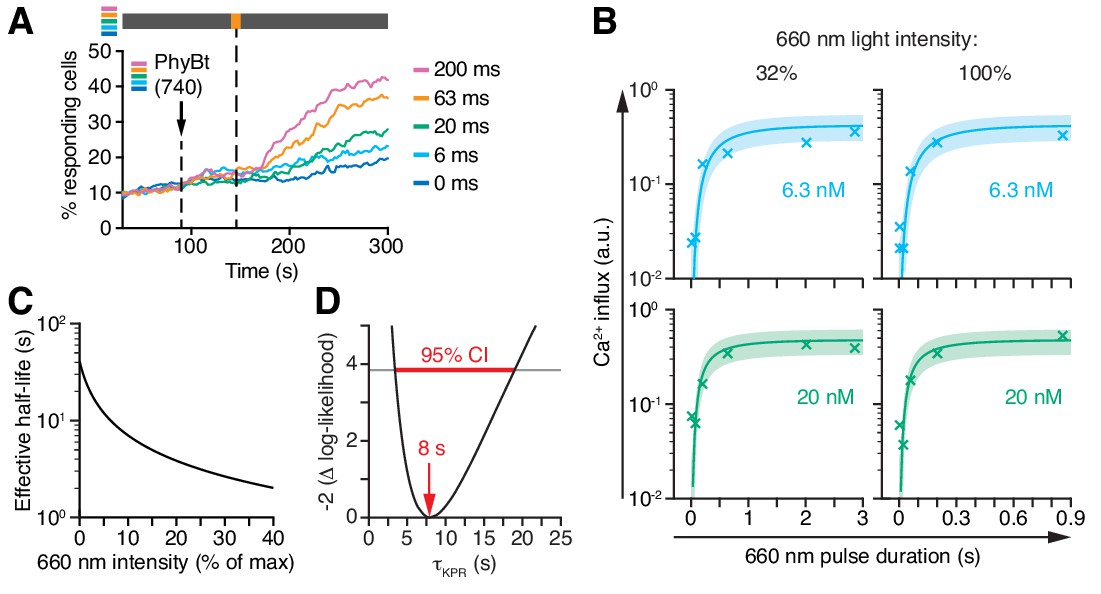
Kinetic proofreading at the TCR occurs with a half-life of 8 s.
(A) 20 nM PhyBt(740) was added to GFP-PIFS-TCR cells and a 660 nm pulse of 100% intensity was given for the indicated durations. The calcium influx was quantified over time, indicating that longer pulse durations switch more PhyB OFF molecules to the ON state. Stimuli addition is marked by an arrow and the illumination procedure by a bar above the graph (grey = dark, orange = 660 nm). (B) Experiment as in (A) were performed using 6.3 nM or 20 nM PhyBt and 32% or 100% intensity 660 nm light. The data is shown together with the fit and estimated SD. Results in (A) and (B) show one experiment of n > 3. (C) The estimated half-lives of the PhyB-TCR complex in dependence on the light intensity. (D) The profile likelihood of the KPR time shows that the 95% confidence interval (CI) ranges from 3 s to 19 s, while the best-fit value is 8 s.
-
Figure 8—source data 1
Calcium influx quantification data for different 660 nm pulse durations and PhyBt concentrations.
- https://doi.org/10.7554/eLife.42475.021
Figure 8—figure supplement 1
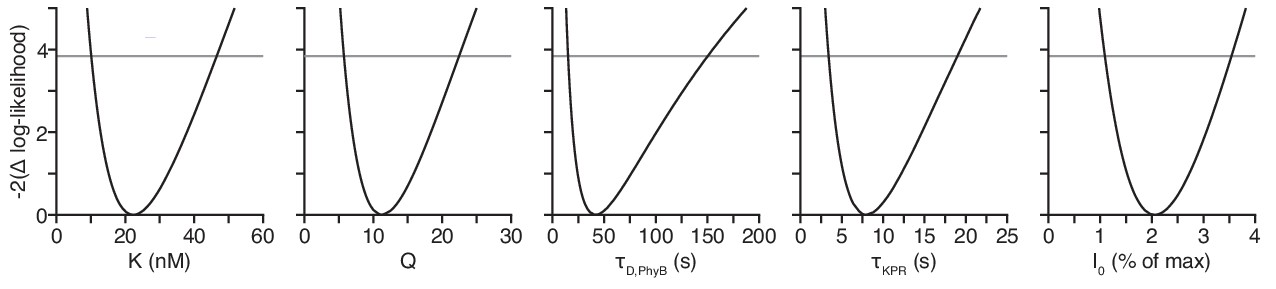
All model parameters are identifiable.
The confidence intervals were computed using the profile likelihood method.
Figure 9

Kinetic proofreading determines T cell activation.
Ligands that bind shorter than the KPR time of 8 s (half-life of binding) fail to induce efficient TCR signaling. Ligands that bind longer allow the completion of several biochemical steps (white arrows) that result in an activatory signal by the TCR. This signal provokes further signaling (grey arrows) that ultimately leads to T cell activation.
Tables
Key resources table
| Reagent type (species) or resource | Designation | Source or reference | Identifiers | Additional information |
|---|---|---|---|---|
| Genetic reagent (Aequorea victoria) | moxGFP | PMID: 26158227 | Erik Snapp (Albert Einstein College of Medicine), Addgene plasmid # 68070 | |
| Genetic reagent (Arabidopsis thaliana) | PIF6 | PMID: 29603429 | ||
| Genetic reagent (Homo sapiens) | HA1.7 TCRβ | PMID: 17188005 | ||
| Genetic reagent (Mus musculus) | scFv | PMID: 17188005 | ||
| Cell line (Homo sapiens) | Jurkat | PMID: 15057788 | Arthur Weiss (HHMI, UCSF) | |
| Cell line (Homo sapiens) | Jurkat scFv-TCRβ | this paper | Jurkat expressing scFv-TCRβ | |
| Cell line (Homo sapiens) | Jurkat PIF(wt)-TCRβ | this paper | Jurkat expressing PIF(wt)-TCRβ | |
| Cell line (Homo sapiens) | Jurkat PIF(Q)-TCRβ | this paper | Jurkat expressing PIF(Q)-TCRβ | |
| Cell line (Homo sapiens) | Jurkat PIF(A)-TCRβ | this paper | Jurkat expressing PIF(A)-TCRβ | |
| Cell line (Homo sapiens) | Jurkat PIF(SS)-TCRβ | this paper | Jurkat expressing PIF(SS)-TCRβ | |
| Cell line (Homo sapiens) | Jurkat PIF(SSQ)-TCRβ | this paper | Jurkat expressing PIF(SSQ)-TCRβ | |
| Cell line (Homo sapiens) | Jurkat PIF(SSA)-TCRβ; Jurkat PIFS-TCRβ | this paper | Jurkat expressing PIF(SSA)-TCRβ | |
| Cell line (Homo sapiens) | Jurkat GFP-F1-PIFS-TCRβ | this paper | Jurkat expressing GFP-F1-PIFS-TCRβ | |
| Cell line (Homo sapiens) | Jurkat GFP-F2-PIFS-TCRβ | this paper | Jurkat expressing GFP-F2-PIFS-TCRβ | |
| Cell line (Homo sapiens) | Jurkat GFP-F3-PIFS-TCRβ | this paper | Jurkat expressing GFP-F3-PIFS-TCRβ | |
| Cell line (H. sapiens) | Jurkat GFP-noF-PIFS-TCRβ; Jurkat GFP-PIFS-TCRβ | this paper | Jurkat expressing GFP-noF-PIFS-TCRβ | |
| Antibody | anti-Vβ3 Jovi3 | Ancell Cat# 102-020 | - | 5 µg/ml |
| Antibody | biotin-conjugated anti-GFP | Rockland Cat# 600-106-215 | RRID:AB_218204 | 5 µg/ml |
| Antibody | APC-conjugated anti-CD69 | Thermo Fisher Cat# MHCD6905 | RRID:AB_10372807 | 1:200 |
| Antibody | APC-conjugated anti-mouse | SouthernBiotech Cat# 1031-11L | - | 1:200 |
| Recombinant DNA reagent | PhyB1-651-Aviag-His6; pMH17 | PMID: 27884151 | ||
| Recombinant DNA reagent | p171 | PMID: 18832155 | Lars-Oliver Essen (University Marburg) | |
| Recombinant DNA reagent | PIF(wt)-TCRβ; pOSY015 | this paper | see Table S1 | |
| Recombinant DNA reagent | PIF(Q)-TCRβ; pOSY016 | this paper | see Table S1 | |
| Recombinant DNA reagent | PIF(A)-TCRβ; pOSY017 | this paper | see Table S1 | |
| Recombinant DNA reagent | scFv-TCRβ; pOSY019 | this paper | see Table S1 | |
| Recombinant DNA reagent | PIF(SS)-TCRβ; pOSY026 | this paper | see Table S1 | |
| Recombinant DNA reagent | PIF(SSQ)-TCRβ; pOSY027 | this paper | see Table S1 | |
| Recombinant DNA reagent | PIF(SSA)-TCRβ; PIFS-TCRβ; pOSY028 | this paper | see Table S1 | |
| Recombinant DNA reagent | MBP-PIF(wt); pOSY061 | this paper | see Table S1 | |
| Recombinant DNA reagent | MBP-PIF(Q); pOSY062 | this paper | see Table S1 | |
| Recombinant DNA reagent | MBP-PIF(A); pOSY063 | this paper | see Table S1 | |
| Recombinant DNA reagent | MBP-PIF(SS); pOSY064 | this paper | see Table S1 | |
| Recombinant DNA reagent | MBP-PIF(SSQ); pOSY065 | this paper | see Table S1 | |
| Recombinant DNA reagent | MBP-PIF(SSA); pOSY066 | this paper | see Table S1 | |
| Recombinant DNA reagent | GFP-F1-PIFS-TCRβ; pOSY073 | this paper | see Table S1 | |
| Recombinant DNA reagent | GFP-F2-PIFS-TCRβ; pOSY074 | this paper | see Table S1 | |
| Recombinant DNA reagent | GFP-F3-PIFS-TCRβ; pOSY075 | this paper | see Table S1 | |
| Recombinant DNA reagent | GFP-noF-PIFS-TCRβ; GFP-PIFS-TCRβ; pOSY076 | this paper | see Table S1 | |
| Peptide, recombinant protein | PE-conjugated streptavidin | Thermo Fisher Cat# S866 | - | |
| Peptide, recombinant protein | DyLight650-conjugated streptavidin | Thermo Fisher Cat# 84547 | - |
Additional files
-
Supplementary file 1
List of plasmids created in this study.
Plasmids generated in this study were listed next to the protein each plasmid codes for and a brief description. Detailed descriptions of the cloning strategies are available upon request.
- https://doi.org/10.7554/eLife.42475.023
-
Supplementary file 2
Summary of primers.
- https://doi.org/10.7554/eLife.42475.024
-
Supplementary file 3
Plasmid map pOSY015.
- https://doi.org/10.7554/eLife.42475.025
-
Supplementary file 4
Plasmid pOSY015 sequence.
- https://doi.org/10.7554/eLife.42475.026
-
Supplementary file 5
Plasmid pOSY016 sequence.
- https://doi.org/10.7554/eLife.42475.027
-
Supplementary file 6
Plasmid map pOSY016.
- https://doi.org/10.7554/eLife.42475.028
-
Supplementary file 7
Plasmid pOSY017 sequence.
- https://doi.org/10.7554/eLife.42475.029
-
Supplementary file 8
Plasmid map pOSY017.
- https://doi.org/10.7554/eLife.42475.030
-
Supplementary file 9
Plasmid pOSY019 sequence.
- https://doi.org/10.7554/eLife.42475.031
-
Supplementary file 10
Plasmid map pOSY019.
- https://doi.org/10.7554/eLife.42475.032
-
Supplementary file 11
Plasmid pOSY026 sequence.
- https://doi.org/10.7554/eLife.42475.033
-
Supplementary file 12
Plasmid map pOSY026.
- https://doi.org/10.7554/eLife.42475.034
-
Supplementary file 13
Plasmid pOSY027 sequence.
- https://doi.org/10.7554/eLife.42475.035
-
Supplementary file 14
Plasmid map pOSY027.
- https://doi.org/10.7554/eLife.42475.036
-
Supplementary file 15
Plasmid pOSY028 sequence.
- https://doi.org/10.7554/eLife.42475.037
-
Supplementary file 16
Plasmid map pOSY028.
- https://doi.org/10.7554/eLife.42475.038
-
Supplementary file 17
Plasmid pOSY061 sequence.
- https://doi.org/10.7554/eLife.42475.039
-
Supplementary file 18
Plasmid map pOSY061.
- https://doi.org/10.7554/eLife.42475.040
-
Supplementary file 19
Plasmid pOSY062 sequence.
- https://doi.org/10.7554/eLife.42475.041
-
Supplementary file 20
Plasmid map pOSY062.
- https://doi.org/10.7554/eLife.42475.042
-
Supplementary file 21
Plasmid pOSY063 sequence.
- https://doi.org/10.7554/eLife.42475.043
-
Supplementary file 22
Plasmid map pOSY063.
- https://doi.org/10.7554/eLife.42475.044
-
Supplementary file 23
Plasmid pOSY064 sequence.
- https://doi.org/10.7554/eLife.42475.045
-
Supplementary file 24
Plasmid map pOSY064.
- https://doi.org/10.7554/eLife.42475.046
-
Supplementary file 25
Plasmid pOSY065 sequence.
- https://doi.org/10.7554/eLife.42475.047
-
Supplementary file 26
Plasmid map pOSY065.
- https://doi.org/10.7554/eLife.42475.048
-
Supplementary file 27
Plasmid pOSY066 sequence.
- https://doi.org/10.7554/eLife.42475.049
-
Supplementary file 28
Plasmid map pOSY066.
- https://doi.org/10.7554/eLife.42475.050
-
Supplementary file 29
Plasmid pOSY073 sequence.
- https://doi.org/10.7554/eLife.42475.051
-
Supplementary file 30
Plasmid map pOSY073.
- https://doi.org/10.7554/eLife.42475.052
-
Supplementary file 31
Plasmid pOSY074 sequence.
- https://doi.org/10.7554/eLife.42475.053
-
Supplementary file 32
Plasmid map pOSY074.
- https://doi.org/10.7554/eLife.42475.054
-
Supplementary file 33
Plasmid pOSY075 sequence.
- https://doi.org/10.7554/eLife.42475.055
-
Supplementary file 34
Plasmid map pOSY075.
- https://doi.org/10.7554/eLife.42475.056
-
Supplementary file 35
Plasmid pOSY076 sequence.
- https://doi.org/10.7554/eLife.42475.057
-
Supplementary file 36
Plasmid map pOSY076.
- https://doi.org/10.7554/eLife.42475.058
-
Transparent reporting form
- https://doi.org/10.7554/eLife.42475.059
Download links
A two-part list of links to download the article, or parts of the article, in various formats.
Downloads (link to download the article as PDF)
Open citations (links to open the citations from this article in various online reference manager services)
Cite this article (links to download the citations from this article in formats compatible with various reference manager tools)
Optogenetic control shows that kinetic proofreading regulates the activity of the T cell receptor
eLife 8:e42475.
https://doi.org/10.7554/eLife.42475


