Replication Study: The microRNA miR-34a inhibits prostate cancer stem cells and metastasis by directly repressing CD44
- Crown Biosciences Inc, Science & Technology Innovation Park, China
Figures
Figure 1 with 1 supplement

miR-34a expression in CD44 populations.
LAPC4 cells purified from xenograft tumors were sorted into CD44+ and CD44- populations by fluorescence-activated cell sorting. (A) Percent expression of let-7b or miR-34a (normalized to miR-103) was determined by qRT-PCR for both populations. For each microRNA, expression levels in CD44+ cells were made relative to CD44- cells, such that if expression was equal it would be assigned a value of 100% (indicated by dashed line). Means reported from one biological repeat. Note, let-7b expressed at 0.20%. Data from the representative experiment reported in Figure 1B of Liu et al. (2011) is displayed as a single point (red circle) for comparison. (B) Relative expression levels of let-7b or miR-34a (normalized to miR-103) are presented for CD44- and CD44+ populations. Expression levels were made relative to let-7b in CD44+ cells which were assigned a value of 1. This is the same experiment as part (A), which is from one biological repeat. Additional details for this experiment can be found at https://osf.io/tkn6c/.
Figure 1—figure supplement 1
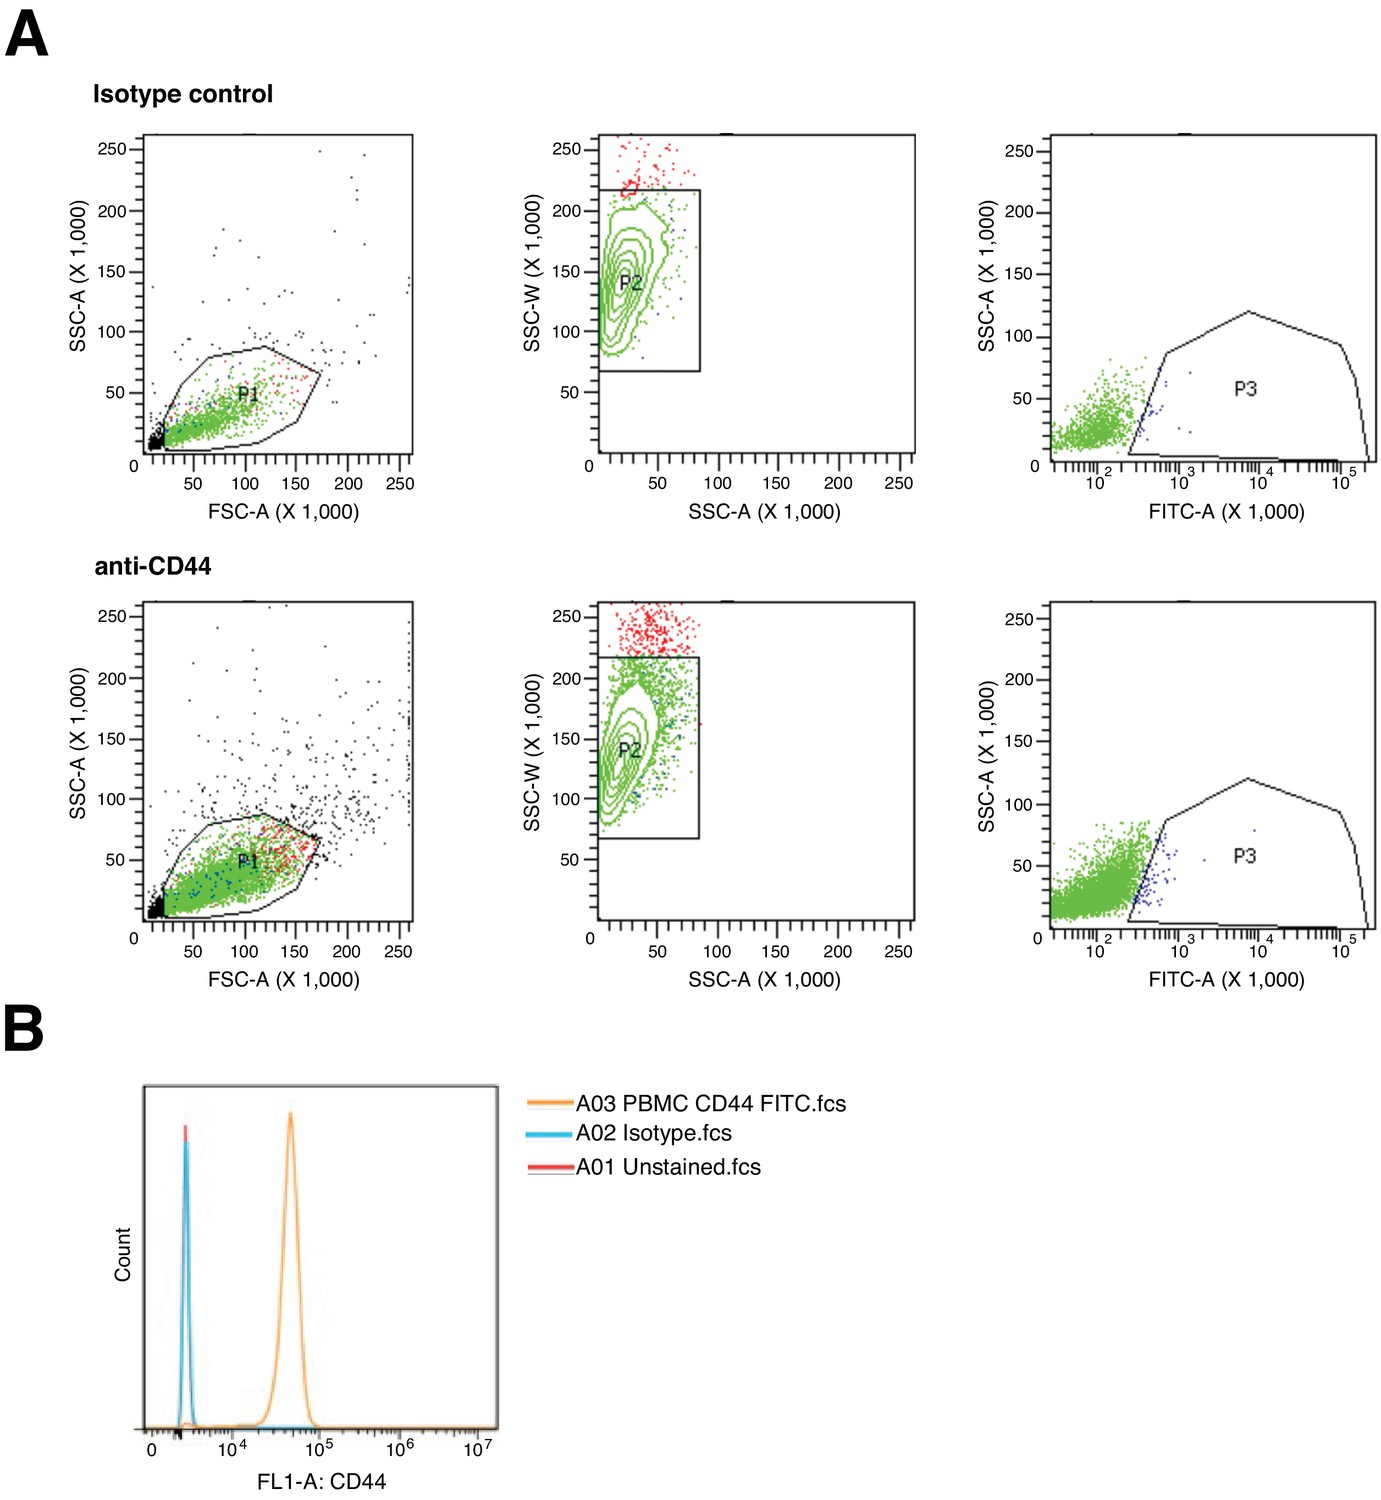
Flow cytometry gating strategy and controls.
(A) Representative density plots of gating strategy to identify CD44+ and CD44- populations from LAPC4 cells purified from xenograft tumors. Purified LAPC4 cells were stained with FITC conjugated anti-CD44, or isotype control, antibodies. Forward versus side scatter (FSC vs SSC) was used to identify cells of interest and exclude debris (P1), which were then analyzed by SSC and side scatter width (SSC-W) to exclude doublet cells (P2). From the single cell population, SSC vs FITC was used to gate on the CD44+ population (P3) with the remaining population constituting CD44- cells. (B) Single parameter histogram for CD44 using human peripheral blood mononuclear cells (PBMC) previously gated on single cell population. PMBCs were left unstained or stained with FITC conjugated anti-CD44, or isotype control, antibodies. Additional details for this experiment can be found at https://osf.io/tkn6c/.
Figure 2 with 1 supplement
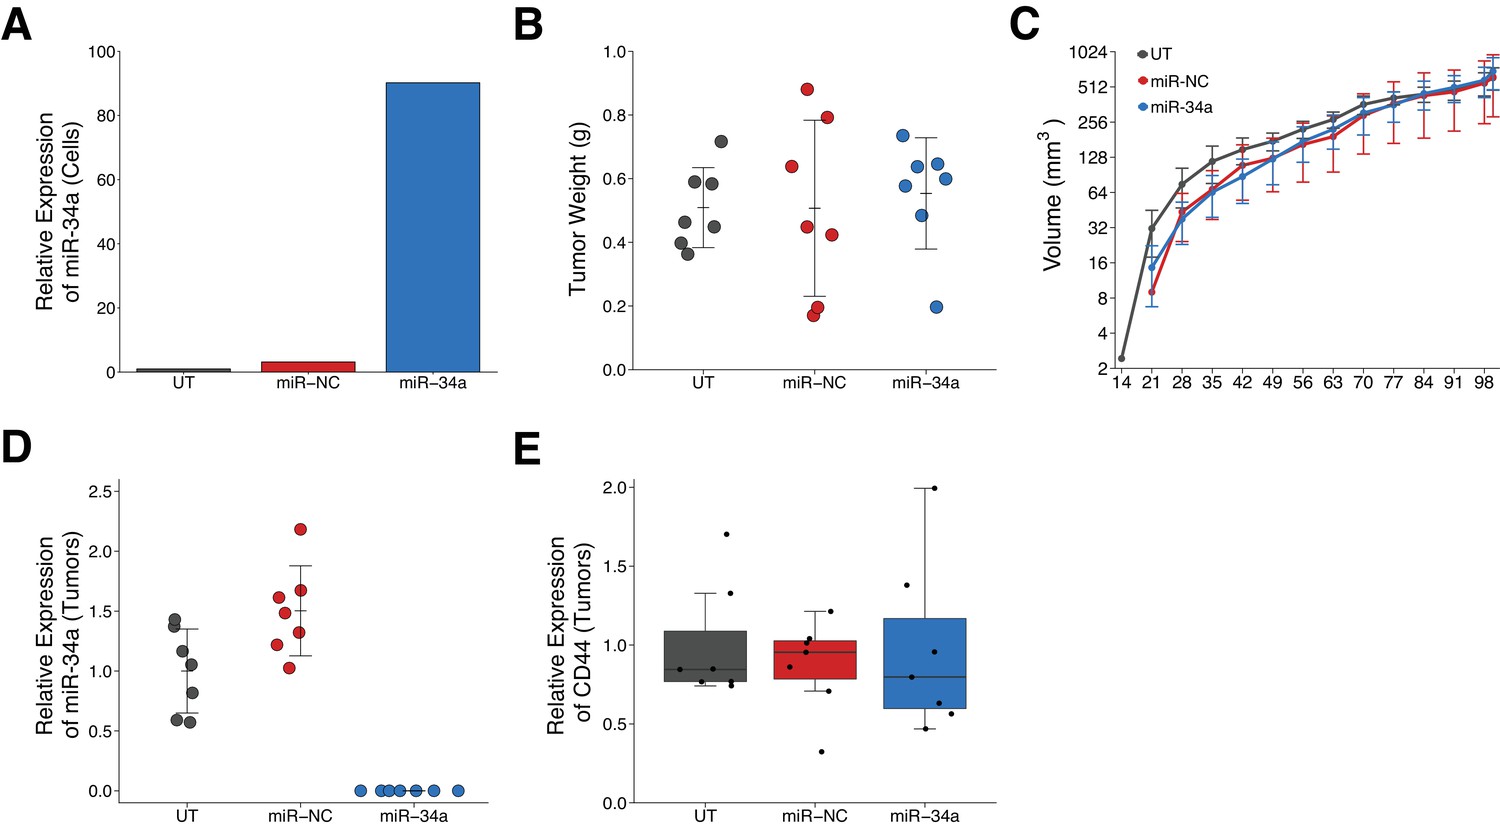
Effect of miR-34a expression on tumor growth and CD44 expression in LAPC4 tumors.
Purified LAPC4 cells were transduced to express miR-34a before injection into male NOD/SCID mice. (A) Relative expression levels of miR-34a (normalized to miR-103) was determined by qRT-PCR for LAPC4 cells left untransduced (UT), or transduced with lentivirus encoding scramble negative control (miR-NC) or pre-miR-34 (miR-34a). For each condition, expression level was made relative to UT which were assigned a value of 1. Means reported from one biological repeat. (B) At the end of the experiment (100 days post injection), primary tumors were excised and weighed. Dot plot with means reported as crossbars and error bars represent SD. Number of primary tumors per group (n = 7). One-way ANOVA on all three groups: F(2,18) = 0.119, p=0.888. Planned contrast between miR-34a and miR-NC: Fisher’s LSD test, t(18) = 0.432, p=0.671. Planned contrast between miR-34a and UT: Fisher’s LSD test, t(18) = 0.414, p=0.684. (C) Following primary tumor detection, caliper measurements were taken three times a week and used to calculate tumor volume. Line graph of tumor volume (y-axis is natural log scale) with means reported and error bars representing SD. Number of mice monitored per group (n = 7). One-way ANOVA on area under the curve (natural log-transformed) for all three groups: F(2,18) = 0.916, p=0.418. Planned contrast between miR-34a and miR-NC: Fisher’s LSD test, t(18) = 0.680, p=0.505, Cohen’s d = −0.36, 95% CI [−1.41, 0.70]. Planned contrast between miR-34a and UT: Fisher’s LSD test, t(18) = 0.673, p=0.509, Cohen’s d = 0.36, 95% CI [−0.70, 1.41]. (D) Relative expression levels of miR-34a (normalized to miR-103) was determined by qRT-PCR from excised tumors. For each condition, expression level was made relative to UT. Dot plot with means reported as crossbars and error bars represent SD. Of note, no signal was detected in any of the tumors derived from miR-34a transduced LAPC4 cells. (E) Relative expression levels of CD44 (normalized to ß-actin) was determined by Western blot from excised tumors. For each condition, expression level are presented relative to UT. Box and whisker plot with median represented as the line through the box and whiskers representing values within 1.5 IQR of the first and third quartile. Individual data points represented as dots. Additional details for this experiment can be found at https://osf.io/n9vrz/.
Figure 2—figure supplement 1
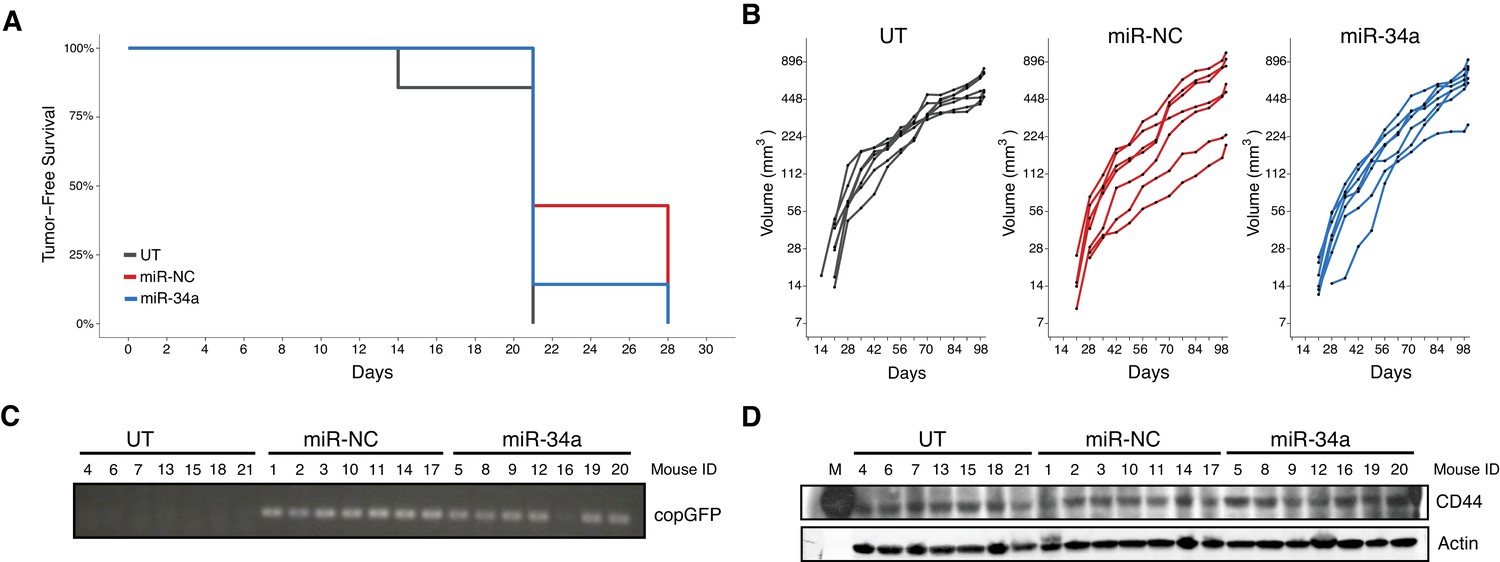
Latency and individual tumor xenografts.
This is the same experiment as in Figure 2. (A) Kaplan-Meier plot of tumor-free survival (days post injection). Number of mice monitored per group (n = 7). Median tumor-free survival: miR-34a = 21 days, miR-NC = 21 days, UT = 21 days. Exploratory survival analysis (Cox proportional hazards regression model): miR-34a vs miR-NC: HR = 1.64 [0.56, 4.80], p=0.363; miR-34a vs UT: HR = 0.61 [0.20, 1.82], p=0.372. (B) Line graphs (y-axis is natural log scale) of primary tumor volume plotted for each animal rather than averages. (C) RT-PCR results to detect the copGFP marker in individual mouse tumors. (D) Western blots using anti-CD44 and anti-ß-actin antibodies for individual mouse tumors. M = molecular wt marker. Additional details for this experiment can be found at https://osf.io/n9vrz/.
Figure 3
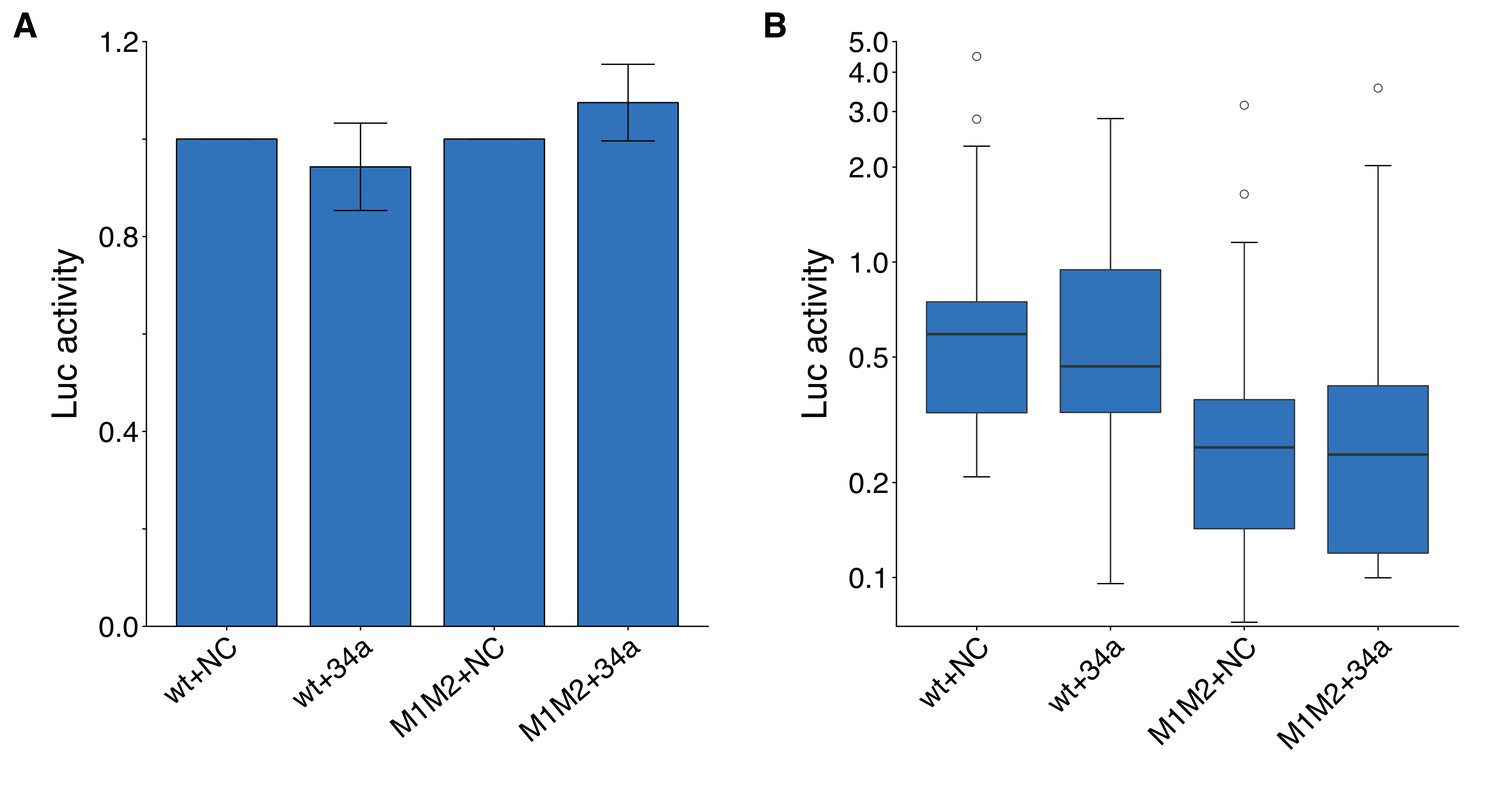
Luciferase assays to assess putative miR-34a binding sites in the 3’UTR of CD44.
DU145 cells were transfected with either a luciferase reporter with a fragment of the 3’UTR of CD44 with both putative miR-34a binding sites left intact (wt) or mutated (M1M2). Cells were also co-transfected with miR-34a oligos (34a) or control oligos (NC). (A) Luciferase (Luc) activity was normalized to the NC condition for both luciferase reporters for each biological repeat such that NC conditions were assigned a value of 1. Means reported and error bars represent s.e.m. from 16 independent biological repeats. Wilcoxon-Mann-Whitney test comparing Luc values from wt +34 a vs M1M2 + 34 a; U = 104, uncorrected p=0.381, Bonferroni adjusted significance threshold = 0.0167; (Bonferroni corrected p>0.99). One-sample Wilcoxon signed-rank test comparing Luc values from wt +34 a to a constant of 1 (wt +NC); z = 0.517, uncorrected p=0.632; (Bonferroni corrected p>0.99). One-sample Wilcoxon signed-rank comparing Luc values from M1M2 + 34 a to a constant of 1 (M1M2 + NC); z = 0.310, uncorrected p=0.782; (Bonferroni corrected p>0.99). (B) This is the same data as in part (A), but Luc activity was not normalized. Luc values are presented relative to wt +NC. Box and whisker plot (y-axis is log10 scale) with median represented as the line through the box and whiskers representing values within 1.5 IQR of the first and third quartile. Kruskal-Wallis test on all four groups: H(3) = 11.1, p=0.011. Wilcoxon-Mann-Whitney comparison between luciferase reporter (wt or M1M2): U = 266, uncorrected p=7.67×10⁻⁴, Bonferroni corrected p=1.53×10⁻³, Cliff’s d = 0.48, 95% CI [0.19, 0.69]. Wilcoxon-Mann-Whitney comparison between oligo (NC or 34a): U = 497, uncorrected p=0.847, Bonferroni corrected p>0.99, Cliff’s d = 0.03, 95% CI [−0.25, 0.30]. Wilcoxon-Mann-Whitney comparison between wt +NC and wt +M1M2: U = 119, uncorrected p=0.752, Bonferroni corrected p>0.99, Cliff’s d = 0.07, 95% CI [−0.32, 0.44]. Additional details for this experiment can be found at https://osf.io/vzb82/.
Figure 4
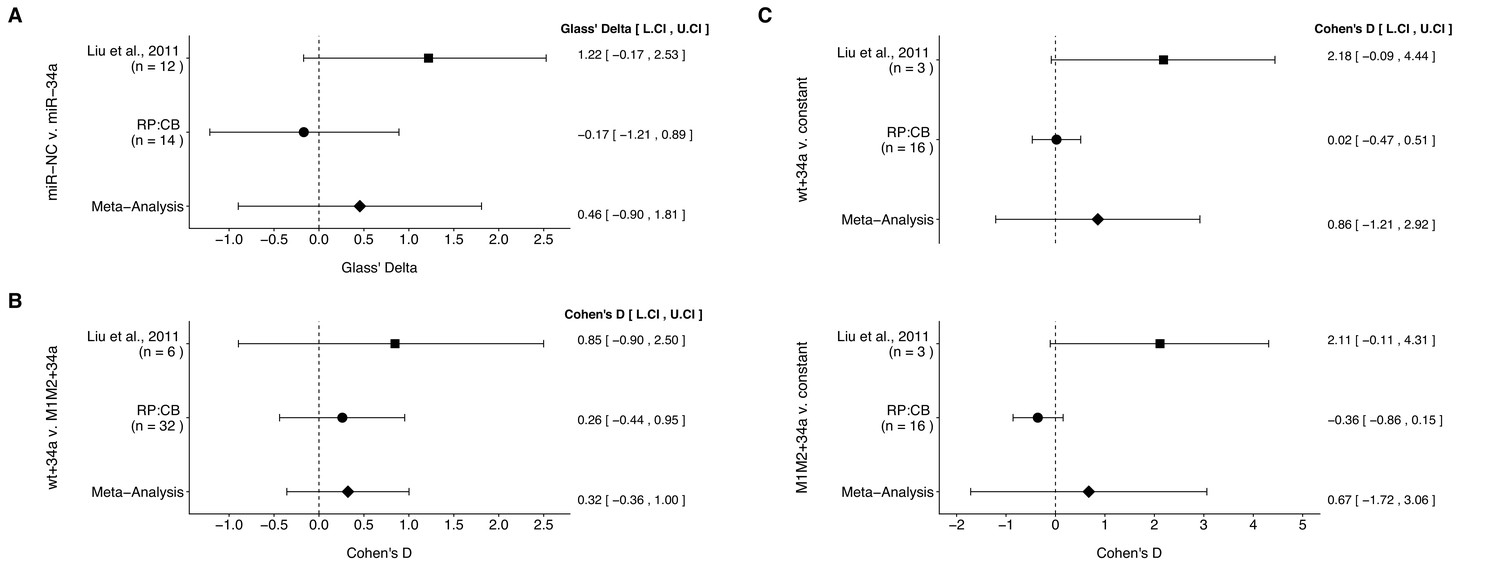
Meta-analyses of each effect.
Effect size and 95% confidence interval are presented for Liu et al. (2011), this replication study (RP:CB), and a random effects meta-analysis of those two effects. Cohen’s d and Glass’ delta are standardized differences between the two indicated measurements with the calculated effects for the original study effects reported as positive values. Sample sizes used in Liu et al. (2011) and RP:CB are reported under the study name. (A) Tumor weights from LAPC4 cells transduced to express miR-34a or negative control (meta-analysis p=0.510). (B) Luciferase values from cells transfected with miR-34a and wild-type luciferase reporter (wt) compared to cells transfected with miR-34a and double mutant luciferase reporter (M1M2) (meta-analysis p=0.353). (C) Luciferase values from cells transfected with miR-34a and wt compared to a constant of 1 (miR-NC and wt) (meta-analysis p=0.416), and luciferase values from cells transfected with miR-34a and M1M2 compared to a constant of 1 (miR-NC and M1M2) (meta-analysis p=0.581). Additional details for these meta-analyses can be found at https://osf.io/p9xn8/.
Tables
Table 1
STR profiles.
LAPC4 cells provided by authors of the original study (Liu et al., 2011) and authors who originally isolated the LAPC4 cell line (Klein et al., 1997) underwent STR analysis for the indicated markers. The STR profiles for LAPC4 cells from databases are also provided for comparison (ATCC; van Bokhoven et al., 2003; DSMZ).
| Marker | Liu | Klein | ATCC | Van bokhoven | DSMZ |
|---|---|---|---|---|---|
| Amelogenin | X | X,Y | X,Y | X,Y | X,Y |
| CSF1PO | 11,12 | 12,13 | 12,13 | 12,13 | 12,13 |
| D13S317 | 10,12 | 10,11,12 | 9,10,11,12 | 10,12 | 9,10,11,12 |
| D16S539 | 9 | 9 | 9 | 9 | 9 |
| D5S818 | 11,13 | 11,13 | 12 | 11,13 | 12 |
| D7S820 | 10.3,11 | 11,12 | 10,10.3,11 | 11 | 10,10.3,11 |
| TH01 | 6,9.3 | 6,9.3 | 6,9.3 | 6,9.3 | 6,9.3 |
| TPOX | 8 | 8,9 | 8 | 8 | 8 |
| vWA | 16 | 16,17,18 | 15,16 | 16 | 15,16 |
| D18S51 | 14,21,22 | 15,21,22 | 14,15,22 | 14,15,22 | |
| D21S11 | 28,30 | 28,29,30,31 | 28,30 | 28,30 | |
| D3S1358 | 15,16,17 | 15,17,18 | 15,17 | 15,17 | |
| D8S1179 | 13 | 13,14 | 13 | 13 | |
| FGA | 21,22,23,24 | 21,22 | 21,22 | 21,22 | |
| D19S433 | 13,14,16 | 12,14,15 | |||
| D2S1338 | 17,18,19 | 17,18,19 | |||
| Penta D | 10 | 9 | |||
| Penta E | 12,13 | 12,13 | |||
| D12S391 | 20 | ||||
| D6S1043 | 12,13 |
Key resources table
| Reagent type (species) or resource | Designation | Source or reference | Identifiers | Additional information |
|---|---|---|---|---|
| Strain, strain background (Mus musculus, NOD/SCID, male) | NOD/SCID | Vital River | Strain code: 406; RRID:IMSR_CRL:394 | |
| Cell line (Homo sapiens, male) | LAPC4 | doi:10.1038/nm0497-402 | RRID:CVCL_4744 | shared by Dr. Dean G Tang, MD Anderson Cancer Center and Dr. Charles L Sawyers, Memorial Sloan Kettering Cancer Center |
| Cell line (H. sapiens, male) | DU145 | ATCC | cat#:HTB-81; RRID:CVCL_0105 | |
| Cell line (H. sapiens, male) | HT-1080 | ATCC | cat#:CCL-121; RRID:CVCL_0317 | |
| Cell line (H. sapiens) | HEK293T | ATCC | cat#:CRL-3216; RRID:CVCL_0063 | |
| Chemical compound, drug | testosterone propionate | Aladdin | CAS:57-85-2 | lot# L1401028 |
| Other | Matrigel | BD Biosciences | cat#:354248 | |
| Antibody | FITC-conjugated monoclonal anti-CD44 | BD Biosciences | cat#:555478; clone:G44-26; RRID:AB_395870 | 1:13 dilution |
| Antibody | FITC-conjugated monoclonal mouse IgG2b,κ isotype control | BD Biosciences | cat#:555742; clone:27–35; RRID:AB_396085 | 1:13 dilution |
| Antibody | rabbit anti-CD44 | AbCam | cat#:ab51037; clone:EPR1013Y; RRID:AB_868936 | 1:1000 dilution |
| Antibody | mouse anti-ß-actin | Cell Signaling Technology | cat#:3700; clone:8H10D10; RRID:AB_2242334 | 1:1000 dilution |
| Antibody | HRP-conjugated goat anti-rabbit | Cell Signaling Technology | cat#:7074; RRID:AB_2099233 | 1:2000 dilution |
| Antibody | HRP-conjugated horse anti-mouse | Cell Signaling Technology | cat#:7076; RRID:AB_330924 | 1:5000 dilution |
| Commercial assay, kit | MACS Lineage Cell Depletion Kit | Miltenyi Biotech | cat#:130-090-858 | |
| Recombinant DNA reagent | psPAX2 | Crown Biosciences, Inc | RRID:Addgene_12260 | |
| Recombinant DNA reagent | pMD2.G | Crown Biosciences, Inc | RRID:Addgene_12259 | |
| Recombinant DNA reagent | pMDLg/pRRE | Wuhan Miaoling Bioscience and Technology Co. | cat# P0685; RRID:Addgene_12251 | |
| Recombinant DNA reagent | pre-mir-34a | System Biosciences | cat# PMIRH34aPA-1 | |
| Recombinant DNA reagent | scramble non-targeting pre-miRNA | System Biosciences | cat# PMIRH000PA-1 | |
| Recombinant DNA reagent | pMIR-CD44-3'UTR | doi:10.1038/nm.2284 | shared by Dr. Dean G Tang, MD Anderson Cancer Center | |
| Recombinant DNA reagent | pMIR-CD44-M1M2-3'UTR | doi:10.1038/nm.2284 | shared by Dr. Dean G Tang, MD Anderson Cancer Center | |
| Recombinant DNA reagent | phRL-CMV | doi:10.1038/nm.2284 | shared by Dr. Dean G Tang, MD Anderson Cancer Center | |
| Sequence-based reagent | copGFP | doi:10.1111/j.1745-7270.2008.00448.x | Forward: 5'-AGGACAGCGTGATCTTCACC-3'; Reverse: 5'-CTTGAAGTGCATGTGGCTGT-3' | |
| Sequence-based reagent | miR-34a miRNA TaqMan assay kit | Applied Biosystems | assayID:000426 | |
| Sequence-based reagent | has-let-7b miRNA TaqMan assay kit | Applied Biosystems | assayID:000378 | |
| Sequence-based reagent | miR-103 miRNA TaqMan assay kit | Applied Biosystems | assayID:000439 | |
| Sequence-based reagent | has-miR-34a-5p | Thermo Fisher Scientific | assayID:MC11030 | |
| Sequence-based reagent | negative control #1 | Thermo Fisher Scientific | cat#:4464058 | |
| Software, algorithm | GeneMapper | Applied Biosystems | RRID:SCR_014290 | version 4.0 |
| Software, algorithm | Studylog Systems | Studylog | RRID:SCR_016682 | version 3.1.399.19 |
| Software, algorithm | FACSDiva | BD Biosciences | RRID:SCR_001456 | version 6.1.3 |
| Software, algorithm | MxPro QPCR | Stratagene | RRID:SCR_016375 | version 4.1 |
| Software, algorithm | ImageJ | doi:10.1038/nmeth.2089 | RRID:SCR_003070 | version 1.50a |
| Software, algorithm | EnVision | Perkin Elmer | RRID:SCR_016681 | version 1.12 |
| Software, algorithm | R Project for statistical computing | https://www.r-project.org | RRID:SCR_001905 | version 3.5.1 |
Additional files
-
Transparent reporting form
- https://doi.org/10.7554/eLife.43511.009
-
Reporting standard 1
The ARRIVE guidelines checklist.
- https://doi.org/10.7554/eLife.43511.010
Download links
A two-part list of links to download the article, or parts of the article, in various formats.
Downloads (link to download the article as PDF)
Open citations (links to open the citations from this article in various online reference manager services)
Cite this article (links to download the citations from this article in formats compatible with various reference manager tools)
Replication Study: The microRNA miR-34a inhibits prostate cancer stem cells and metastasis by directly repressing CD44
eLife 8:e43511.
https://doi.org/10.7554/eLife.43511


