Replication Study: A coding-independent function of gene and pseudogene mRNAs regulates tumour biology
- University of Maryland, United States
- Alamo Laboratories Inc, United States
- Science Exchange, United States
- Center for Open Science, United States
Figures
Figure 1 with 1 supplement
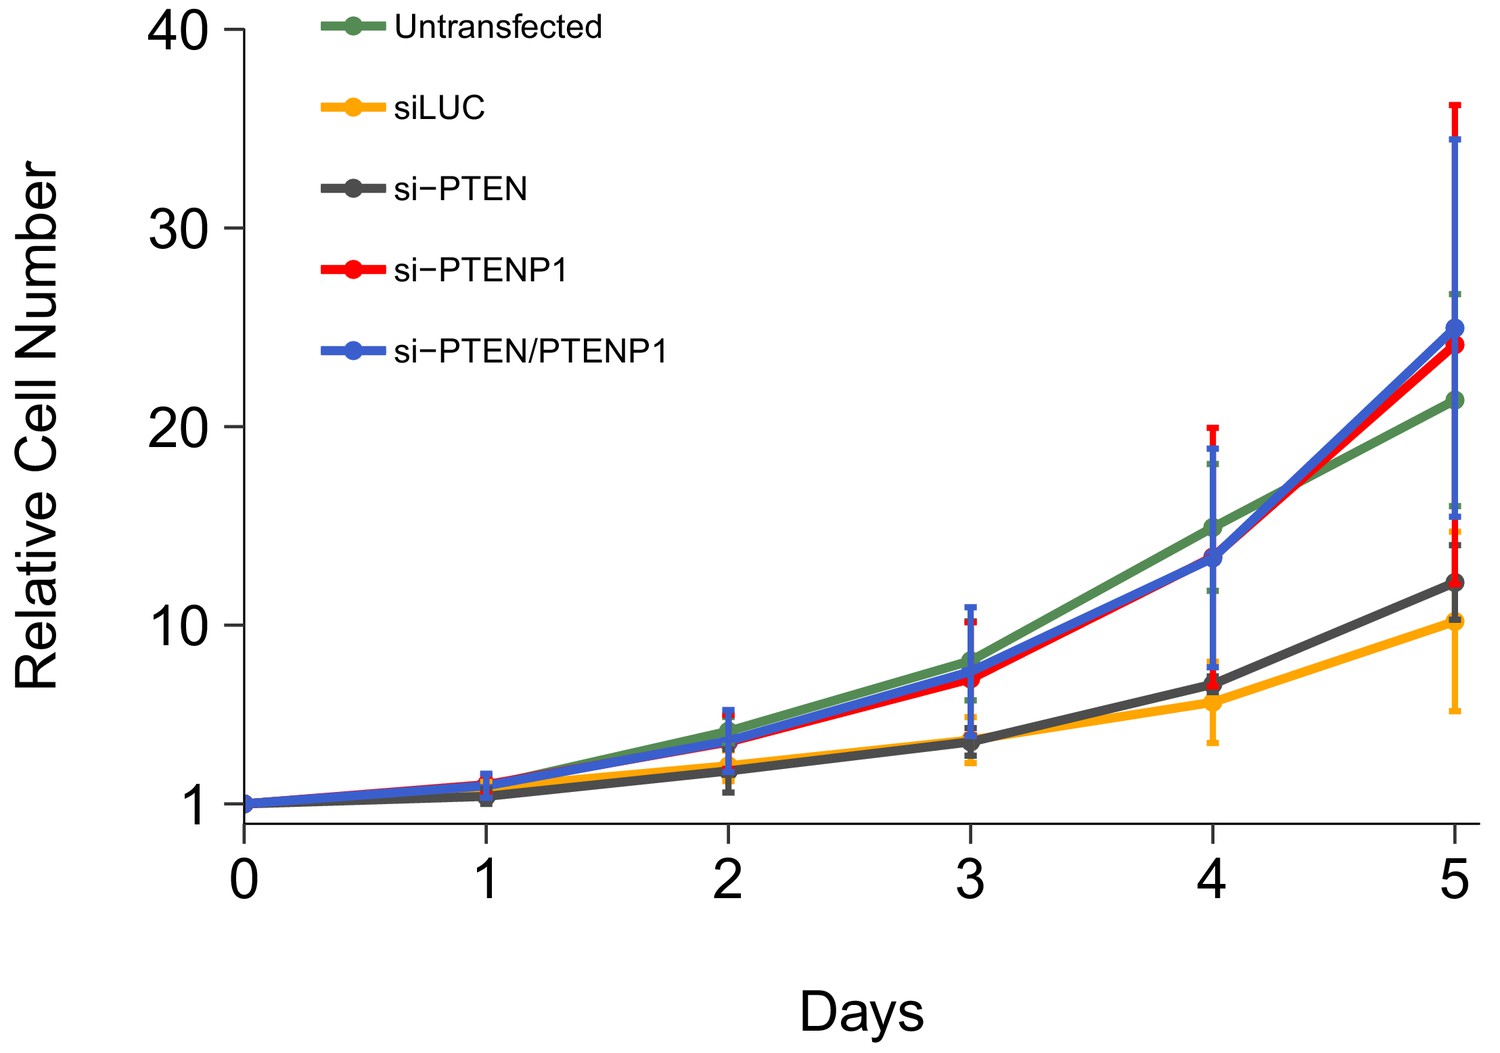
Cell growth of DU145 cells depleted of PTEN and/or PTENP1.
DU145 cells were transfected with either a non-targeting siRNA (siLUC), si-PTEN, si-PTENP1, or an siRNA pool targeting PTEN and PTENP1 (si-PTEN/PTENP1), or not transfected. Crystal violet proliferation assays were performed each day as indicated starting the day after transfection. Relative cell number was calculated relative to the average Day 0 values for each condition. Means reported and error bars represent SD from five independent biological repeats. Two-way ANOVA interaction between PTEN (targeted or not-targeted) and PTENP1 (targeted or not-targeted) on Day 5 relative cell numbers: F(1,16) = 0.02, p=0.878; main effect of PTEN: F(1,16) = 0.15, p=0.703; main effect of PTENP1: F(1,16) = 13.8, p=0.0019. Planned contrasts between siLUC and si-PTEN: t(16) = 0.38, uncorrected p=0.705 with a priori Bonferroni adjusted significance threshold of 0.01, Bonferroni corrected p>0.99; siLUC and si-PTENP1: t(16) = 2.73, uncorrected p=0.015, Bonferroni corrected p=0.074; siLUC and si-PTEN/PTENP1: t(16) = 2.90, uncorrected p=0.011, Bonferroni corrected p=0.053; si-PTEN/PTENP1 and si-PTEN: t(16) = 2.51, uncorrected p=0.023, Bonferroni corrected p=0.115; si-PTEN/PTENP1 and si-PTENP1: t(16) = 0.16, uncorrected p=0.872, Bonferroni corrected p>0.99. Additional details for this experiment can be found at https://osf.io/kjmxj/.
Figure 1—figure supplement 1
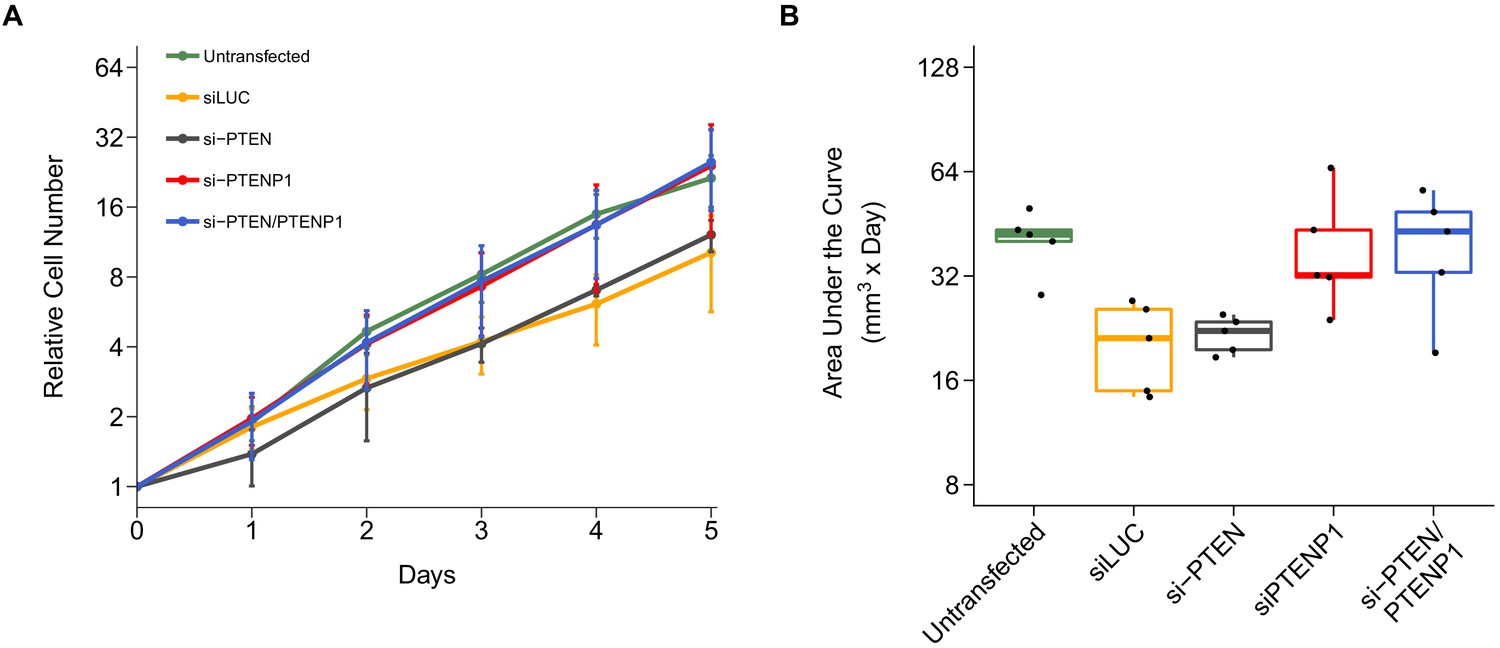
Alternative visualization of cell growth.
This is the same experiment as Figure 1. (A) Relative cell numbers were natural log transformed with means reported and error bars represent SD. (B) The area under the curve (AUC) was calculated for each condition of each biological repeat (n = 5). Box and whisker plot with median represented as the line through the box, individual AUC values represented as dots, and whiskers representing values within 1.5 IQR of the first and third quartile (y-axis is natural log scale). Two-way ANOVA interaction between PTEN (targeted or not-targeted) and PTENP1 (targeted or not-targeted) on AUC values: F(1,16) = 0.0015, p=0.970; main effect of PTEN: F(1,16) = 0.033, p=0.858; main effect of PTENP1: F(1,16) = 13.3, p=0.0022. Planned contrasts between siLUC and si-PTEN: t(16) = 0.16, uncorrected p=0.878 with a priori Bonferroni adjusted significance threshold of 0.01, Bonferroni corrected p>0.99; siLUC and si-PTENP1: t(16) = 2.60, uncorrected p=0.019, Bonferroni corrected p=0.115; siLUC and si-PTEN/PTENP1: t(16) = 2.71, uncorrected p=0.016, Bonferroni corrected p=0.093; si-PTEN/PTENP1 and si-PTEN: t(16) = 2.55, uncorrected p=0.021, Bonferroni corrected p=0.128; si-PTEN/PTENP1 and si-PTENP1: t(16) = 0.10, uncorrected p=0.920, Bonferroni corrected p>0.99. Additional details for this experiment can be found at https://osf.io/kjmxj/.
Figure 2 with 1 supplement

PTEN and PTENP1 abundance in DU145 cells depleted of PTEN and/or PTENP1.
DU145 cells were transfected with either a non-targeting siRNA (siLUC), si-PTEN, si-PTENP1, or an siRNA pool targeting PTEN and PTENP1 (si-PTEN/PTENP1), or not transfected. Total RNA was isolated 24 hr later and qRT-PCR analysis was performed to detect PTEN, PTENP1, and ß-ACTIN levels. (A) Fold change in PTEN expression (PTEN/ß-ACTIN) is presented for each condition relative to siLUC cells. Means reported and error bars represent SD from five independent biological repeats. Two-way ANOVA interaction between PTEN (targeted or not-targeted) and PTENP1 (targeted or not-targeted) on PTEN expression: F(1,16) = 0.41, p=0.532; main effect of PTEN: F(1,16) = 35.5, p=2.01×10⁻⁵; main effect of PTENP1: F(1,16) = 0.21, p=0.651. Planned contrasts between siLUC and si-PTEN for PTEN expression: t(16) = 4.66, uncorrected p=0.00026 with a priori Bonferroni adjusted significance threshold of 0.0083, Bonferroni corrected p=0.0016; siLUC and si-PTENP1: t(16) = 0.78, uncorrected p=0.448, Bonferroni corrected p>0.99; siLUC and si-PTEN/PTENP1: t(16) = 4.54, uncorrected p=0.00034, Bonferroni corrected p=0.0020. (B) Fold change in PTENP1 expression (PTENP1/ß-ACTIN) is presented for each condition relative to siLUC cells. Means reported and error bars represent SD from five independent biological repeats. Two-way ANOVA interaction on PTENP1 expression: F(1,16) = 2.03, p=0.174; main effect of PTEN: F(1,16) = 0.019, p=0.891; main effect of PTENP1: F(1,16) = 16.6, p=0.00088. Planned contrasts between siLUC and si-PTEN for PTENP1 expression: t(16) = 1.10, uncorrected p=0.286 with a priori Bonferroni adjusted significance threshold of 0.0083, Bonferroni corrected p>0.99; siLUC and si-PTENP1: t(16) = 3.89, uncorrected p=0.0013, Bonferroni corrected p=0.0079; siLUC and si-PTEN/PTENP1: t(16) = 2.98, uncorrected p=0.0089, Bonferroni corrected p=0.053. Additional details for this experiment can be found at https://osf.io/4uard/.
Figure 2—figure supplement 1
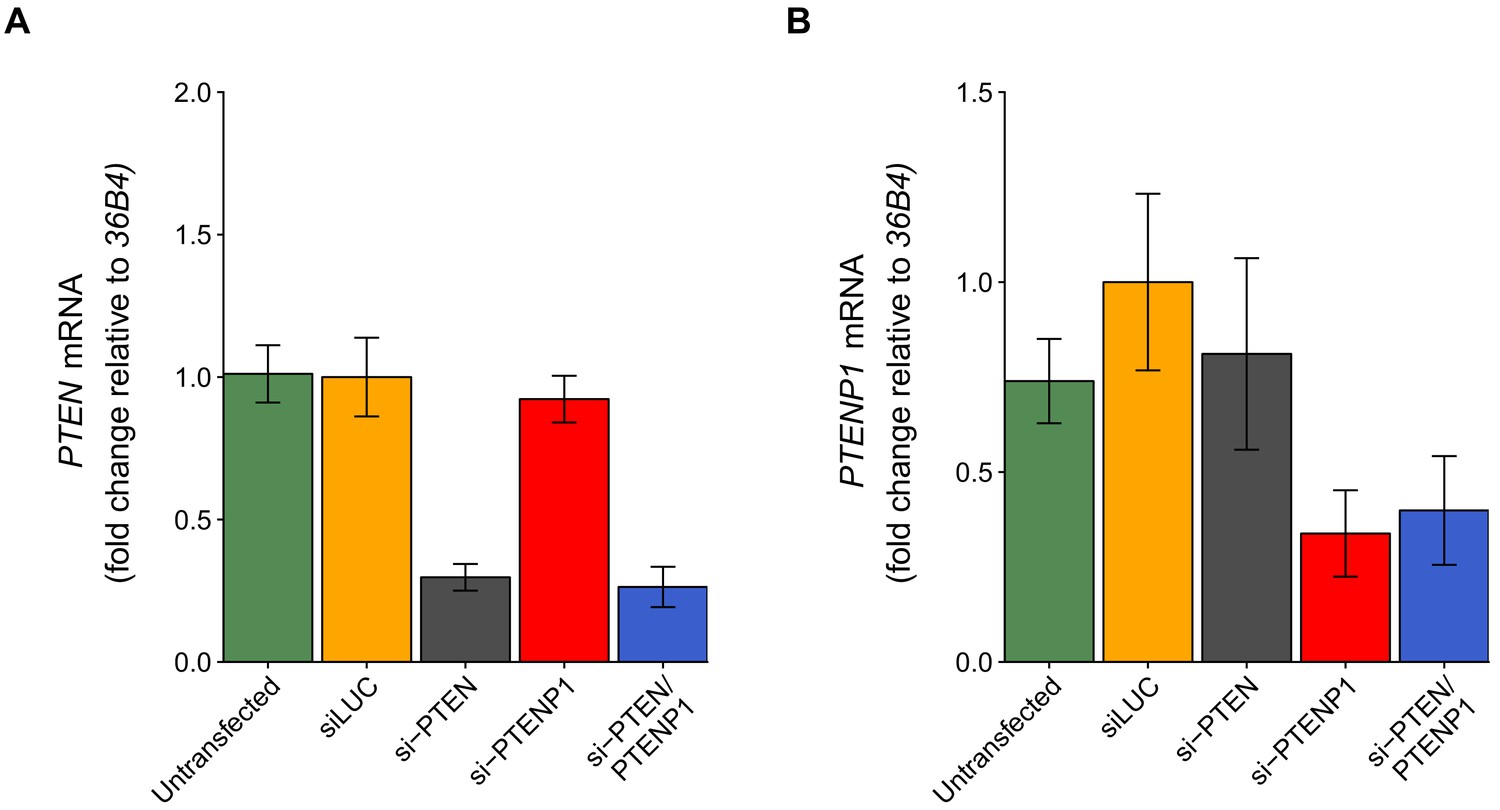
PTEN and PTENP1 abundance using 36B4 to normalize expression.
This is the same experiment as Figure 2, but with PTEN and PTENP1 expression normalized to 36B4 instead of ß-ACTIN. (A) Fold change in PTEN expression (PTEN/36B4) is presented for each condition relative to siLUC cells. Means reported and error bars represent SD from five independent biological repeats. Exploratory analysis: Two-way ANOVA interaction between PTEN (targeted or not-targeted) and PTENP1 (targeted or not-targeted) on PTEN expression: F(1,16) = 0.29, p=0.600; main effect of PTEN: F(1,16) = 280.5, p=1.45×10⁻¹¹; main effect of PTENP1: F(1,16) = 1.88, p=0.190. Planned contrasts between siLUC and si-PTEN for PTEN expression: t(16) = 12.2, uncorrected p=1.58×10⁻⁹ with a priori Bonferroni adjusted significance threshold of 0.0083, Bonferroni corrected p=9.48×10⁻⁹; siLUC and si-PTENP1: t(16) = 1.35, uncorrected p=0.197, Bonferroni corrected p>0.99; siLUC and si-PTEN/PTENP1: t(16) = 12.8, uncorrected p=7.93×10⁻¹⁰, Bonferroni corrected p=4.76×10⁻⁹. (B) Fold change in PTENP1 expression (PTENP1/36B4) is presented for each condition relative to siLUC cells. Means reported and error bars represent SD from five independent biological repeats. Exploratory analysis: Two-way ANOVA interaction on PTENP1 expression: F(1,16) = 2.07, p=0.170; main effect of PTEN: F(1,16) = 0.55, p=0.471; main effect of PTENP1: F(1,16) = 38.2, p=1.32×10⁻⁵. Planned contrasts between siLUC and si-PTEN for PTENP1 expression: t(16) = 1.54, uncorrected p=0.143 with a priori Bonferroni adjusted significance threshold of 0.0083, Bonferroni corrected p=0.860; siLUC and si-PTENP1: t(16) = 5.39, uncorrected p=6.06×10⁻⁵, Bonferroni corrected p=0.00036; siLUC and si-PTEN/PTENP1: t(16) = 4.89, uncorrected p=0.00016, Bonferroni corrected p=0.00098. Additional details for this experiment can be found at https://osf.io/4uard/.
Figure 3
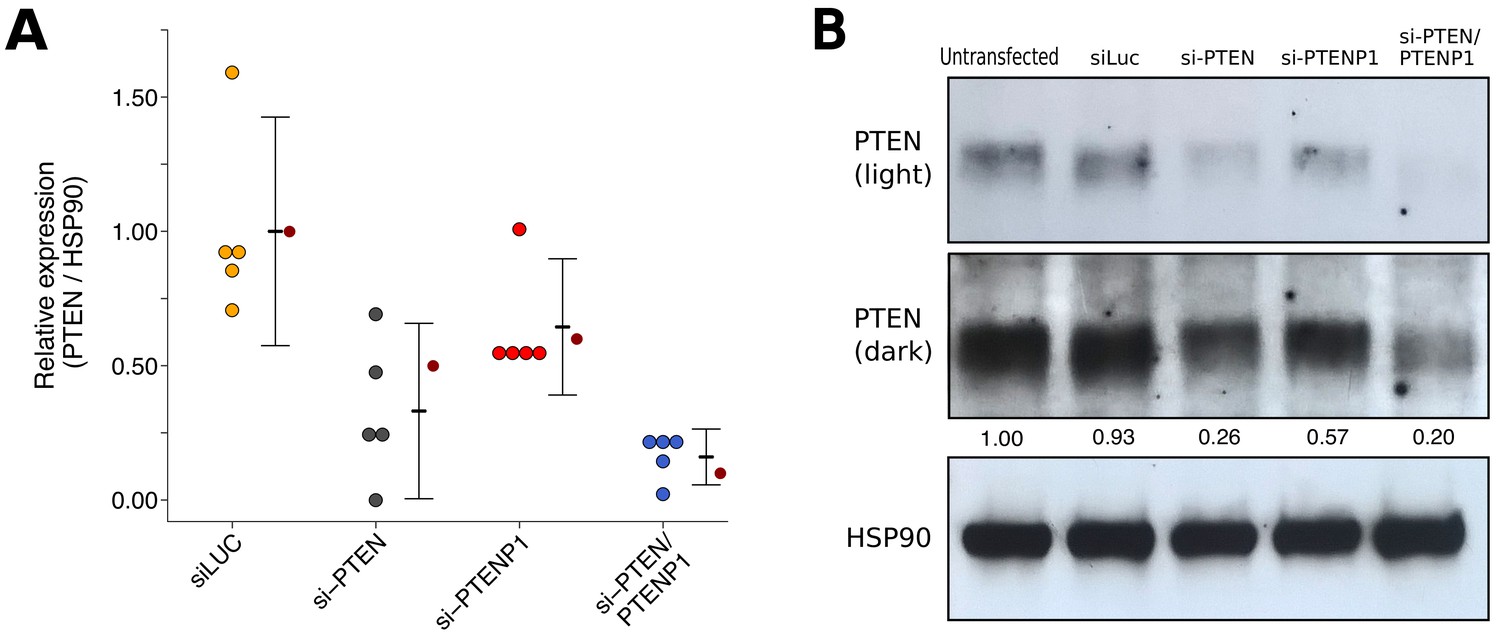
PTEN expression in DU145 cells depleted of PTEN and/or PTENP1.
DU145 cells were transfected with either a non-targeting siRNA (siLUC), si-PTEN, si-PTENP1, or an siRNA pool targeting PTEN and PTENP1 (si-PTEN/PTENP1), or not transfected. Cells were harvested 48 hr later for Western blot analysis. (A) Relative protein expression (PTEN/HSP90) are presented for each condition. Western blot bands were quantified, PTEN levels were normalized to HSP90, then for each biological repeat values were normalized to the untransfected condition with protein expression presented relative to siLuc. Dot plot of independent biological repeats (n = 5), means reported as crossbars and error bars represent 95% CI. Data reported in Figure 2H of Poliseno et al. (2010) is displayed as a single point (small dark red circle) for comparison. Planned comparisons (two-tailed Wilcoxon-Mann-Whitney tests): siLUC and si-PTEN: U = 25, uncorrected p=0.0079 with a priori Bonferroni adjusted significance threshold of 0.01, Bonferroni corrected p=0.040; siLUC and si-PTENP1: U = 21, uncorrected p=0.095, Bonferroni corrected p=0.476; siLUC and si-PTEN/PTENP1: U = 25, uncorrected p=0.0079, Bonferroni corrected p=0.040; si-PTEN/PTENP1 and si-PTEN: U = 6, uncorrected p=0.222, Bonferroni corrected p>0.99; si-PTEN/PTENP1 and si-PTENP1: U = 0, uncorrected p=0.0079, Bonferroni corrected p=0.040. (B) Representative Western blots probed with an anti-PTEN antibody (two exposures presented to facilitate detection) and anti-HSP90 antibody. Relative PTEN/HSP90 expressions are reported below PTEN images. Additional details for this experiment can be found at https://osf.io/re87y/.
Figure 4 with 1 supplement
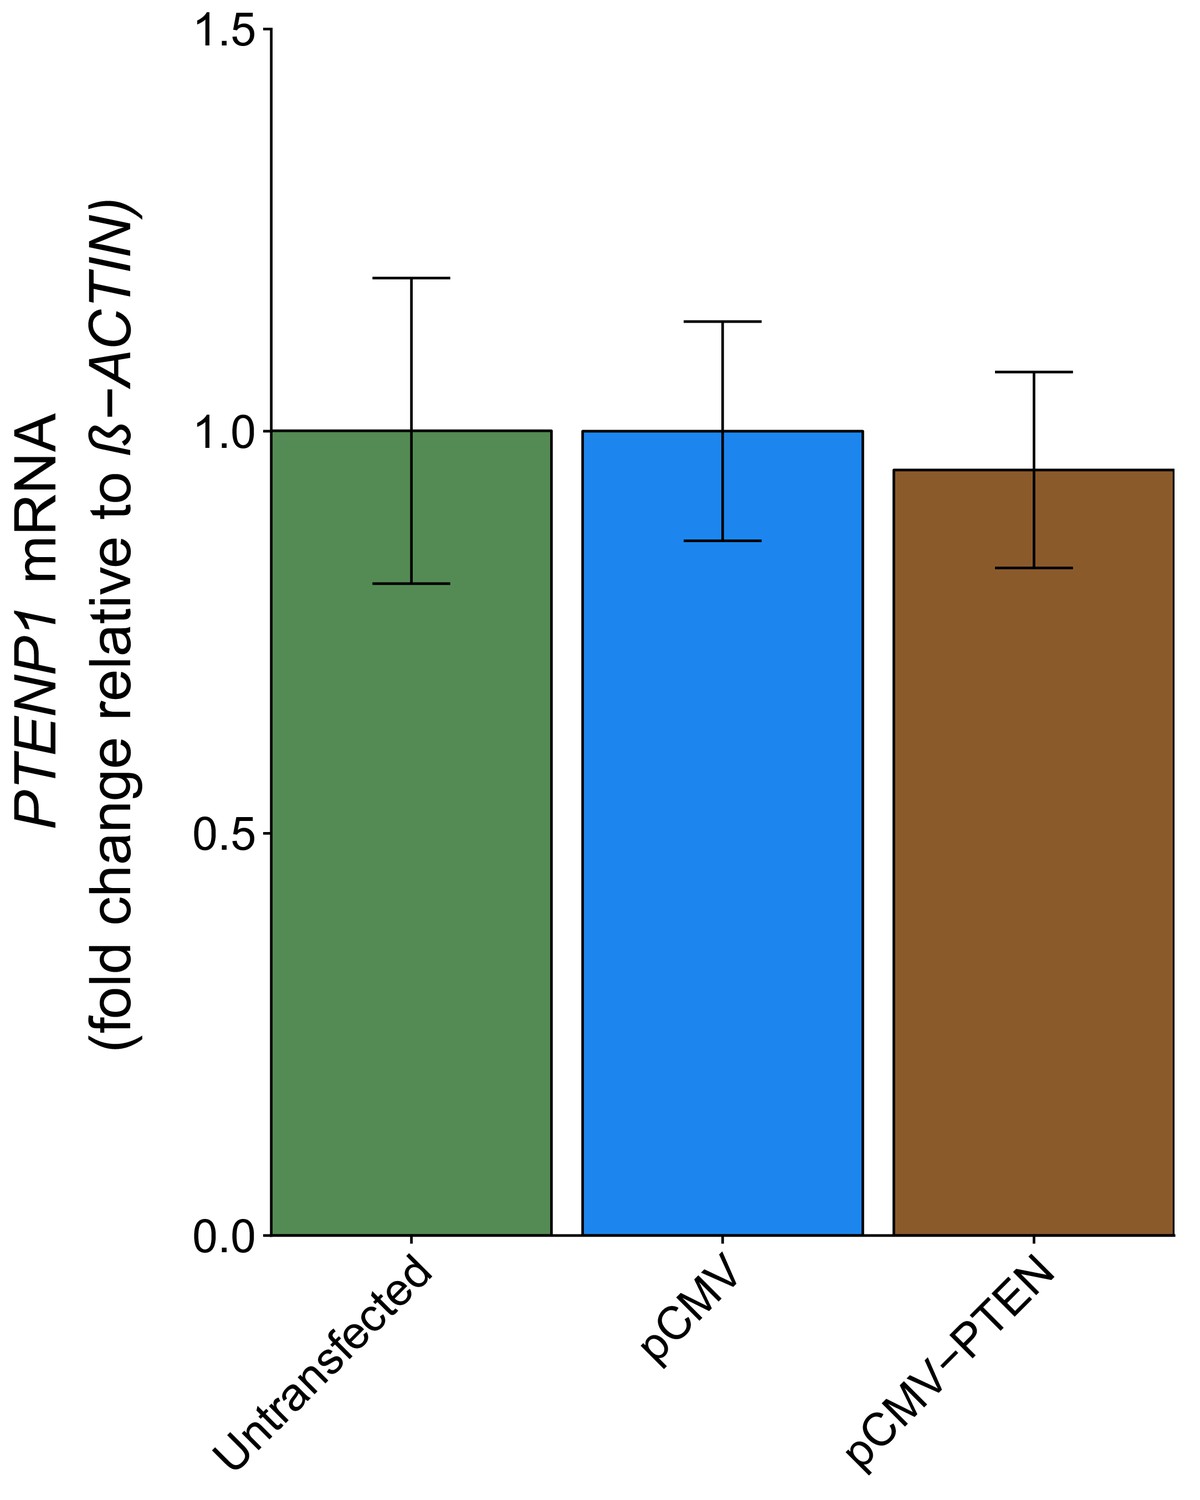
PTENP1 abundance in DU145 cells expressing PTEN 3’UTR.
DU145 cells were transfected with either a vector control plasmid (pCMV) or a plasmid to express PTEN 3’UTR (pCMV-PTEN), or not transfected. Total RNA was isolated 24 hr later and qRT-PCR analysis was performed to detect PTENP1 and ß-ACTIN levels. Fold change in PTENP1 expression (PTENP1/ß-ACTIN) is presented for each condition relative to pCMV transfected cells. Means reported and error bars represent SD from three independent biological repeats. Unpaired two-tailed Student’s t test between pCMV and pCMV-PTEN: t(4) = 0.46, p=0.671. Additional details for this experiment can be found at https://osf.io/rkuxh/.
Figure 4—figure supplement 1
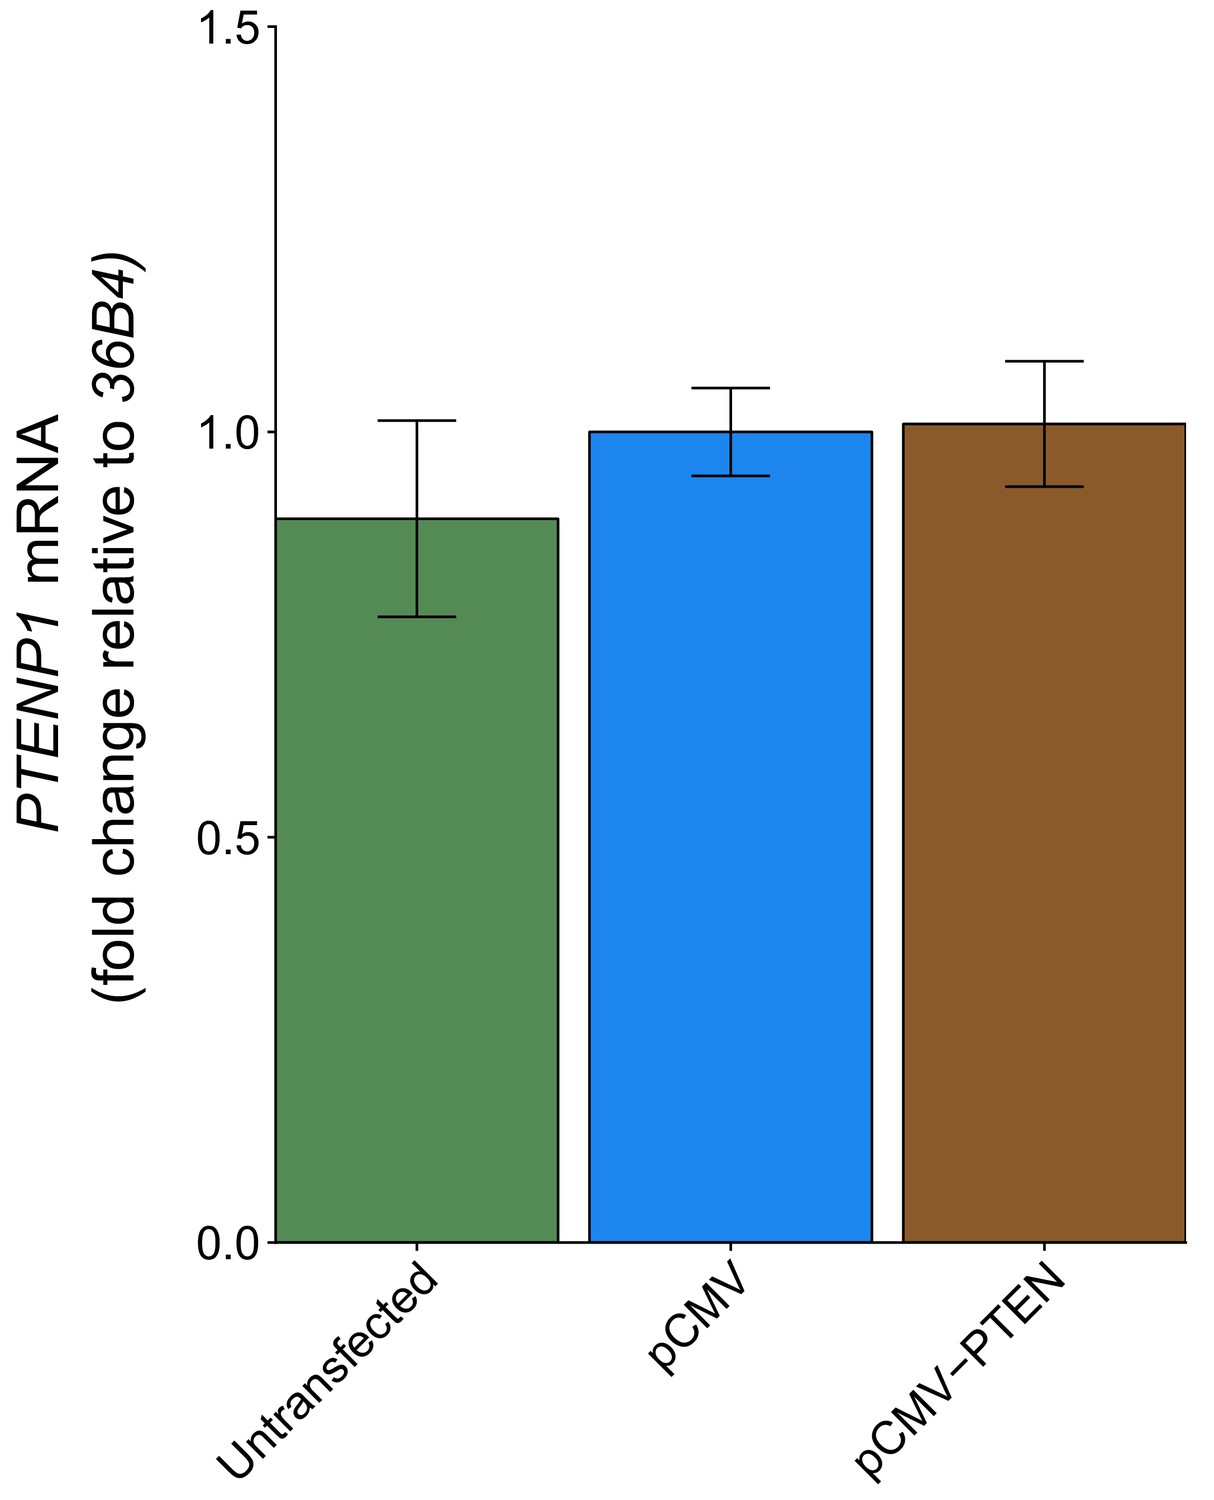
PTENP1 abundance using 36B4 to normalize expression.
This is the same experiment as Figure 4, but with PTENP1 expression normalized to 36B4 instead of ß-ACTIN. Fold change in PTENP1 expression (PTENP1/36B4) is presented for each condition relative to pCMV transfected cells. Means reported and error bars represent SD from three independent biological repeats. Exploratory analysis: Unpaired two-tailed Student’s t test between pCMV and pCMV-PTEN: t(4) = 0.18, p=0.865. Additional details for this experiment can be found at https://osf.io/rkuxh/.
Figure 5 with 1 supplement
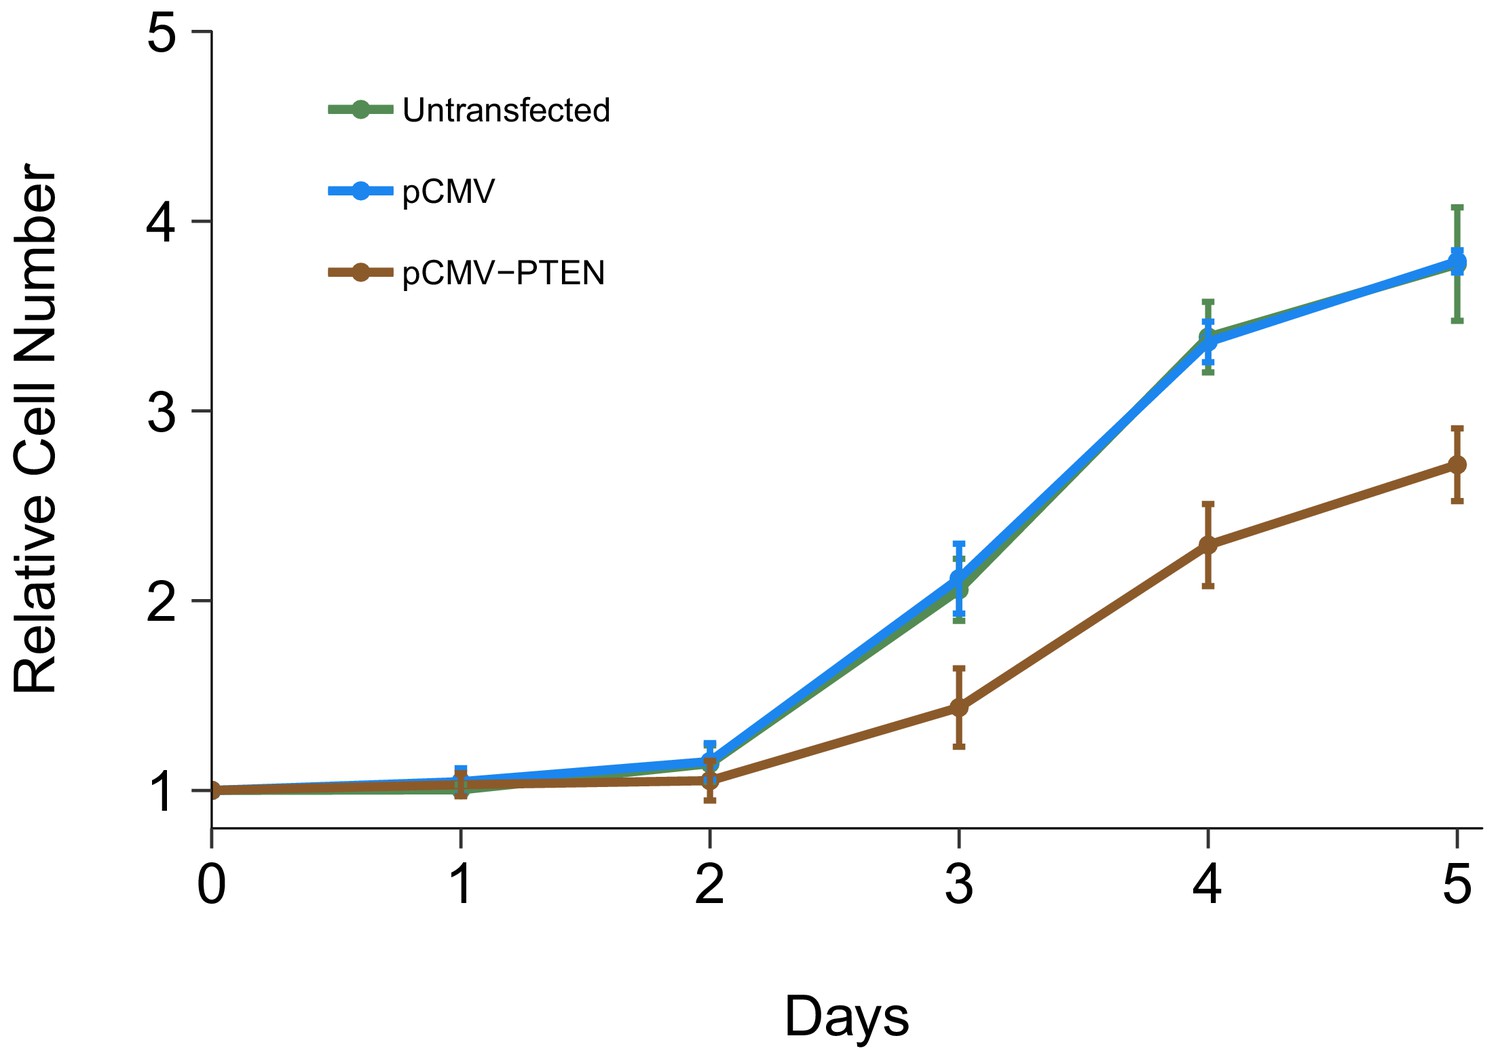
Cell growth of DU145 cells expressing PTEN 3’UTR.
DU145 cells were transfected with either vector control plasmid (pCMV) or a plasmid to express PTEN 3’UTR (pCMV-PTEN), or not transfected. Crystal violet proliferation assays were performed each day as indicated starting the day after transfection. Relative cell number was calculated relative to the average Day 0 values for each condition. Means reported and error bars represent SD from three independent biological repeats. Unpaired two-tailed Student’s t test between pCMV and pCMV-PTEN on Day five relative cell numbers: t(4) = 9.25, p=0.00076. Additional details for this experiment can be found at https://osf.io/jgp6n/.
Figure 5—figure supplement 1
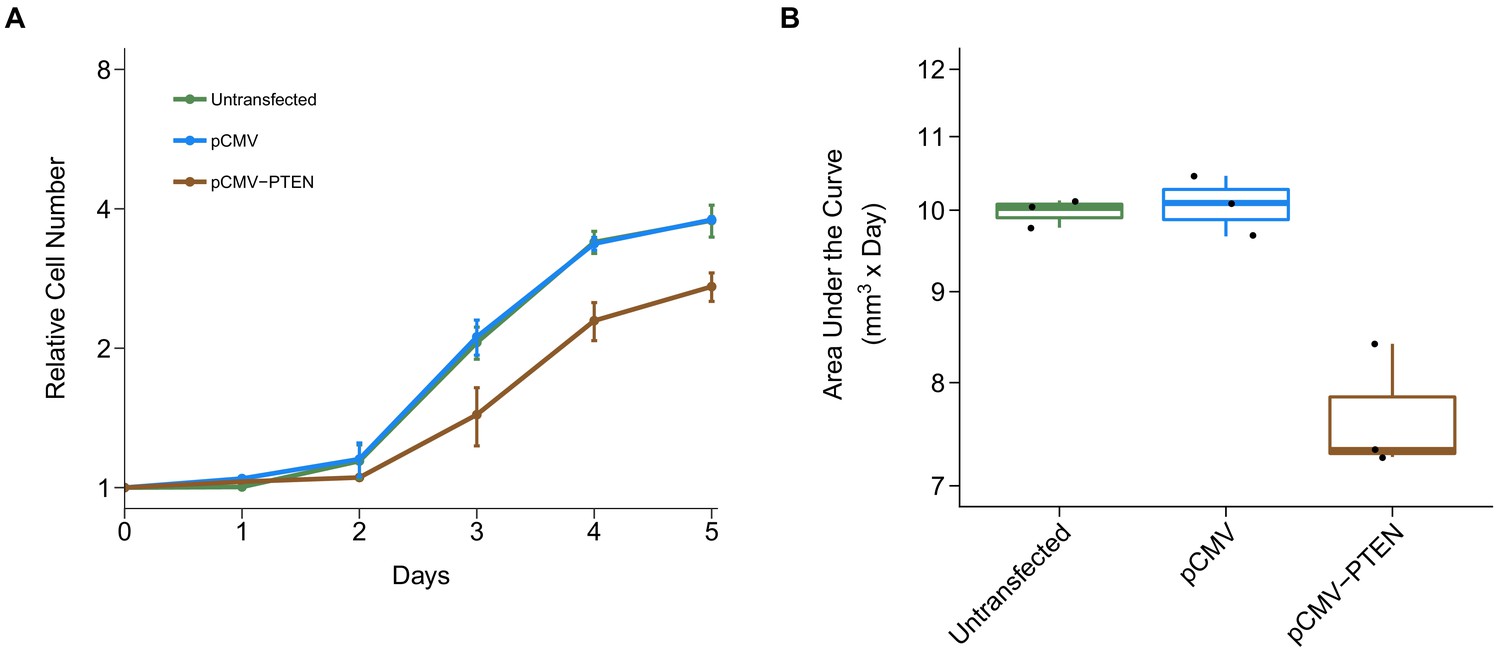
Alternative visualization of cell growth.
This is the same experiment as Figure 5. (A) Relative cell numbers were natural log transformed with means reported and error bars represent SD. (B) AUC was calculated for each condition of each biological repeat (n = 3). Box and whisker plot with median represented as the line through the box, individual AUC values represented as dots, and whiskers representing values within 1.5 IQR of the first and third quartile (y-axis is natural log scale). Unpaired two-tailed Student’s t test between pCMV and pCMV-PTEN on AUC values: t(4) = 5.52, p=0.00528. Additional details for this experiment can be found at https://osf.io/jgp6n/.
Figure 6
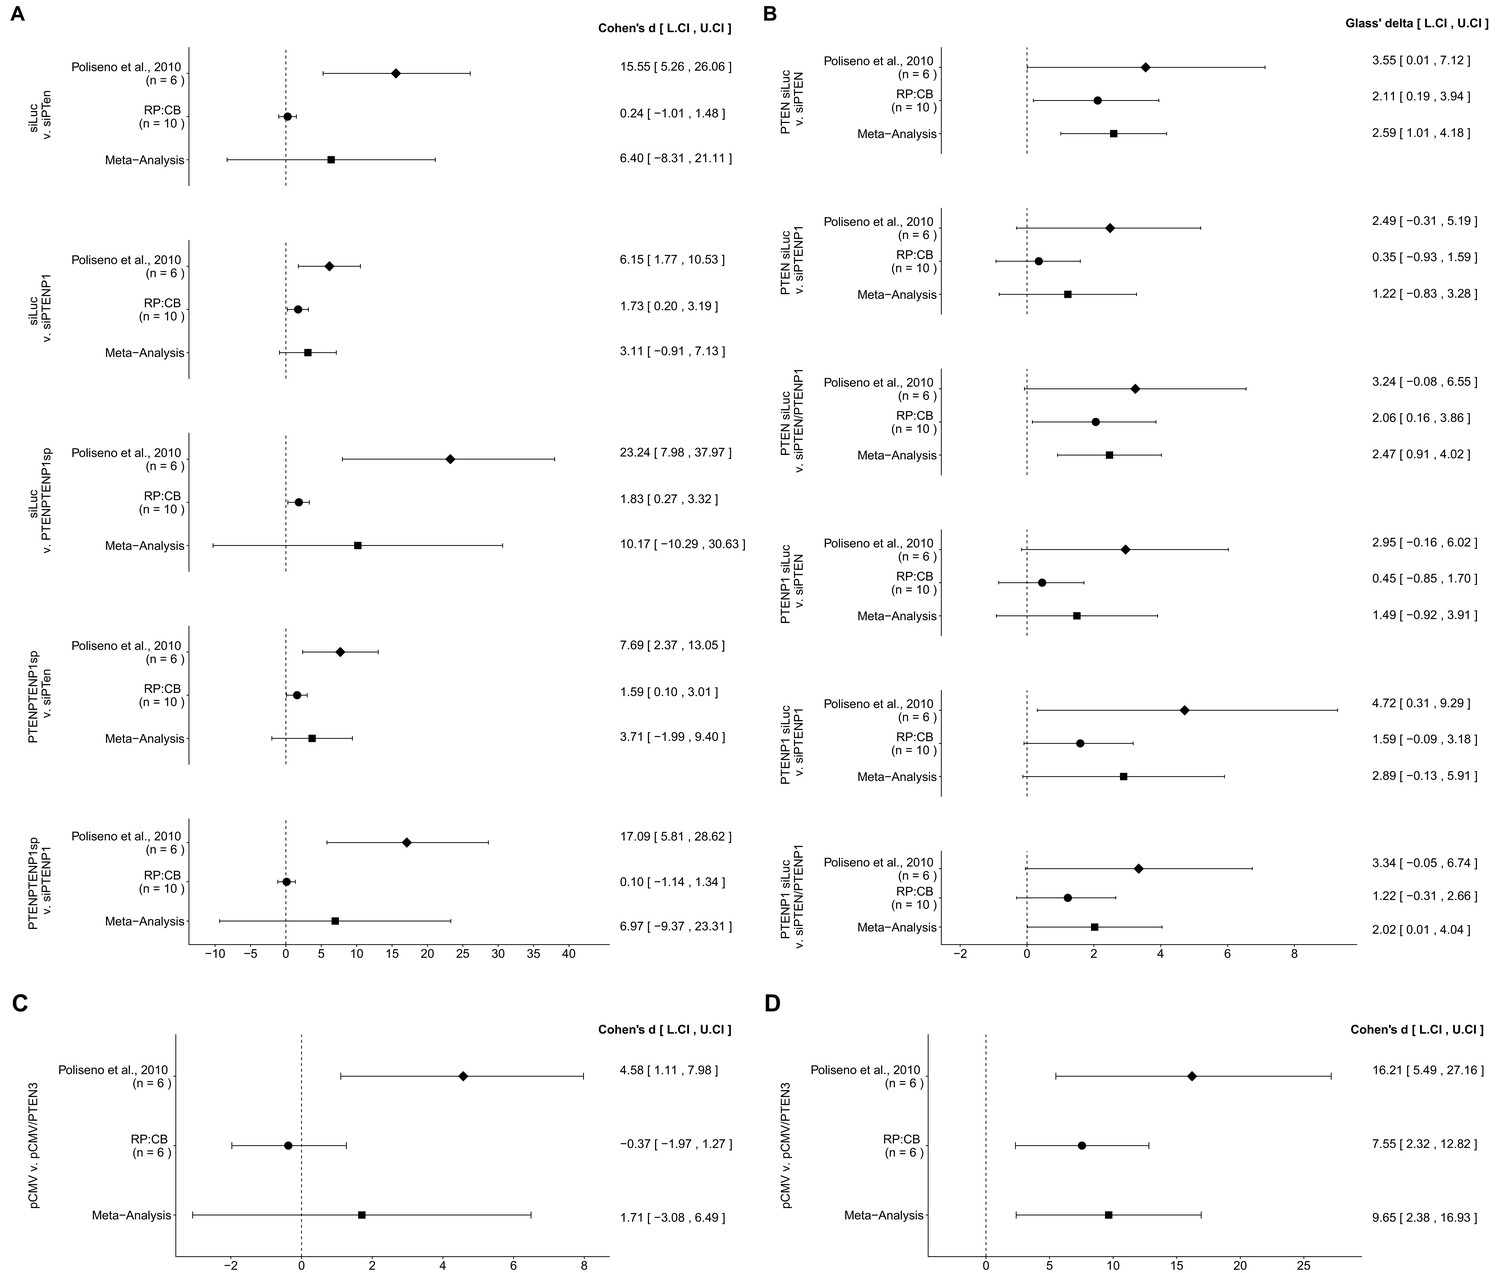
Meta-analyses of each effect.
Effect size and 95% confidence interval are presented for Poliseno et al. (2010), this replication study (RP:CB), and a random effects meta-analysis of those two effects. Cohen’s d and Glass’ delta are standardized differences between the two indicated measurements with the calculated effects for the original study effects reported as positive values. Sample sizes used in Poliseno et al. (2010) and RP:CB are reported under the study name. (A) These effects are related to the change in Day 5 relative cell numbers between the conditions reported in Figure 1 of this study and Figure 2F of Poliseno et al. (2010). Meta-analysis p values: siLUC and si-PTEN (p=0.394); siLUC and si-PTENP1 (p=0.129); siLUC and si-PTEN/PTENP1 (p=0.330); si-PTEN/PTENP1 and si-PTEN (p=0.202); si-PTEN/PTENP1 and si-PTENP1 (p=0.403). (B) These effects are related to the fold change differences in PTEN and PTENP1 expression between the conditions reported in Figure 2 of this study and Figure 2G of Poliseno et al. (2010). Meta-analysis p values: PTEN expression between siLUC and si-PTEN (p=0.0013); PTEN expression between siLUC and si-PTENP1 (p=0.244); PTEN expression between siLUC and si-PTEN/PTENP1 (p=0.0019); PTENP1 expression between siLUC and si-PTEN (p=0.225); PTENP1 expression between siLUC and si-PTENP1 (p=0.060); PTENP1 expression between siLUC and si-PTEN/PTENP1 (p=0.049). (C) These effects are related to the fold change differences in PTENP1 expression between pCMV and pCMV-PTEN-3’UTR reported in Figure 4 of this study and Figure 4A of Poliseno et al. (2010) (meta-analysis p=0.485). (D) These effects are related to the change in Day 5 relative cell numbers between pCMV and pCMV-PTEN-3’UTR reported in Figure 5 of this study and Figure 4A of Poliseno et al. (2010) (meta-analysis p=0.0093). Additional details for these meta-analyses can be found at https://osf.io/9yh6p/.
Tables
Key resources table
| Reagent type (species) or resource | Designation | Source or reference | Identifiers | Additional information |
|---|---|---|---|---|
| Cell line (H. sapiens, male) | DU145 | ATCC | cat#:HTB-81; RRID:CVCL_0105 | |
| Sequence-based reagent | siGlo RISC-free siRNA | Dharmacon | cat#:D-001600–01 | |
| Sequence-based reagent | siGENOME non-targeting siRNA #2 | Dharmacon | cat#:D-001210–02 | |
| Sequence-based reagent | PTEN-specific SMARTpool | Dharmacon | Reported in Supplementary Figure 6 (doi:10.1038/nature09144) | |
| Sequence-based reagent | PTENP1-specific SMARTpool | Dharmacon | Reported in Supplementary Figure 6 (doi:10.1038/nature09144) | |
| Sequence-based reagent | ON-TARGETplus siPTEN SMARTpool | Dharmacon | cat#:L-003023–00 | |
| Recombinant DNA reagent | pCMV | Agilent Technologies | cat#:240071 | |
| Recombinant DNA reagent | pCMV-PTEN-3’UTR | This paper | RRID:Addgene_97204 | |
| Antibody | rabbit anti-PTEN | Cell Signaling Technology | cat#:9559; clone:138G5; RRID:AB_390810 | 1:1000 dilution |
| Antibody | mouse anti-HSP90 | BD Biosciences | cat#:610419; clone:68; RRID:AB_397798 | 1:1000 dilution |
| Antibody | HRP-conjugated goat anti-rabbit | Cell Signaling Technology | cat#:7074; RRID:AB_2099233 | 1:20,000 dilution |
| Antibody | HRP-conjugated horse anti-mouse | Cell Signaling Technology | cat#:7076; RRID:AB_330924 | 1:20,000 dilution |
| Software, algorithm | CFX Manager | BioRad | RRID:SCR_017251 | version 3.1.1517.0823 |
| Software, algorithm | ImageJ | doi:10.1038/nmeth.2089 | RRID:SCR_003070 | version 1.50a |
| Software, algorithm | SoftMax Pro data acquisition and analysis | Molecular Devices | RRID:SCR_014240 | version 4.6 |
| Software, algorithm | R Project for statistical computing | https://www.r-project.org | RRID:SCR_001905 | version 3.5.1 |
Additional files
Download links
A two-part list of links to download the article, or parts of the article, in various formats.
Downloads (link to download the article as PDF)
Open citations (links to open the citations from this article in various online reference manager services)
Cite this article (links to download the citations from this article in formats compatible with various reference manager tools)
Replication Study: A coding-independent function of gene and pseudogene mRNAs regulates tumour biology
eLife 9:e51019.
https://doi.org/10.7554/eLife.51019


