Modulation of dopamine D1 receptors via histamine H3 receptors is a novel therapeutic target for Huntington's disease
- Department of Biochemistry and Molecular Biomedicine, Faculty of Biology, Institute of Biomedicine of the University of Barcelona (IBUB), University of Barcelona, Spain
- Centro de Investigación Biomédica en Red sobre Enfermedades Neurodegenerativas, Spain
- Department of Biomedical Science, Faculty of Medicine, University of Barcelona, Institut of Neuroscience, Spain
- Institut d´Investigacions Biomèdiques August Pi i Sunyer (IDIBAPS), Spain
- School of Pharmacy, University of East Anglia, Norwich Research Park, United Kingdom
- Department of Biochemistry and Molecular Biology I, School of Biology, Instituto Universitario de Investigación Neuroquímica, and Instituto Ramón y Cajal de Investigación Sanitaria, Complutense University of Madrid, Spain
- School of Biological and Chemical Sciences, Queen Mary University of London, United Kingdom
- Department of Translational Research and New Technologies in Medicine and Surgery, University of Pisa, Italy
- National Institute on Drug Abuse, Intramural Research Program, National Institutes of Health, Department of Health and Human Services, United States
- William Harvey Research Institute, Barts and the London School of Medicine, Queen Mary University of London, United Kingdom
Figures
Figure 1 with 5 supplements
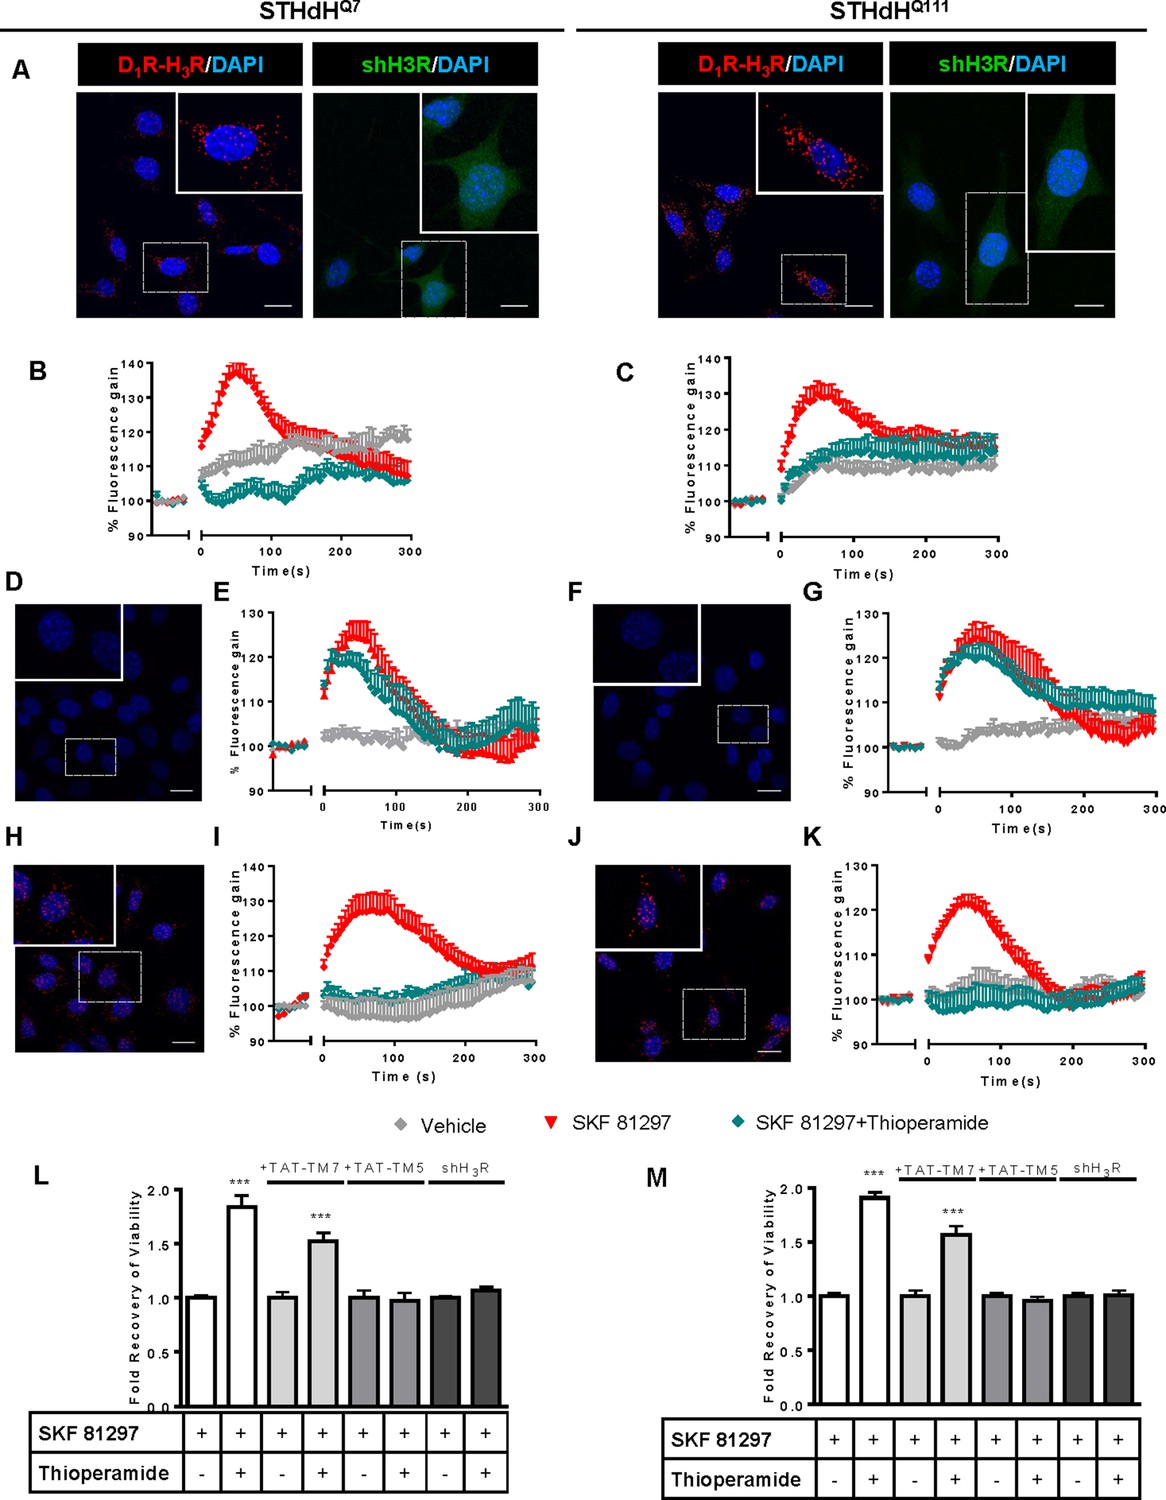
Functional D1R-H3R heteromers are expressed in STHdhQ7 and STHdhQ111 cells.
PLA were performed in STHdhQ7 and STHdhQ111 cells (A, D, F, H and J) or in cells infected with shH3R to silence H3R, observed as green stained cells due to the GFP expression included in the plasmid (A). D1R-H3R heteromers were visualized in STHdh cells as red spots around blue colored DAPI stained nucleus, but not in STHdh cells infected with shH3R vector (A). Calcium increases were measured in STHdhQ7 (B, E and I) or STHdhQ111 (C, G and K). Cells were treated (20 min) or not with the H3R antagonist thioperamide (10 μM) before the addition of vehicle or SKF 81297 (1 μM). In (D, E, F, G, H, I, J and K), STHdHQ7 (D, E, H and I) or STHdHQ111 (F, G, J and K) cells were also pre-treated for 60 min with 4 μM TM5 (D, E, F and G) or TM7 (H, I, J and K) peptides. Heteromers were visualized as red spots around DAPI (blue) stained nucleus in cells pre-treated with TM7 peptide. Scale: 20 μm. For each calcium curve values are expressed as a percentage increase with respect to untreated cells and are a mean ± SEM of 3 to 5 independent experiments. In (L and M), cell viability was determined in STHdhQ7 (L) or STHdhQ111 cells (M) pre-treated for 60 min with vehicle (white columns), with 4 μM TAT-TM7 (pale grey columns) or TAT-TM5 (grey columns) or infected with shH3R to silence H3R (dark grey columns) prior overstimulation with 30 μM SKF 81297. Values represent mean ± SEM (n = 24 to 30) of cell viability recovery expressed as in-fold respect to SKF 81297 treated cells. Student’s t test showed a significant (***p<0.001) effect over SKF 81297 treated cells.
Figure 1—figure supplement 1
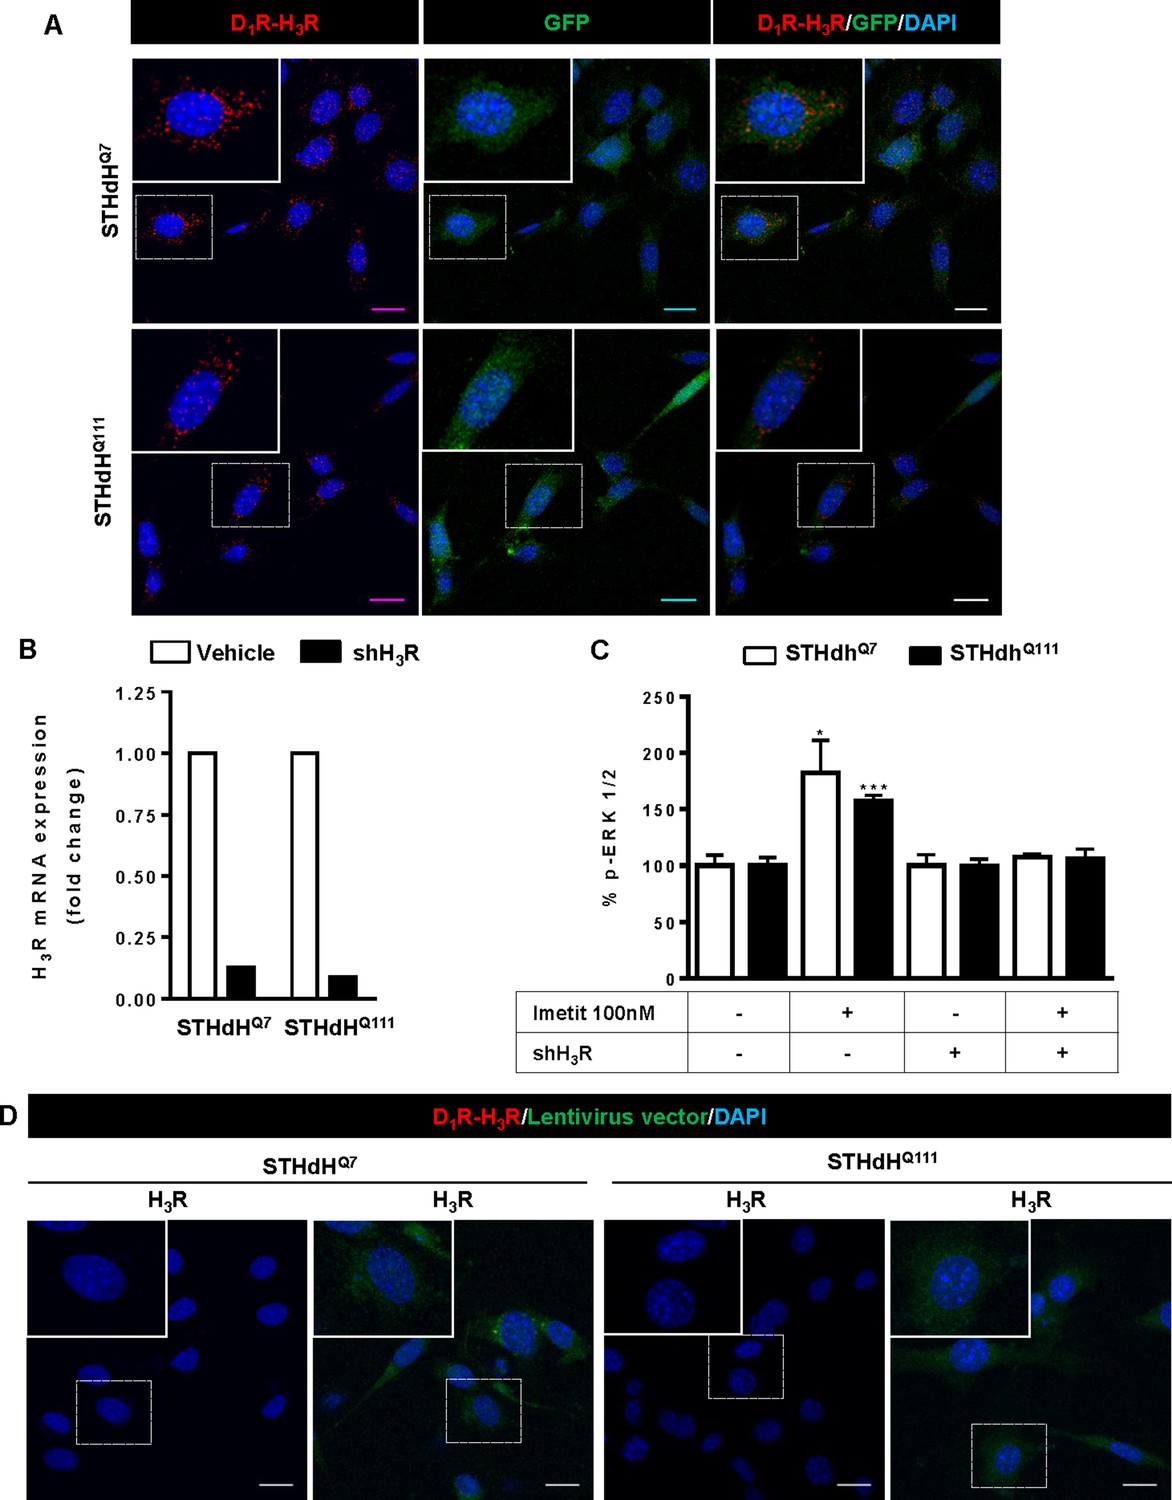
Negative controls for Proximity Ligation Assays (PLA) in striatal cells not depleted or H3R depleted by shRNA.
In (A), Proximity Ligation Assays (PLA) were performed in STHdhQ7 and STHdhQ111 cells not H3R depleted but infected with GIPZ Non-silencing Lentiviral shRNA Control plasmid. D1R-H3R heteromers were visualized as red spots around blue colored DAPI stained nucleus (left panels), in infected cells stained in green due to the GFP expression included in the plasmid (middle panel). Merge images are given in the right panels. In (B), controls showing that H3R mRNA is not present in cells depleted of H3R by shRNA. STHdhQ7 and STHdhQ111 cells were not infected or infected with lentiviral silencing plasmid GIPZ Human histamine H3 receptor shRNA (shH3R). Values represent fold change respect to non-silencing vector. In (C) controls showing the lack of H3R stimulated signaling in cells depleted of H3R by shRNA. STHdhQ7 or STHdhQ111 cells were not stimulated (basal) or stimulated with the H3R agonist imetit (100 nM) and ERK 1/2 phosphorylation was determined. Values represent mean ± SEM (n = 3) of percentage of phosphorylation relative to basal levels found in untreated cells. Student’s t test showed significant differences over basal conditions (*p<0.05, ***p<0.001). In (D), PLA were performed in the absence of the D1R primary antibody using STHdhQ7 or STHdhQ111 cells not infected (left panels) or infected (right panels) with GIPZ Non-silencing Lentiviral shRNA Control plasmid. Scale bar: 20 μm.
Figure 1—figure supplement 2
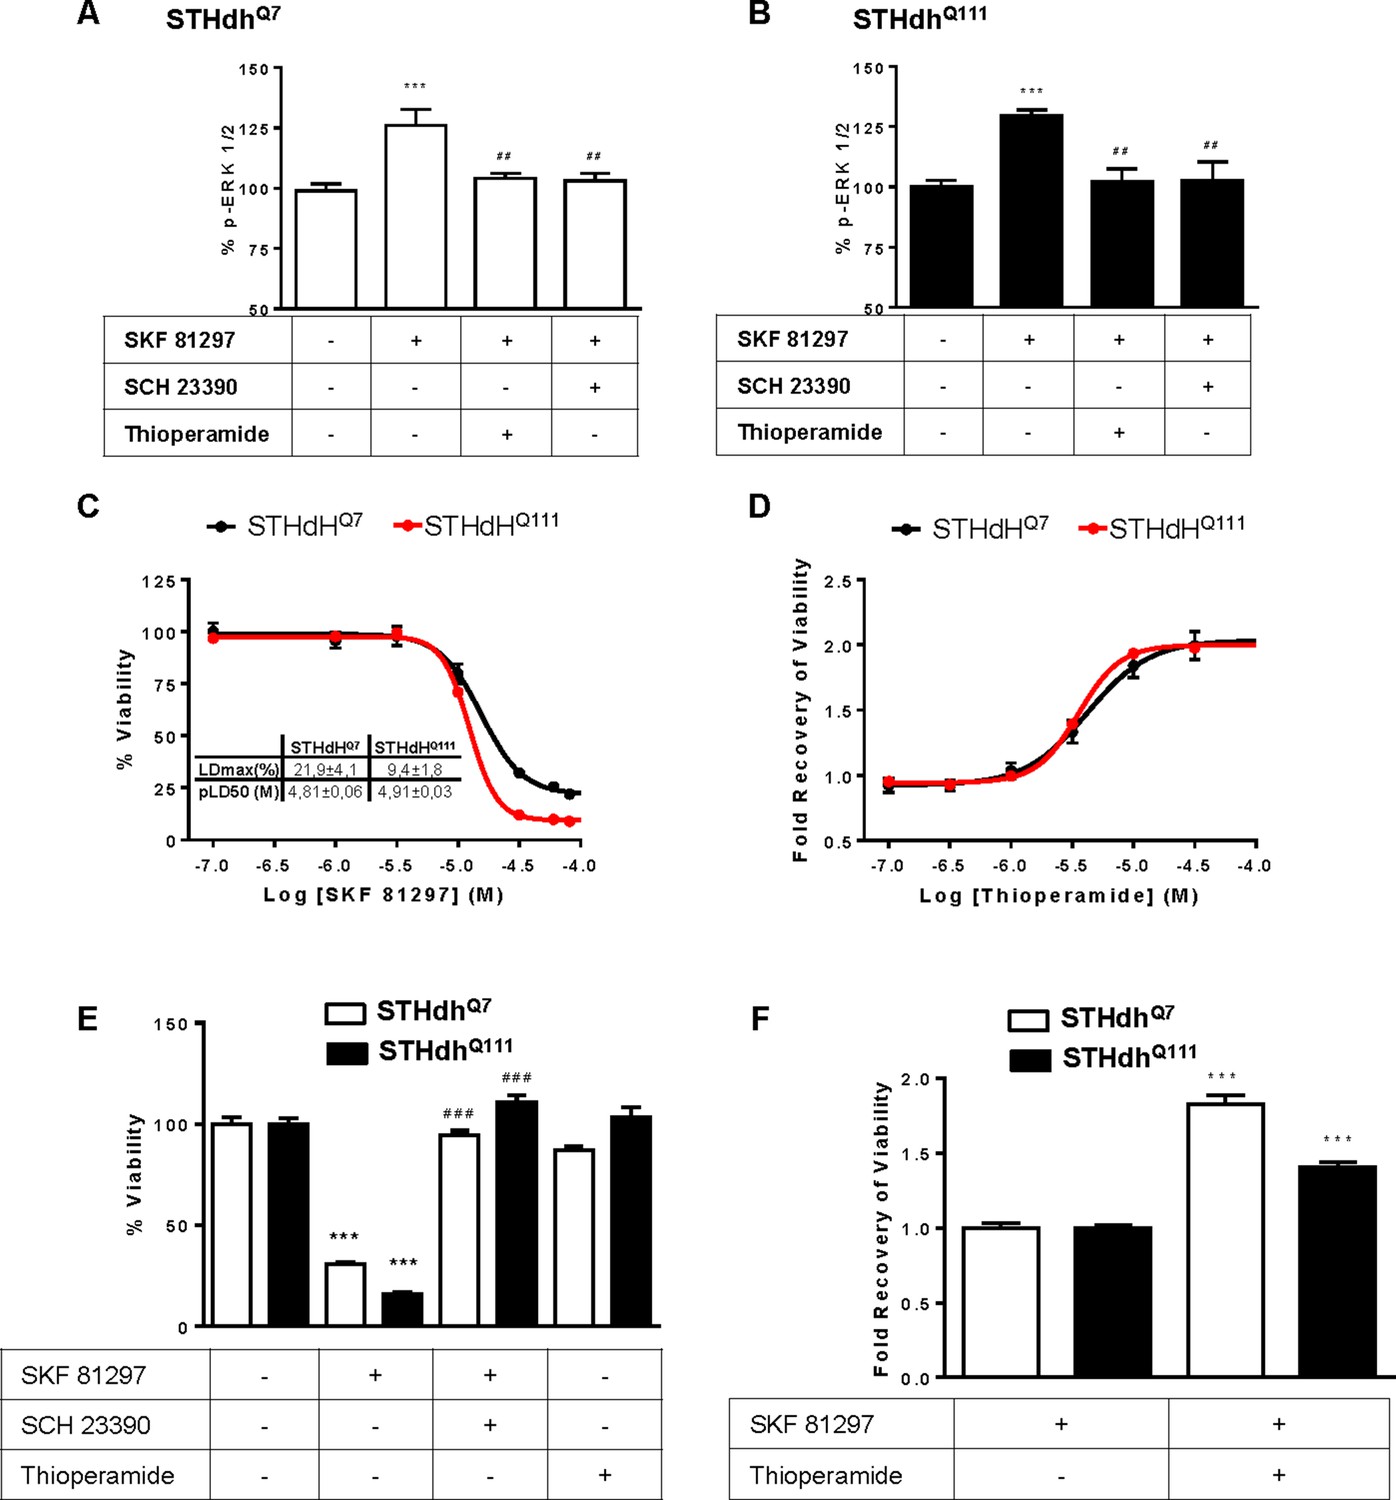
H3R ligands revert the D1R-mediated decreases in STHdhQ7 and STHdhQ111 cell viability.
STHdhQ7 (A) or STHdhQ111 (B) cells were treated for 20 min with vehicle, D1R antagonist SCH 23390 (1 μM) or the H3R antagonist thioperamide (1 μM) before the addition of SKF 81297 (100 nM) for an additional incubation period of 10 min and ERK 1/2 phosphorylation was determined. Values represent mean ± SEM (n = 3 to 4) of percentage of phosphorylation relative to basal levels found in untreated cells (control). One-way ANOVA followed by Bonferroni post hoc tests showed a significant effect over basal (***p<0.001) or over SKF 81297 treatment (##p<0.01). In (C, D), cell viability was determined in STHdhQ7 (black curves) or STHdhQ111 cells (red curves) pre-treated for 60 min with vehicle (C), or with the H3R antagonist thioperamide 10 μM (B) prior overstimulation with SKF 81297 (increasing concentrations in A) or 30 μM in B). Values represent mean ± SEM (n = 24 to 30) of percentage of viable cells respect to vehicle-treated cells (C) or the cell viability recovery expressed as in-fold respect to SKF 81297 treated cells (D). In (E and F) the effect of D1R antagonist, H3R antagonist and silencing vector transfection in striatal cells viability is shown. STHdhQ7 and STHdhQ111 cells were not infected (E) or infected (F) with GIPZ Non-silencing Lentiviral shRNA Control plasmid. Cells were pretreated for 60 min with vehicle, 10 μM SCH 23390 or 10 μM thioperamide prior over-stimulation with SKF 81297 (30 μM). Values represent mean ± SEM (n = 7 to 22) of percentage of viable cells respect to vehicle-treated cells (E) or the cell viability recovery expressed as in-fold respect to SKF 81297 treated cells (F). Student’s t test showed a significant (***p<0.001) effect over not treated cells (E) or SKF 81297 treated cells (F).
Figure 1—figure supplement 3
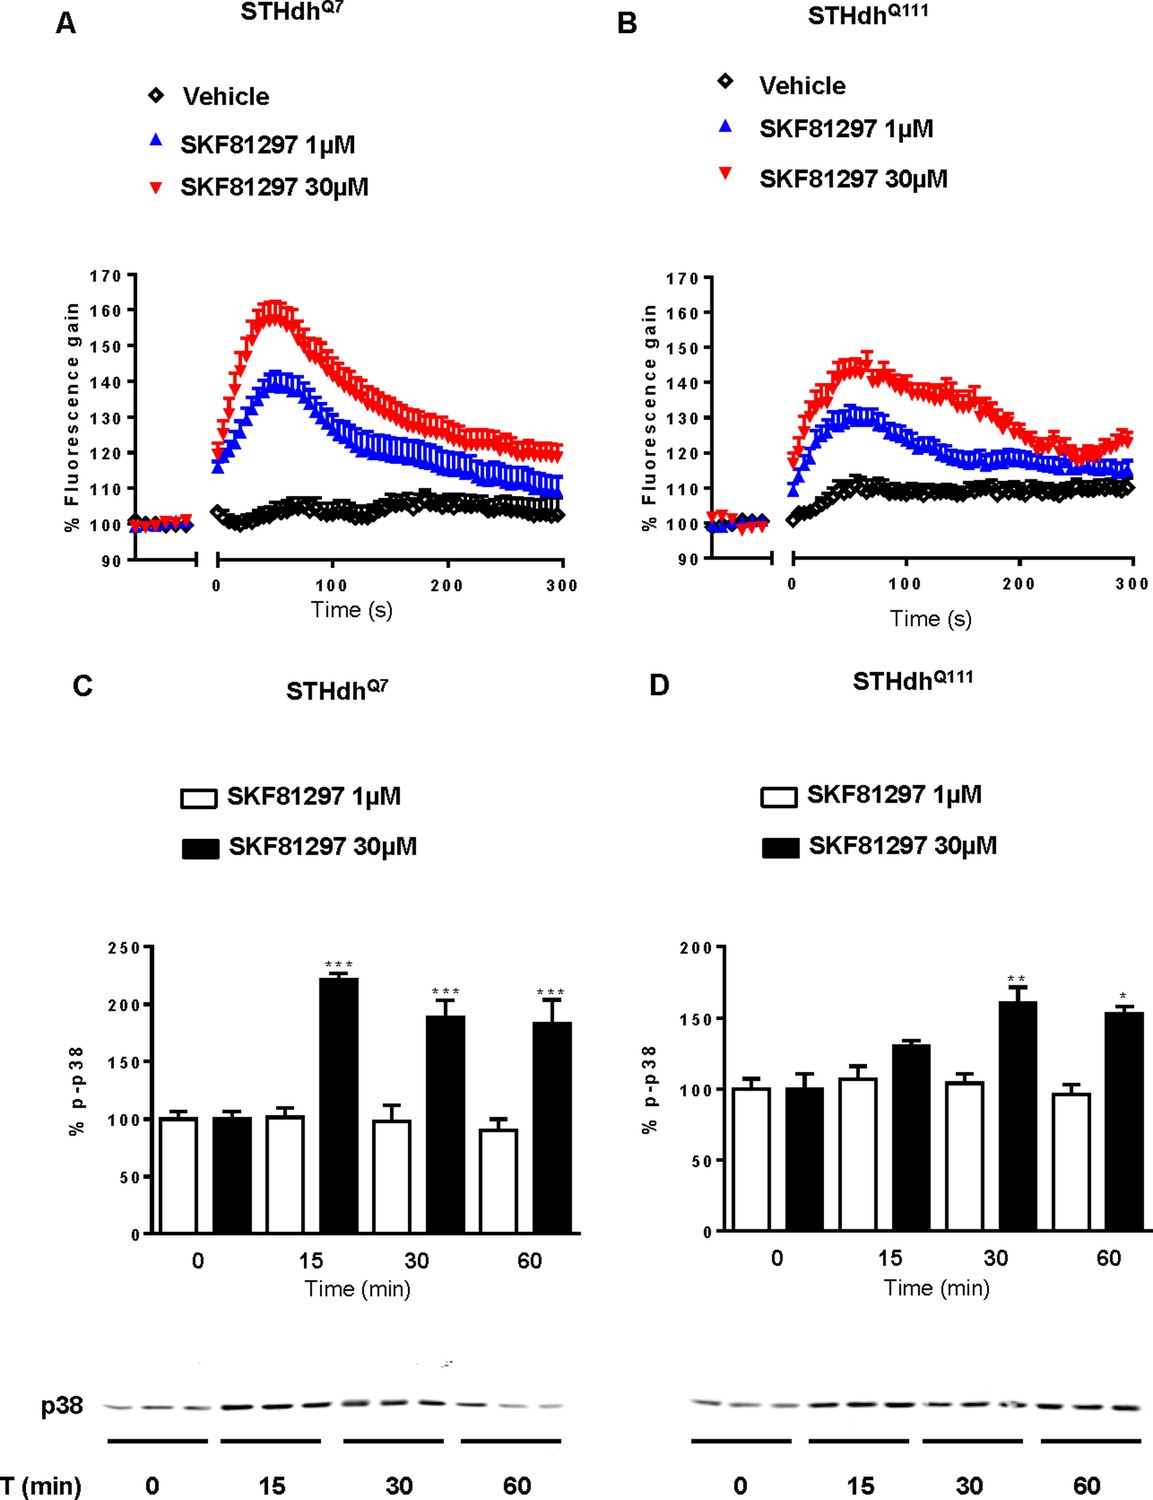
Effect of low and high SKF 81297 concentrations in p-p38 and intracellular calcium release.
STHdhQ7 (A and C) and STHdhQ111 (B and D) cells were time-dependent stimulated with 1 μM or 30 μM SKF 81297 and intracellular calcium release (A and B) or p-p38 phosphorylation (C and D) was determined. In (A and B), curves are mean ± SEM of 3 to 6 independent experiments. In (C and D) values represent mean ± SEM of two independent experiments performed per triplicate of percentage of phosphorylation respect to vehicle-treated cells with example gels shown of STHdhQ7 and STHdhQ111 treated with 30 μM SKF 81297 below. Student’s t test showed a significant (*p<0.05, **p<0.01, ***p<0.001) effect over not treated cells.
Figure 1—figure supplement 4
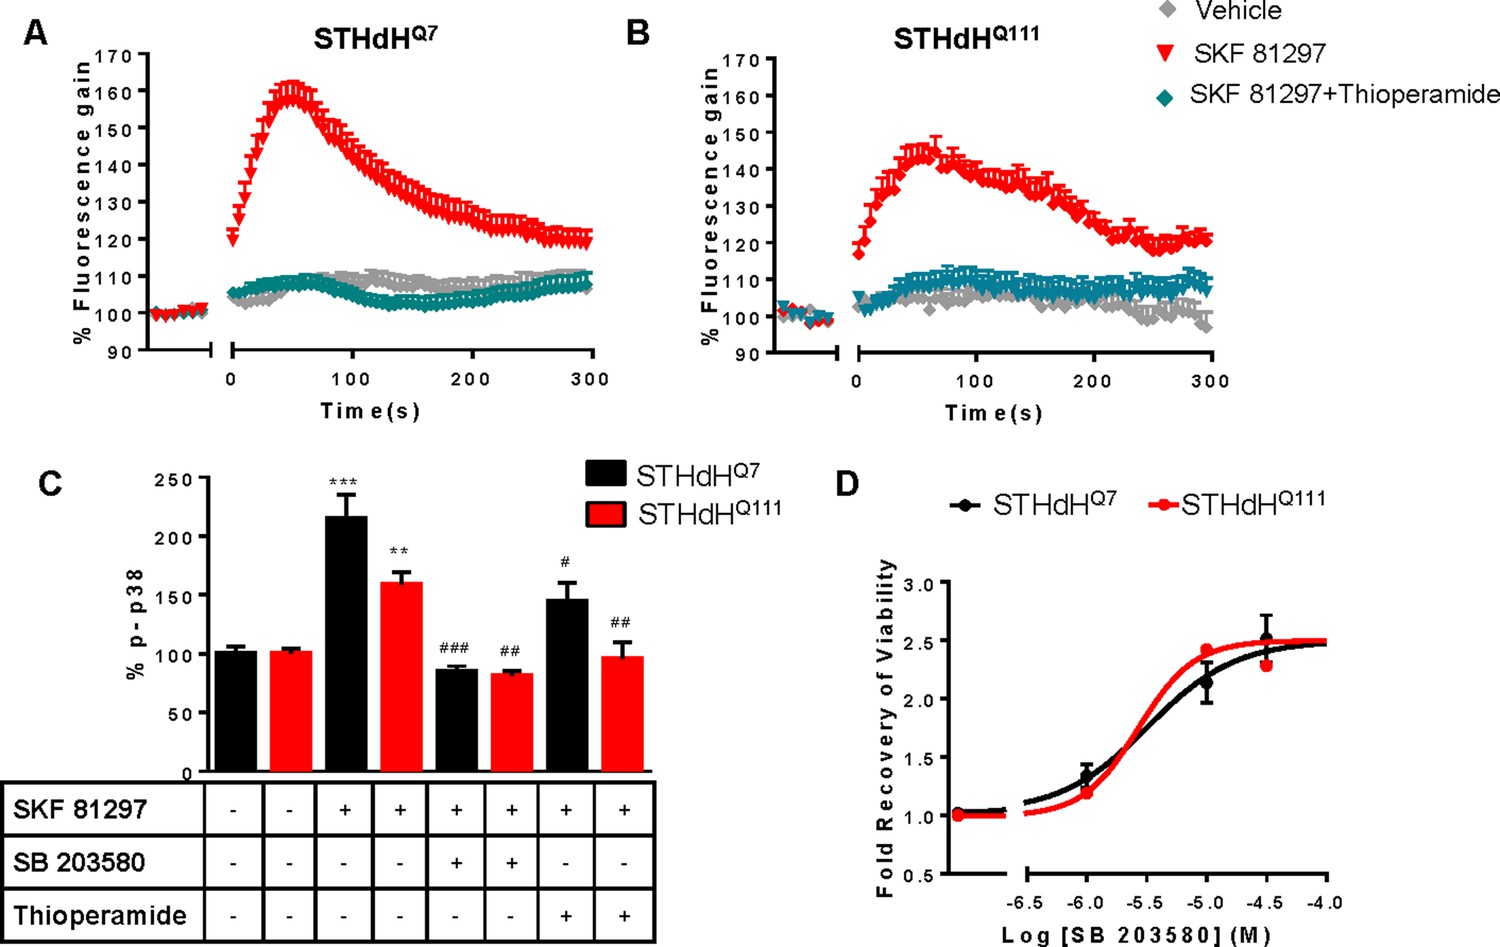
H3R ligands revert the D1R-mediated decreases in cell viability in STHdhQ7 and STHdhQ111 by modulating calcium signaling and p38 phosphorylation.
In (A and B), STHdhQ7 (A) or STHdhQ111 (B) cells were pre-treated for 20 min with vehicle or with the H3R antagonist thioperamide (10 μM) and were not stimulated or overstimulated with SKF 81297 (30 μM) prior intracellular calcium release determination. For each curve values are expressed as a percentage of increase with respect to untreated not overstimulated cells and are mean ± SEM of 3 to 9 independent experiments. In (C), STHdhQ7 or STHdhQ111 cells were treated for 20 min with medium (control), with SB 203580 (10 μM) or with the H3R antagonist thioperamide (10 μM). Cells were overstimulated with SKF 81297 (30 μM) and p38 phosphorylation was determined. Values represent mean ± SEM (n = 3) and are expressed as percentage over control. One-way ANOVA followed by Bonferroni post hoc tests showed a significant effect over control (**p<0.01, ***p<0.001) or over SKF 81297 treatment (#p<0.05, ##p<0.01, ###p<0.001). In (D), cell viability was determined in STHdhQ7 (black curves) or STHdhQ111 cells (red curves) pre-treated for 60 min with the p38 inhibitor SB 203580 prior overstimulation with SKF 81297 (30 μM). Values represent mean ± SEM (n = 24 to 30) of the cell viability recovery expressed as in-fold respect to SKF 81297 treated cells (D).
Figure 1—figure supplement 5
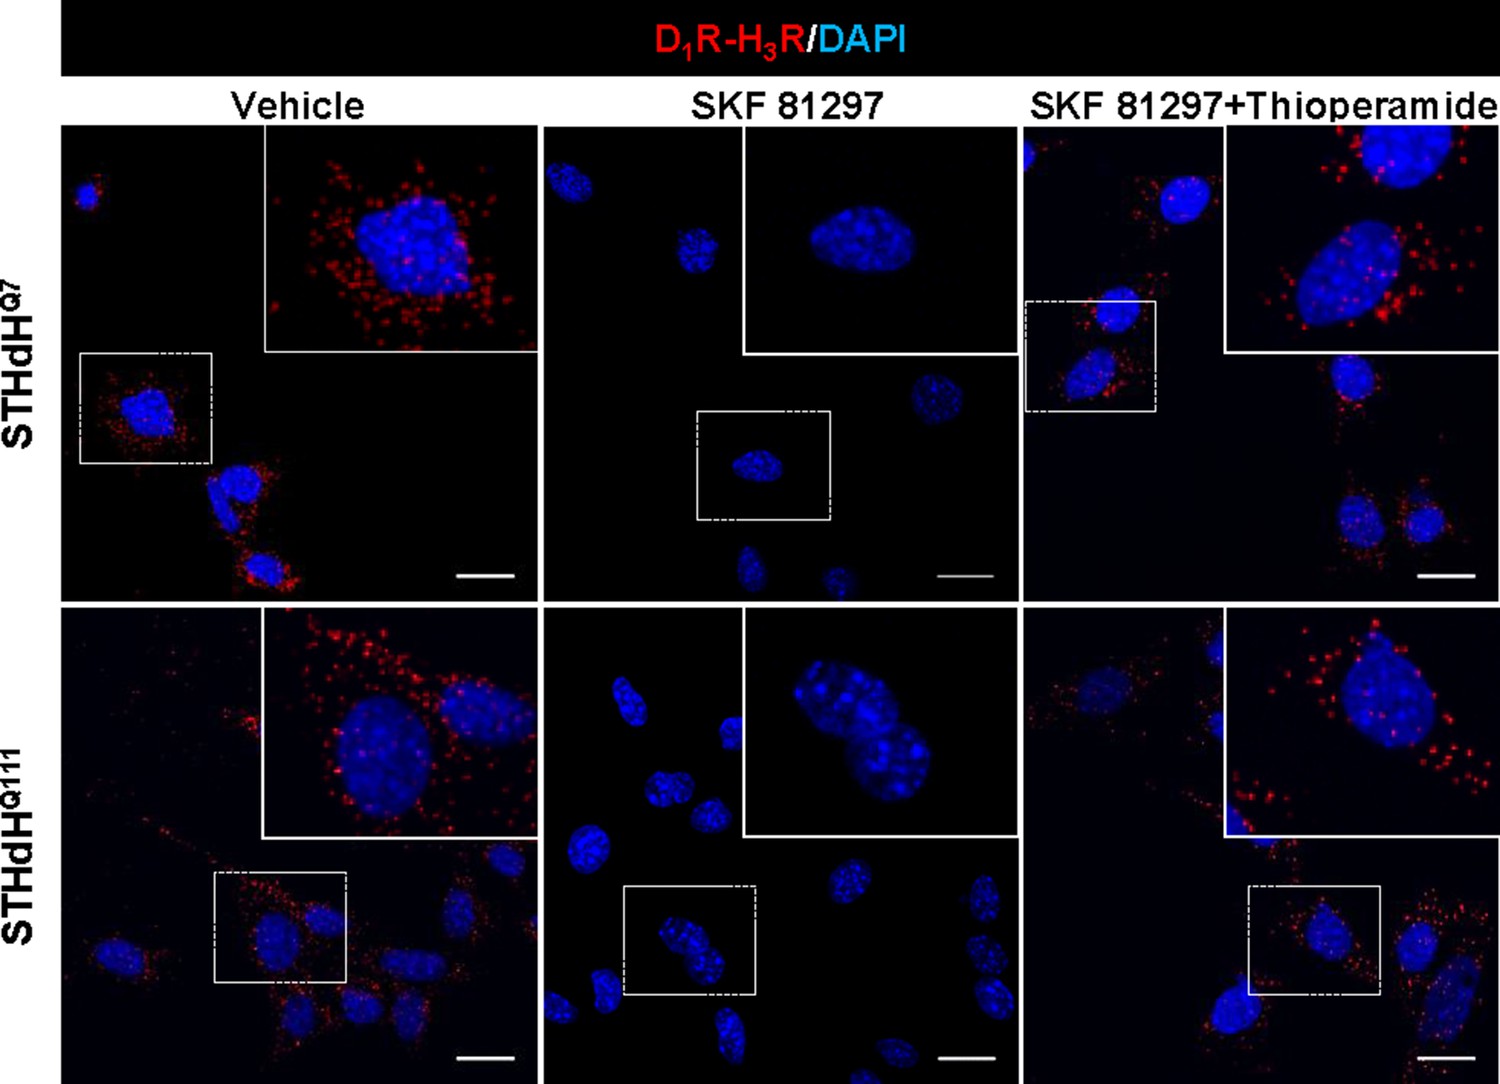
H3R ligands revert the D1R overstimulation-induced heteromer disruption in striatal cells.
Proximity Ligation Assays (PLA) were performed in STHdhQ7 or STHdhQ111 cells pre-treated for 60 min with vehicle or with the H3R antagonist thioperamide (10 µM) before addition of medium (in the case of the vehicle control) or SKF 81297 (30 μM, 45 min). D1R-H3R heteromers were visualized as red spots around blue colored DAPI stained nucleus in control and H3R ligands-treated cells, but not in SKF 81297 only treated cells. Scale bar: 20 μm.
Figure 2 with 2 supplements
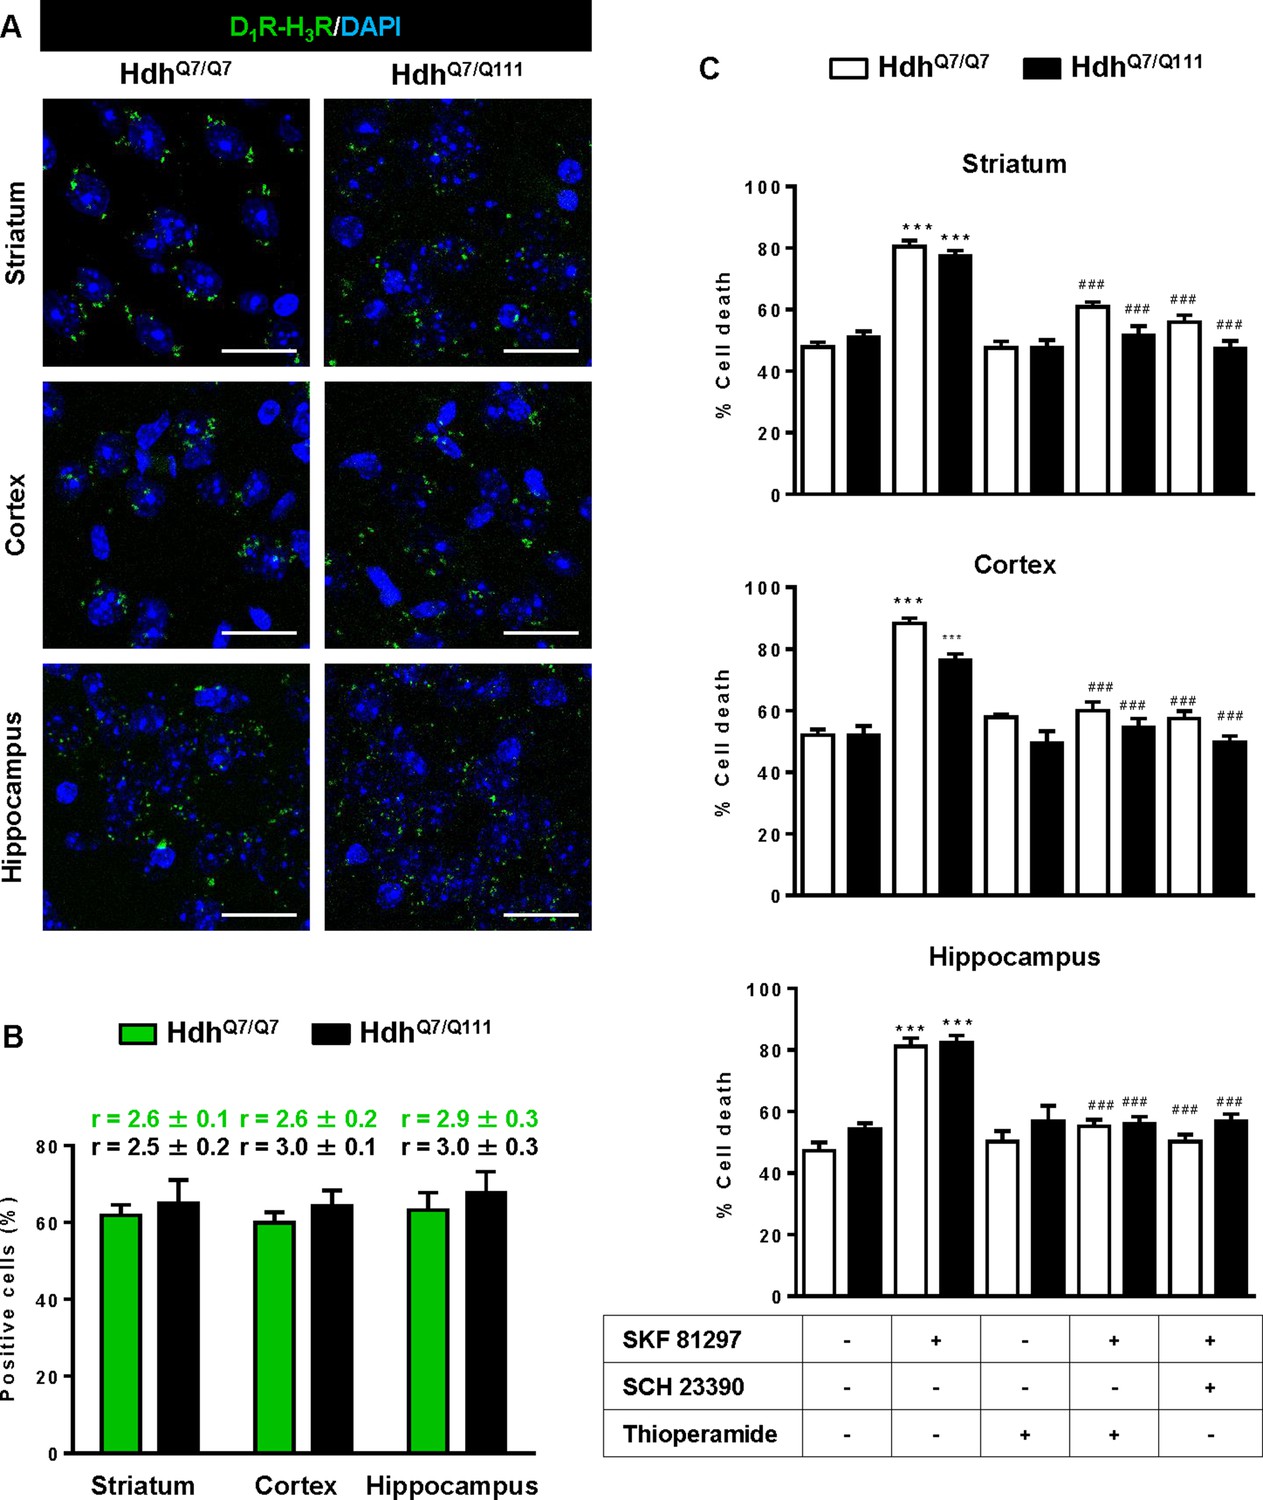
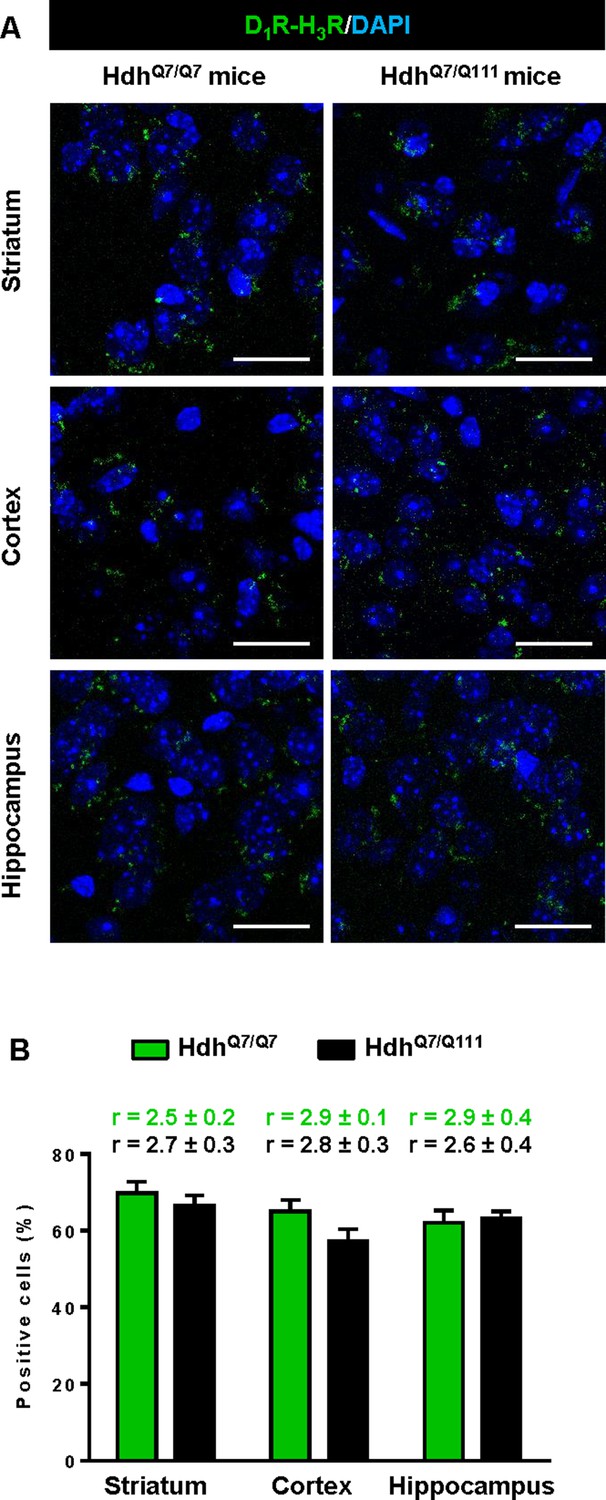
Functional D1R-H3R heteromers are expressed in wild-type HdhQ7/Q7 and mutant HdhQ7/Q111 mice.
Striatal, cortical or hippocampal slices from 4-month-old HdhQ7/Q7 and HdhQ7/Q111 mice were used. In (A), by Proximity Ligation Assays (PLA) D1R-H3R heteromers were visualized in all slices as green spots around blue colored DAPI stained nucleus. Scale bar: 20 μm. In (B), the number of cells containing one or more green spots is expressed as the percentage of the total number of cells (blue nucleus). r values (number of green spots/cell containing spots) are shown above each bar. Data (% of positive cells or r) are the mean ± SEM of counts in 600–800 cells from 4 to 8 different fields from three different animals. Student’s t test showed no significant differences in heteromers expression in HdhQ7/Q7 and HdhQ7/Q111 mice. In (C), striatal, cortical or hippocampal organotypic slice cultures from 4-month-old HdhQ7/Q7 and HdhQ7/Q111 mice were treated for 60 min with vehicle, the D1R antagonist SCH 23390 (10 μM) or H3R antagonist thioperamide (10 μM) before the addition of SKF 81297 (50 μM). After 48 h cell death was determined. Values represent mean ± SEM (n = 3 to 19) of percentage of cell death. One-way ANOVA followed by Bonferroni post hoc tests showed a significant effect over non-treated organotypic cultures (***p<0.001) or of the H3R antagonist plus SKF 81297 treatment over the SKF 81297 (###p<0.001).
Figure 2—figure supplement 1
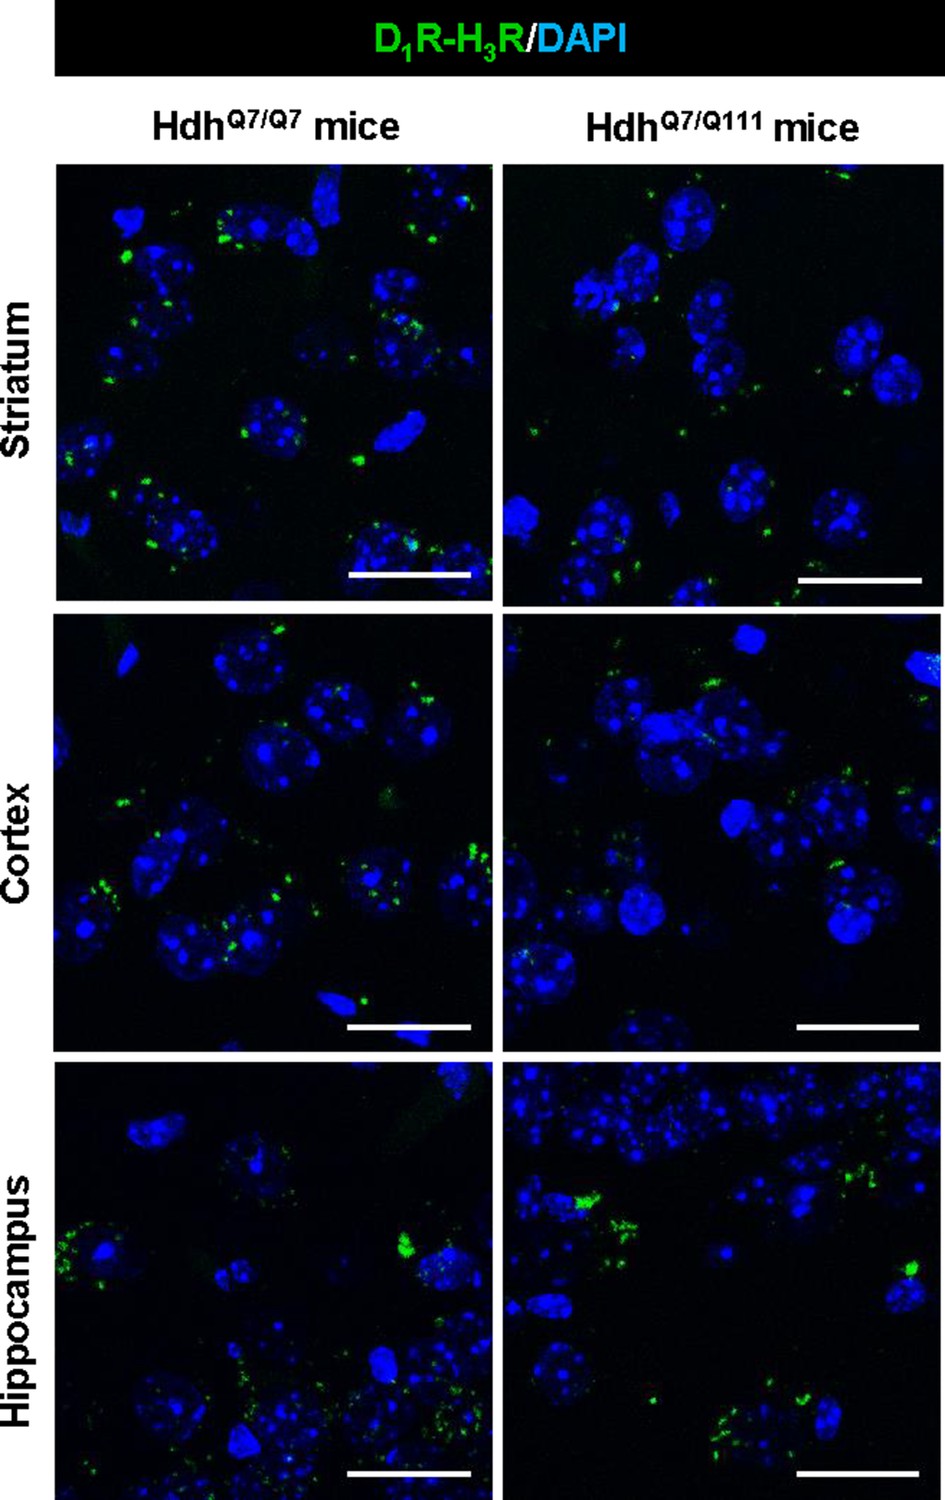
D1R-H3R heteromer are expressed in 2-month-old HdhQ7/Q7 and HdhQ7/Q111 mice.
Proximity Ligation Assays (PLA) were performed using striatal, cortical or hippocampal slices from 2-month-old HdhQ7/Q7 and HdhQ7/Q111 mice. D1R-H3R heteromers were visualized in all slices as green spots around blue colored DAPI stained nucleus. Scale bar: 20 μm.
Figure 2—figure supplement 2
Negative controls for Proximity Ligation Assays (PLA) in mouse brain slices.
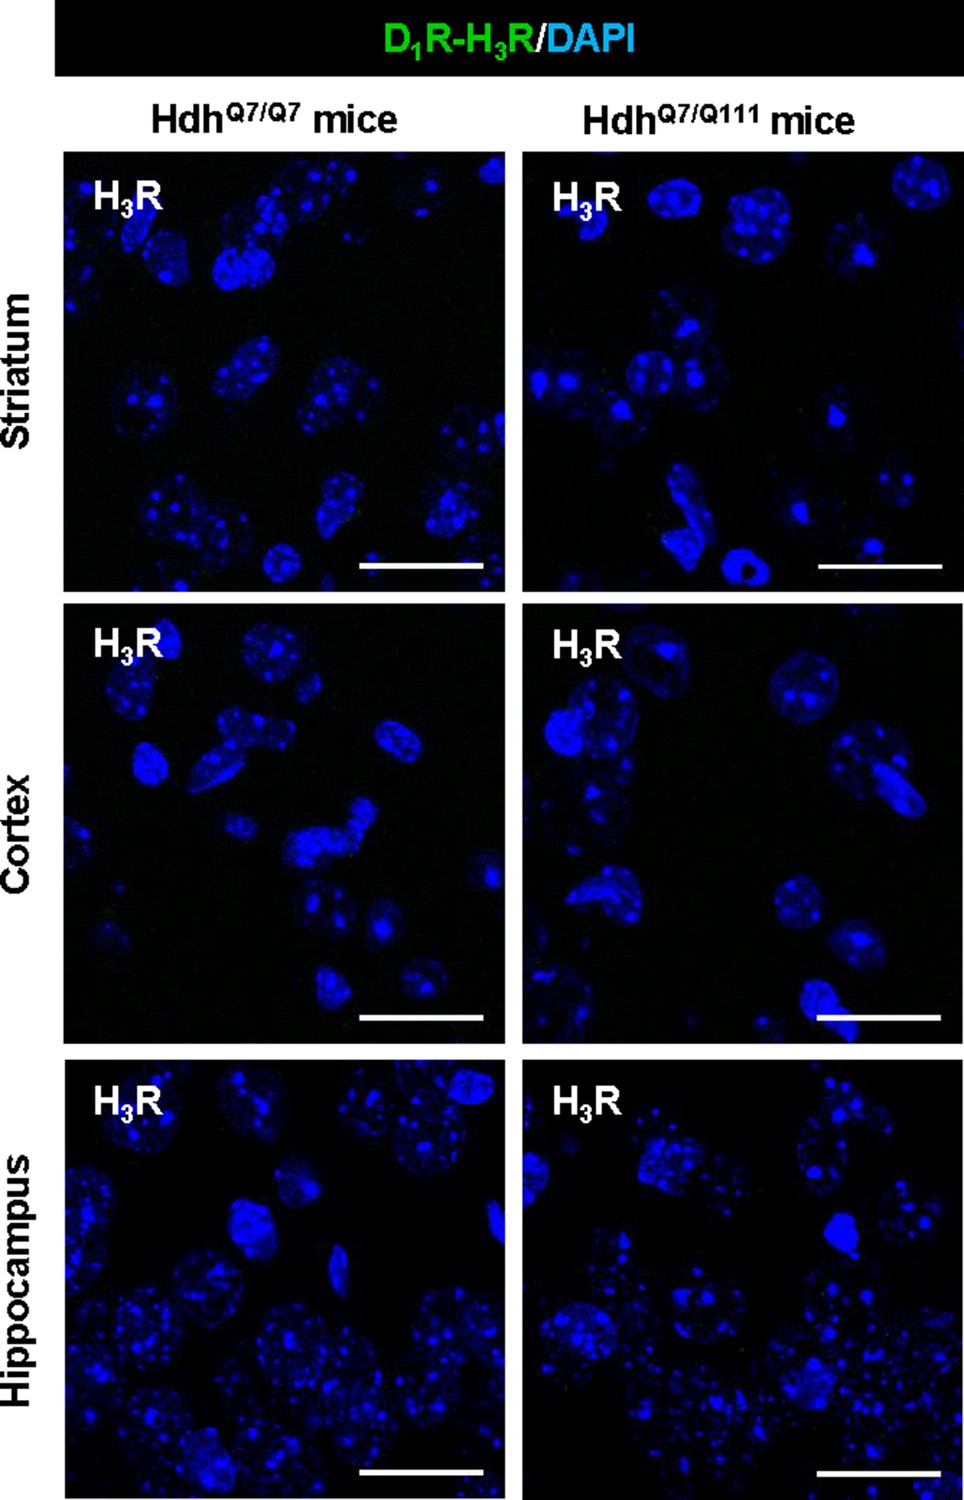
Proximity Ligation Assays (PLA) were performed in the absence of the primary antibody against D1R, using striatal, cortical or hippocampal slices from 4-month-old HdhQ7/Q7 and HdhQ7/Q111 mice. In all slices, a lack of green spots around blue colored DAPI stained nucleus was observed. Scale bar: 20 μm.
Figure 3 with 1 supplement
Functional D1R-H3R heteromers are expressed in wild-type HdhQ7/Q7 but not in 8-month-old mutant HdhQ7/Q111 mice.
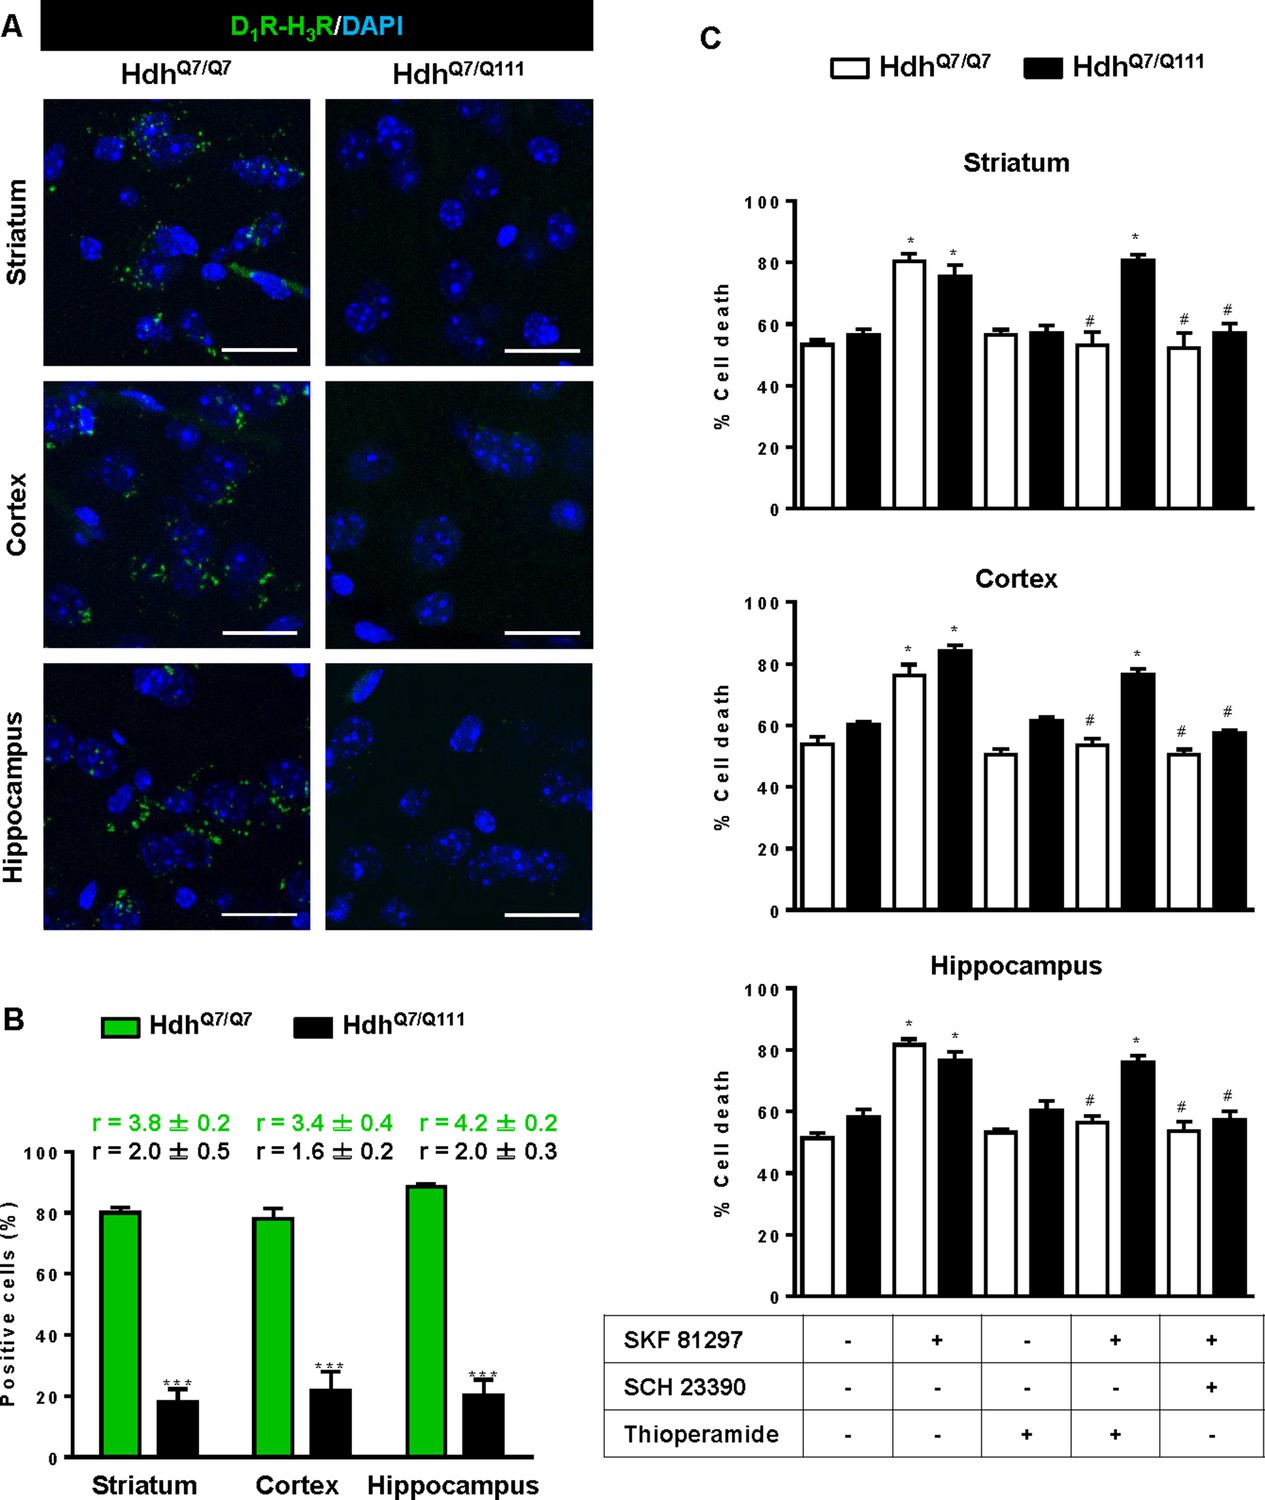
Striatal, cortical or hippocampal slices from 8-month-old HdhQ7/Q7 and HdhQ7/Q111 mice were used. In (A), by Proximity Ligation Assays (PLA) D1R-H3R heteromers were visualized in HdhQ7/Q7 mice but not in HdhQ7/Q111 mice as green spots around blue colored DAPI stained nucleus. Scale bar: 20 μm. In (B), the number of cells containing one or more green spots is expressed as the percentage of the total number of cells (blue nucleus). r values (number of green spots/cell containing spots) are shown above each bar. Data (% of positive cells or r) are the mean ± SEM of counts in 600–800 cells from 5 to 7 different fields from three different animals. Student’s t test showed a significant (***p<0.05) decrease of heteromers expression in HdhQ7/Q111 mice compared to the respective HdhQ7/Q7 mice. In (C) striatal, cortical or hippocampal organotypic slice cultures from 8-month-old HdhQ7/Q7 and HdhQ7/Q111 mice were treated for 60 min with medium, the D1R antagonist SCH 23390 (10 μM) or the H3R antagonist thioperamide (10 μM) before the addition of SKF 81297 (50 μM) and cell death was determined. Values represent mean ± SEM (n = 3 to 6) of percentage of cell death. One-way ANOVA followed by Bonferroni post hoc tests showed a significant effect over non-treated organotypic cultures (*p<0.05) or of the H3R antagonist plus SKF 81297 treatment over the SKF 81297 (#p<0.05).
Figure 3—figure supplement 1
Expression of D1R-H3R heteromers in 6-month-old HdhQ7/Q7 and HdhQ7/Q111 mice chronically treated with saline.
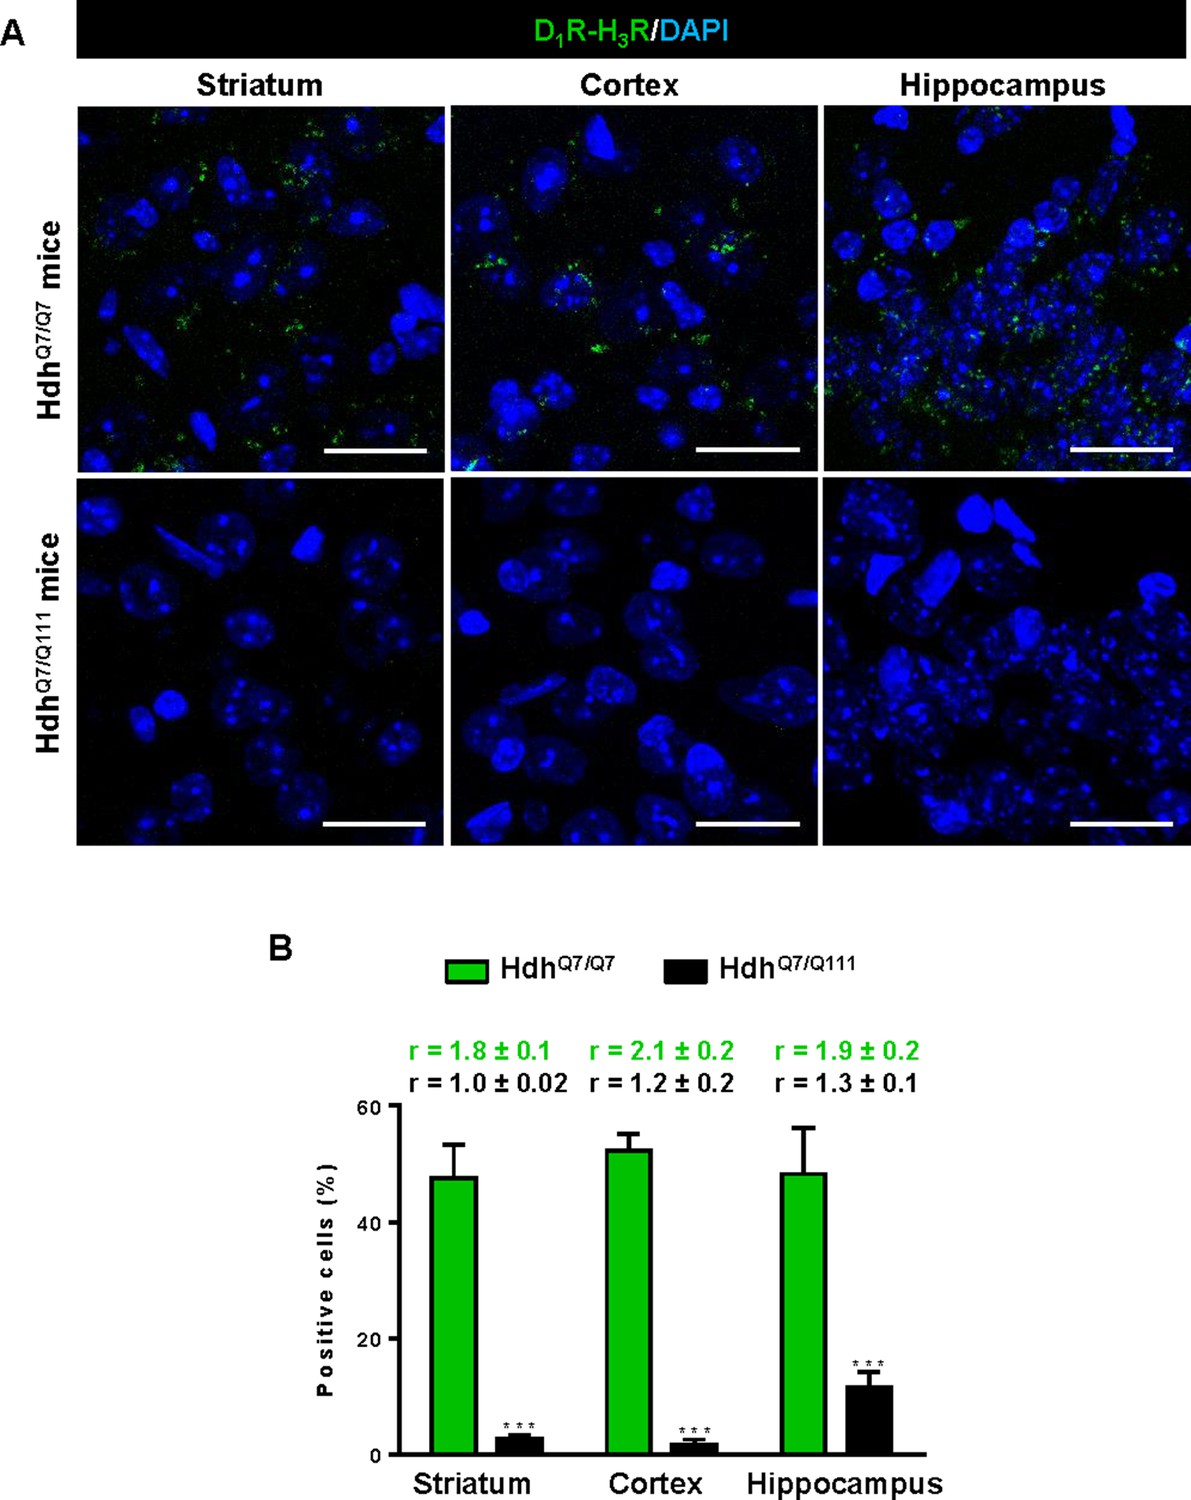
In (A), Proximity Ligation Assays (PLA) were performed in striatal, cortical and hippocampal slices from 6-month-old HdhQ7/Q7 and HdhQ7/Q111 mice treated with saline. D1R-H3R heteromers were visualized as green spots around blue colored DAPI stained nucleus in HdhQ7/Q7 mice but not in HdhQ7/Q111 mice chronically treated with saline. Scale bar: 20 μm. In (B), the number of cells containing one or more green spots is expressed as the percentage of the total number of cells (blue nucleus). r values (number of green spots/cell containing spots) are shown above each bar. Data (% of positive cells or r) are the mean ± SEM of counts in 600–800 cells from 4 to 8 different fields from three different animals. Student’s t test showed significant differences in D1R-H3R heteromer expression (***p<0.001) compared to the respective HdhQ7/Q7 mice.
Figure 4 with 5 supplements
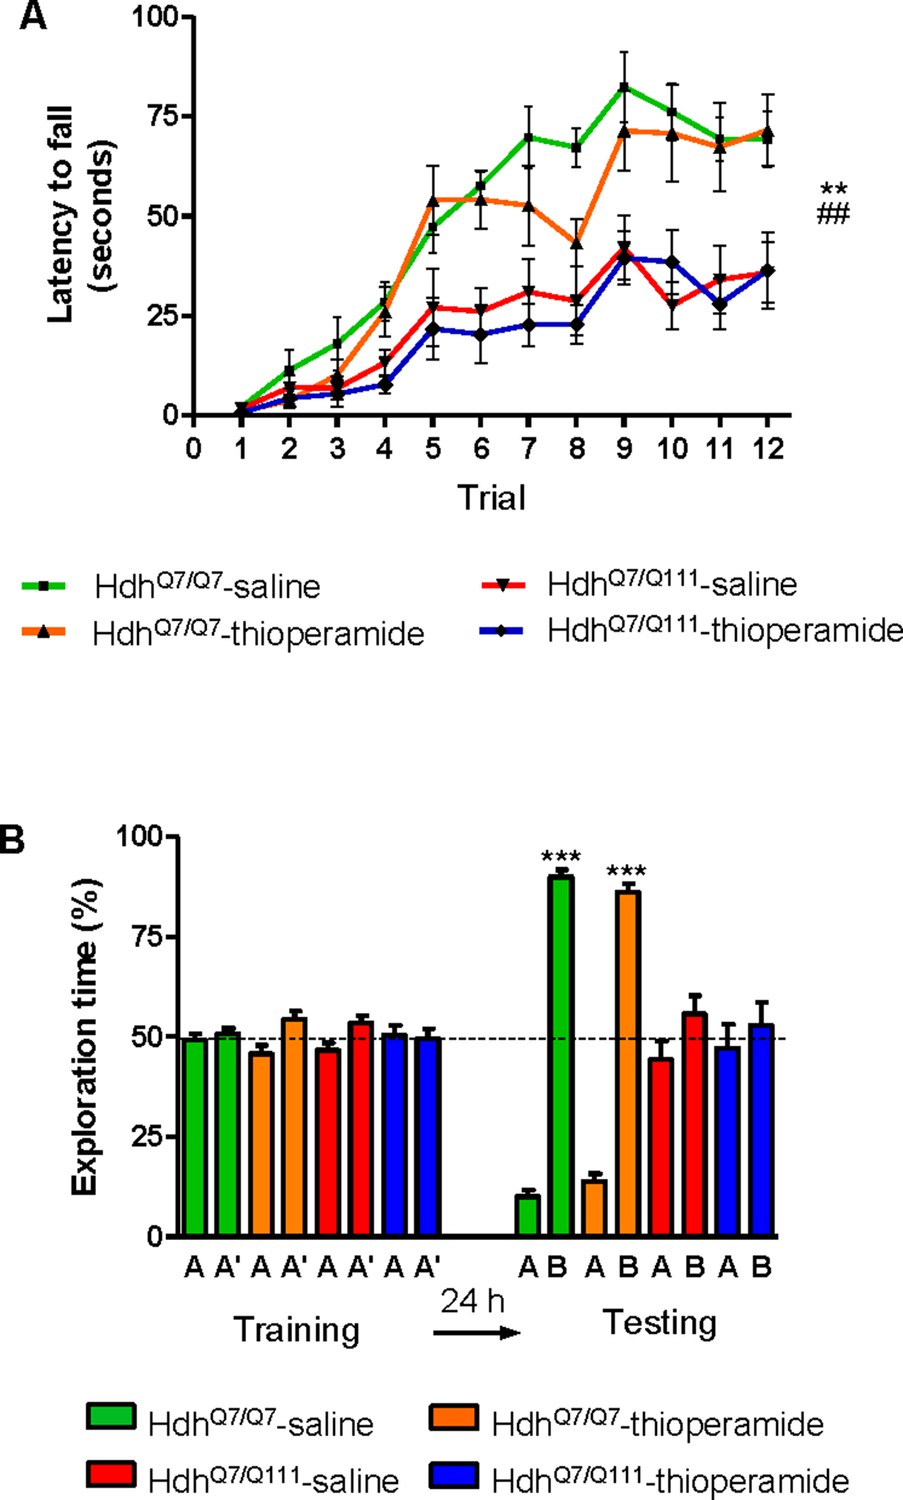
Thioperamide chronic treatment prevents motor learning, long-term memory (LTM) deficits and the loss of receptor heteromerization in 6-month-old HdhQ7/Q111 mice.
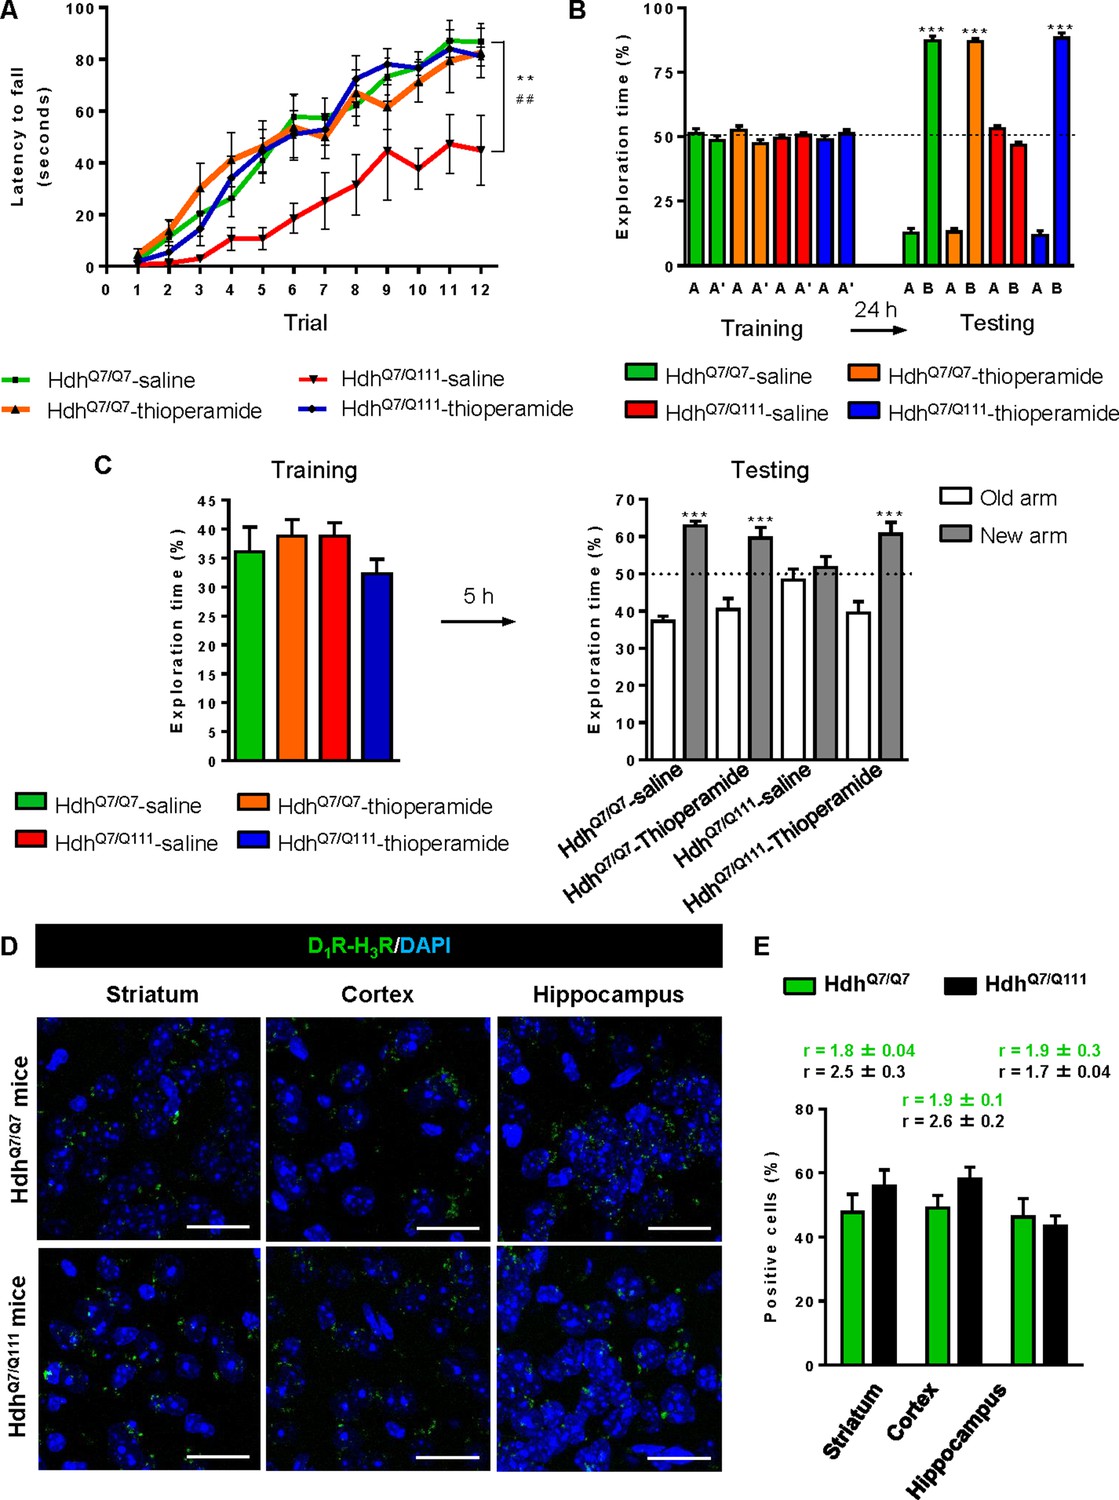
In (A), curves illustrating the latency to fall in the accelerating rotarod of 6-month-old HdhQ7/Q7 and HdhQ7/Q111 mice treated with saline or thioperamide from 5 months of age are shown. In (B), the exploration time for saline or thioperamide-treated HdhQ7/Q7 and HdhQ7/Q111 mice during the training and the testing (24 hr delay, LTM) sessions in a novel-object recognition task showing that long-term recognition memory deficits are rescued in the thioperamide-treated HdhQ7/Q111 mice. One-way ANOVA with Bonferroni post hoc showed significant differences (***p<0.001) compared to the old object recognition. In (C), bar diagram illustrating the exploration time for saline- or thioperamide-treated HdhQ7/Q7 and HdhQ7/Q111 mice during the training and the 5 hr later testing in the T-SAT showing thioperamide reverses spatial long-term memory (LTM) deficits. In (A) to C), 11 saline-treated HdhQ7/Q7 mice, 10 thioperamide-treated HdhQ7/Q7 mice, seven saline-treated HdhQ7/Q111 mice and nine thioperamide-treated HdhQ7/Q111 mice were evaluated at 6 months of age. In (D) PLA were performed in striatal, cortical and hippocampal slices from 6-month-old HdhQ7/Q7 and HdhQ7/Q111 mice treated with thioperamide. D1R-H3R heteromers were visualized in all samples as green spots around blue colored DAPI stained nucleus. Scale bar: 20 μm. In (E) the right panel, the number of cells containing one or more green spots is expressed as the percentage of the total number of cells (blue nucleus). r values (number of green spots/cell containing spots) are shown above each bar. Data (% of positive cells or r) are the mean ± SEM of counts in 600–800 cells from 4 to 8 different fields from three different animals. Student’s t test showed no significant differences in heteromer expression in thioperamide-treated HdhQ7/Q111 mice compared to the respective HdhQ7/Q7 mice.
Figure 4—figure supplement 1
Functional D1R-H3R heteromers are expressed in 5-month-old HdhQ7/Q7 and HdhQ7/Q111 mice.
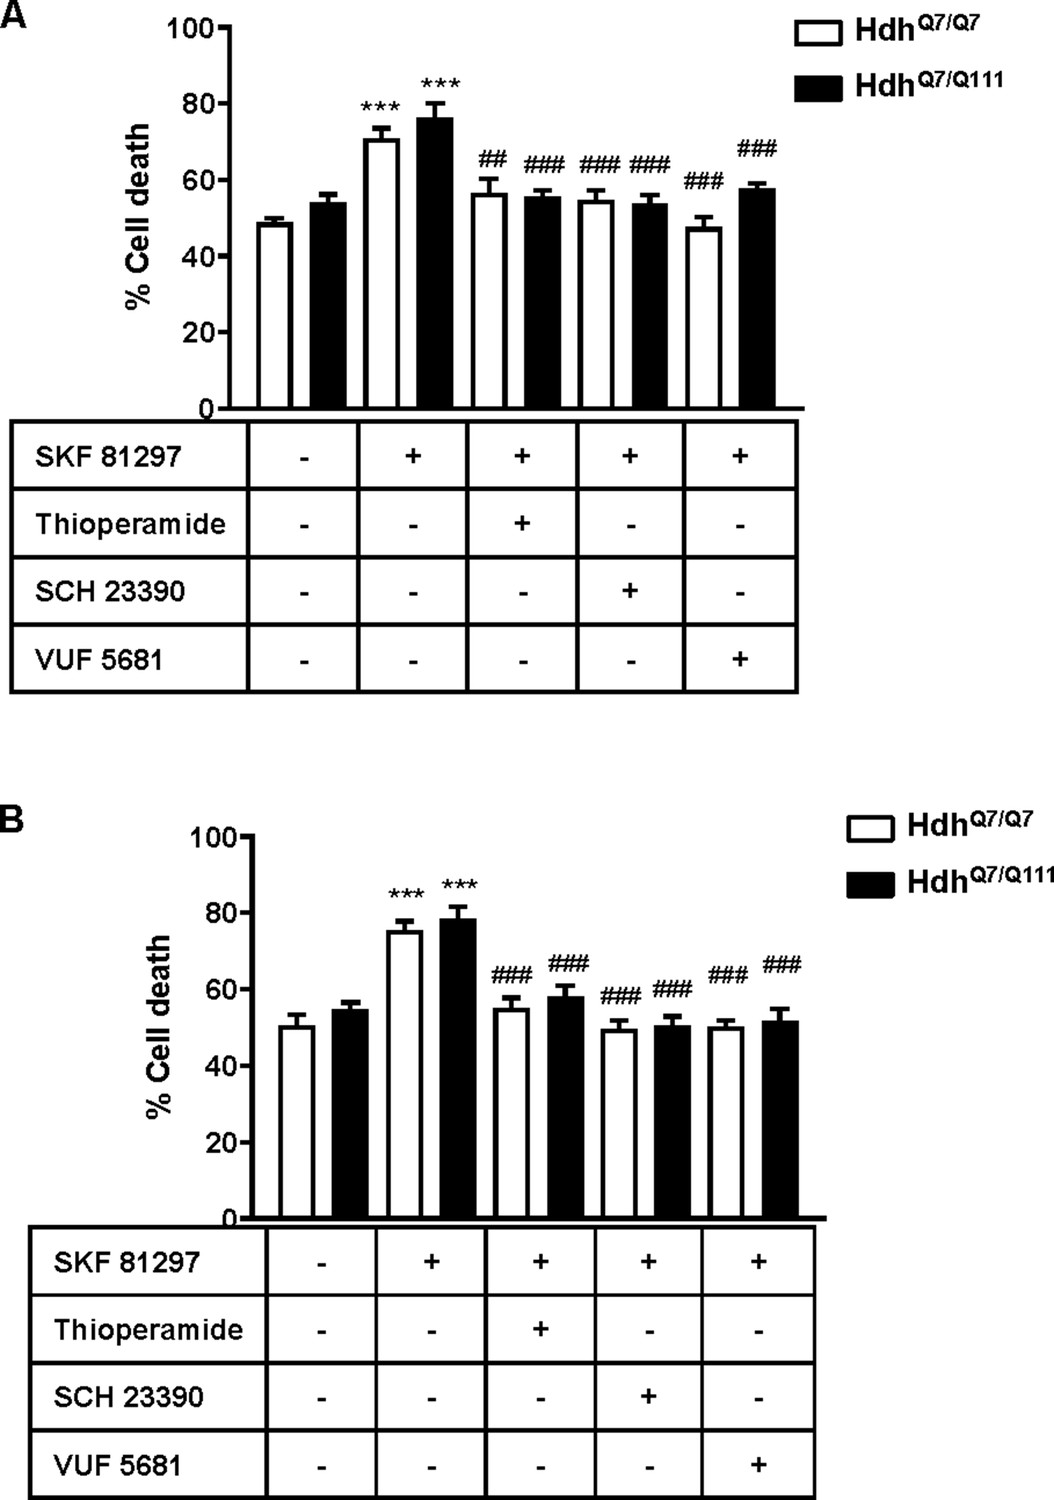
Striatal (A) and cortical (B) organotypic slice cultures from 5-month-old HdhQ7/Q7 and HdhQ7/Q111 mice were pre-treated for 60 min with vehicle, H3R antagonist thioperamide (10 μM), VUF5681 (10 μM) or D1R antagonist SCH 23390 (10 μM) before the addition of SKF 81297 (50 μM) and after 48 h cell death was determined. Values represent mean ± SEM (n = 5 to 8) of percentage of cell death. One-way ANOVA followed by Bonferroni post hoc tests showed a significant effect over vehicle treatment (***p<0.001) or over SKF 81297 treated slices (###p<0.001).
Figure 4—figure supplement 2
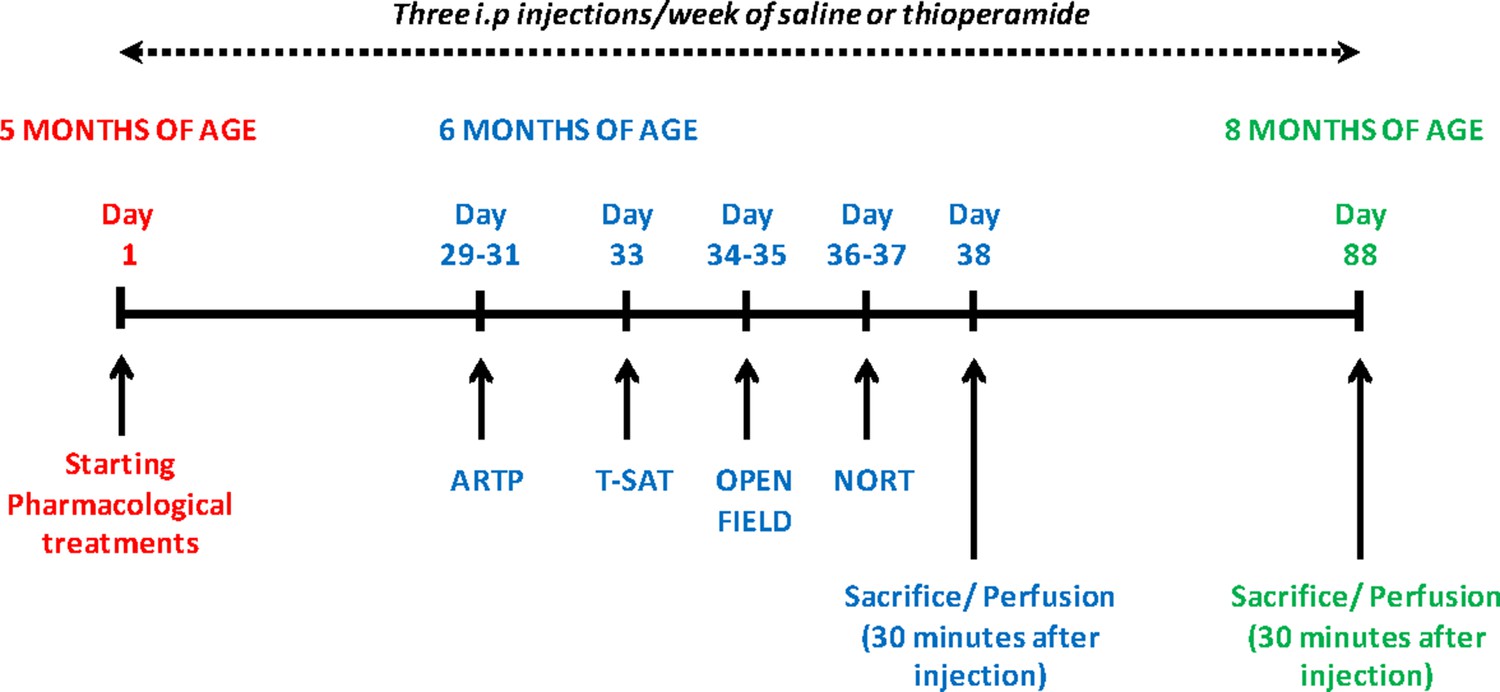
Schematic representation of pharmacological treatments and behavioral analysis performed after chronic treatment with saline or thioperamide.
Three intraperitoneal injections per week of saline (NaCl 0.9% saline) or thioperamide (10 mg/Kg) were performed from 5-month-old to 8-month-old mice when the animals were sacrificed and perfused. Behavioral assessment started at 6 months of age with the evaluation of the ARTP, T-SAT, Open field and NORT. One cohort of animals was sacrificed and perfused 30 min after the last injection to evaluate PLA at 6 months of age. A second cohort of animals was sacrifice and perfused 30 min after the last injection to evaluate PLA at 8 months of age.
Figure 4—figure supplement 3
No significant differences in the open field habituation were found between treatments and genotypes.
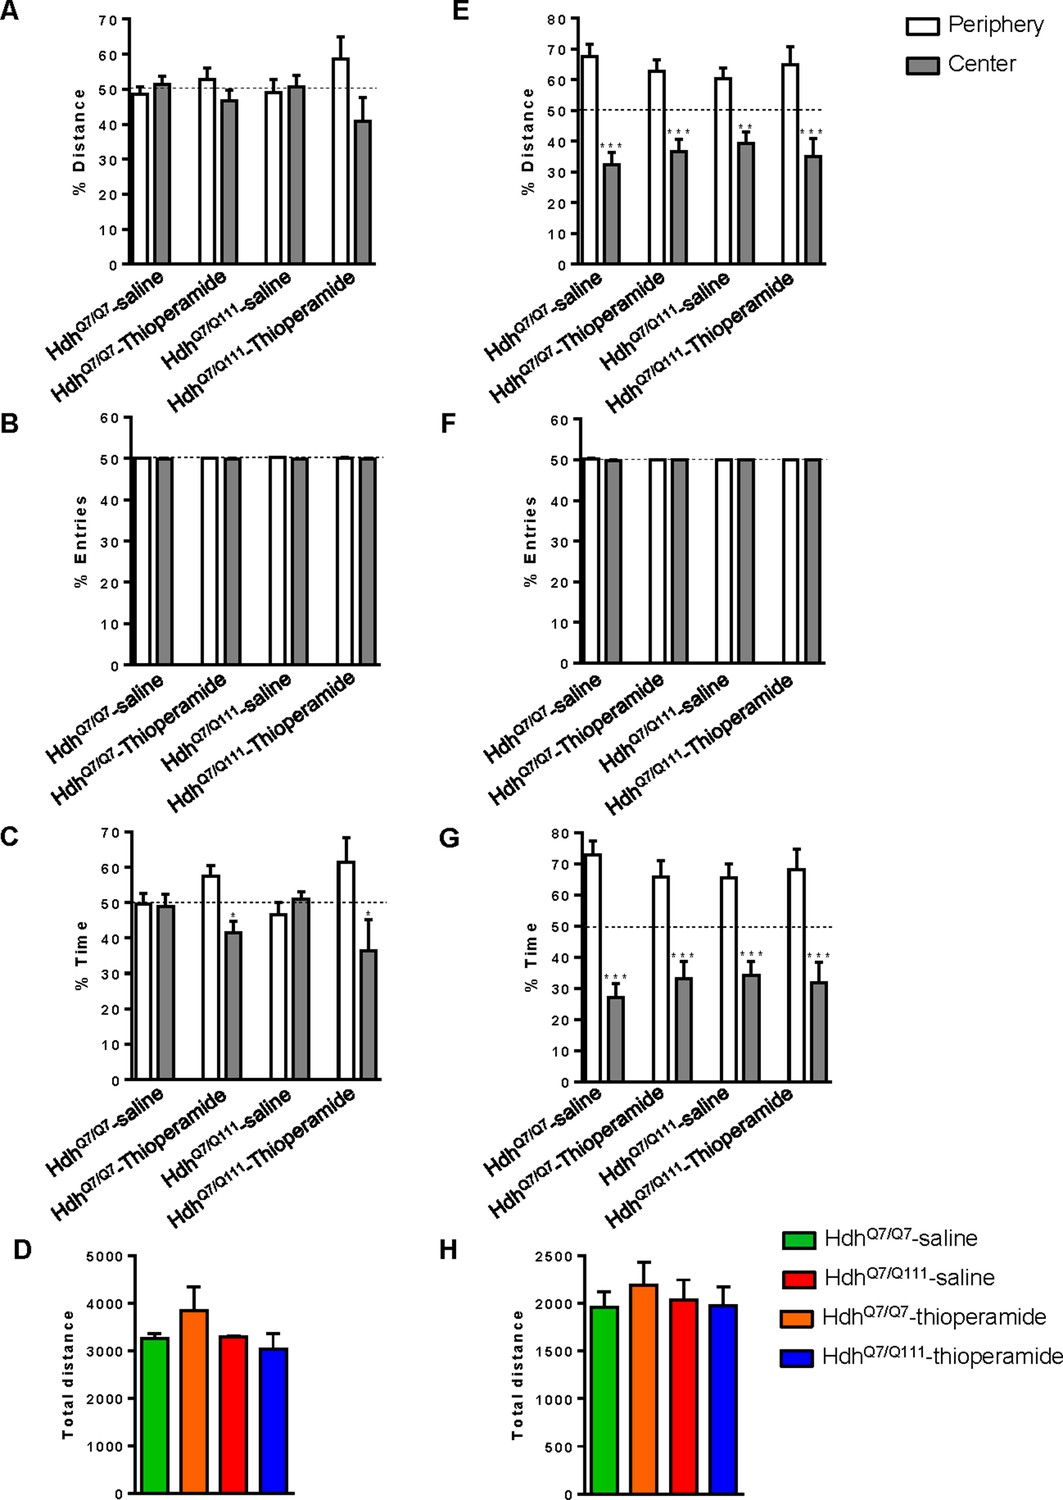
Motivation and anxiety differences between genotypes and treatments were analyzed by measuring the percentage of distance (A and E), the percentage of entries (B and F) and the percentage of time (C and G) between the periphery and the center in the open field arena at the first (A, B and C) or second (E, F and G) day of habituation in the open field arena. The spontaneous locomotor activity differences between genotypes and treatments were analyzed by measuring the total distance rove for each animal at first (D) or second (H) day of habituation in the open field arena. After two days of habituation in the open field arena, all mice behave equal. Data represents mean ± SEM. Statistical analysis was performed using one-way ANOVA with Bonferroni post hoc comparisons; *p<0.05, ***p<0.001 compared to the periphery.
Figure 4—figure supplement 4
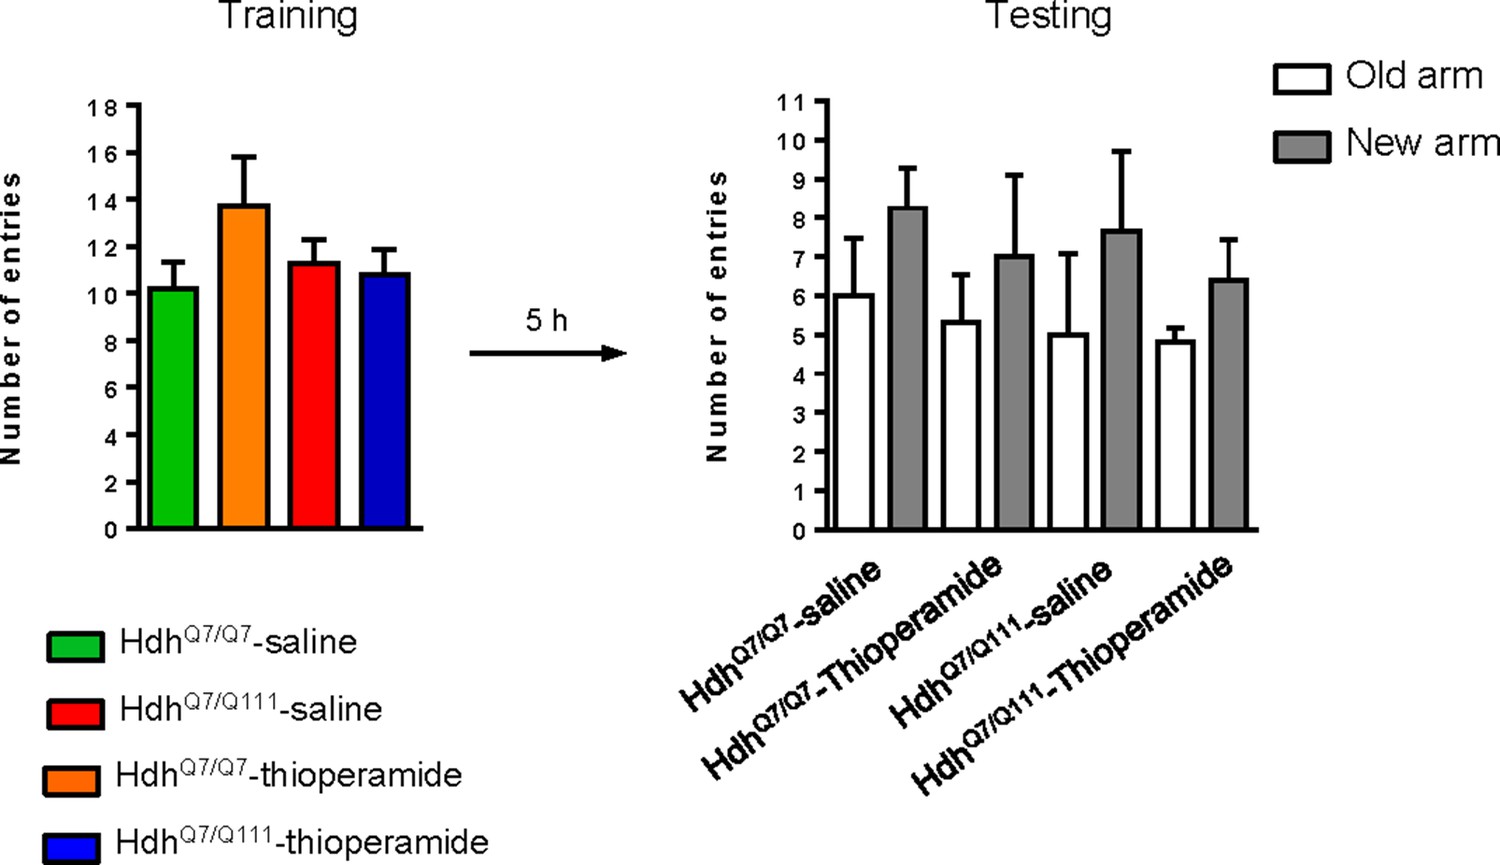
Training session in the T-SAT showed similar number of arm entries in all genotypes and treatments.
6-month-old HdhQ7/Q7 and HdhQ7/Q111 mice following the injection protocol in Figure 4—figure supplement 2 showed no differences in spontaneous locomotor activity or anxiogenic components in training sessions of the T-maze. 11 saline-treated HdhQ7/Q7 mice, 10 thioperamide-treated HdhQ7/Q7 mice, seven saline-treated HdhQ7/Q111 mice and nine thioperamide-treated HdhQ7/Q111 mice were evaluated. Data represents mean ± SEM.
Figure 4—figure supplement 5
Expression of D1R-H3R heteromers in 8-month-old HdhQ7/Q7 and HdhQ7/Q111 mice chronically treated with thioperamide.
In (A), Proximity Ligation Assays (PLA), were performed in striatal, cortical and hippocampal slices. D1R-H3R heteromers were visualized as green spots around blue colored DAPI stained nucleus in 8-month-old HdhQ7/Q7 and HdhQ7/Q111 mice chronically treated with thioperamide. Scale bar: 20 μm. In (B), the number of cells containing one or more green spots is expressed as the percentage of the total number of cells (blue nucleus). r values (number of green spots/cell containing spots) are shown above each bar. Data (% of positive cells or r) are the mean ± SEM of counts in 600–800 cells from 4 to 8 different fields from three different animals. Student’s t test showed no significant differences in D1R-H3R heteromer expression in thioperamide-treated HdhQ7/Q111 mice compared to the respective HdhQ7/Q7 mice.
Figure 5 with 1 supplement

Thioperamide treatment restored spinophilin-immunoreactive puncta reduction in the hippocampus and motor cortex of HdhQ7/Q111 mice and exerts no effect on the clearance of mutant huntingtin accumulation.
In (A) spinophilin-immunoreactive puncta were counted in the stratum oriens and stratum radiatum of CA1 hippocampus and in (B) layers I, II/III and V of motor cortex area 1 (M1) of saline and thioperamide-treated HdhQ7/Q7 and HdhQ7/Q111 mice. Quantitative analysis is shown as mean ± SEM (n = 9 images from three animals/group). Statistical analysis was performed using Student’s two-tailed t test. *p<0.05, ***p<0.001 compared to saline-treated HdhQ7/Q7 mice. #p<0.05, ##p<0.01, ###p<0.001 compared to saline-treated HdhQ7/Q111 mice. In (C), Quantification of the protein levels of insoluble mHtt oligomeric forms and soluble mHtt forms of total striatal, hippocampal and cortical extracts from 6-month-old saline and thioperamide-treated HdhQ7/Q111 mice analysed by immunoblot. All histograms represent the mean ± SEM (n = 6–8 per group). Student’s t test showed no significant differences between groups.
Figure 5—figure supplement 1
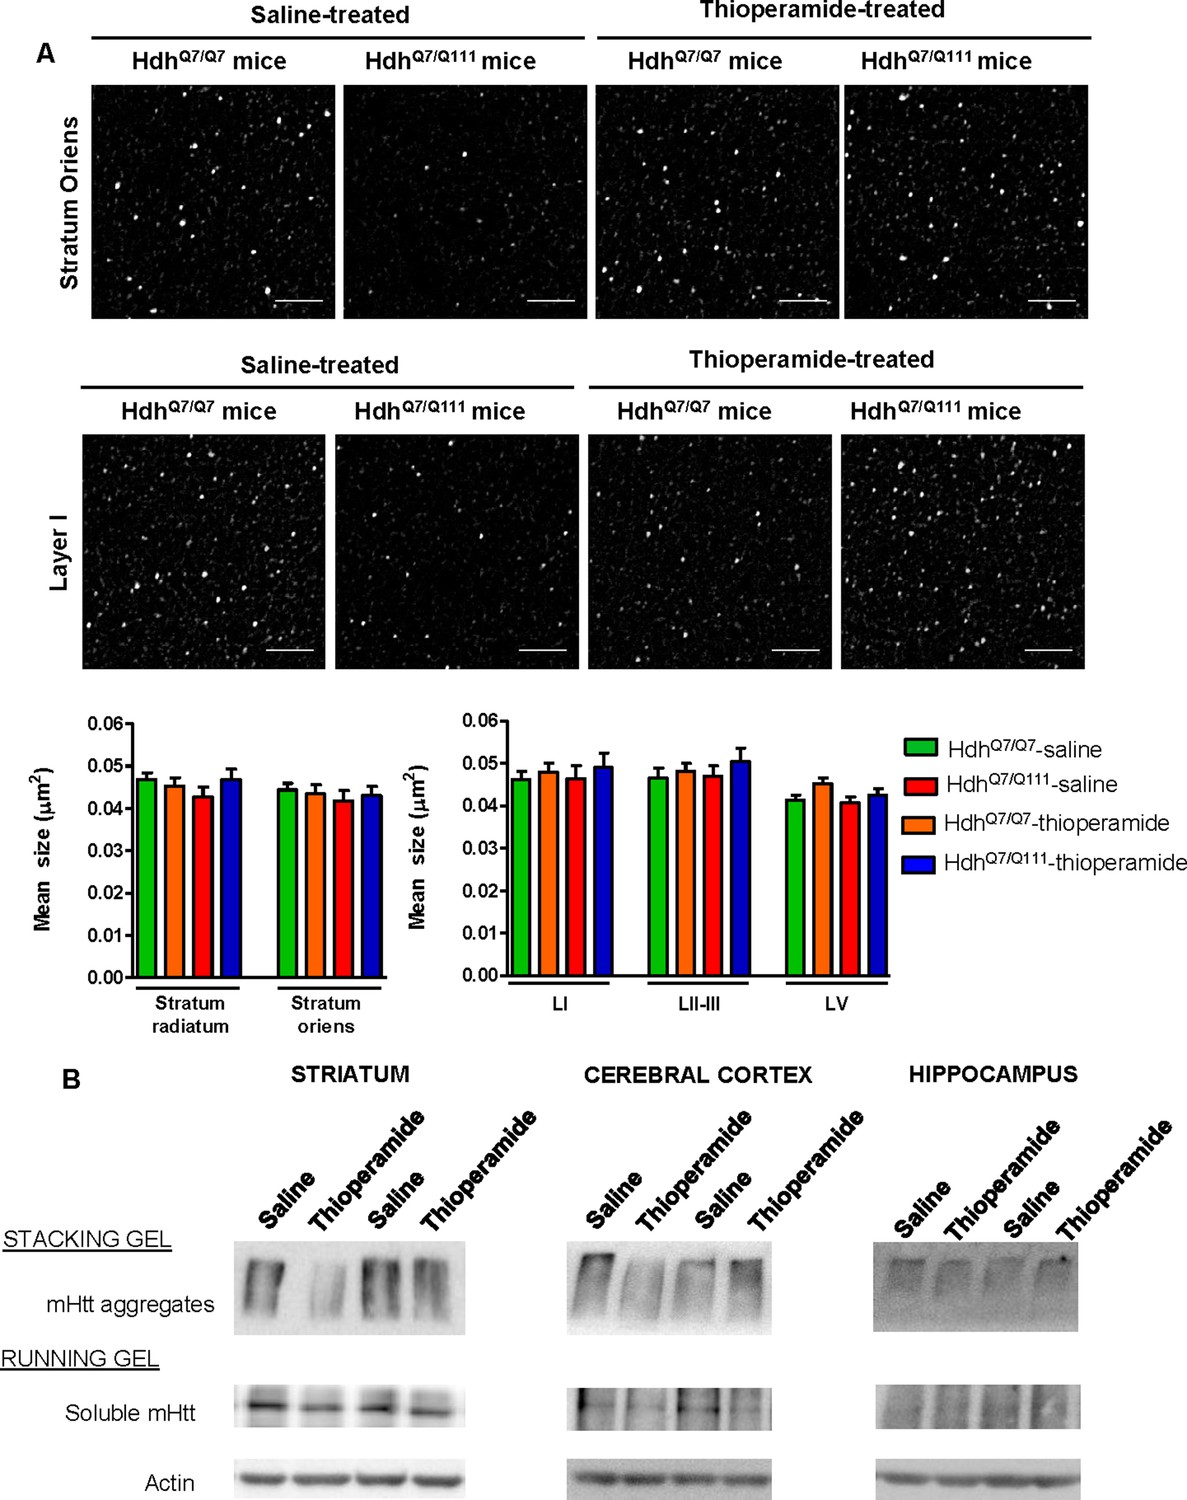
Biochemical and Pathological Effects of Thioperamide treatment.
In (A), representative images showing spinophilin-immunoreactive puncta in the stratum oriens of CA1 hippocampus and in layer I of motor cortex area 1 (M1) of saline and thioperamide-treated HdhQ7/Q7 and HdhQ7/Q111 mice at 6 months of age. Quantitative analysis of the mean size of spinophilin-immunoreactive puncta in the stratum radiatum and stratum oriens of CA1 hippocampus and in layers I, II-III and V of motor cortex area 1 (M1) are shown as mean ± SEM (n = 9 images from three animals/group). Statistical analysis was performed using Student’s two-tailed t test. No significant differences were found. Scale bar: 5 μm. In (B), Representative western blots of total striatal, hippocampal and cortical extracts from 6-month-old saline and thioperamide-treated HdhQ7/Q111 mice. The blots were probed with 1C2 antibody for mutant huntingtin (mHtt). In samples from both saline and thioperamide-treated HdhQ7/Q111 mice insoluble oligomeric forms of mHtt were detected in the stacking gel and soluble forms were detected in the running gel.
Figure 6
Thioperamide chronic treatment does not prevent motor learning and long-term memory (LTM) deficits in 8-month-old HdhQ7/Q111 mice when the D1R-H3R heteromer is not expressed.
In (A), curves illustrating the latency to fall in the accelerating rotarod of 8-month-old HdhQ7/Q7 and HdhQ7/Q111 mice treated with saline or thioperamide from 7 months of age are shown. Two-way ANOVA with repeated measures showed significant differences (**p<0.01) of saline-treated HdhQ7/Q111 mice compared to saline-treated HdhQ7/Q7 mice or (##p<0.01) thioperamide-treated HdhQ7/Q111 mice compared to saline-treated HdhQ7/Q7 mice. 11 saline-treated HdhQ7/Q7 mice, 11 thioperamide-treated HdhQ7/Q7 mice, eight saline-treated HdhQ7/Q111 mice and nine thioperamide-treated HdhQ7/Q111 mice were evaluated at 8 months of age. In (B), bar diagram illustrating the exploration time for saline or thioperamide-treated HdhQ7/Q7 and HdhQ7/Q111 mice during the training and the testing (24 hr delay, LTM) sessions in a novel-object recognition task showing that long-term recognition memory deficits are not rescued in the thioperamide-treated HdhQ7/Q111 mice. One-way ANOVA with Bonferroni post hoc comparisons showed significant differences (***p<0.001) compared to the old object recognition. 11 saline-treated HdhQ7/Q7 mice, 12 thioperamide-treated HdhQ7/Q7 mice, 10 saline-treated HdhQ7/Q111 mice and 11 thioperamide-treated HdhQ7/Q111 mice were evaluated at 8 months of age.
Figure 7 with 1 supplement
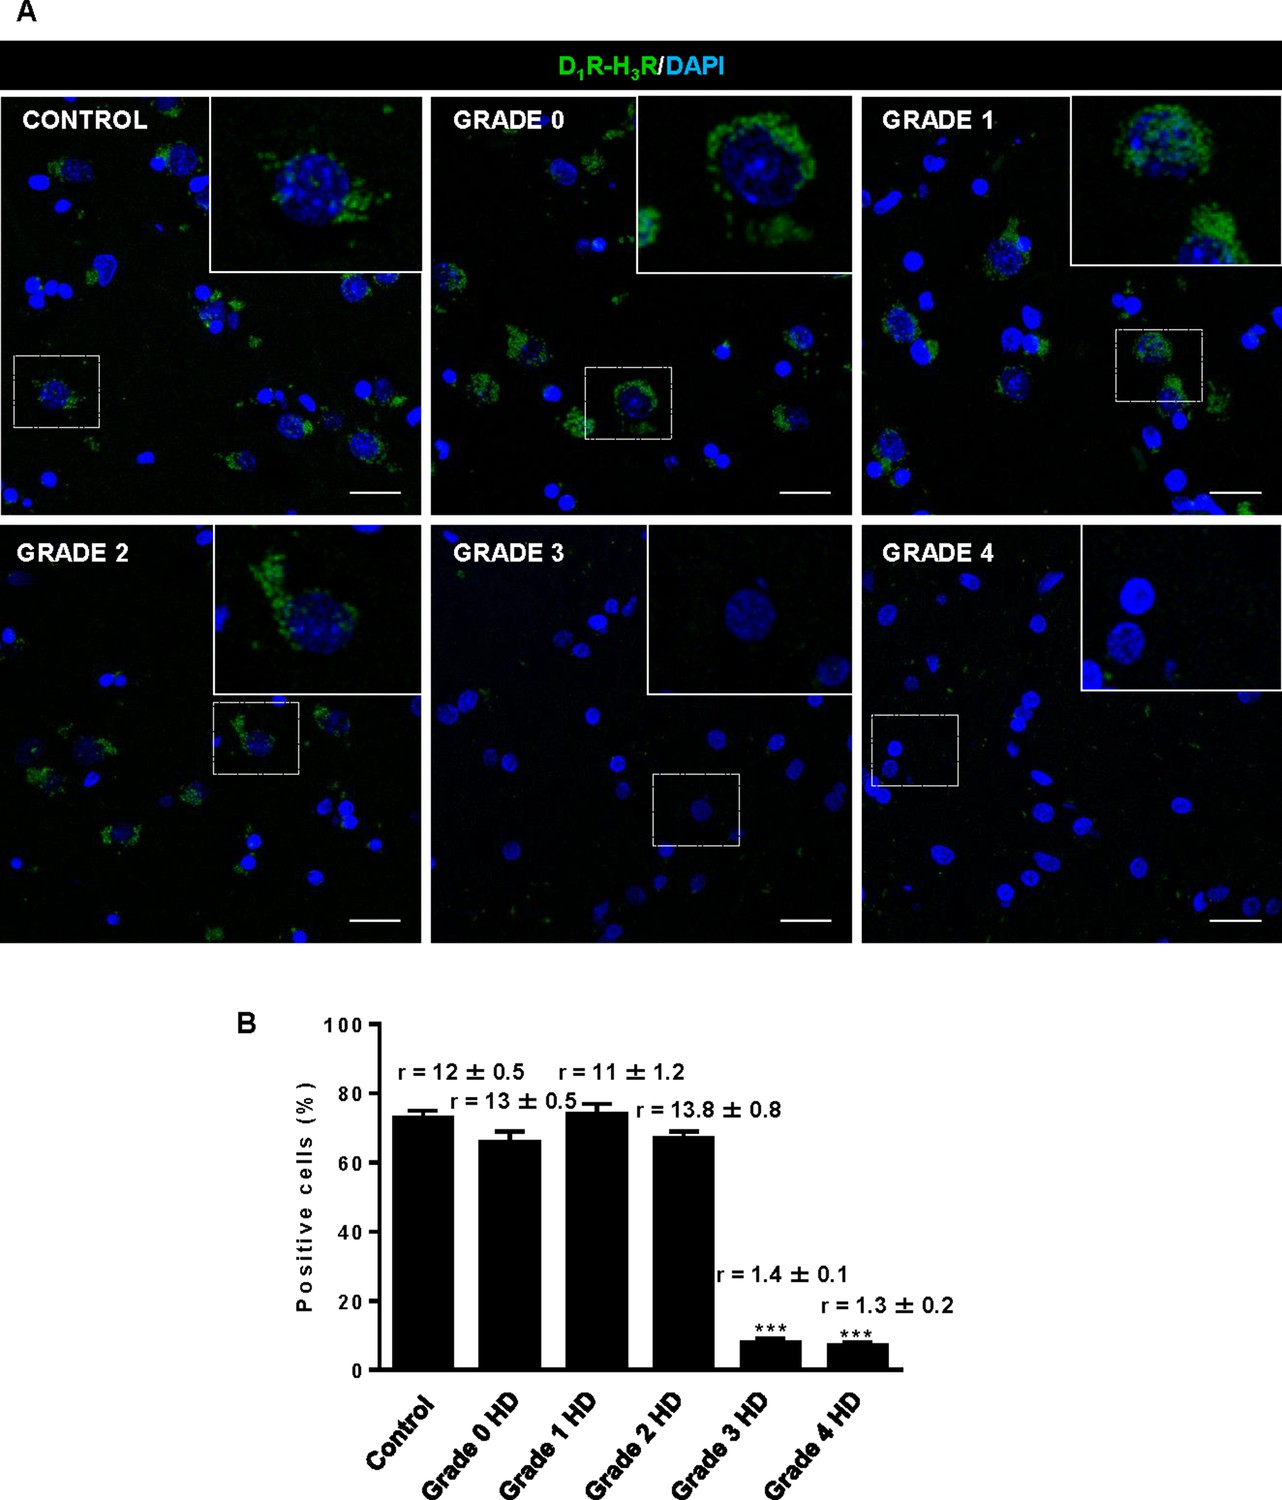
Striatal D1R-H3R heteromers are expressed in human control subjects and grade 2 HD patients but not in grade 3–4 HD patients.
In (A), by Proximity Ligation Assays (PLA), D1R-H3R heteromers were visualized as green spots around blue colored DAPI stained nucleus in human striatal slices from age matched control subjects and 0–2 grade HD patients but not in 3–4 grade HD patients. Scale bar: 20 μm. In (B), the number of cells containing one or more green spots is expressed as the percentage of the total number of cells (blue nucleus). r values (number of green spots/cell containing spots) are shown above each bar. Data are mean ± SEM of counts in 600–800 cells from 10 different fields from subject described in Materials and Methods. Student’s t test showed a significant (***p<0.001) decrease of heteromers expression in 3–4 grade HD patients compared to control subjects.
Figure 7—figure supplement 1
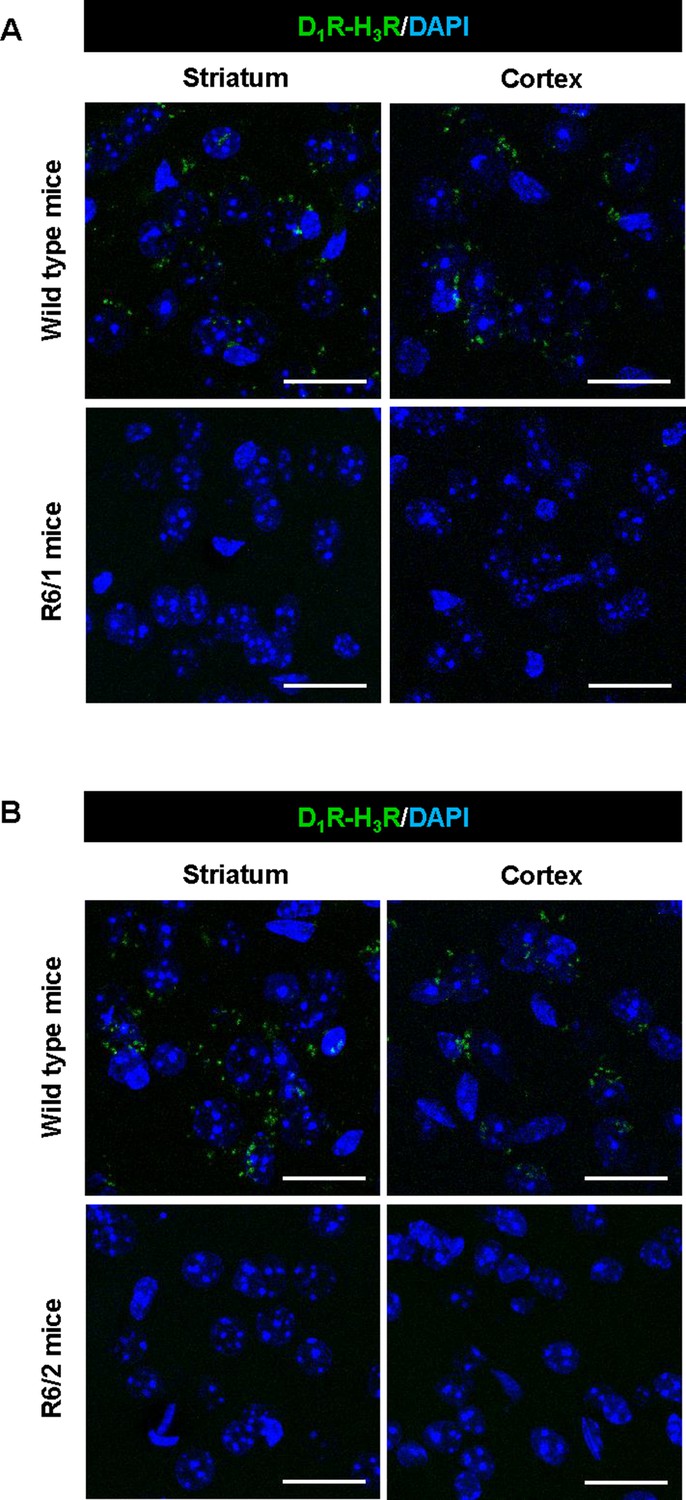
D1R-H3R heteromer are not expressed in HD R6/1 and R6/2 mouse models.
Proximity Ligation Assays (PLA) were performed using striatal or cortical slices from age matched wild type littermates (WT) and 4-month-old R6/1 (A) or 8-week-old R6/2 mice (B). D1R-H3R heteromers were visualized only in wild-type mouse slices as green spots around blue colored DAPI stained nucleus. Scale bar: 20 μm.
Tables
Key resources table
| Reagent type (species) or resource | Designation | Source or reference | Identifiers | Additional information |
|---|---|---|---|---|
| Cell line (H. sapiens) | HEK293 (Human embryonic kidney293 cells) | American Type Culture Collection | ||
| Cell line (M. musculus) | STHdhQ7; STHdhQ111(mouse striatal neuronal progenitor cells) | Dr M Macdonald (Center for Genomic Medicine, Boston, USA) | ||
| Strain, strain background (Mus musculus) | HdhQ7/Q111; HdhQ7/Q7 | Dr M Macdonald (Center for Genomic Medicine, Boston, USA) | HdhQ111 MGI:1861935 | |
| Strain, strain background (Mus musculus) | R6/1; R6/2 | The Jackson Laboratory (Bar Harbor, ME, USA) | R6/1: MGI:2389466 For R6/2: MGI:2386951 | |
| Strain, strain background (H. sapiens) | Post-mortem human brain sections containing caudate-putamen | Tissue Bank at Hospital Universitario Fundación Alcorcón (Madrid, Spain) Netherlands Brain Bank (Amsterdam, The Netherlands) | For details and characteristics of human samples see: “Moreno E., et al., Neuropsychopharmacology. 2018 PMID:28102227’ | |
| Antibody | anti-D1R (guinea pig) | Frontier Institute | Cat. # D-1R-GP-Af500 RRID:AB_2571595 | Dilution: 1/200; 1/100 |
| Antibody | anti-H3R (rabbit polyclonal) | Alpha diagnostic | Cat. # H3R31-A RRID:AB_1617140 | Dilution: 1/200 |
| Antibody | goat Alexa Fluor 488 anti-guinea pig antibody | Jackson Immunoresearch Laboratories | Cat. #106-545-003 RRID:AB_2337438 | Dilution: 1/100 |
| Antibody | anti-phospho-p38 MAPK (Thr180/Tyr182) (rabbit polyclonal) | Cell Signaling | Cat. #9211S RRID:AB_331641 | Dilution: 1/1,000 |
| Antibody | anti-β-tubulin (mouse monoclonal) | Sigma | Cat# SAB4200715 RRID:AB_2827403 | Dilution: 1/10,000 |
| Antibody | IRDye 680 goat anti-rabbit antibody | Li-cor | Cat. #926–68071 RRID:AB_10956166 | Dilution: 1/10,000 |
| Antibody | IRDye 800 goat anti-mouse antibody | Li-cor | Cat. # 926–32210 RRID:AB_621842 | Dilution: 1/10,000 |
| Antibody | anti-spinophilin (rabbit polyclonal) | Millipore | Cat# 06–852 RRID:AB_310266 | Dilution: 1/250 |
| Antibody | Cy3 anti-rabbit secondary antibodies | Jackson ImmunoResearch Laboratories | Cat# 111-165-003 RRID:AB_2338000 | Dilution: 1/200 |
| Antibody | Anti-1C2 (mouse monoclonal) | Millipore | Cat# MAB1574 RRID:AB_94263 | Dilution: 1/1,000 |
| Recombinant DNA reagent | Clone V3LHS_638095 | Thermo Scientific | ||
| Recombinant DNA reagent | Clone V3LHS_638091 | Thermo Scientific | ||
| Recombinant DNA reagent | psPAX2 | Addgene#12260 | ||
| Recombinant DNA reagent | pMD2.G | Addgene#12259 | ||
| Recombinant DNA reagent | RHS4346 | Thermo Scientific | ||
| Recombinant DNA reagent | H3R-shRNA and control-shRNA | This study | See Materials and methods | |
| Sequence-based reagent | RT-qPCR primers | This study | See Materials and methods | |
| Peptide, recombinant protein | TAT-TM peptides | This study | See Materials and methods | |
| Commercial assay or kit | Duolink II in situ PLA detection reagent red Kit | Sigma | Cat. #DUO92008 | |
| Commercial assay or kit | Duolink II PLA probe anti-guinea pig minus | Sigma | Cat. #DUO92010 | |
| Commercial assay or kit | Duolink II PLA probe anti-rabbit plus | Sigma | Cat. #DUO92002 RRID:AB_2810940 | |
| Commercial assay or kit | High Capacity cDNA Reverse Transcription Kit | Applied Biosystems | Cat. #4368814 | |
| Commercial assay or kit | Amplified Luminiscent Proximity Homogeneous Assay kit | AlphaScreen SureFire p‐ERK 1/2 (Thr202/Tyr204) Assay Kits PerkinElmer | Cat. # TGRESB | |
| Commercial assay or kit | [3H] SCH 23390 | PerkinElmer | Cat. # NET930 | 0.02 nM to 10 nM |
| Commercial assay or kit | [3H] R-α-methyl histamine | Perkinelmer | Cat. # NET1027 | 0.1 nM to 20 nM |
| Commercial assay or kit | SB 203580 | Tocris | Cat. # 1402 | 1 μM; 10 μM (see Materials and methods) |
| Commercial assay or kit | SKF 81297 | Tocris | Cat. # 1447 | 100 nM; 1 μM; 30 μM; 50 μM (see Materials and methods) |
| Commercial assay or kit | SCH 23390 | Tocris | Cat. # 0925 | one to 50 μM(see Materials and methods) |
| Commercial assay or kit | Thioperamide maleate salt | Sigma-Aldrich | Cat. #T123 | 10 μM (cells) 10 mg/kg (mice) |
| Software, algorithm | Grafit | Erithacus (http://www.erithacus.com/grafit/) | ||
| Software, algorithm | ImageJ | ImageJ (https://imagej.nih.gov/ij/) | RRID:SCR_003070 | |
| Software, algorithm | SMART junior | Panlab (http://www.panlab.com/panlabWeb/Software/php/displaySoft.php?nameSoft=SMART JUNIOR) | RRID:SCR_012154 | |
| Software, algorithm | GraphPad Prism | GraphPad Prism (https://www.graphpad.com/) | RRID:SCR_015807 | Version 6 |
Additional files
-
Supplementary file 1
H3R and D1R binding parameters in STHdhQ7, STHdhQ111 cells.
Striatal cells were homogenized in 50 mM Tris-HCl buffer and ligand binding was performed with membrane suspension (see materials and methods). Binding parameters from saturation and competition curves were obtained using Grafit software by fitting the binding data to the equation previously deduced (equation (3) in Gracia et al., 2013. Data are mean ± SEM of experiments performed per triplicate.
- https://cdn.elifesciences.org/articles/51093/elife-51093-supp1-v2.docx
-
Supplementary file 2
H3R and D1R binding parameters in different brain regions from 8-month-old HdhQ7/Q7 and HdhQ7/Q111 mice.
Mouse striatal, cortical or hippocampal tissue were homogenized in 50 mM Tris-HCl buffer and ligand binding was performed with membrane suspension (see online methods). Binding parameters from saturation and competition curves were obtained using Grafit software by fitting the binding data to the equation previously deduced (equation (3) in Gracia et al., 2013. Data are mean ± SEM of experiments performed per triplicate (n = 6 HdhQ7/Q7 and n = 5 HdhQ7/Q111).
- https://cdn.elifesciences.org/articles/51093/elife-51093-supp2-v2.docx
-
Supplementary file 3
H3R and D1R mRNA expression levels the striatum of 4- and 8-month-old HdhQ7/Q7 and HdhQ7/Q111 mice.
RT-PCR was performed in striatal extracts from HdhQ7/Q7 and HdhQ7/Q111 at 4 and 8 months of age as described in materials and methods. Results were normalized to actin gene expression. Data represent mean ± SEM (n = 3–4) of experiments performed in duplicate and are expressed as fold change of wild-type animals. Student’s two-tailed t test was performed.
- https://cdn.elifesciences.org/articles/51093/elife-51093-supp3-v2.docx
-
Transparent reporting form
- https://cdn.elifesciences.org/articles/51093/elife-51093-transrepform-v2.docx
Download links
A two-part list of links to download the article, or parts of the article, in various formats.
Downloads (link to download the article as PDF)
Open citations (links to open the citations from this article in various online reference manager services)
Cite this article (links to download the citations from this article in formats compatible with various reference manager tools)
Modulation of dopamine D1 receptors via histamine H3 receptors is a novel therapeutic target for Huntington's disease
eLife 9:e51093.
https://doi.org/10.7554/eLife.51093


