An adjunctive therapy administered with an antibiotic prevents enrichment of antibiotic-resistant clones of a colonizing opportunistic pathogen
- Center for Infectious Disease Dynamics, Department of Biology, The Pennsylvania State University, United States
- Division of Infectious Diseases, Department of Internal Medicine, University of Michigan, United States
- Department of Biochemistry and Molecular Biology, The Pennsylvania State University, United States
- Department of Chemistry, The Pennsylvania State University, United States
- Department of Clinical Pharmacy, College of Pharmacy, University of Michigan, United States
- Huck Institutes for the Life Sciences, The Pennsylvania State University, United States
- Department of Entomology, The Pennsylvania State University, United States
Figures
Figure 1
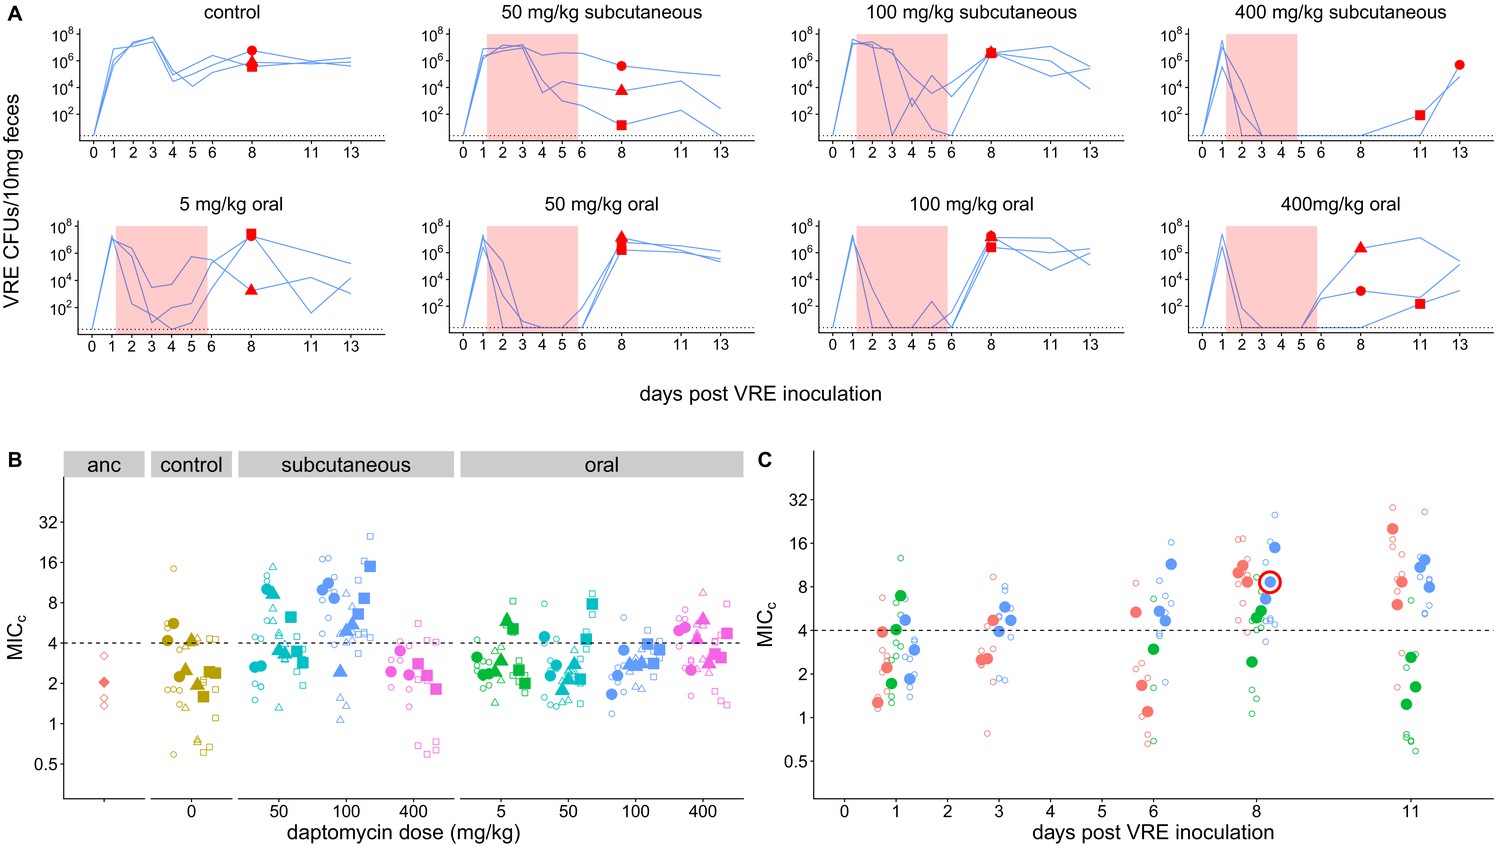
Emergence of daptomycin-resistant VR E. faecium in mouse GI tracts following subcutaneous daptomycin treatment.
(A) VR E. faecium densities in fecal samples during and after daptomycin treatment (strain BL00239-1). Each line represents VR E. faecium densities from an individual mouse (N = 3 per treatment). The pink shaded region indicates days of daptomycin therapy. The dotted line marks the detection limit. Red dots indicate time points where clones were isolated for analysis shown in Panel B. The 400 mg/kg subcutaneous treatment was discontinued after 4 days due to apparent toxicity, and one mouse in this treatment was euthanized at Day 4. (B) Following daptomycin treatment, three VR E. faecium clones were isolated from the feces of each mouse. Filled points show the mean of triplicate daptomycin susceptibility (MICC) measurements for each clone, and open points show the individual measurements. Point shape indicates the mouse of origin. The dashed line marks the clinical breakpoint for daptomycin susceptibility. The ancestral clone (BL00239-1) used to inoculate mice is also shown. (C) For the 100 mg/kg subcutaneous treatment, VR E. faecium clones were isolated from each mouse at multiple time points. Filled points show the mean of triplicate daptomycin susceptibility (MICC) measurements for each clone, and open points show individual measurements. Color indicates mouse of origin. The dotted line marks the clinical breakpoint for daptomycin susceptibility. The resistant clone used in subsequent experiments (BL00239-1-R) is circled in red.
-
Figure 1—source data 1
VR E. faecium fecal density data (Figure 1A).
- https://cdn.elifesciences.org/articles/58147/elife-58147-fig1-data1-v1.zip
-
Figure 1—source data 2
MIC data (Figure 1B–C).
- https://cdn.elifesciences.org/articles/58147/elife-58147-fig1-data2-v1.zip
Figure 2 with 1 supplement

Subcutaneous daptomycin treatment selects for resistance in the GI tract.
(A-B) Mouse fecal suspensions were plated on Enterococcus-selective plates with daptomycin (+ DAP) and without daptomycin (- DAP) at Day 8 (A) and Day 14 (B). Each filled point represents the mean of triplicate measures from a single mouse sample, and open points show individual measurements. Mice were treated with daptomycin for 5 days (triangles) or 10 days (squares) at the doses listed at times denoted (gray crosses in C; N = 5 mice per treatment). Samples with VR E. faecium density <3×10³ CFU/10 mg feces were not plated for this assay due to insufficient bacterial density. (C) Recovered fecal daptomycin measured by LC-MS for a subset of mice. Each line tracks daptomycin measurements from a single mouse sampled at Days 2, 6, and 8. (D) For the subset of fecal samples analyzed by LC-MS, fecal daptomycin plotted against fecal VR E. faecium densities (samples from all available treatments and time points plotted together). Dotted line indicates the MIC of the susceptible strain BL00239-1 (MIC = 2 µg/mL or 2 µg/g).
-
Figure 2—source data 1
VR E. faecium daptomycin susceptibility data (Figure 2A–B).
- https://cdn.elifesciences.org/articles/58147/elife-58147-fig2-data1-v1.zip
-
Figure 2—source data 2
Fecal daptomycin concentration data (Figure 2C–D).
- https://cdn.elifesciences.org/articles/58147/elife-58147-fig2-data2-v1.zip
Figure 2—figure supplement 1
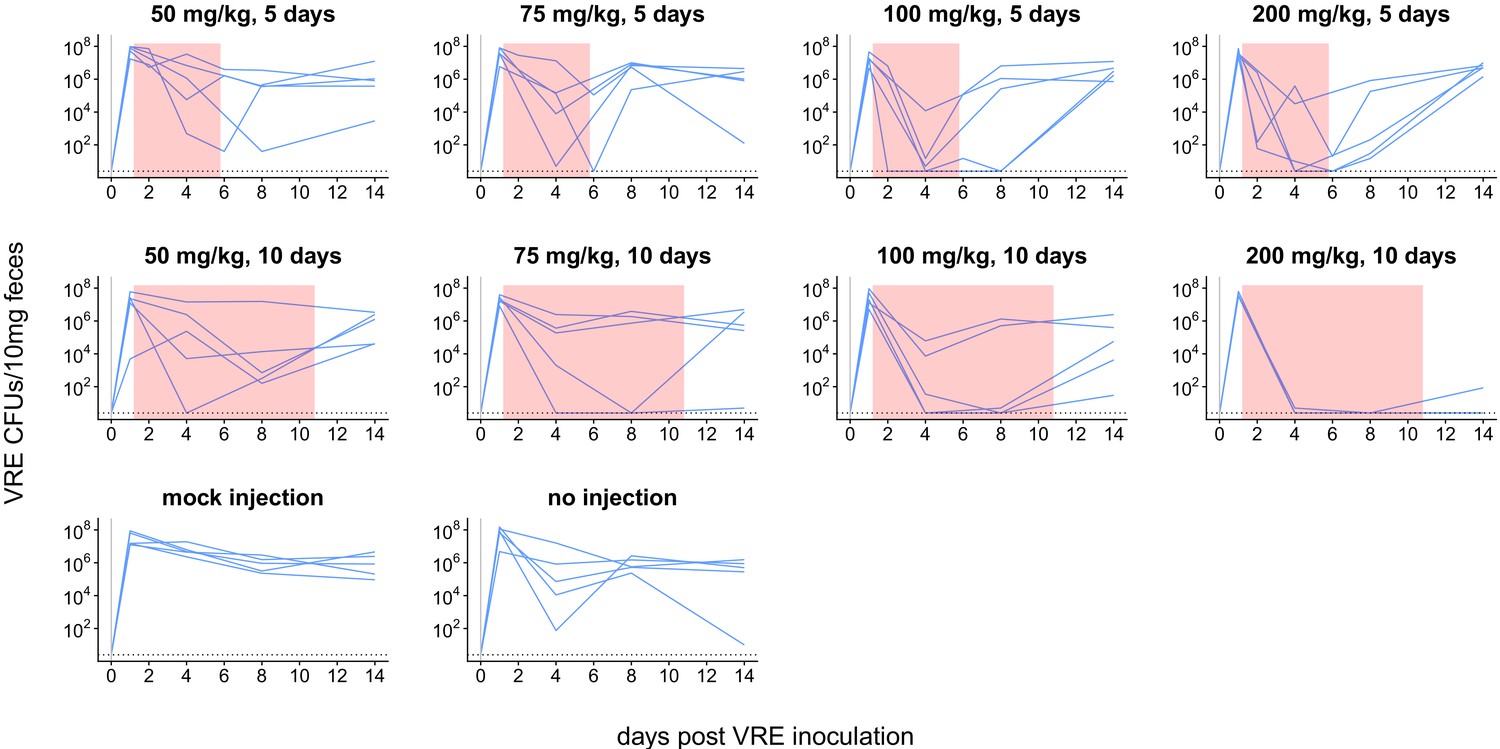
Dynamics of VRE shedding for experiment shown in Figure 2.
Subcutaneous daptomycin dose and treatment durations are listed above each panel. Each line represents VRE densities from an individual mouse (N = 5 per treatment). The pink shaded region indicates days of daptomycin therapy. The horizontal line marks the detection limit.
Figure 3
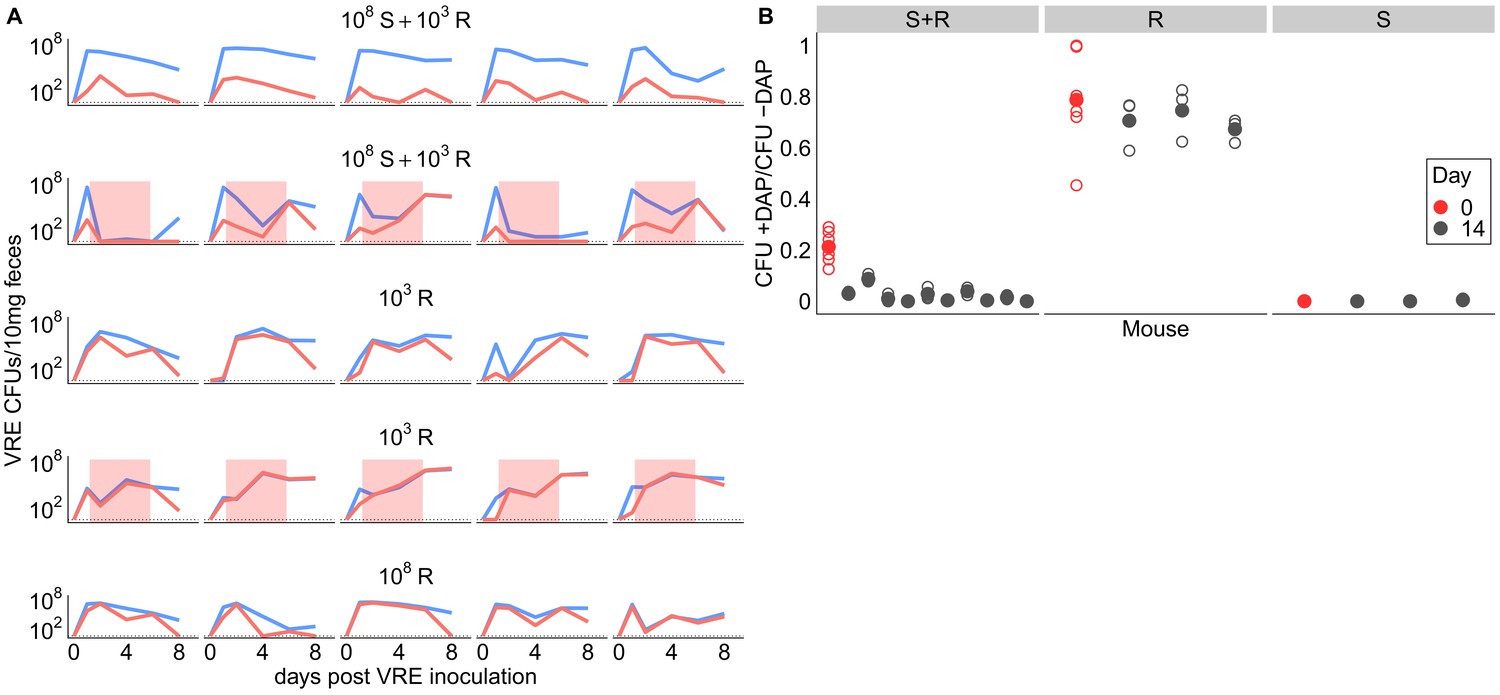
Competitive dynamics between daptomycin-resistant and susceptible VRE faecium.
(A) Each panel shows VR E. faecium counts on plates with daptomycin (+DAP, red line) and without daptomycin (-DAP, blue line) for a single mouse over time. Labels show initial inocula. Red shading indicates days of daptomycin treatment (100 mg/kg daily subcutaneous injections). (B) In a second experiment, mice were inoculated with a mix of susceptible and resistant bacteria (S+R, 20% R), resistant bacteria only (R), or susceptible bacteria only (S). Mice received no drug treatment. At Day 14, fecal suspensions were plated on plates with daptomycin (+DAP) and without daptomycin (-DAP) to determine whether the resistant strain had decreased in frequency. The starting inoculum dose is shown in red, and Day 14 samples from each mouse are shown in gray. Filled points show means of replicate measurements for a sample, and open circles show individual measurements. Note that resistant bacteria do not form colonies at 100% efficiency on +DAP plates.
-
Figure 3—source data 1
VR E. faecium density data (Figure 3A).
- https://cdn.elifesciences.org/articles/58147/elife-58147-fig3-data1-v1.zip
-
Figure 3—source data 2
VR E. faecium daptomycin susceptibility data (Figure 3B).
- https://cdn.elifesciences.org/articles/58147/elife-58147-fig3-data2-v1.zip
Figure 4

Cholestyramine captures daptomycin in vitro.
(A) Calibration curve (best fit linear regression) showing that daptomycin concentration can be measured by UV absorption at 364 nm (N = 3 per concentration). (B) Daptomycin concentration was reduced in solutions treated with cholestyramine (N = 3 per concentration). (C) Daptomycin solutions treated with cholestyramine had reduced biological activity against VRE in broth microdilutions (N = 3 per antibiotic treatment). Bacterial densities (OD600) following growth in the presence of daptomycin (DAP), daptomycin solution treated with cholestyramine (DAP + CHOL), or saline solution treated with cholestyramine (saline + CHOL) are shown. Concentrations are shown as the initial concentration of daptomycin in solution prior to cholestyramine treatment. Saline controls were constant across all listed concentrations. Horizontal line shows detection threshold.
-
Figure 4—source data 1
Calibration curve data (Figure 4A).
- https://cdn.elifesciences.org/articles/58147/elife-58147-fig4-data1-v1.zip
-
Figure 4—source data 2
Daptomycin concentration data (Figure 4B).
- https://cdn.elifesciences.org/articles/58147/elife-58147-fig4-data2-v1.zip
-
Figure 4—source data 3
Broth microdilution data, OD600 readings from 96-well plate (Figure 4C).
- https://cdn.elifesciences.org/articles/58147/elife-58147-fig4-data3-v1.zip
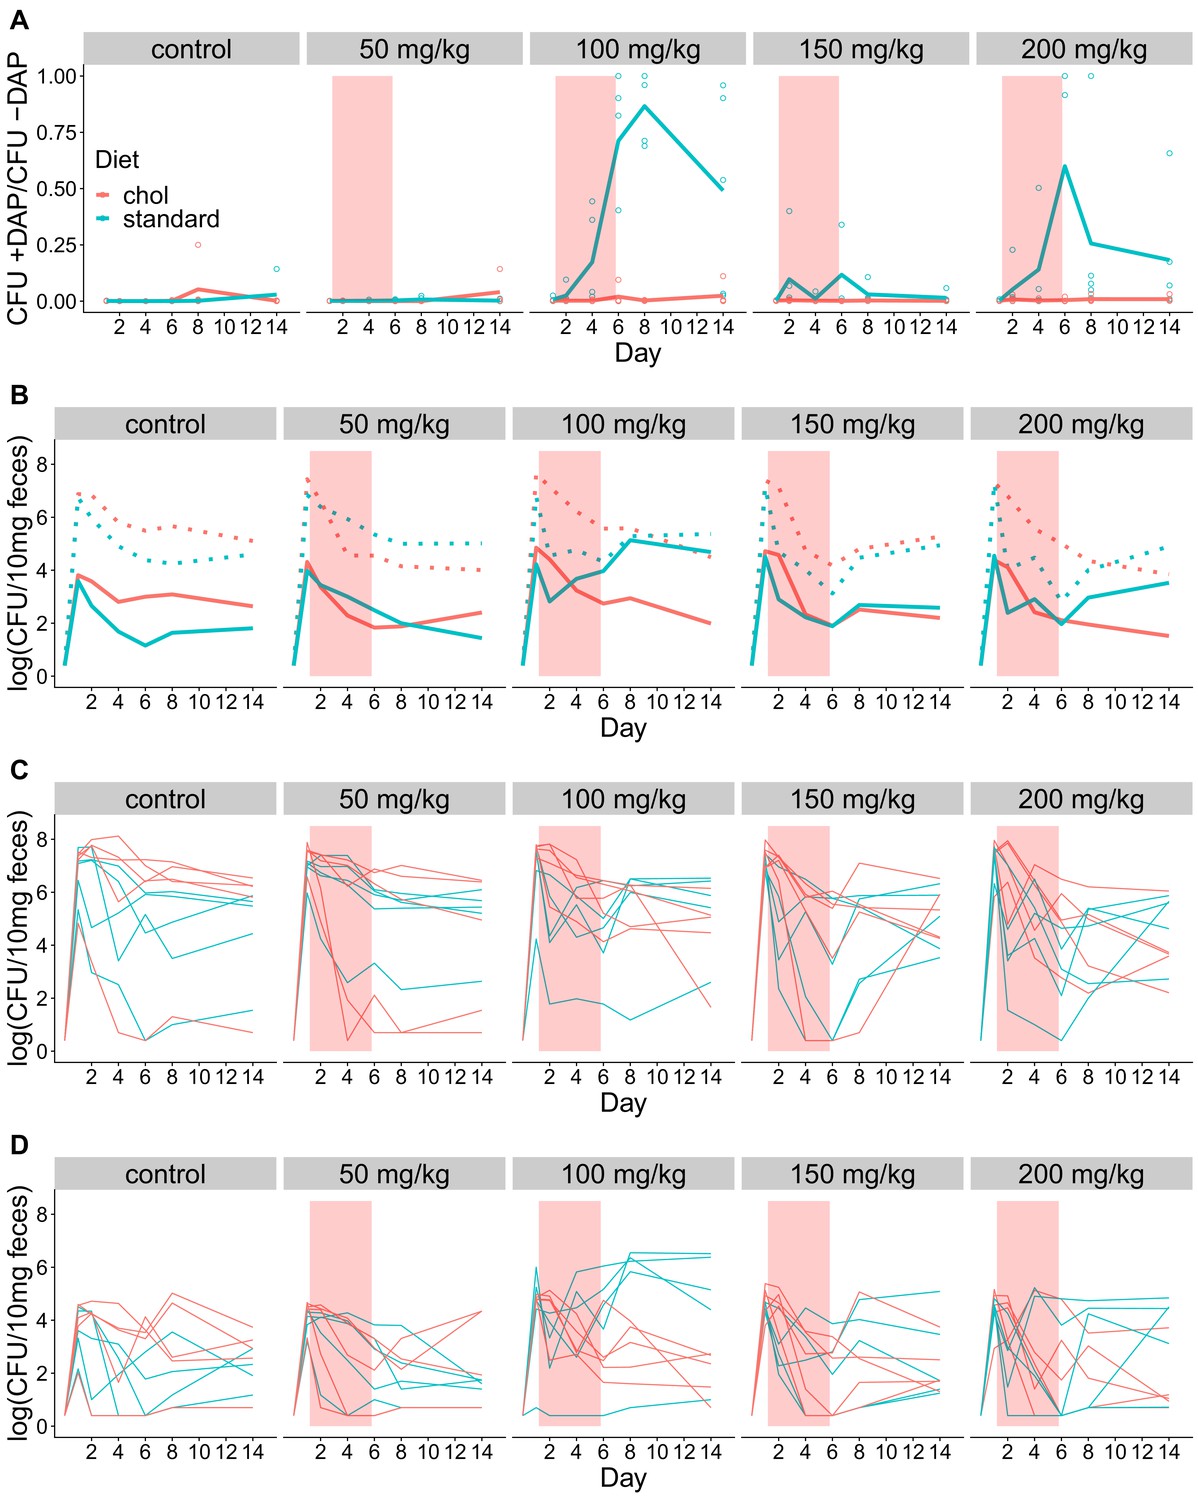
Figure 5 with 5 supplements
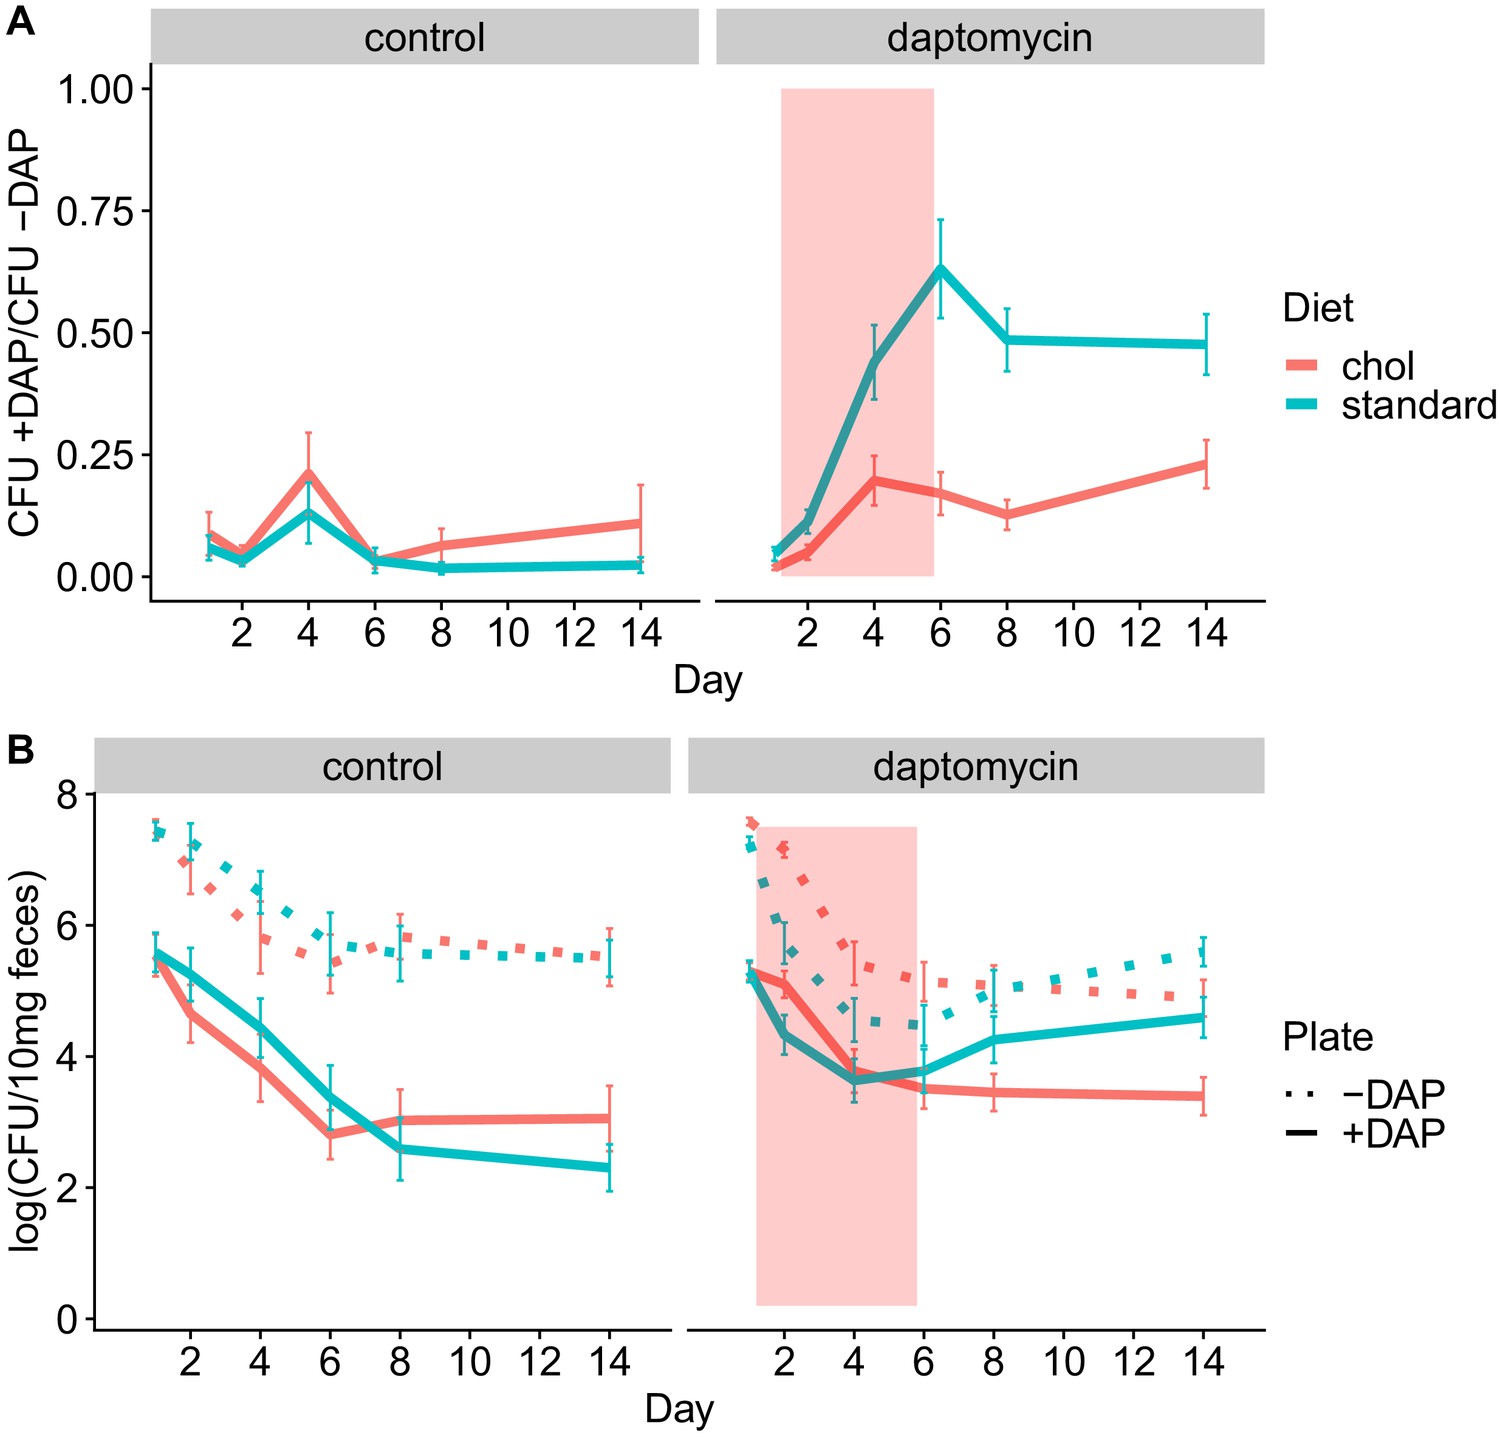
Adjunctive cholestyramine reduces enrichment of daptomycin-resistance in the GI tract.
(A) The proportion of fecal VR E. faecium that were daptomycin-resistant over time in mice. Proportions were determined by plating on agar with daptomycin (+DAP) and without daptomycin (-DAP). Data shown were combined from four experiments (for each diet N = 20 controls and N = 50 daptomycin-treated, mean + SEM shown). Proportions were not determined for samples with <20 CFU VR E. faecium per 10 mg feces, as these densities were below the limit of detection for this plating assay, and these samples were not included in Panel A. The pink shaded region indicates days of daptomycin therapy. (B) Total VR E. faecium densities corresponding to data shown in Panel A (for each diet N = 20 controls and N = 50 daptomycin-treated, mean + SEM shown). Dotted line shows total density (-DAP) and solid line shows the density of daptomycin-resistant VR E. faecium (+DAP). All samples, including those with low densities, were included in Panel B.
-
Figure 5—source data 1
VR E. faecium fecal density data.
- https://cdn.elifesciences.org/articles/58147/elife-58147-fig5-data1-v1.zip
Figure 5—figure supplement 1
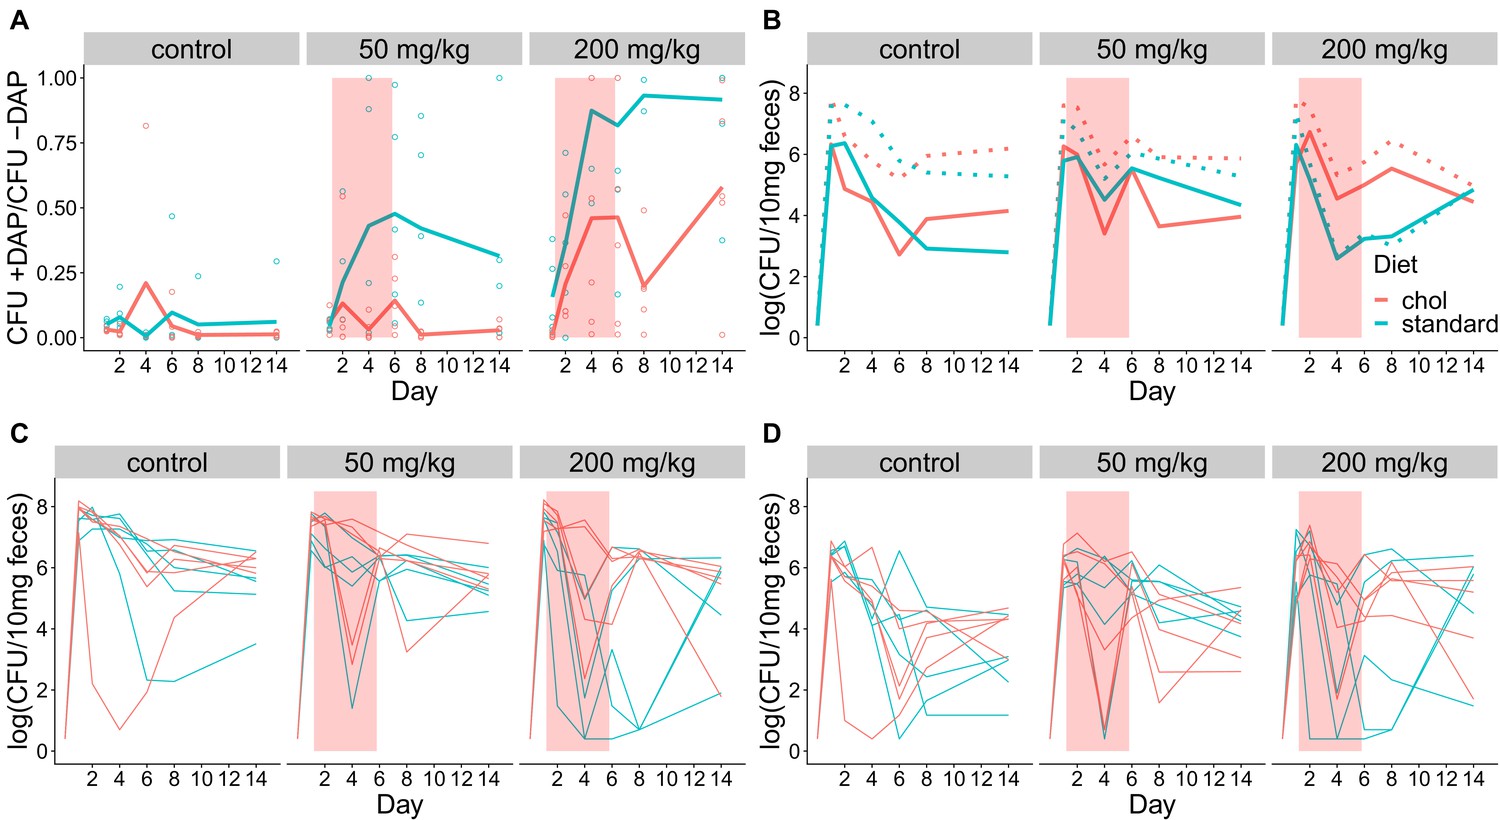
Fecal shedding of VR E. faecium for Experiment A (strain BL00239-1, Swiss Webster mice, cholestyramine started one day prior to first daptomycin dose).
(A) The proportion of fecal VR E. faecium that were daptomycin-resistant over time in mice. Proportions were determined by plating on agar with daptomycin (+DAP) and without daptomycin (-DAP). Lines show means, and open points show values for individual mice (N = 5). Proportions were not determined for samples with <20 CFU VR E. faecium per 10 mg feces, as these densities were below the limit of detection for this plating assay, and these samples were not included in Panel A. The pink shaded region indicates days of daptomycin therapy. (B) Total VR E. faecium densities corresponding to data shown in Panel A (N = 5, mean shown). Dotted line shows total density (-DAP) and solid line shows the density of daptomycin-resistant VR E. faecium (+DAP). All samples, including those with low densities, were included in Panel B. (C) Total VR E. faecium densities (-DAP) for individual mice in this experiment. Each line tracks values for one mouse. (D) Daptomycin-resistant VR E. faecium densities (+DAP) for individual mice in this experiment. Each line tracks values for one mouse.
Figure 5—figure supplement 2
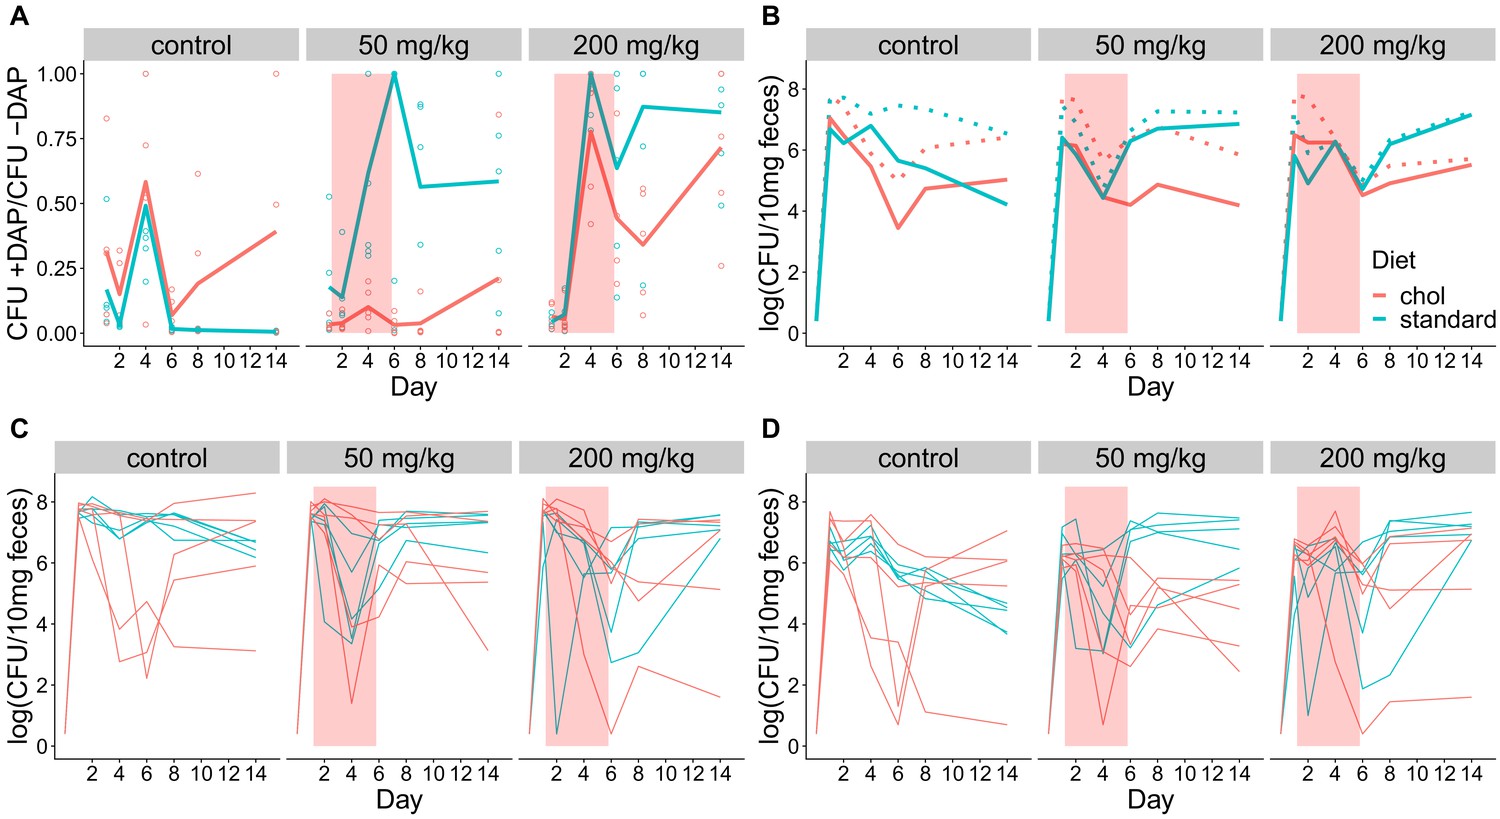
Fecal shedding of VR E. faecium for Experiment B (strain BL00239-1, C57BL/6 mice, cholestyramine started one day prior to first daptomycin dose).
(A) The proportion of fecal VR E. faecium that were daptomycin-resistant over time in mice. Proportions were determined by plating on agar with daptomycin (+DAP) and without daptomycin (-DAP). Lines show means, and open points show values for individual mice (N = 5). Proportions were not determined for samples with <20 CFU VR E. faecium per 10 mg feces, as these densities were below the limit of detection for this plating assay,and these samples were not included in Panel A. The pink shaded region indicates days of daptomycin therapy. (B) Total VR E. faecium densities corresponding to data shown in Panel A (N = 5, mean shown). Dotted line shows total density (-DAP) and solid line shows the density of daptomycin-resistant VR E. faecium (+DAP). All samples, including those with low densities, were included in Panel B. (C) Total VR E. faecium densities (-DAP) for individual mice in this experiment. Each line tracks values for one mouse. (D) Daptomycin-resistant VR E. faecium densities (+DAP) for individual mice in this experiment. Each line tracks values for one mouse.
Figure 5—figure supplement 3
Fecal shedding of VR E. faecium for Experiment C (strain PR00708-14, Swiss Webster mice, cholestyramine started one day prior to first daptomycin dose).
(A) The proportion of fecal VR E. faecium that were daptomycin-resistant over time in mice. Proportions were determined by plating on agar with daptomycin (+DAP) and without daptomycin (-DAP). Lines show means, and open points show values for individual mice (N = 5). Proportions were not determined for samples with <20 CFU VR E. faecium per 10 mg feces, as these densities were below the limit of detection for this plating assay, and these samples were not included in Panel A. The pink shaded region indicates days of daptomycin therapy. (B) Total VR E. faecium densities corresponding to data shown in Panel A (N = 5, mean shown). Dotted line shows total density (-DAP) and solid line shows the density of daptomycin-resistant VR E. faecium (+DAP). All samples, including those with low densities, were included in Panel B. (C) Total VR E. faecium densities (-DAP) for individual mice in this experiment. Each line tracks values for one mouse. (D) Daptomycin-resistant VR E. faecium densities (+DAP) for individual mice in this experiment. Each line tracks values for one mouse.
Figure 5—figure supplement 4
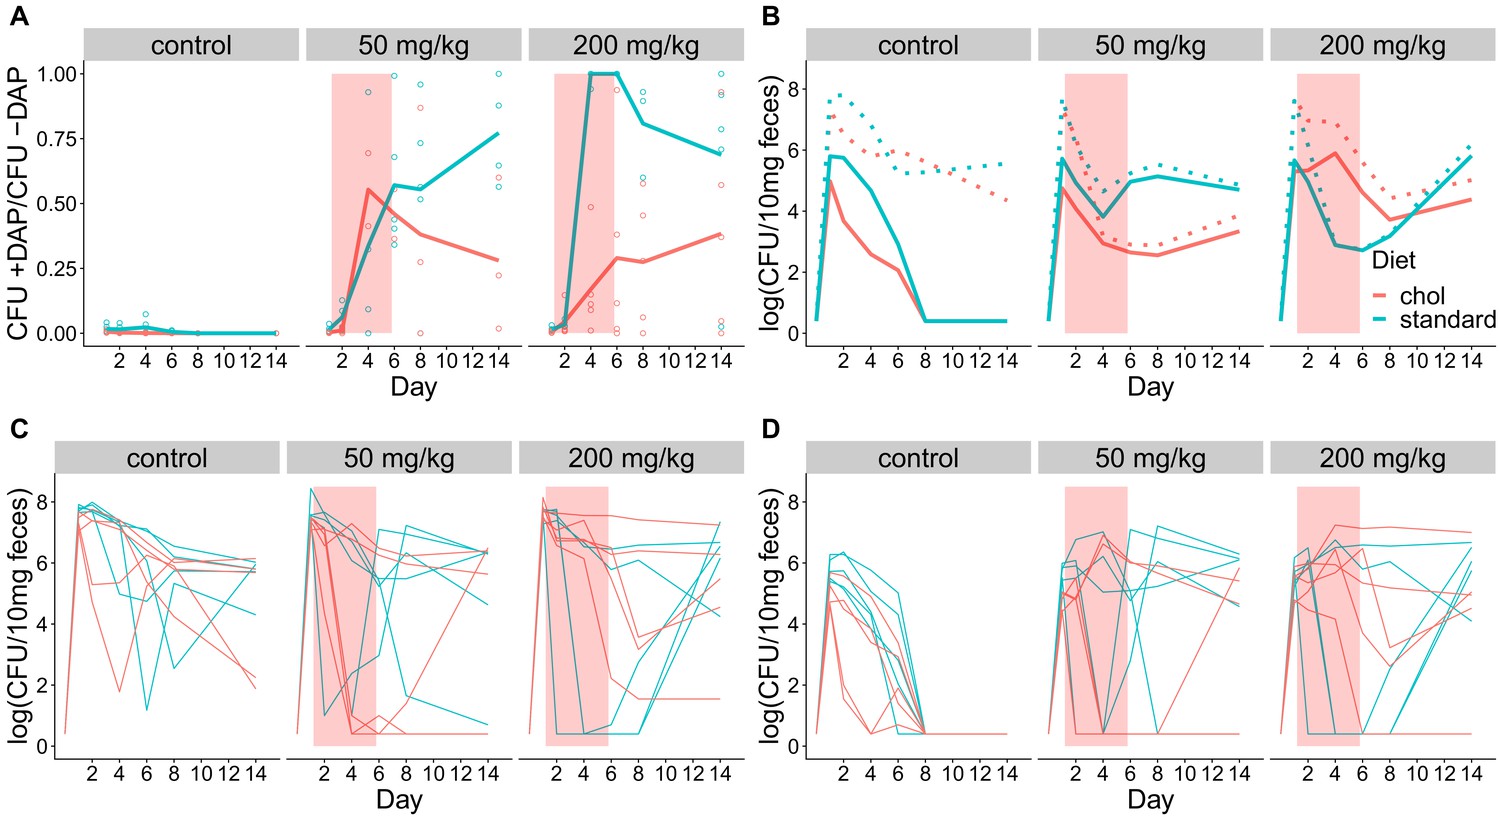
Fecal shedding of VR E. faecium for Experiment D (strain BL00239-1, Swiss Webster mice, cholestyramine started same day as first daptomycin dose).
(A) The proportion of fecal VR E. faecium that were daptomycin-resistant over time in mice. Proportions were determined by plating on agar with daptomycin (+DAP) and without daptomycin (-DAP). Lines show means, and open points show values for individual mice (N = 5). Proportions were not determined for samples with <20 CFU VR E. faecium per 10 mg feces, as these densities were below the limit of detection for this plating assay, and these samples were not included in Panel A. The pink shaded region indicates days of daptomycin therapy. (B) Total VR E. faecium densities corresponding to data shown in Panel A (N = 5, mean shown). Dotted line shows total density (-DAP) and solid line shows the density of daptomycin-resistant VR E. faecium (+DAP). All samples, including those with low densities, were included in Panel B. (C) Total VR E. faecium densities (-DAP) for individual mice in this experiment. Each line tracks values for one mouse. (D) Daptomycin-resistant VR E. faecium densities (+DAP) for individual mice in this experiment. Each line tracks values for one mouse.
Figure 5—figure supplement 5
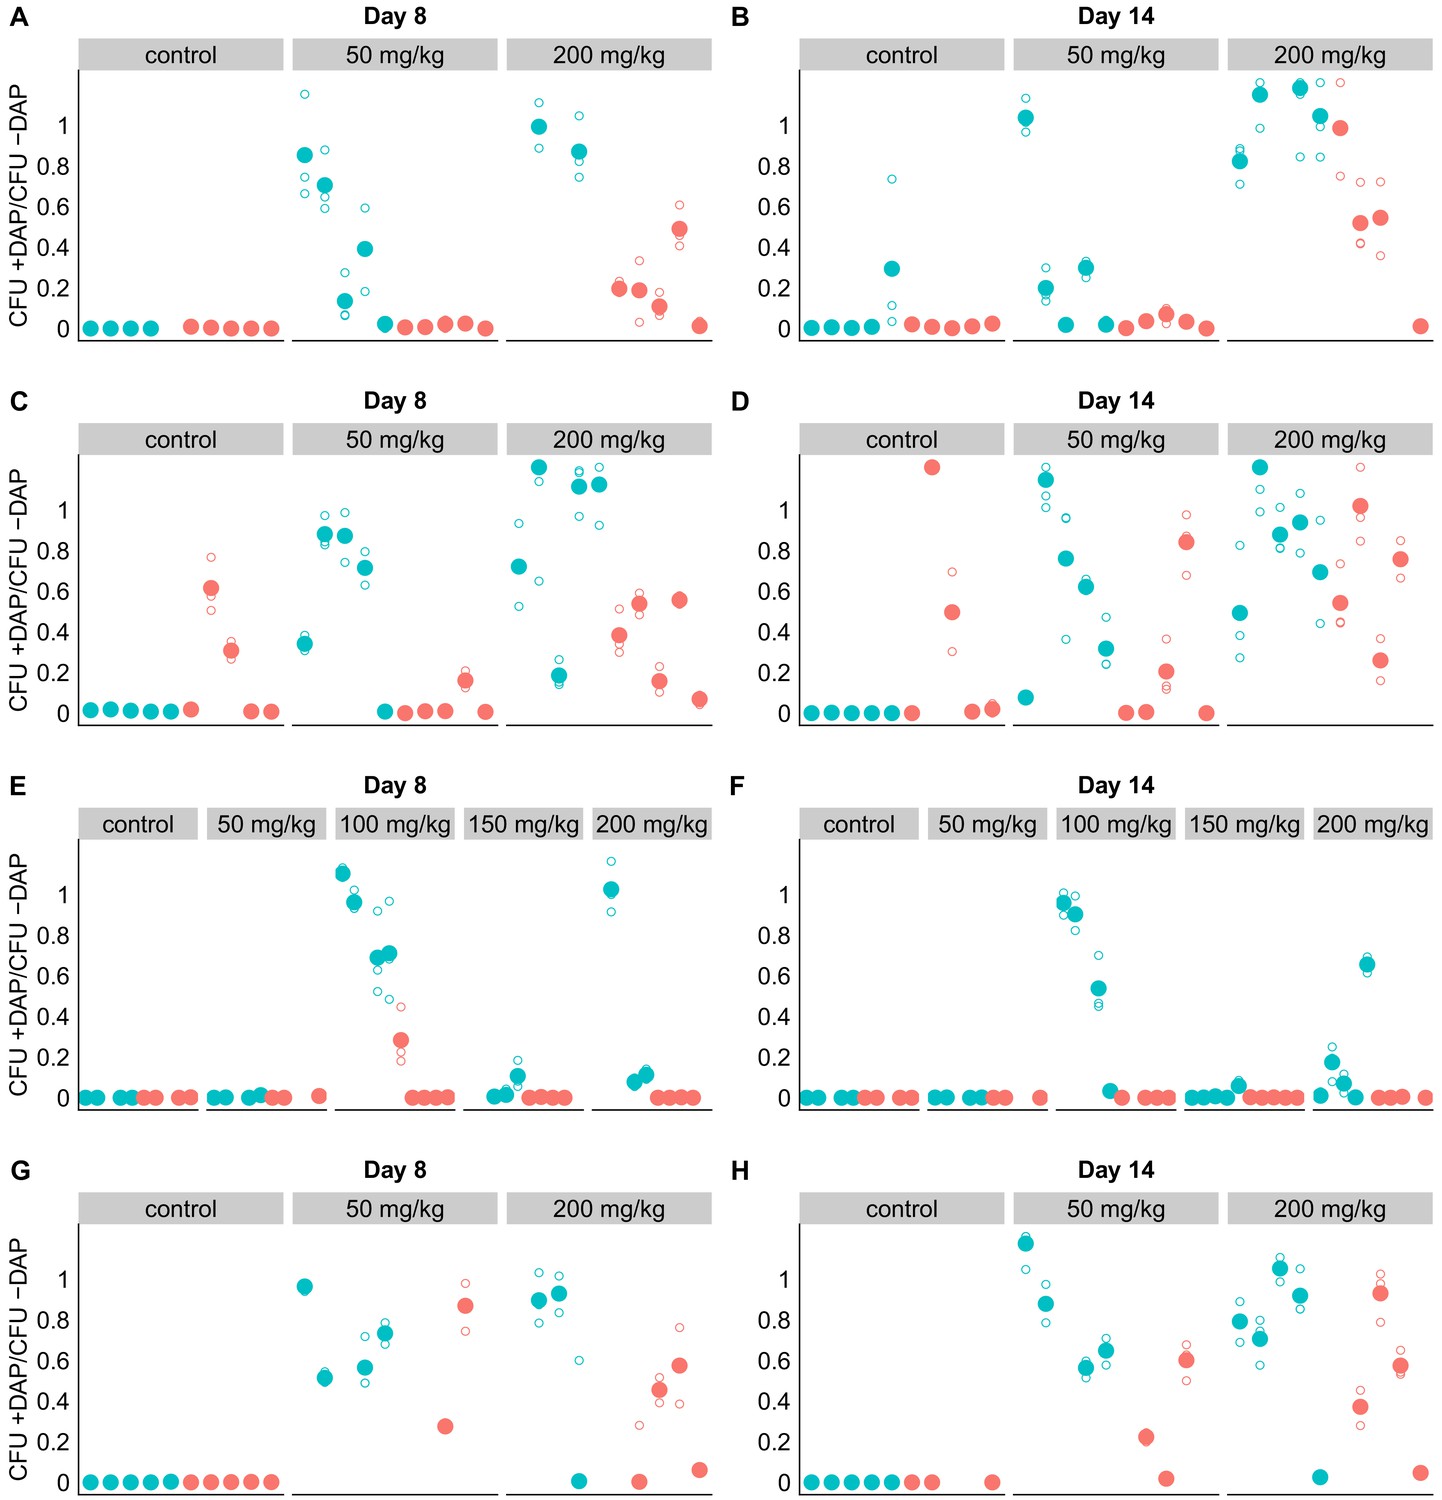
Adjunctive cholestyramine prevents emergence of daptomycin-resistance in GI tract.
Mouse fecal suspensions were plated on Enterococcus-selective plates with daptomycin (+ DAP) and without daptomycin (-DAP) at Day eight and Day 14 at an estimated 200 CFU per plate (based on previously determined densities). Each filled point represents the mean of triplicate measures from a single mouse sample, and open points show individual measurements. Blue points represent mice fed on a standard diet and red points represent mice fed a cholestyramine-supplemented diet. Mice were treated with daptomycin or saline (controls) for 5 days at the doses listed (N = 5 mice per treatment). Samples with VR E. faecium density <3×10³ CFU/10 mg feces had insufficient bacterial density to perform this assay, and were not included. Data for three experiments are shown. Values > 1 are consistent with sampling variation. (A–B) Experiment A. Swiss-Webster mice colonized with strains BL00239-1 + BL00239-1-R, cholestyramine started one day prior to daptomycin. (C–D) Experiment B. C57BL/6 mice colonized with strains BL00239-1 + BL00239-1-R, cholestyramine started one day prior to daptomycin. (E–F) Experiment C. Swiss-Webster mice colonized with strains PR00708-14 and PR00708-14-R, cholestyramine started one day prior to daptomycin. (G–H) Experiment D. Swiss-Webster mice colonized with strains BL00239-1 + BL00239-1-R, cholestyramine started same day as daptomycin.
Tables
Key resources table
| Reagent type (species) or resource | Designation | Source or reference | Identifiers | Additional information |
|---|---|---|---|---|
| Strain, strain background (mouse, female) | Swiss Webster (CFW) | Charles River | ||
| Strain, strain background (mouse, female) | C57BL/6 | Charles River | ||
| Chemical compound, drug | cholestyramine | Sigma-Aldrich | cat #: C4650 | |
| Strain, strain background (E. faecium) | BL00239-1 | This paper | clinical bloodstream isolate, R. Woods lab, University of Michigan | |
| Strain, strain background (E. faecium) | PR00708-14 | This paper | clinical perirectal swab isolate, R. Woods lab, University of Michigan | |
| Strain, strain background (E. faecium) | BL00239-1-R | This paper | derived from evolution in mouse gut | |
| Strain, strain background (E. faecium) | PR00708-14-R | This paper | derived from evolution in mouse gut |
Additional files
-
Supplementary file 1
Statistical models.
- https://cdn.elifesciences.org/articles/58147/elife-58147-supp1-v1.docx
-
Transparent reporting form
- https://cdn.elifesciences.org/articles/58147/elife-58147-transrepform-v1.docx
Download links
A two-part list of links to download the article, or parts of the article, in various formats.
Downloads (link to download the article as PDF)
Open citations (links to open the citations from this article in various online reference manager services)
Cite this article (links to download the citations from this article in formats compatible with various reference manager tools)
An adjunctive therapy administered with an antibiotic prevents enrichment of antibiotic-resistant clones of a colonizing opportunistic pathogen
eLife 9:e58147.
https://doi.org/10.7554/eLife.58147


