α-Synuclein plasma membrane localization correlates with cellular phosphatidylinositol polyphosphate levels
- Department of Biological Regulation, Weizmann Institute of Science, Israel
Figures
Figure 1 with 2 supplements
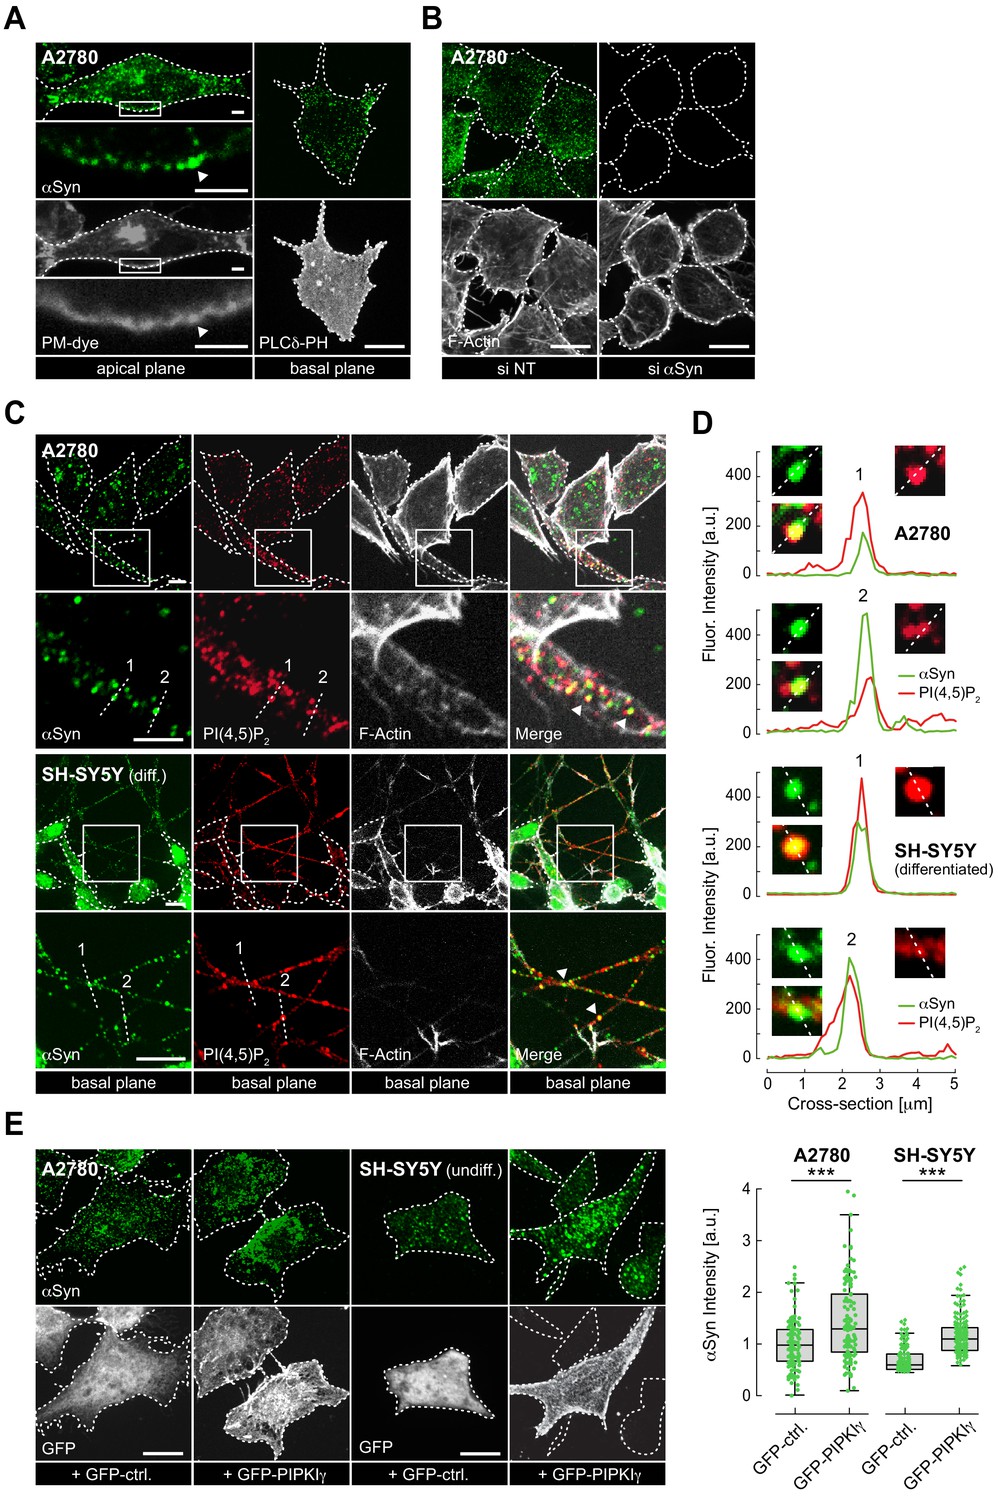
Plasma membrane (PM) localization of endogenous α-synuclein (αSyn).
(A) Immunofluorescence detection of endogenous αSyn in A2780 cells by confocal microscopy. PM stained with tetramethylrhodamine-wheat germ agglutinin (WGA) (left panel) or identified via GFP-PLCδ-PH (right panel). Representative apical and basal confocal planes are shown. Scale bars are 2 μm (left) and 10 μm (right). (B) αSyn-PM localization in A2780 cells following control (si NT) and targeted siRNA (si αSyn) knockdown. Phalloidin staining of F-actin marks cell boundaries. Scale bars are 10 μm. (C) Immunofluorescence detection of endogenous αSyn and phosphatidylinositol 4,5-bisphosphate (PIP2) at the PM in A2780 (top) and differentiated SH-SY5Y cells (bottom). Scale bars are 5 μm. (D) Spatially resolved αSyn (green) and PIP2 (red) fluorescence intensity profiles across the dotted lines in the closeup views. Resolved αSyn and PIP2 traces are marked with arrowheads. (E) αSyn-PM localization and quantification after transient green fluorescent protein (GFP) or GFP-PIPKIγ overexpression in A2780 and undifferentiated SH-SY5Y cells. GFP fluorescence identifies transfected cells. Scale bars are 10 μm. Box plots for αSyn immunofluorescence quantification. Data points represent n ~120 cells collected in four independent replicate experiments. Box dimensions represent the 25th and 75th percentiles, whiskers extend to the 5th and 95th percentiles. Data points beyond these values were considered outliers. Significance based on Student’s t tests as ∗∗∗p<0.001. See also Figure 1—source data 1.
-
Figure 1—source data 1
Raw data of αSyn PM localization upon PIPKinase expression.
- https://cdn.elifesciences.org/articles/61951/elife-61951-fig1-data1-v2.xlsx
Figure 1—figure supplement 1
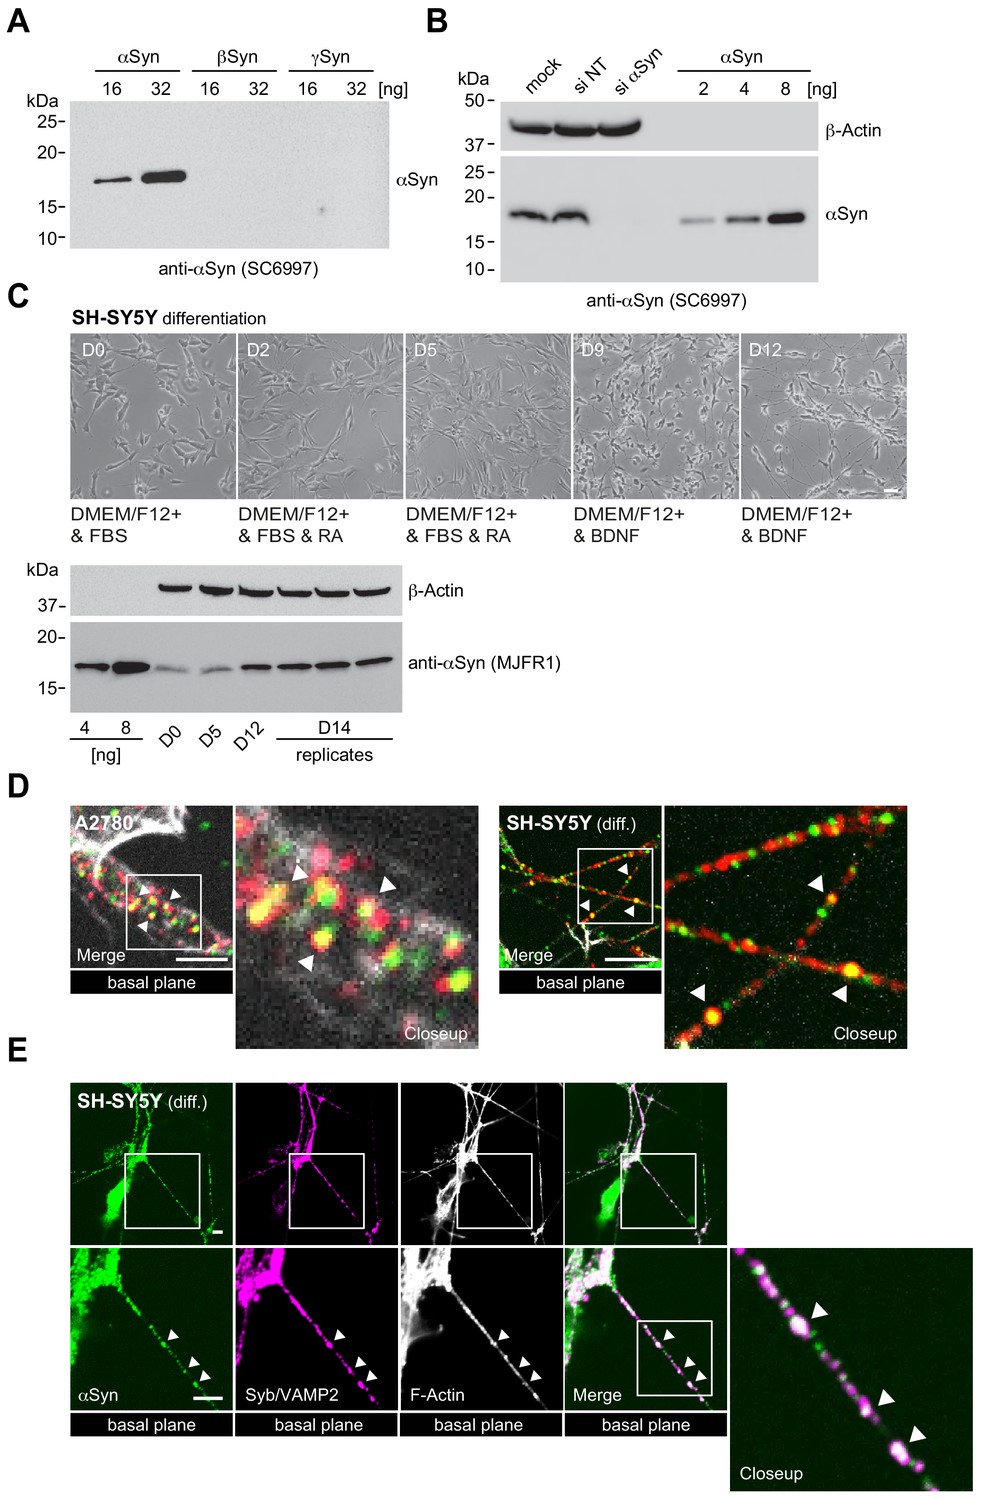
αSyn siRNA knockdown, differentiation of SH-SY5Y cells and αSyn, PI(4,5)P2 and synaptobrevin 2/VAMP2 colocalization.
(A) Western blot to determine the specificity of the α-synuclein (αSyn) antibody (sc69977) against β and γ isoforms of the protein. (B) Western blot of A2780 lysates of control (si NT) and targeted siRNA (si αSyn) knockdown cells. Recombinant N-terminally acetylated αSyn serves as input, β-actin as loading controls. See also Figure 1—figure supplement 1—source data 1. (C) Bright field microscopy images of the SH-SY5Y differentiation time course upon retinoic acid treatment (5 days) followed by brain-derived neurotrophic factor (BDNF) stimulation (7 days). Respective days (D0 to D12) are indicated. Western blot of endogenous αSyn concentrations in SH-SY5Y lysates during the differentiation time course with recombinant αSyn as input, β-actin as loading controls. See also Figure 1—figure supplement 1—source data 2. (D) Closeup views of αSyn-PIP2 colocalizations in A2780 (left) and differentiated SH-SY5Y cells (right) as in Figure 1B. Arrowheads mark prominent sites. (E) Colocalization of αSyn and synaptobrevin-2/VAMP2 in neurites of day 14 differentiated SH-SY5Y cells. Scale bar is 10 μm. PIP2: phosphatidylinositol 4,5-bisphosphate. DMEM: Dulbecco's modified eagle medium. FBS: Fetal bovine serum. RA: Retinoic acid.
-
Figure 1—figure supplement 1—source data 1
Uncropped western blots of αSyn siRNA knockdown.
- https://cdn.elifesciences.org/articles/61951/elife-61951-fig1-figsupp1-data1-v2.pdf
-
Figure 1—figure supplement 1—source data 2
Uncropped western blots of endogenous αSyn levels upon differentiation of SH-SY5Y cells.
- https://cdn.elifesciences.org/articles/61951/elife-61951-fig1-figsupp1-data2-v2.pdf
Figure 1—figure supplement 2
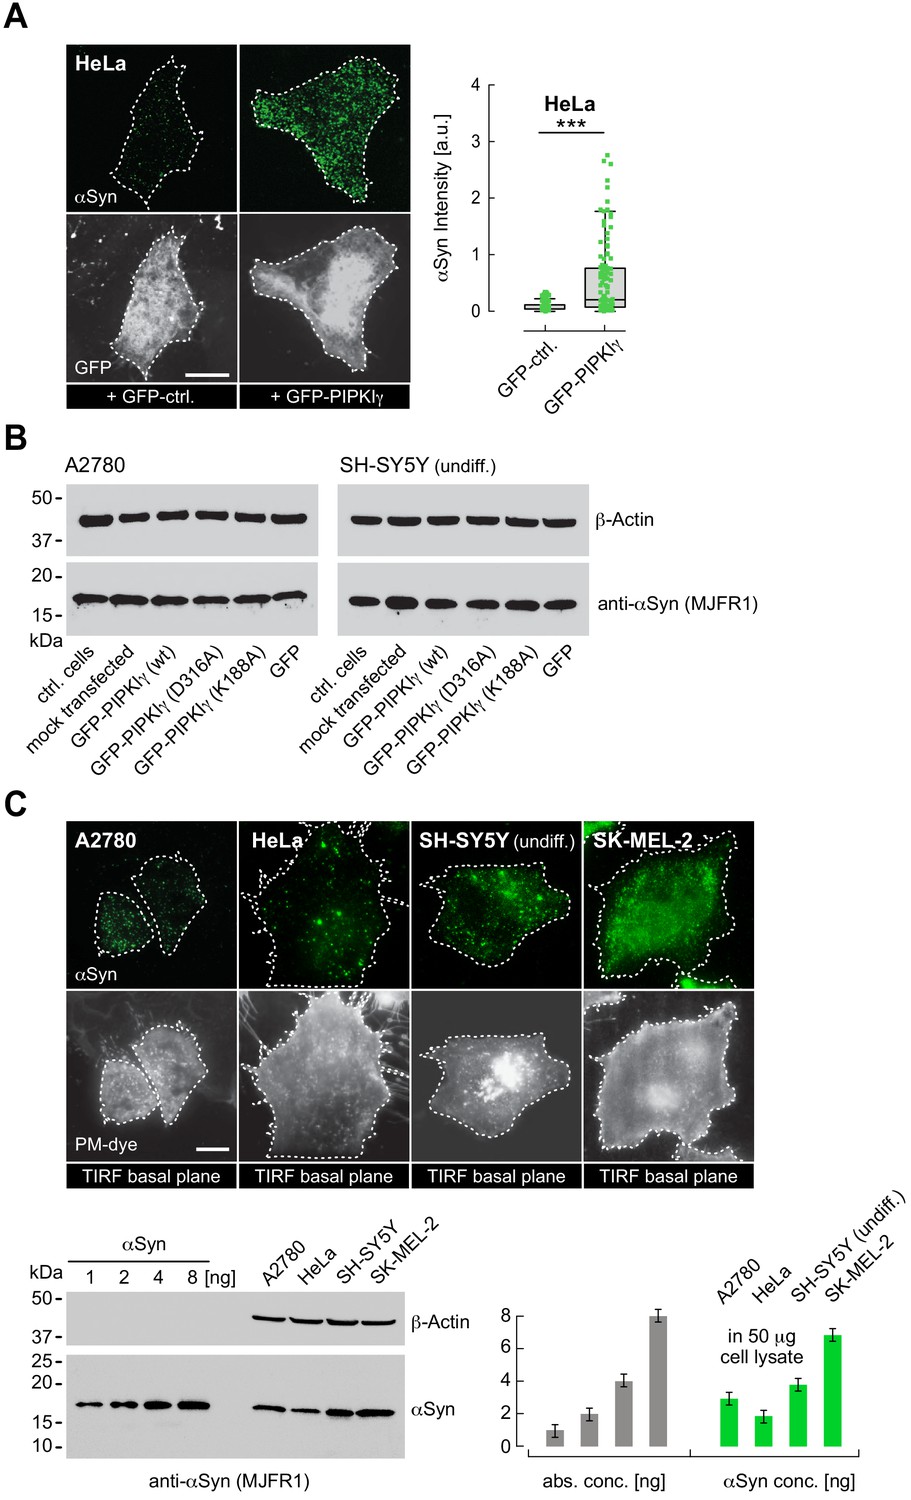
αSyn PM localization in A2780, HeLa, undifferentiated SH-SY5Y and SK-MEL-2 cells.
(A) Immunofluorescence localization and quantification of endogenous α-synuclein (αSyn) in HeLa cells transfected with green fluorescent protein (GFP) or GFP-PIPKIγ. Scale bar is 10 μm. Box plots for αSyn immunofluorescence quantification. Data points represent n ~ 120 cells collected in four independent replicate experiments. Box dimensions represent the 25th and 75th percentiles, whiskers extend to the 5th and 95th percentiles. Data points beyond these values were considered outliers. Significance based on Student’s t tests as ∗∗∗p<0.001. See also Figure 1—figure supplement 2—source data 1. (B) Lysate western blots of endogenous αSyn in A2780 and undifferentiated SH-SY5Y cells transiently transfected with indicated PIPKIγ expression plasmids. Control (ctrl), mock and GFP-only transfected cells serve as baseline controls. Wild-type (WT) and kinase-inactive D316A- and K188A-PIPKIγ mutants were used to assess possible differences between kinase activity versus PM-targeting effects on αSyn levels. See also Figure 1—figure supplement 2—source data 2. (C) Total internal reflection fluorescence (TIRF) microscopy of αSyn-PM localization in A2780, HeLa, SH-SY5Y and SK-MEL-2 cells. Plasma membrane (PM) stained with tetramethylrhodamine-wheat germ agglutinin (WGA). Scale bars are 10 μm. Western blot of endogenous αSyn in respective cell lysates. Recombinant N-terminally acetylated αSyn serves as input, β-actin as loading controls. Bar graphs denote western blot quantifications of αSyn with signals normalized against β-actin. Error bars denote standard deviations based on measured background. See also Figure 1—figure supplement 2—source data 3.
-
Figure 1—figure supplement 2—source data 1
Quantification of αSyn PM levels upon GFP and GFP-PIPKIγ expression in HeLa cells.
- https://cdn.elifesciences.org/articles/61951/elife-61951-fig1-figsupp2-data1-v2.xlsx
-
Figure 1—figure supplement 2—source data 2
Uncropped western blots of endogenous αSyn levels upon PIPKIγ expression.
- https://cdn.elifesciences.org/articles/61951/elife-61951-fig1-figsupp2-data2-v2.pdf
-
Figure 1—figure supplement 2—source data 3
Uncropped western blot of endogenous αSyn levels in A2780, HeLa, undifferentiated SH-SY5Y and SK-MEL-2 cells.
- https://cdn.elifesciences.org/articles/61951/elife-61951-fig1-figsupp2-data3-v2.pdf
Figure 2 with 4 supplements

α-Synuclein (αSyn) binding to reconstituted phosphatidylinositol 4,5-bisphosphate (PIP2) vesicles.
(A) Circular dichroism (CD) spectrum and negative-stain electron micrograph of αSyn-bound PIP2 vesicles (100%). Scale bar is 100 nm. (B) Overlay of 2D 1H-15N nuclear magnetic resonance (NMR) spectra of isolated αSyn in buffer (black) and bound to PIP2 vesicles (green). Remaining signals of C-terminal αSyn residues are labeled. (C) CD spectra of αSyn bound to phosphatidylcholine (PC)-PIP2 vesicles at increasing lipid-to-protein ratios (inset) and negative-stain electron micrograph of the αSyn:PC-PIP2 (1:50 protein:PIP2) sample. Scale bar is 100 nm. (D) NMR signal intensity ratios of bound (I) over unbound (I0) αSyn in the presence of different amounts of PC-PIP2 vesicles (equivalent to (C)). Only residues 1–40 are shown. (E) I/I0 of PC-PIP2 bound αSyn at 1:50 (green) and after addition of phospholipase C (PLC) (dark gray) and Ca2+ (light gray). Selected regions of 2D 1H-15N NMR spectra of PC-PIP2 bound αSyn (left, green) and in the presence of PLC (top right, dark gray) and Ca2+ (bottom right, light gray). Release of N-terminal αSyn residues from vesicles and reappearance of corresponding NMR signals are indicated for Asp2 (D2) as an example. (F) Hydrodynamic diameters of αSyn-bound PC-PIP2 vesicles before (green) and after PLC (dark gray) and Ca2+ (light gray) addition by dynamic light scattering. Errors were calculated based on measurements on three independent replicate samples.
Figure 2—figure supplement 1
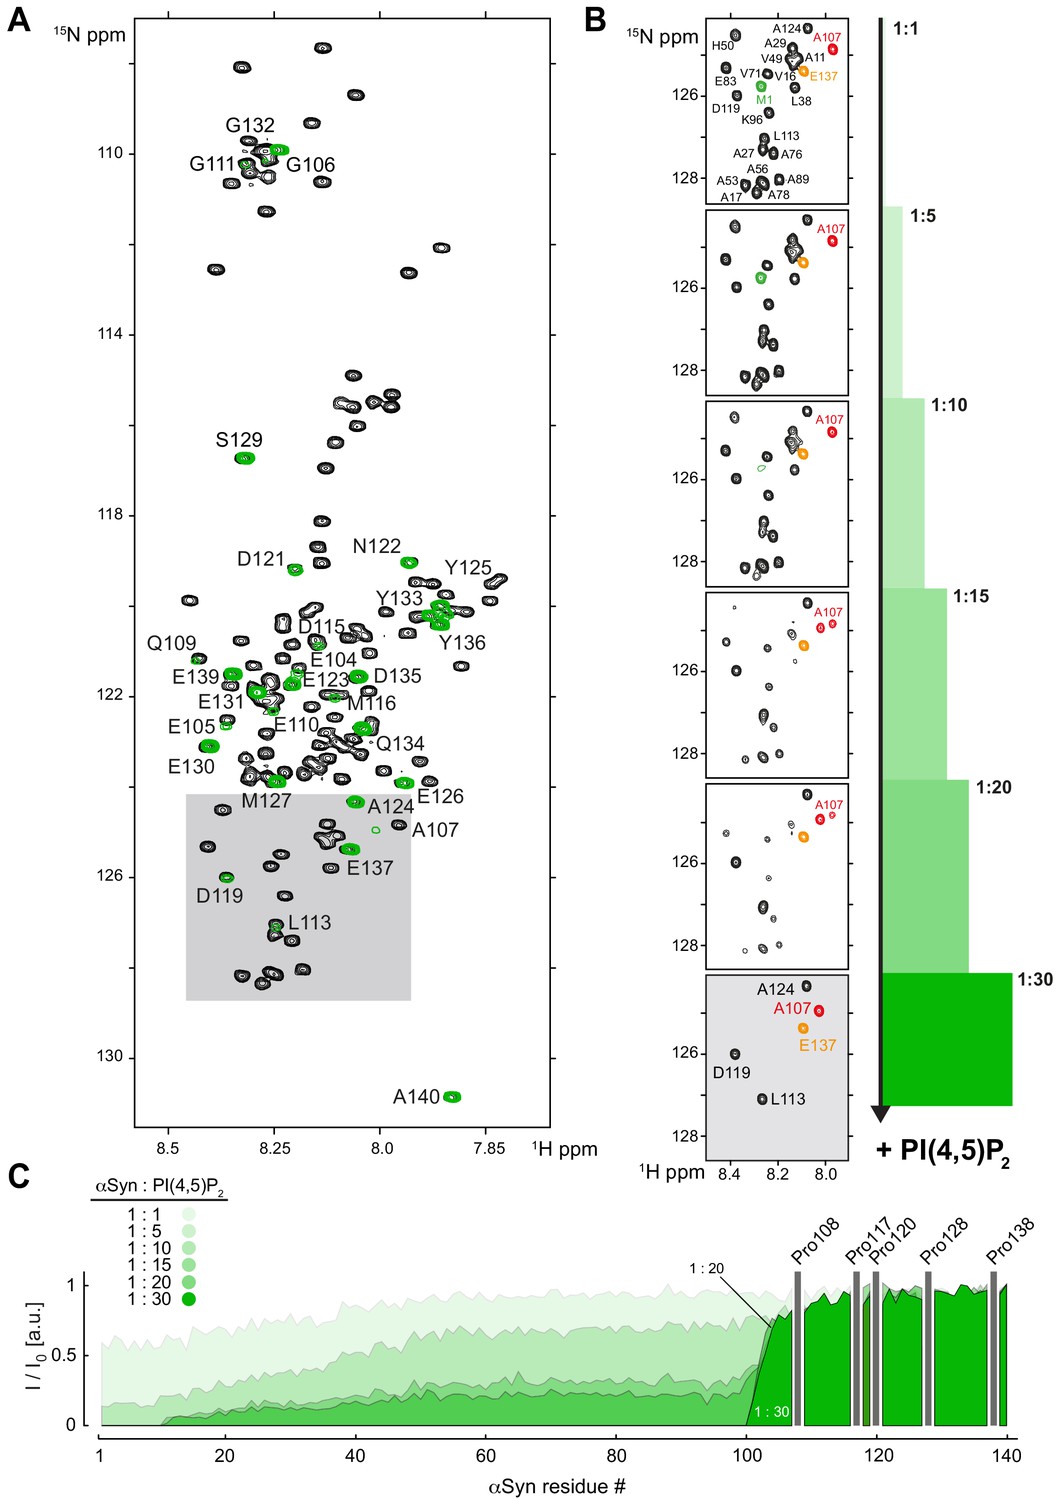
NMR characterization of αSyn binding to reconstituted PI(4,5)P2 vesicles.
(A) Overlay of 2D 1H-15N nuclear magnetic resonance (NMR) spectra of isolated, N-terminally acetylated α-synuclein (αSyn) (black) and bound to a 30-fold molar excess of phosphatidylinositol 4,5-bisphosphate (PIP2)-only vesicles (green). Uniform signal broadening of N-terminal residues 1–100 is evident. Observable C-terminal αSyn signals are labeled. (B) Selected region of 2D 1H-15N NMR spectra of αSyn upon addition of increasing amounts of PIP2-only vesicles, corresponding to molar protein:lipid ratios of 1:1, 1:5, 1:10, 1:15, 1:20 and 1:30, with Met1 (M1) labeled in green and Glu137 (E137) indicated in orange. Note that Ala107 (A107, red) at the border between membrane-bound (N-terminal) and -unbound (C-terminal) αSyn residues displays peak-splitting at increasing PIP2 concentrations, indicative of chemical shift differences between free and membrane-bound protein states. (C) Residue-resolved signal attenuation profiles (I/I0) of free (I0) versus PIP2 bound αSyn (I) at previously indicated molar ratios. Positions of C-terminal αSyn proline residues without peptide amide resonances are shown in the three-letter amino acid code. See also Figure 2—figure supplement 1—source data 1.
-
Figure 2—figure supplement 1—source data 1
NMR signal intensity ratios of αSyn binding to PI(4,5)P2 vesicles.
- https://cdn.elifesciences.org/articles/61951/elife-61951-fig2-figsupp1-data1-v2.xlsx
Figure 2—figure supplement 2
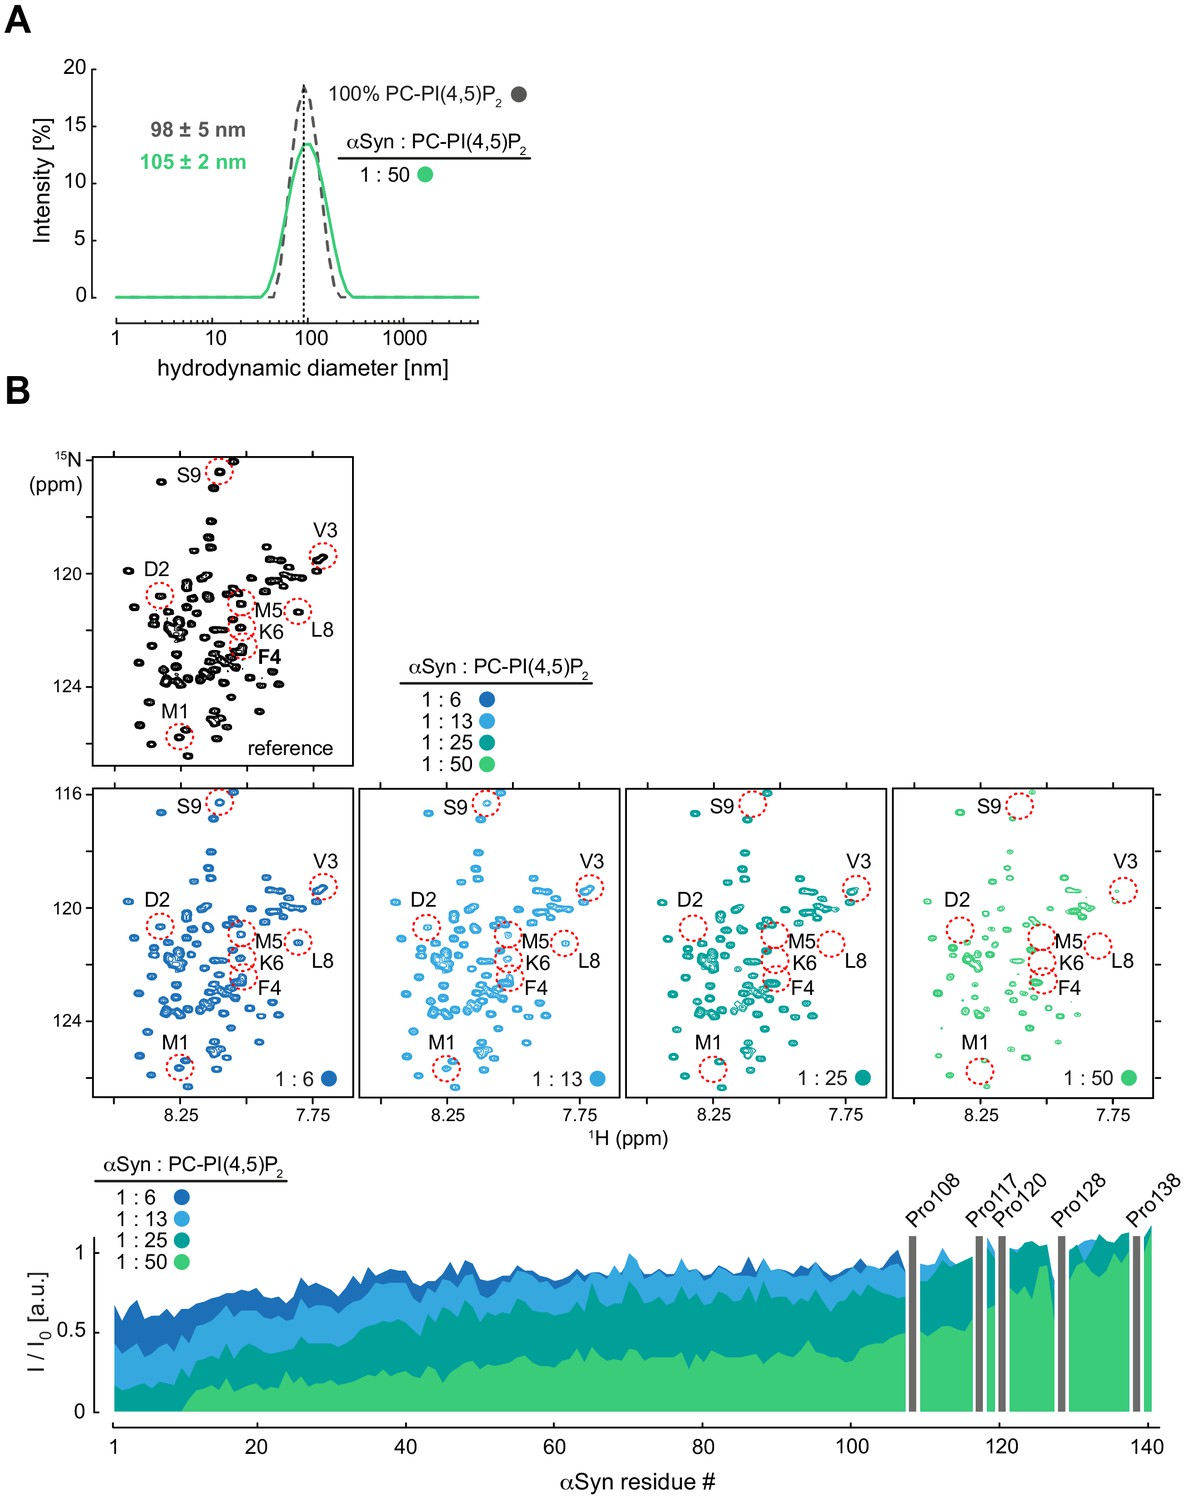
NMR characterization of αSyn binding to reconstituted PC-PI(4,5)P2 vesicles.
(A) Hydrodynamic diameters of phosphatidylcholine-phosphatidylinositol 4,5-bisphosphate (PC-PIP2) vesicles in the absence (dashed gray) and presence of α-synuclein (αSyn) (green) at a protein:lipid ratio of 1:50 by dynamic light scattering . Errors were calculated based on measurements of three independent replicate samples. (B) Selected regions of 2D 1H-15N nuclear magnetic resonance (NMR) spectra of isolated, N-terminally acetylated αSyn (black) and in the presence of 6, 13, 25 and 50 mol equivalents of PC-PIP2 vesicles (blue to green). Site-selective line broadening of N-terminal residues 1–9 is highlighted. Residue-resolved signal attenuation profiles (I/I0) of free (I0) versus PC-PIP2 bound αSyn (I) at previously indicated molar ratios. Positions of C-terminal αSyn proline residues without peptide amide resonances are shown in the three-letter amino acid code. See also Figure 2—figure supplement 2—source data 1.
-
Figure 2—figure supplement 2—source data 1
NMR signal intensity ratios of αSyn binding to PC-PI(4,5)P2 vesicles.
- https://cdn.elifesciences.org/articles/61951/elife-61951-fig2-figsupp2-data1-v2.xlsx
Figure 2—figure supplement 3
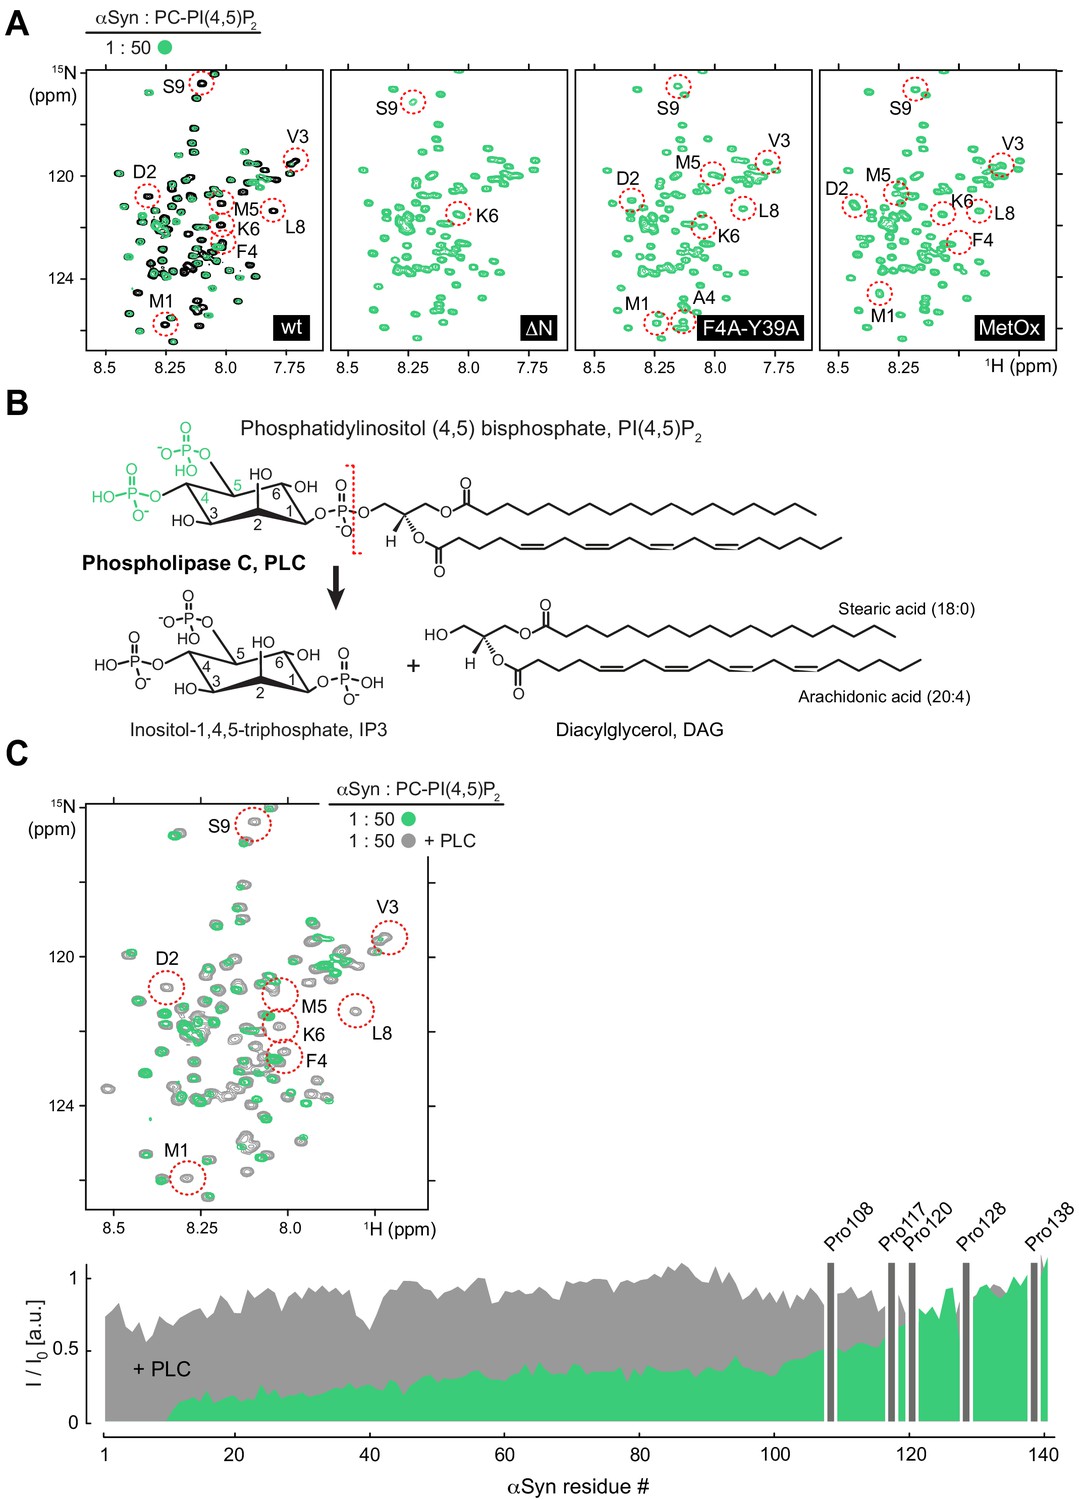
NMR characterization of mutant αSyn binding to reconstituted PC-PI(4,5)P2 vesicles and upon phospholipase C (PLC) treatment.
(A) Selected regions of 2D 1H-15N nuclear magnetic resonance (NMR) spectra. Left to right: Overlay of isolated, N-terminally acetylated wild-type (WT) α-synuclein (αSyn) and bound to phosphatidylcholine-phosphatidylinositol 4,5-bisphosphate (PC-PIP2) vesicles at a protein:lipid ratio of 1:50 (green). NMR spectra of N-terminally truncated αSyn lacking residues 1–4 (ΔN), mutated (F4A-Y39A), and methionine-oxidized (MetOx) αSyn in the presence of PC-PIP2 vesicles (1:50). (B) Chemical structures and reaction scheme of phospholipase C (PLC)-mediated PIP2 hydrolysis. (C) Overlay of selected regions of 2D 1H-15N NMR spectra of αSyn bound to PC-PIP2 vesicles (1:50) before (green) and after PLC hydrolysis (dark gray). N-terminal residues 1–9 are highlighted. Corresponding residue-resolved signal attenuation profiles (I/I0) of free versus PC-PIP2 vesicle-bound αSyn before (green) and after PLC hydrolysis (dark gray). Positions of C-terminal αSyn proline residues without peptide amide resonances are shown in the three-letter amino acid code. See also Figure 2—figure supplement 3—source data 1.
-
Figure 2—figure supplement 3—source data 1
NMR signal intensity ratios of αSyn binding to PC-PI(4,5)P2 vesicles upon phospholipase C (PLC) treatment.
- https://cdn.elifesciences.org/articles/61951/elife-61951-fig2-figsupp3-data1-v2.xlsx
Figure 2—figure supplement 4
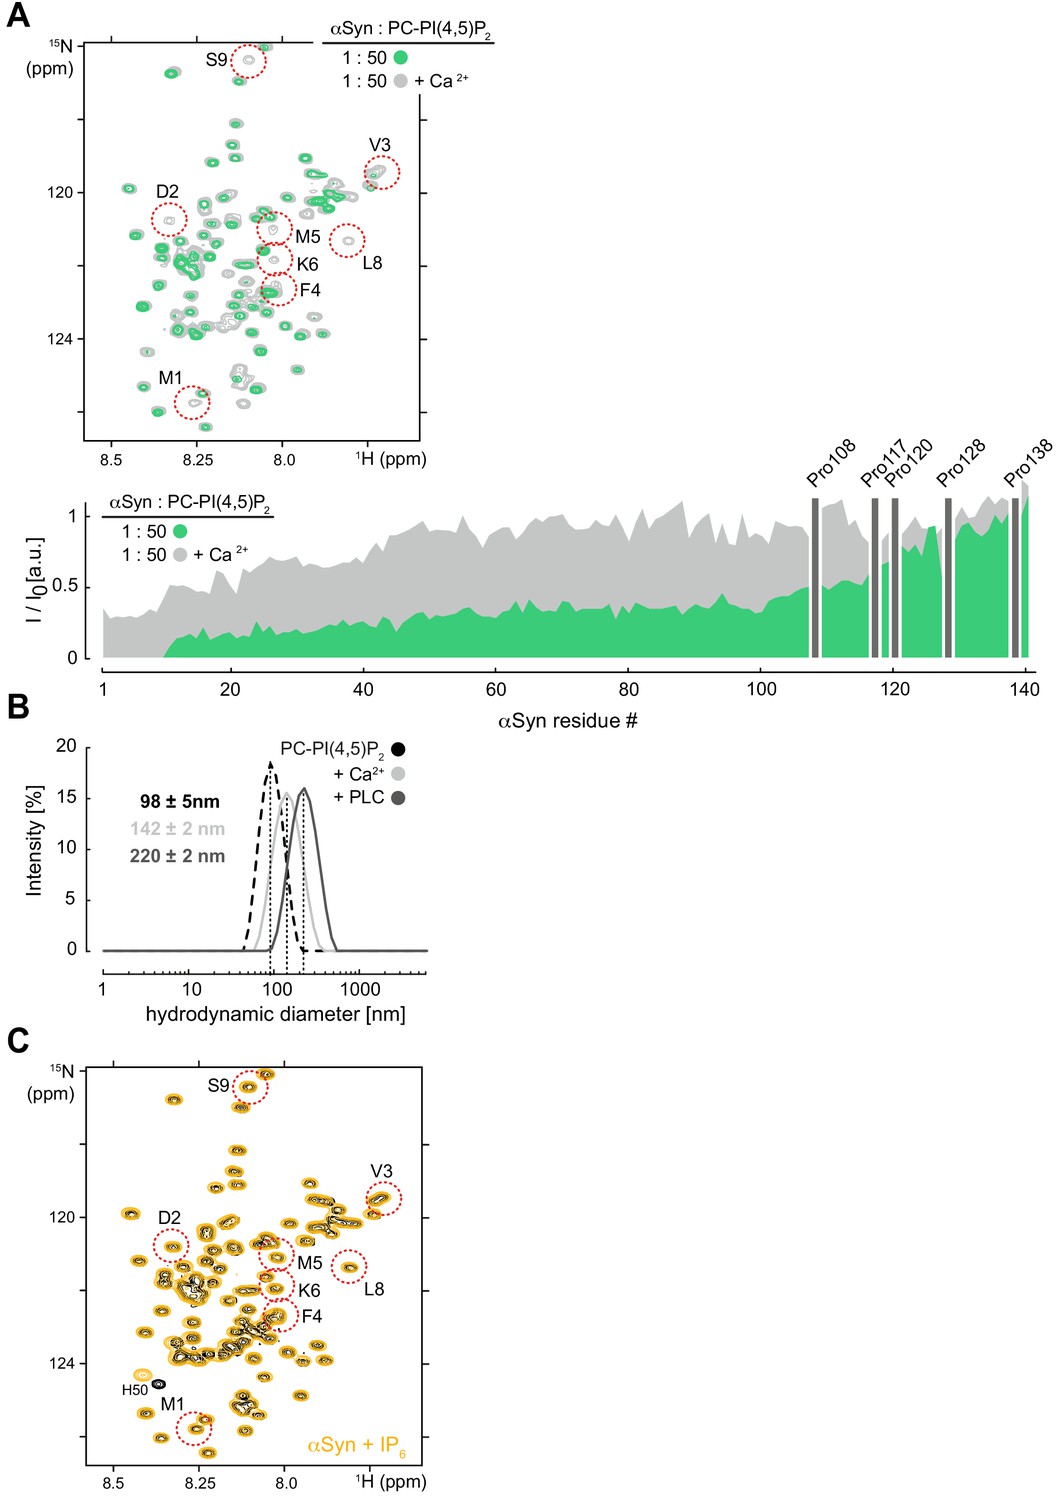
NMR characterization of αSyn binding to reconstituted PC-PI(4,5)P2 vesicles in the presence of Ca and inositol polyphosphate (IP6) interaction.
(A) Overlay of 2D 1H-15N nuclear magnetic resonance (NMR) spectra of phosphatidylcholine-phosphatidylinositol 4,5-bisphosphate (PC-PIP2) vesicle-bound α-synuclein (αSyn) in the absence (green) and presence of Ca2+ (light gray). Residue-resolved NMR signal intensity ratios (I/I0) of free versus PC-PIP2 vesicle-bound αSyn with (light gray) and without Ca2+ (green). Positions of C-terminal αSyn proline residues without peptide amide resonances are shown in the three-letter amino acid code. See also Figure 2—figure supplement 4—source data 1. (B) Hydrodynamic diameters of PC-PIP2 vesicles (dashed black) and in the presence of Ca2+ (light gray) or phospholipase C (PLC) (dark gray) by dynamic light scattering . Errors were calculated based on measurements of three independent replicate samples. (C) Overlay of 2D 1H-15N NMR spectra of αSyn (black) and in the presence of a fourfold molar excess of free inositol polyphosphate (IP6, orange). N-terminal residues 1–9 are highlighted. Slight changes in sample pH toward a more acidic value are indicated by the chemical shift change of His50 (H50).
-
Figure 2—figure supplement 4—source data 1
NMR signal intensity ratios of αSyn binding to PC-PI(4,5)P2 vesicles upon Ca addition.
- https://cdn.elifesciences.org/articles/61951/elife-61951-fig2-figsupp4-data1-v2.xlsx
Figure 3 with 1 supplement
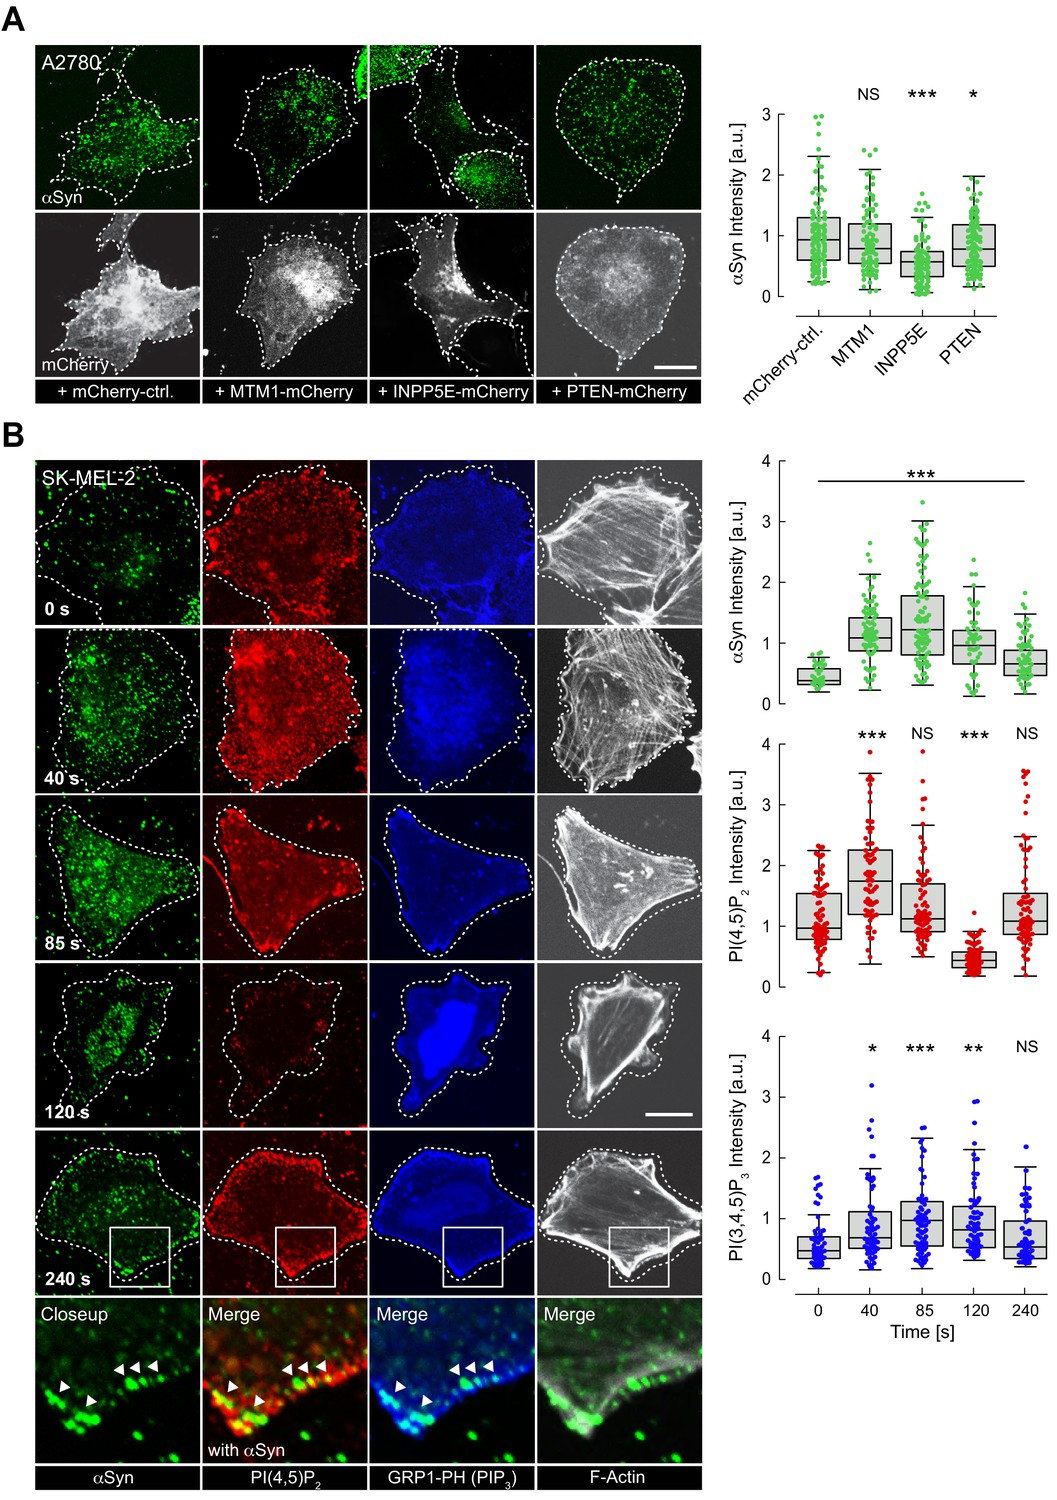
Reversible α-synuclein (αSyn)-plasma membrane (PM) localization.
(A) Representative immunofluorescence localization of αSyn at basal A2780 PM planes by confocal microscopy. Cells transiently expressing PM-targeted, mCherry-tagged phosphatidylinositol phosphate (PIP) phosphatases, with mCherry fluorescence indicating successful transfection and phosphatase expression. Mutant, phosphatase-inactive INPP4A-mCherry-CAAX serves as the negative control (mCherry-ctrl, first panel). Scale bar is 10 μm. Box plots of αSyn immunofluorescence quantifications are shown on the right. Approximately 120 data points were collected per cell in four independent replicate experiments. Box dimensions represent the 25th and 75th percentiles, whiskers extend to the 5th and 95th percentiles. Data points beyond these values were considered outliers. Significance based on analysis of variance (ANOVA) tests with Bonferroni’s post-tests as NS >0.05; ∗p<0.05; ∗∗∗p<0.001. See also Figure 3—source data 1. (B) Time-course experiments following histamine stimulation of SK-MEL-2 cells transiently expressing histamine 1 receptor (H1R) and GRP1-PH. Immunofluorescence detection of endogenous phosphatidylinositol 4,5-bisphosphate (PIP2) and αSyn by confocal microscopy of basal PM regions. GRP1-PH GFP-signals report on the presence of PIP3. Phalloidin staining of F-actin marks cell boundaries. Scale bar is 10 μm. Box plots represent data points collected per cell (n ~ 80) from a single experiment, but representative of three independent experiments with similar results. Significance based on ANOVA tests with Bonferroni’s post-tests as NS >0.05; ∗p<0.05; ∗∗p<0.01; ∗∗∗p<0.001. See also Figure 3—source data 1.
-
Figure 3—source data 1
Quantification of αSyn PM localization following PIP phosphatase expression.
- https://cdn.elifesciences.org/articles/61951/elife-61951-fig3-data1-v2.xlsx
-
Figure 3—source data 2
Quantification of αSyn PM localization after histamine stimulation.
- https://cdn.elifesciences.org/articles/61951/elife-61951-fig3-data2-v2.xlsx
Figure 3—figure supplement 1
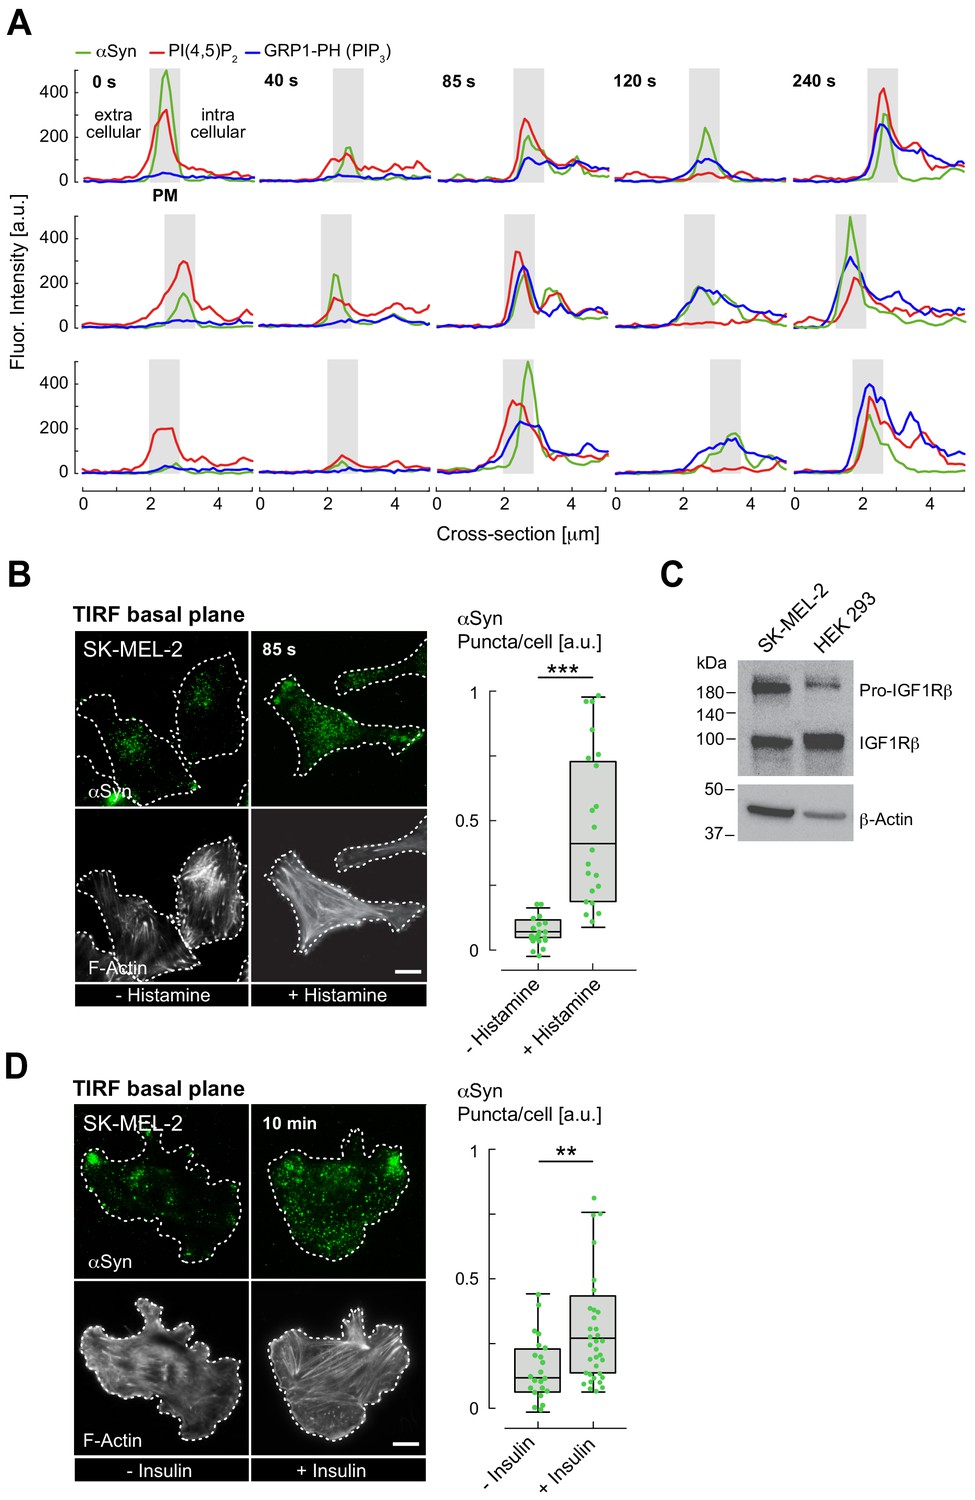
Dynamic αSyn plasma-membrane (PM) localization upon histamine and insulin stimulation.
(A) Spatially resolved fluorescence intensity profiles of α-synuclein (αSyn, green), phosphatidylinositol 4,5-bisphosphate (PIP2,red), and GRP1-PH (PIP3, blue) at the plasma membrane (PM) at indicated time points following histamine stimulation. Individual traces span extracellular and intracellular portions of analyzed cells. PM regions are indicated by gray boxes. (B, D) Immunofluorescence localization of endogenous αSyn in SK-MEL-2 cells by total internal reflection (TIRF) microscopy counterstained with Phalloidin for F-actin to mark cell boundaries. Cells were stimulated with histamine (B) or insulin (D). Quantification of αSyn signals at basal PM regions with and without stimulation shown on the right. Box plots represent data points collected from n~120 cells combined from three independent replicate experiments. Significance based on Student’s t tests as ∗∗p<0.01; ∗∗∗p<0.001. Scale bars are 10 μm. See also Figure 3—figure supplement 1—source data 1 and 3. (C) Western blot of SK-MEL-2 and HEK 293 cell lysates showing the presence of endogenous insulin-like growth factor-1 receptor β (IGF-1 Rβ). β-Actin serves as loading control. See also Figure 3—figure supplement 1—source data 2. PIP3: phosphatidylinositol 3,4,5-trisphosphate.
-
Figure 3—figure supplement 1—source data 1
Quantification of αSyn PM localisation after histamine stimulation.
- https://cdn.elifesciences.org/articles/61951/elife-61951-fig3-figsupp1-data1-v2.xlsx
-
Figure 3—figure supplement 1—source data 2
Uncropped western blot of IGF-1 rb expression levels in SK-MEL-2 and HEK293 cells.
- https://cdn.elifesciences.org/articles/61951/elife-61951-fig3-figsupp1-data2-v2.pdf
-
Figure 3—figure supplement 1—source data 3
Quantification of αSyn PM localization after insulin stimulation.
- https://cdn.elifesciences.org/articles/61951/elife-61951-fig3-figsupp1-data3-v2.xlsx
Author response image 1
Tables
Key resources table
| Reagent type (species) or resource | Designation | Source or reference | Identifiers | Additional information |
|---|---|---|---|---|
| Cell line (Homo sapiens) | A2780 | Sigma-Aldrich | Cat# 93112519 RRID:CVCL_0134 | |
| Cell line (Homo sapiens) | HeLa | Sigma-Aldrich | Cat# 93021013 RRID:CVCL_0030 | |
| Cell line (Homo sapiens) | SH-SY5Y | Sigma-Aldrich | Cat# 94030304 RRID:CVCL_0019 | |
| Cell line (Homo sapiens) | SK-MEL-2 | Dr. Ronit Sharon (Hebrew University, Israel) Schechter et al., 2020a | ||
| Strain, strain background (Escherichia coli) | BL21 (DE3) Star | Thermo Fisher Scientific | Cat# C601003 | Chemically Competent Cells |
| Antibody | Anti-αSyn (mouse monoclonal) | Santa Cruz | Cat# sc69977 RRID:AB_1118910 | IF (1:200) WB (1:100) |
| Antibody | Anti-αSyn MJFR1 (rabbit monoclonal) | Abcam | Cat# ab138501 RRID:AB_2537217 | WB (1:10,000) |
| Antibody | Anti-PI(4,5)P2 (mouse monoclonal) | Echelon Biosciences | Cat# Z-P045 RRID:AB_427225 | IF (1:100) |
| Antibody | Anti-VAMP2 (rabbit monoclonal) | Cell Signalling | Cat# 13508 RRID:AB_2798240 | IF (1:200) |
| Antibody | Anti-beta actin (mouse monoclonal) | Abcam | Cat# ab6276 RRID:AB_2223210 | WB (1:5000) |
| Antibody | Anti-IGF-I Receptor ß (D23H3) (rabbit monoclonal) | Cell Signalling | Cat # 9750 RRID:AB_10950969 | WB (1:1000) |
| Antibody | Anti-mouse IgG Alexa 647 conjugated (goat polyclonal) | Abcam | Cat# ab150119 RRID:AB_2811129 | IF (1:1000) |
| Antibody | Anti-rabbit IgG Alexa 555 conjugated (donkey polyclonal) | Invitrogen | Cat# A-31572 RRID:AB_162543 | IF (1:1000) |
| Antibody | Anti-mouse IgG HRP-conjugated (goat polyclonal) | Sigma-Aldrich | Cat# A9917 RRID:AB_258476 | WB (1:10,000) |
| Antibody | Anti-rabbit IgG HRP-conjugated (goat polyclonal) | Jackson Immuno Research Laboratories | Cat# 111-035-003 RRID:AB_2313567 | WB (1:5000) |
| Recombinant DNA reagent | EGFP-PLCδ1-PH | Dr. Volker Haucke (Leibniz Institute of Molecular Pharmacology, FMP-Berlin, Germany) Várnai and Balla, 1998 | PH domain, binds PI(4,5)P2 at PM | |
| Recombinant DNA reagent | EGFP-tagged phosphatidylinositol 4-phosphate 5-kinase type Iγ (PIPKIγ) | Dr. Volker Haucke (Leibniz Institute of Molecular Pharmacology, FMP-Berlin, Germany) Krauss et al., 2006 | PIP kinase, creates PI(4,5)P2 at PM | |
| Recombinant DNA reagent | EGFP-tagged PIPKIγ D316A (mutated) | This paper Krauss et al., 2006 | PIP kinase, inactive | |
| Recombinant DNA reagent | EGFP-tagged PIPKIγ K188A (mutated) | This paper Krauss et al., 2006 | PIP kinase, inactive | |
| Recombinant DNA reagent | MTM1-mCherry-CAAX | Dr. Volker Haucke (Leibniz Institute of Molecular Pharmacology, FMP-Berlin, Germany) Posor et al., 2013 | PIP phosphatase, acts on PI(3)P Targeted to PM | |
| Recombinant DNA reagent | INPP5E-mCherry-CAAX | Dr. Volker Haucke (Leibniz Institute of Molecular Pharmacology, FMP-Berlin, Germany) Posor et al., 2013 | PIP phosphatase, acts on PI(4,5)P2Targeted to PM | |
| Recombinant DNA reagent | PTEN-mCherry-CAAX | Dr. Volker Haucke (Leibniz Institute of Molecular Pharmacology, FMP-Berlin, Germany) Posor et al., 2013 | PIP phosphatase, acts on PI(3,4,5)P3Targeted to PM | |
| Recombinant DNA reagent | INPP4A-mCherry-CAAX (mutated) | Dr. Volker Haucke (Leibniz Institute of Molecular Pharmacology, FMP-Berlin, Germany) Posor et al., 2013 | PIP phosphatase inactive Targeted to PM | |
| Recombinant DNA reagent | Human histamine 1 receptor (H1R) | Dr. Ronit Sharon (Hebrew University, Israel) Kumar et al., 2017 | Human histamine 1 receptor | |
| Recombinant DNA reagent | GRP1-PH pEGFP-C1 | Addgene Kavran et al., 1998 | Plasmid# 71378 RRID:Addgene_71378 | PH domain binds PI(3,4,5)P3 |
| Sequence-based reagent | PIPKIγ D316A_Fw | This paper | PCR primer (forward) | GTTTCAAGATCATGGCCTACAGCCTGCTGC |
| Sequence-based reagent | PIPKIγ D316A_Rv | This paper | PCR primer (reverse) | GCAGCAGGCTGTAGGCCATGATCTTGAAAC |
| Sequence-based reagent | PIPKIγ K188A_Fw | This paper | PCR primer (forward) | GTTCATCATCGCCACCGTCATGCACAAGGAGG |
| Sequence-based reagent | PIPKIγ K188A_Rv | This paper | PCR primer (reverse) | TCGTCGTCGCTGGTGACG |
| Peptide, recombinant protein | N-terminally acetylated αSyn | This paper Theillet et al., 2016 | Purified from E. coli BL21 (DE3) Star | |
| Peptide, recombinant protein | N-terminally truncated (ΔN) αSyn | This paper Theillet et al., 2016 | Purified from E. coli BL21 (DE3) Star | |
| Peptide, recombinant protein | N-terminally acetylated αSyn (F4A-Y39A) mutated | This paper Theillet et al., 2016 | Purified from E. coli BL21 (DE3) Star | |
| Commercial assay or kit | Q5 Site-Directed Mutagenesis Kit | New England BioLabs | Cat# E0554S | |
| Commercial assay or kit | BCA protein quantification kit | Thermo Fisher | Cat# 23227 | |
| Commercial assay or kit | SuperSignal West Pico PLUS Chemiluminescent Substrate | Thermo Fisher | Cat# 34579 | |
| Chemical compound, drug | All-trans retinoic acid | Sigma-Aldrich | Cat# R2625 | |
| Chemical compound, drug | Recombinant human/murine/rat BDNF | Peprotech | Cat# 450-02 | |
| Software, algorithm | Image Analysis FIJI | imagej.net/Fiji Schindelin et al., 2012 | RRID:SCR_002285 | |
| Software, algorithm | Multi-dimensional NMR data processing PROSA | Dr. Peter Güntert Goethe-University Frankfurt am Main, Germany Güntert et al., 1992 | ||
| Software, algorithm | Computer-aided NMR resonance assignment CARA | cara.nmr.ch | PhD thesis Rochus Keller ETH Nr. 15947 | |
| Others | Lipofectamine 3000 | Thermo Fisher Scientific | Cat# L3000015 | |
| Others | TransIT-X2 | Mirus Bio | Cat# MIR 6000 | |
| Others | DOPC | Avanti Polar Lipids | Cat# 850375 | |
| Others | Brain PI(4,5)P2 | Avanti Polar Lipids | Cat# 840046 | |
| Others | IP6 | Dr. Dorothea Fiedler (Leibniz Institute of Molecular Pharmacology, FMP-Berlin, Germany) | In-house synthesis | |
| Others | PLC from Clostridium perfringens (Clostridium welchii) | Sigma-Aldrich | Cat# 9001-86-9 |
Additional files
Download links
A two-part list of links to download the article, or parts of the article, in various formats.
Downloads (link to download the article as PDF)
Open citations (links to open the citations from this article in various online reference manager services)
Cite this article (links to download the citations from this article in formats compatible with various reference manager tools)
α-Synuclein plasma membrane localization correlates with cellular phosphatidylinositol polyphosphate levels
eLife 10:e61951.
https://doi.org/10.7554/eLife.61951


