Productivity loss associated with functional disability in a contemporary small-scale subsistence population
- Université Toulouse 1 Capitole, France
- Institute for Advanced Study in Toulouse, France
- Economic Science Institute, Chapman University, 1 University Drive, United States
- Center for Evolution and Medicine, Life Sciences C, Arizona State University, United States
- School of Human Evolution and Social Change, Arizona State University, United States
- Department of Anthropology, University of California, Santa Barbara, United States
Figures
Figure 1
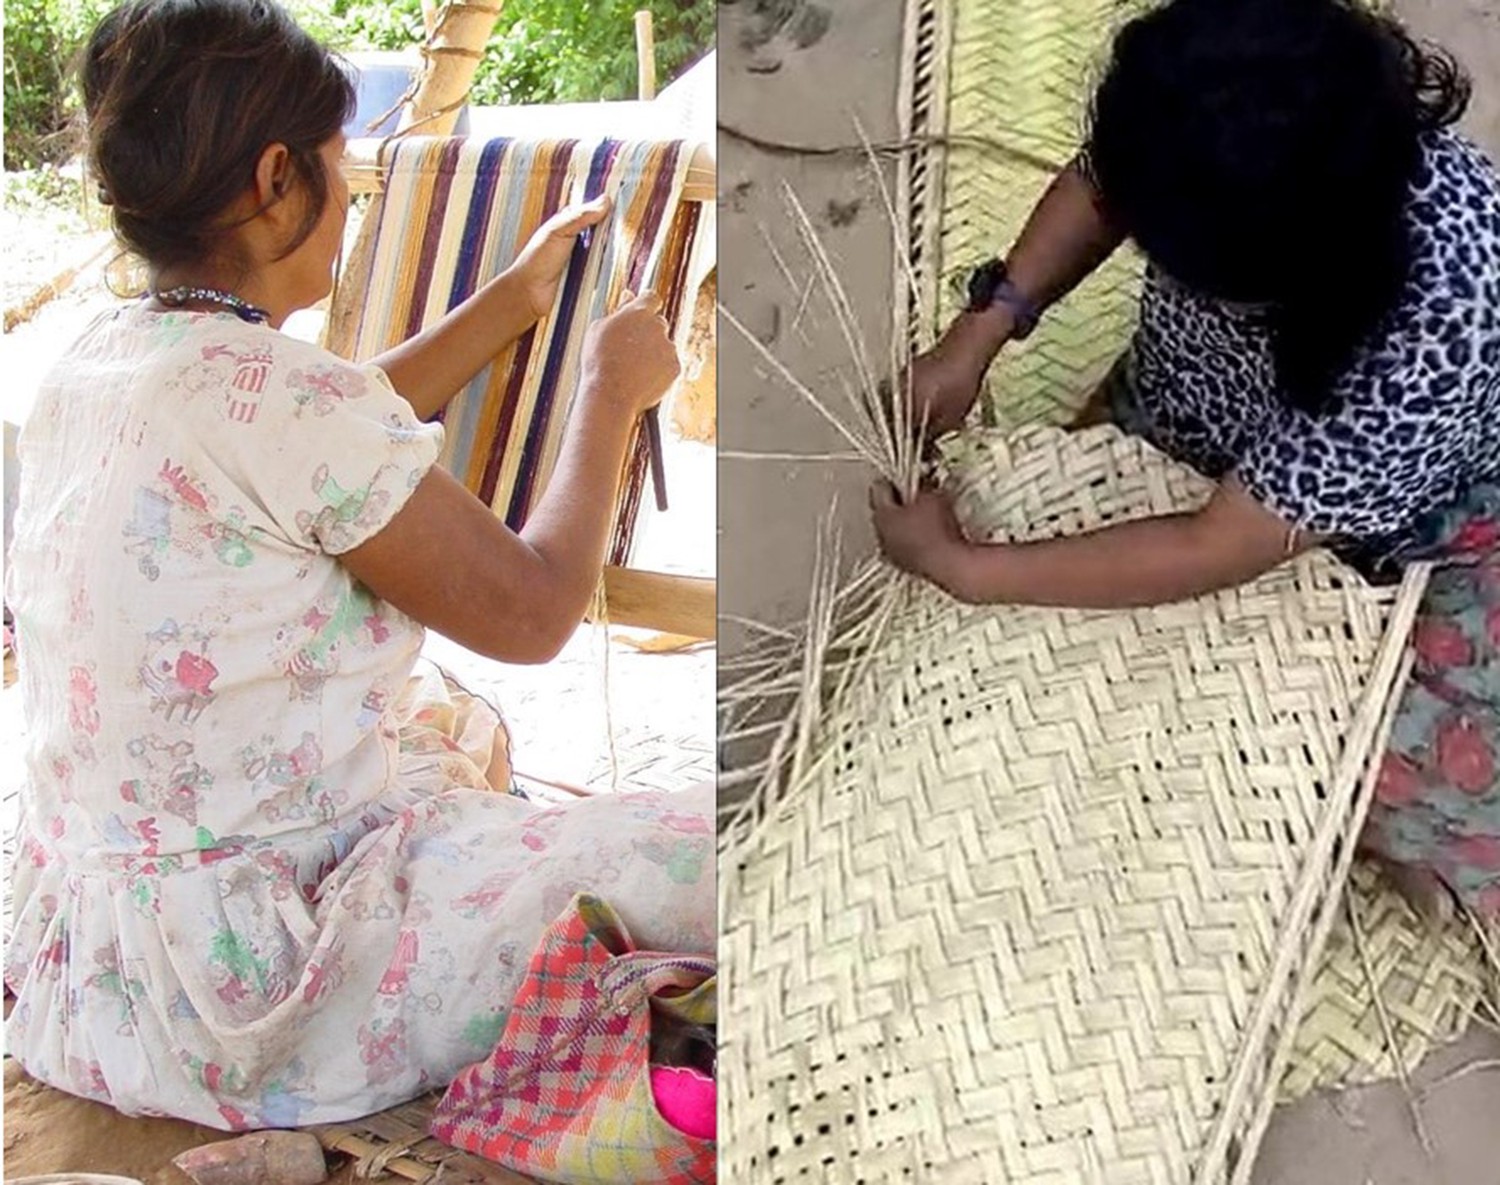
Tsimane women weaving bags used for carrying diverse objects (left panel; photo credit: Jonathan Stieglitz) and ground mats used for resting (right panel; photo credit: Arnulfo Cary).
Finished woven products are also shown in each panel.
Figure 2

Top: Proportion of Tsimane men with thoracic vertebral body fracture (grade ≥1) by age, estimated using the loess function.
The shaded region shows ±1 SE, and jittered data points represent fracture status. Bottom: scatterplot of thoracic vertebral body bone mineral density (BMD) by age and fracture status, including linear regression lines for each fracture status. N = 256 men.
Figure 3
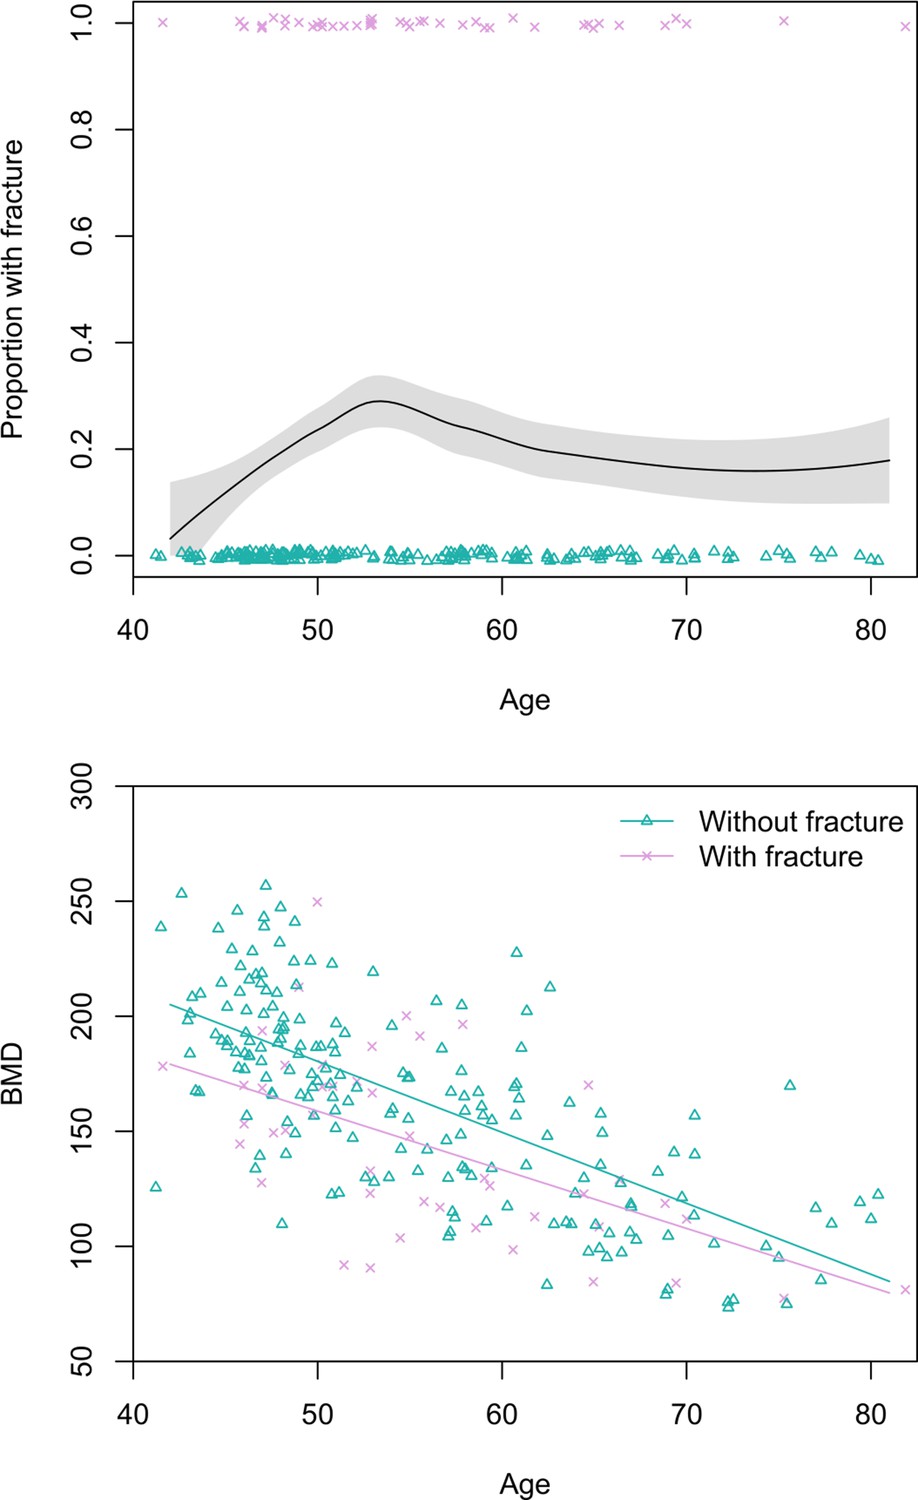
Top: Proportion of Tsimane women with thoracic vertebral body fracture (grade ≥1) by age, estimated using the loess function.
The shaded region shows ±1 SE, and jittered data points represent fracture status. Bottom: scatterplot of thoracic vertebral body bone mineral density (BMD) by age and fracture status, including linear regression lines for each fracture status. N = 237 women.
Figure 4

Top: Age-specific productivity (kcals/day) for hunting by men’s fracture status, and for fishing (all men).
Bottom: expected cumulative future productivity (millions of kcals) from age x onward, discounted by mortality, for hunting by men’s fracture status, and for fishing (all men).
Figure 5
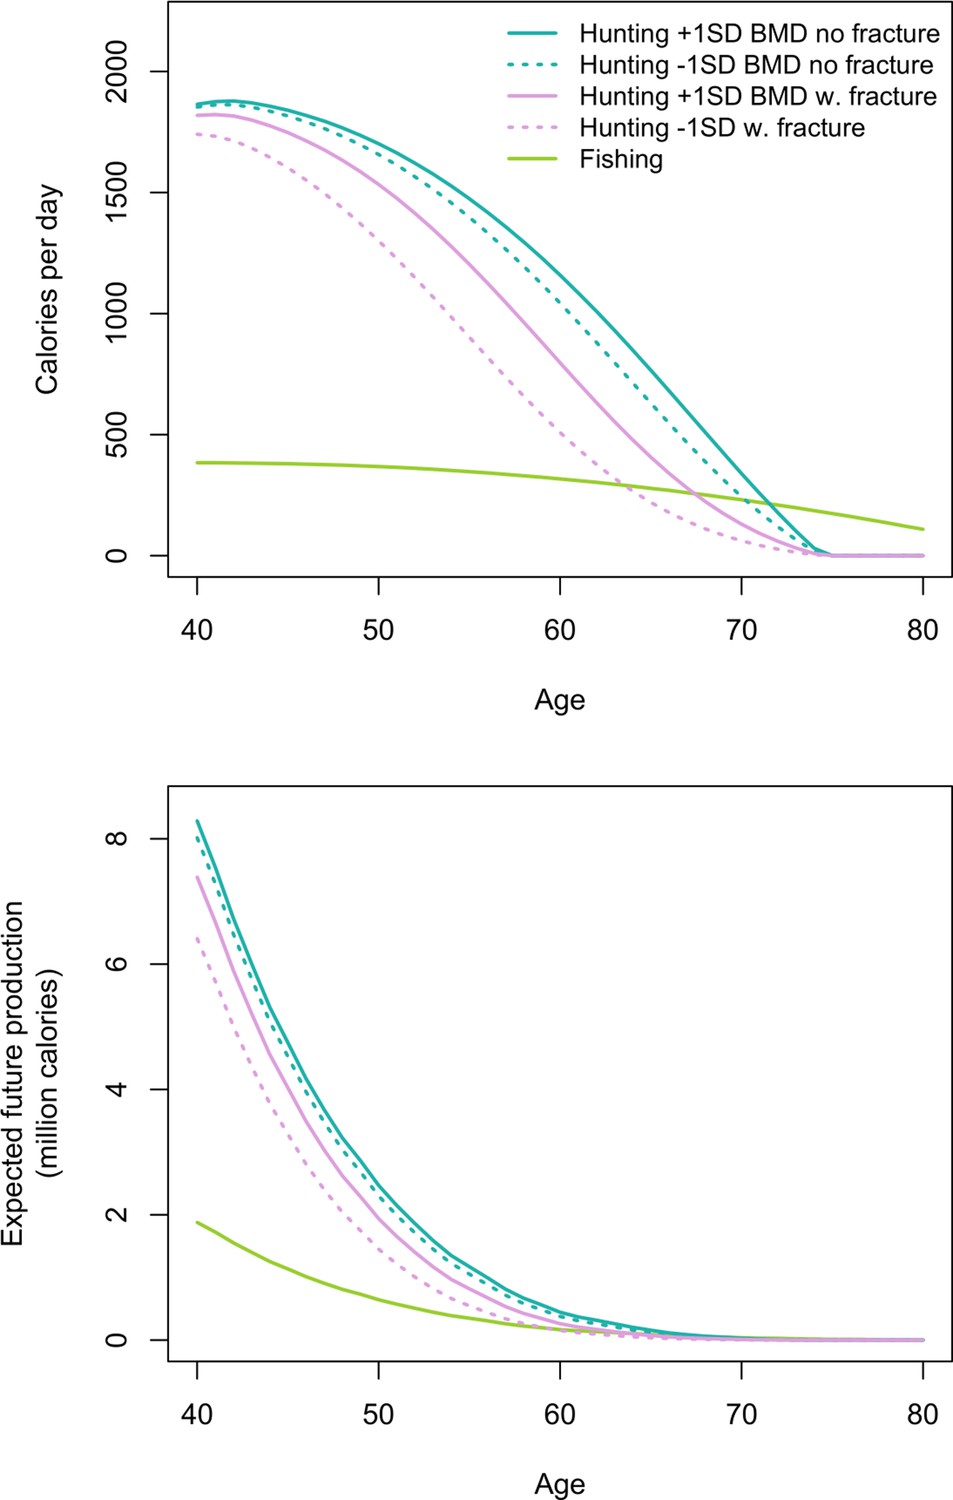
Top: Age-specific productivity (kcals/day) for hunting by men’s fracture status and bone mineral density (BMD), and for fishing (all men).
For illustrative purposes we show daily hunting production for men with +1 SD and −1 SD of the BMD mean. Bottom: expected cumulative future productivity (millions of kcals) from age x onward, discounted by mortality, for hunting by men’s fracture status and BMD, and for fishing (all men).
Figure 6
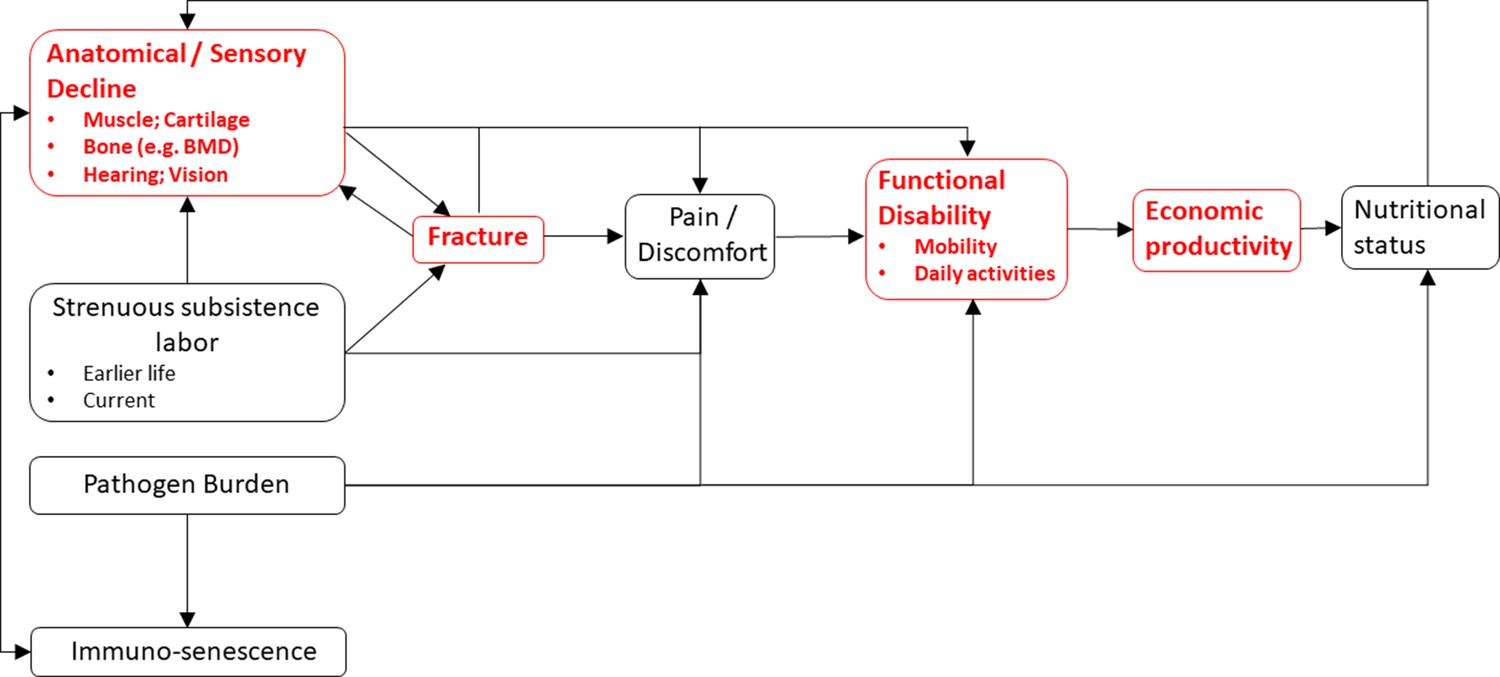
A conceptual model linking somatic condition to economic productivity during aging in small-scale subsistence societies.
Variables in red are a focus of the present study.
Tables
Table 1
Percentage of men (95% CI) who completely ceased hunting by age and thoracic vertebral body fracture status.
| Age category (years) | % ceased hunting with fracture | N | % ceased hunting without fracture | N |
|---|---|---|---|---|
| 40–49 | 8^ (<1–19) | 26 | 0 (-----) | 55 |
| 50–59 | 33*** (17–50) | 36 | 4 (<1–9) | 56 |
| 60–69 | 50^ (24–76) | 18 | 27 (12–42) | 37 |
| 70+ | 100* (-----) | 12† | 63 (36–89) | 16‡ |
| Total | 38*** (28–48) | 92 | 13 (8–19) | 164 |
-
^p≤0.1, *p≤0.05, **p≤0.01, ***p≤0.001 (χ² or Fisher’s Exact Test [vs. no fracture]).
†Max age = 83 years (mean ± SD = 75 ± 4).
-
‡Max age = 81 years (mean ± SD = 74 ± 3).
Table 2
Percentage of men (95% CI) who completely ceased tree chopping by age and thoracic vertebral body fracture status.
| Age category (years) | % ceased tree chopping with fracture | N | % ceased tree chopping without fracture | N |
|---|---|---|---|---|
| 40–49 | 15** (1–30) | 26 | 0 (-----) | 55 |
| 50–59 | 39*** (22–56) | 36 | 4 (<1–9) | 56 |
| 60–69 | 67 (43–91) | 18 | 54 (37–71) | 37 |
| 70+ | 100 (-----) | 12† | 81 (60–100) | 16‡ |
| Total | 46*** (35–56) | 92 | 21 (15–28) | 164 |
-
^p≤0.1, *p≤0.05, **p≤0.01, ***p≤0.001 (χ² or Fisher’s Exact Test [vs. no fracture]).
†Max age = 83 years (mean ± SD = 75 ± 4).
-
‡Max age = 81 years (mean ± SD = 74 ± 3).
Table 3
Percentage of women (95% CI) who completely ceased weaving by age and thoracic vertebral body fracture status.
| Age category (years) | % ceased weaving with fracture | N | % ceased weaving without fracture | N |
|---|---|---|---|---|
| 40–49 | 0 (-----) | 11 | 0 (-----) | 72 |
| 50–59 | 14 (<1–29) | 22 | 5 (<1–11) | 60 |
| 60–69 | 33 (<1–72) | 9 | 24 (10–39) | 37 |
| 70+ | 75 (<1–100) | 4† | 55 (32–77) | 22‡ |
| Total | 20 (8–31) | 46 | 13 (8–17) | 191 |
-
^p≤0.1, *p≤0.05, **p≤0.01, ***p≤0.001 (χ² or Fisher’s Exact Test [vs. no fracture]).
†Max age = 91 years (mean ± SD = 80 ± 9).
-
‡Max age = 91 years (mean ± SD = 77 ± 6).
Table 4
Percentage of adults (95% CI) who are unable to walk a full day by age and thoracic vertebral body fracture status.
| Age category (years) | % unable to walk all day with fracture | N | % unable to walk all day without fracture | N |
|---|---|---|---|---|
| 40–49 | 49*** (32–66) | 37 | 19 (12–26) | 127 |
| 50–59 | 64*** (51–77) | 58 | 27 (19–35) | 116 |
| 60–69 | 89** (76–100) | 27 | 64 (52–75) | 74 |
| 70+ | 100^ (-----) | 16† | 84 (72–96) | 38‡ |
| Total | 69*** (61–77) | 138 | 38 (33–43) | 355 |
-
^p≤0.1, *p≤0.05, **p≤0.01, ***p≤0.001 (χ² or Fisher’s Exact Test [vs. no fracture]).
†Max age = 91 years (mean ± SD = 76 ± 6).
-
‡Max age = 91 years (mean ± SD = 76 ± 5).
Appendix 1—table 1
Descriptives for study variables*.
| Variable | N | Mean | SD | Min | Max |
|---|---|---|---|---|---|
| Thoracic vertebral body BMD (mg/cm3) | 493 | 165.5 | 41.3 | 68.9 | 315.0 |
| Any thoracic vertebral body (T6–T12) fracture (proportion grade ≥1) | 493 | 0.28 | 0.45 | 0 | 1 |
| Any thoracic vertebral body (T6–T12) fracture (proportion grade ≥2) | 493 | 0.09 | 0.29 | 0 | 1 |
| Age (years) | 493 | 55.9 | 9.9 | 41.2 | 91.0 |
| Sex (proportion male) | 493 | 0.52 | 0.5 | 0 | 1 |
| Height (cm) | 489 | 156.1 | 7.6 | 136.0 | 176.3 |
| Weight (kg) | 489 | 58.7 | 9.8 | 34.6 | 96.9 |
| Body fat (%) | 445 | 21.5 | 8.0 | 5.0 | 46.7 |
| Fat mass (kg) | 445 | 12.9 | 6.1 | 1.9 | 42.1 |
| Fat-free mass (kg) | 445 | 45.8 | 7.9 | 27.8 | 73.1 |
-
*Data were missing for various reasons (see Appendix for details).
Appendix 1—table 2
Percentage of men (95% CI) who completely ceased hunting by age and thoracic vertebral body fracture status (fracture grade ≥2).
| Age category (years) | % ceased hunting with fracture | N | % ceased hunting without fracture | N |
|---|---|---|---|---|
| 40–49 | 0 (-----) | 4 | 3 (<1–6) | 77 |
| 50–59 | 21 (<1–46) | 14 | 14 (6–22) | 78 |
| 60–69 | 60 (<1–1) | 5 | 32 (19–45) | 50 |
| 70+ | 100 (-----) | 6† | 73 (53–93) | 22‡ |
| Total | 41** (22–60) | 29 | 20 (15–25) | 227 |
-
^p≤0.1, *p≤0.05, **p≤0.01, ***p≤0.001 (χ² or Fisher’s Exact Test [vs. no fracture]).
†Max age = 83 years (mean ± SD = 74 ± 4).
-
‡Max age = 83 years (mean ± SD = 74 ± 3).
Appendix 1—table 3
Binary logistic regression: effect of thoracic vertebral body fracture on the probability of hunting cessation after adjusting for age (model 1; n = 256 men).
Model 2 additionally includes as a covariate thoracic vertebral body bone mineral density (BMD). Shown are odds ratios (95% CIs); continuous variables are z-scored.
| Parameter | Model 1 | Model 2 (+BMD) |
|---|---|---|
| Any thoracic vertebral body fracture (grade ≥1; vs. none) | 7.3***(3.3–17.6) | 7.4***(3.3–18.2) |
| Age (years) | 5.2***(3.4–8.5) | 4.1***(2.5–7.0) |
| Thoracic vertebral body BMD (mg/cm3) | ----- | 0.62*(0.38–0.99) |
| AIC | 178.55 | 176.61 |
-
^p≤0.1, *p≤0.05, **p≤0.01, ***p≤0.001 (refer to main text for FDR q-values)
Appendix 1—table 4
Tsimane men’s age-specific daily hunting production by thoracic vertebral body fracture status.
| Age (years) | (A) Hunt cals/day† | (B) Probability still hunting: no fracture‡ | (C) Probability still hunting: fracture‡ | (D) Hunt cals/day: no fracture§ | (E) Hunt cals/day: fracture¶ |
|---|---|---|---|---|---|
| 40 | 1872 | 0.995 | 0.968 | 1864 | 1812 |
| 41 | 1884 | 0.995 | 0.962 | 1874 | 1813 |
| 42 | 1888 | 0.994 | 0.955 | 1875 | 1803 |
| 43 | 1882 | 0.992 | 0.947 | 1868 | 1783 |
| 44 | 1870 | 0.991 | 0.938 | 1853 | 1754 |
| 45 | 1855 | 0.989 | 0.927 | 1835 | 1720 |
| 46 | 1836 | 0.987 | 0.915 | 1813 | 1680 |
| 47 | 1815 | 0.985 | 0.900 | 1787 | 1634 |
| 48 | 1790 | 0.982 | 0.884 | 1758 | 1582 |
| 49 | 1762 | 0.979 | 0.865 | 1725 | 1524 |
| 50 | 1731 | 0.975 | 0.843 | 1687 | 1459 |
| 51 | 1697 | 0.970 | 0.819 | 1646 | 1389 |
| 52 | 1659 | 0.965 | 0.792 | 1601 | 1314 |
| 53 | 1619 | 0.958 | 0.762 | 1551 | 1233 |
| 54 | 1575 | 0.951 | 0.729 | 1498 | 1148 |
| 55 | 1528 | 0.942 | 0.694 | 1440 | 1060 |
| 56 | 1478 | 0.932 | 0.656 | 1378 | 969 |
| 57 | 1425 | 0.920 | 0.616 | 1311 | 878 |
| 58 | 1369 | 0.906 | 0.574 | 1241 | 786 |
| 59 | 1310 | 0.891 | 0.531 | 1166 | 696 |
| 60 | 1247 | 0.873 | 0.488 | 1088 | 609 |
| 61 | 1181 | 0.852 | 0.445 | 1007 | 526 |
| 62 | 1113 | 0.829 | 0.403 | 923 | 449 |
| 63 | 1041 | 0.803 | 0.362 | 836 | 377 |
| 64 | 966 | 0.775 | 0.323 | 748 | 313 |
| 65 | 888 | 0.743 | 0.287 | 660 | 255 |
| 66 | 807 | 0.709 | 0.253 | 572 | 204 |
| 67 | 723 | 0.672 | 0.222 | 486 | 160 |
| 68 | 636 | 0.633 | 0.193 | 402 | 123 |
| 69 | 546 | 0.592 | 0.168 | 323 | 92 |
| 70 | 452 | 0.549 | 0.145 | 249 | 66 |
| 71 | 356 | 0.506 | 0.125 | 180 | 44 |
| 72 | 257 | 0.463 | 0.107 | 119 | 28 |
| 73 | 154 | 0.421 | 0.092 | 65 | 14 |
| 74 | 49 | 0.379 | 0.078 | 19 | 4 |
| 75 | 0 | 0.339 | 0.067 | 0 | 0 |
| 76 | 0 | 0.302 | 0.057 | 0 | 0 |
| 77 | 0 | 0.267 | 0.048 | 0 | 0 |
| 78 | 0 | 0.234 | 0.041 | 0 | 0 |
| 79 | 0 | 0.205 | 0.035 | 0 | 0 |
| 80 | 0 | 0.178 | 0.029 | 0 | 0 |
-
†Predicted values (loess fit). From Jan 2005 to Dec 2009 adults were interviewed once or twice per week about time allocation and production for each co-resident individual over age 6 during the previous 2 days (n = 1245 individuals from 11 villages).
‡Predicted from binary logistic regression of whether one still hunts on thoracic vertebral body fracture status (i.e. grade ≥1; vs. none) and age.
-
§Derived by multiplying value in column A by value in column B.
¶Derived by multiplying value in column A by value in column C.
Appendix 1—table 5
Tsimane men’s age-specific daily hunting production by thoracic vertebral body fracture status and thoracic vertebral body bone mineral density (BMD).
For illustrative purposes we report estimates holding BMD at +1 SD and −1 SD of the mean.
| Age (years) | (A) Hunt cals/day* | (B) Probability still hunting: no fracture and +1 SD BMD† | (C) Probability still hunting: no fracture and −1 SD BMD† | (D) Probability still hunting: fracture and +1 SD BMD† | (E) Probability still hunting: fracture and −1 SD BMD† | (F) Hunt cals/day: no fracture and +1 SD BMD‡ | (G) Hunt cals/day: no fracture and −1 SD BMD§ | (H) Hunt cals/day: fracture and +1 SD BMD¶ | (I) Hunt cals/day: fracture and −1 SD BMD** |
|---|---|---|---|---|---|---|---|---|---|
| 40 | 1872 | 0.996 | 0.990 | 0.971 | 0.930 | 1865 | 1853 | 1819 | 1741 |
| 41 | 1884 | 0.995 | 0.988 | 0.967 | 0.920 | 1875 | 1862 | 1822 | 1732 |
| 42 | 1888 | 0.995 | 0.987 | 0.962 | 0.908 | 1878 | 1863 | 1816 | 1714 |
| 43 | 1882 | 0.994 | 0.984 | 0.956 | 0.895 | 1870 | 1853 | 1800 | 1684 |
| 44 | 1870 | 0.993 | 0.982 | 0.950 | 0.880 | 1857 | 1836 | 1776 | 1646 |
| 45 | 1855 | 0.992 | 0.979 | 0.942 | 0.864 | 1840 | 1816 | 1747 | 1602 |
| 46 | 1836 | 0.990 | 0.976 | 0.933 | 0.845 | 1819 | 1792 | 1714 | 1552 |
| 47 | 1815 | 0.989 | 0.972 | 0.924 | 0.825 | 1795 | 1764 | 1676 | 1497 |
| 48 | 1790 | 0.987 | 0.968 | 0.913 | 0.802 | 1767 | 1732 | 1633 | 1436 |
| 49 | 1762 | 0.985 | 0.963 | 0.900 | 0.778 | 1736 | 1697 | 1586 | 1371 |
| 50 | 1731 | 0.983 | 0.957 | 0.886 | 0.751 | 1701 | 1657 | 1533 | 1301 |
| 51 | 1697 | 0.980 | 0.951 | 0.870 | 0.723 | 1664 | 1614 | 1476 | 1226 |
| 52 | 1659 | 0.977 | 0.943 | 0.852 | 0.692 | 1621 | 1565 | 1414 | 1148 |
| 53 | 1619 | 0.974 | 0.935 | 0.833 | 0.660 | 1576 | 1514 | 1348 | 1068 |
| 54 | 1575 | 0.970 | 0.925 | 0.811 | 0.626 | 1527 | 1458 | 1278 | 986 |
| 55 | 1528 | 0.965 | 0.915 | 0.788 | 0.591 | 1474 | 1397 | 1203 | 902 |
| 56 | 1478 | 0.960 | 0.902 | 0.762 | 0.554 | 1418 | 1334 | 1126 | 819 |
| 57 | 1425 | 0.953 | 0.888 | 0.734 | 0.518 | 1359 | 1266 | 1046 | 738 |
| 58 | 1369 | 0.946 | 0.873 | 0.704 | 0.481 | 1296 | 1195 | 964 | 658 |
| 59 | 1310 | 0.938 | 0.856 | 0.672 | 0.444 | 1229 | 1121 | 881 | 582 |
| 60 | 1247 | 0.929 | 0.836 | 0.639 | 0.408 | 1159 | 1043 | 797 | 509 |
| 61 | 1181 | 0.919 | 0.815 | 0.604 | 0.373 | 1085 | 963 | 714 | 440 |
| 62 | 1113 | 0.907 | 0.792 | 0.568 | 0.339 | 1010 | 881 | 633 | 377 |
| 63 | 1041 | 0.894 | 0.766 | 0.532 | 0.307 | 931 | 798 | 554 | 319 |
| 64 | 966 | 0.879 | 0.739 | 0.495 | 0.276 | 849 | 714 | 478 | 267 |
| 65 | 888 | 0.862 | 0.709 | 0.458 | 0.248 | 766 | 630 | 407 | 220 |
| 66 | 807 | 0.844 | 0.678 | 0.422 | 0.221 | 681 | 547 | 340 | 178 |
| 67 | 723 | 0.823 | 0.645 | 0.386 | 0.197 | 595 | 466 | 279 | 142 |
| 68 | 636 | 0.801 | 0.610 | 0.352 | 0.174 | 509 | 388 | 224 | 111 |
| 69 | 546 | 0.776 | 0.575 | 0.319 | 0.154 | 424 | 314 | 174 | 84 |
| 70 | 452 | 0.750 | 0.538 | 0.288 | 0.136 | 339 | 243 | 130 | 61 |
| 71 | 356 | 0.721 | 0.501 | 0.258 | 0.119 | 257 | 178 | 92 | 42 |
| 72 | 257 | 0.690 | 0.464 | 0.231 | 0.105 | 177 | 119 | 59 | 27 |
| 73 | 154 | 0.658 | 0.428 | 0.206 | 0.092 | 101 | 66 | 32 | 14 |
| 74 | 49 | 0.624 | 0.392 | 0.183 | 0.080 | 31 | 19 | 9 | 4 |
| 75 | 0 | 0.588 | 0.358 | 0.162 | 0.070 | 0 | 0 | 0 | 0 |
| 76 | 0 | 0.552 | 0.324 | 0.143 | 0.061 | 0 | 0 | 0 | 0 |
| 77 | 0 | 0.515 | 0.293 | 0.125 | 0.053 | 0 | 0 | 0 | 0 |
| 78 | 0 | 0.479 | 0.263 | 0.110 | 0.046 | 0 | 0 | 0 | 0 |
| 79 | 0 | 0.442 | 0.236 | 0.096 | 0.040 | 0 | 0 | 0 | 0 |
| 80 | 0 | 0.406 | 0.210 | 0.084 | 0.035 | 0 | 0 | 0 | 0 |
-
*Predicted values (loess fit). From Jan 2005 to Dec 2009 adults were interviewed once or twice per week about time allocation and production for each co-resident individual over age 6 during the previous 2 days (n = 1245 individuals from 11 villages).
†Predicted from binary logistic regression of whether one still hunts on thoracic vertebral body fracture status (i.e. grade ≥1; vs. none), BMD (mg/cm3) and age (years).
-
‡Derived by multiplying value in column A by value in column B.
§Derived by multiplying value in column A by value in column C.
-
¶Derived by multiplying value in column A by value in column D.
**Derived by multiplying value in column A by value in column E.
Appendix 1—table 6
Binary logistic regression: effect of thoracic vertebral body fracture on the probability of tree chopping cessation after adjusting for age (model 1; n = 256 men).
Model 2 additionally includes as a covariate thoracic vertebral body bone mineral density (BMD). Shown are odds ratios (95% CIs); continuous variables are z-scored.
| Parameter | Model 1 | Model 2 (+BMD) |
|---|---|---|
| Any thoracic vertebral body fracture (grade ≥1; vs. none) | 6.9***(3.1–16.6) | 6.8***(3.1–16.6) |
| Age (years) | 8.0***(4.9–13.9) | 6.8***(4.0–12.4) |
| Thoracic vertebral body BMD (mg/cm3) | ----- | 0.75 (0.47–1.16) |
| AIC | 183.41 | 183.75 |
-
^p≤0.1, *p≤0.05, **p≤0.01, ***p≤0.001 (refer to main text for FDR q-values).
Appendix 1—table 7
Binary logistic regression: effect of thoracic vertebral body fracture on the probability of weaving cessation after adjusting for age (model 1; n = 237 women).
Model 2 additionally includes as a covariate thoracic vertebral body bone mineral density (BMD). Shown are odds ratios (95% CIs); continuous variables are z-scored.
| Parameter | Model 1 | Model 2 (+BMD) |
|---|---|---|
| Any thoracic vertebral body fracture (grade ≥1; vs. none) | 2.2 (0.8–6.4) | 1.8 (0.6–5.4) |
| Age (years) | 4.9***(3.1–8.6) | 3.3***(1.8–6.6) |
| Thoracic vertebral body BMD (mg/cm3) | ----- | 0.51^(0.23–1.05) |
| AIC | 134.52 | 133.18 |
-
^p≤0.1, *p≤0.05, **p≤0.01, ***p≤0.001 (refer to main text for FDR q-values).
Appendix 1—table 8
Self-reported reasons for weaving cessation by thoracic vertebral body fracture status.
Shown are percentages of women reporting a given reason.
| Reason for weaving cessation | Fracture (n = 9) | No fracture (n = 24) | Total (n = 33) |
|---|---|---|---|
| Problem with hips | 100 | 100 | 100 |
| Problem with back | 100 | 100 | 100 |
| Problem with fingers | 100 | 100 | 100 |
| Problem with hands (other than fingers) | 100 | 100 | 100 |
| Any problem with hips, back, or hands | 100 | 100 | 100 |
| Difficulty sitting | 100 | 100 | 100 |
| Difficulty seeing | 89 | 88 | 88 |
-
^p≤0.1, *p≤0.05, **p≤0.01, ***p≤0.001 (χ² or Fisher’s Exact test [vs. no fracture]).
Appendix 1—table 9
Binary logistic regression: effect of thoracic vertebral body fracture on the probability of not being able to walk a full day after adjusting for age and sex (model 1; n = 493 adults).
Model 2 additionally includes as a covariate thoracic vertebral body bone mineral density (BMD). Shown are odds ratios (95% CIs); continuous variables are z-scored. Interaction terms between sex and either fracture, age or BMD do not yield significant parameter estimates and are not shown.
| Parameter | Model 1 | Model 2 (+BMD) |
|---|---|---|
| Any thoracic vertebral body fracture (grade ≥1; vs. none) | 8.2***(4.8–14.5) | 7.8***(4.5–13.8) |
| Age (years) | 4.0***(3.1–5.4) | 3.4***(2.4–4.8) |
| Sex = male | 0.19***(0.11–0.31) | 0.21***(0.12–0.34) |
| Thoracic vertebral body BMD (mg/cm3) | ----- | 0.77^(0.57–1.03) |
| AIC | 479.60 | 478.52 |
-
^p≤0.1, *p≤0.05, **p≤0.01, ***p≤0.001 (refer to main text for FDR q-values).
Appendix 1—table 10
Self-reported reasons for hunting cessation by thoracic vertebral body fracture status.
Shown are percentages of men reporting a given reason.
| Reason for hunting cessation | Fracture (n = 34) | No fracture (n = 22) | Total (n = 56†) |
|---|---|---|---|
| Problem with hips | 29**‡ | 0 | 18 |
| Problem with back | 53 | 59 | 55 |
| Problem with arms | 12 | 23 | 16 |
| Problem with legs | 56 | 55 | 55 |
| Any problem with hips, back, or limbs | 77 | 86 | 80 |
| Feels weak | 29^ | 50 | 38 |
| Tires easily | 59 | 64 | 61 |
| Tires easily or feels weak | 65 | 77 | 70 |
| Difficulty hearing | 38 | 50 | 43 |
| Difficulty seeing | 62 | 77 | 68 |
| Difficulty hearing or seeing | 65 | 82 | 71 |
-
^p≤0.1, *p≤0.05, **p≤0.01, ***p≤0.001 (χ² or Fisher’s Exact test [vs. no fracture]).
†Fracture data are missing for one man. For another man self-reported data are missing.
-
‡FDR q = 0.012.
Note: only q-values ≤0.05 are reported.
Appendix 1—table 11
Self-reported reasons for tree chopping cessation by thoracic vertebral body fracture status.
Shown are percentages of men reporting a given reason.
| Reason for tree chopping cessation | Fracture (n = 41) | No fracture (n = 35) | Total (n = 76†) |
|---|---|---|---|
| Problem with hips | 29*‡ | 9 | 20 |
| Problem with back | 59 | 71 | 64 |
| Problem with arms | 66^ | 83 | 74 |
| Problem with legs | 29 | 26 | 28 |
| Any problem with hips, back, or limbs | 83 | 94 | 88 |
| Feels weak | 54 | 54 | 54 |
| Tires easily | 63 | 71 | 67 |
| Tires easily or feels weak | 80 | 83 | 82 |
-
^p≤0.1, *p≤0.05, **p≤0.01, ***p≤0.001 (χ² or Fisher’s Exact test [vs. no fracture]).
†Fracture data are missing for one man. For another man self-reported data are missing.
-
‡FDR q = 0.036.
Note: only q-values ≤0.05 are reported.
Appendix 1—table 12
Self-reported reasons for inability to walk all day by thoracic vertebral body fracture status.
Shown are percentages of adults (pooled sexes) reporting a given reason.
| Reason for inability to walk all day | Fracture (n = 95) | No fracture (n = 134) | Total (n = 229†) |
|---|---|---|---|
| Problem with hips | 39 | 39 | 39 |
| Problem with back | 61 | 69 | 66 |
| Problem with arms | 8 | 8 | 8 |
| Problem with legs | 81 | 86 | 84 |
| Any problem with hips, back, or limbs | 88 | 93 | 91 |
| Feels weak | 29 | 31 | 31 |
| Tires easily | 71 | 60 | 65 |
| Tires easily or feels weak | 76 | 69 | 72 |
-
^p≤0.1, *p≤0.05, **p≤0.01, ***p≤0.001 (χ² or Fisher’s Exact test [vs. no fracture]).
†Fracture data are missing for one adult.
Additional files
Download links
A two-part list of links to download the article, or parts of the article, in various formats.
Downloads (link to download the article as PDF)
Open citations (links to open the citations from this article in various online reference manager services)
Cite this article (links to download the citations from this article in formats compatible with various reference manager tools)
Productivity loss associated with functional disability in a contemporary small-scale subsistence population
eLife 9:e62883.
https://doi.org/10.7554/eLife.62883


