Cortical excitability signatures for the degree of sleepiness in human
- Department of Rehabilitation Medicine, Huashan Hospital, Fudan University, China
- Institute of Neuroscience, State Key Laboratory of Neuroscience, Center for Excellence in Brain Science and Intelligence Technology, Chinese Academy of Sciences, China
- Shanghai Center for Brain Science and Brain-Inspired Intelligence Technology, China
- Institute of Brain Science, Fudan University, China
- Shanghai Key Laboratory of Psychotic Disorders, Shanghai Mental HealthCenter, Shanghai Jiaotong University School of Medicine, China
- Co-innovation Center of Neuroregeneration, Nantong University, China
- Translational Research Institute of Brain and Brain-Like Intelligence, Shanghai Fourth People’s Hospital Affiliated to Tongji University School of Medicine, China
Figures
Figure 1 with 2 supplements
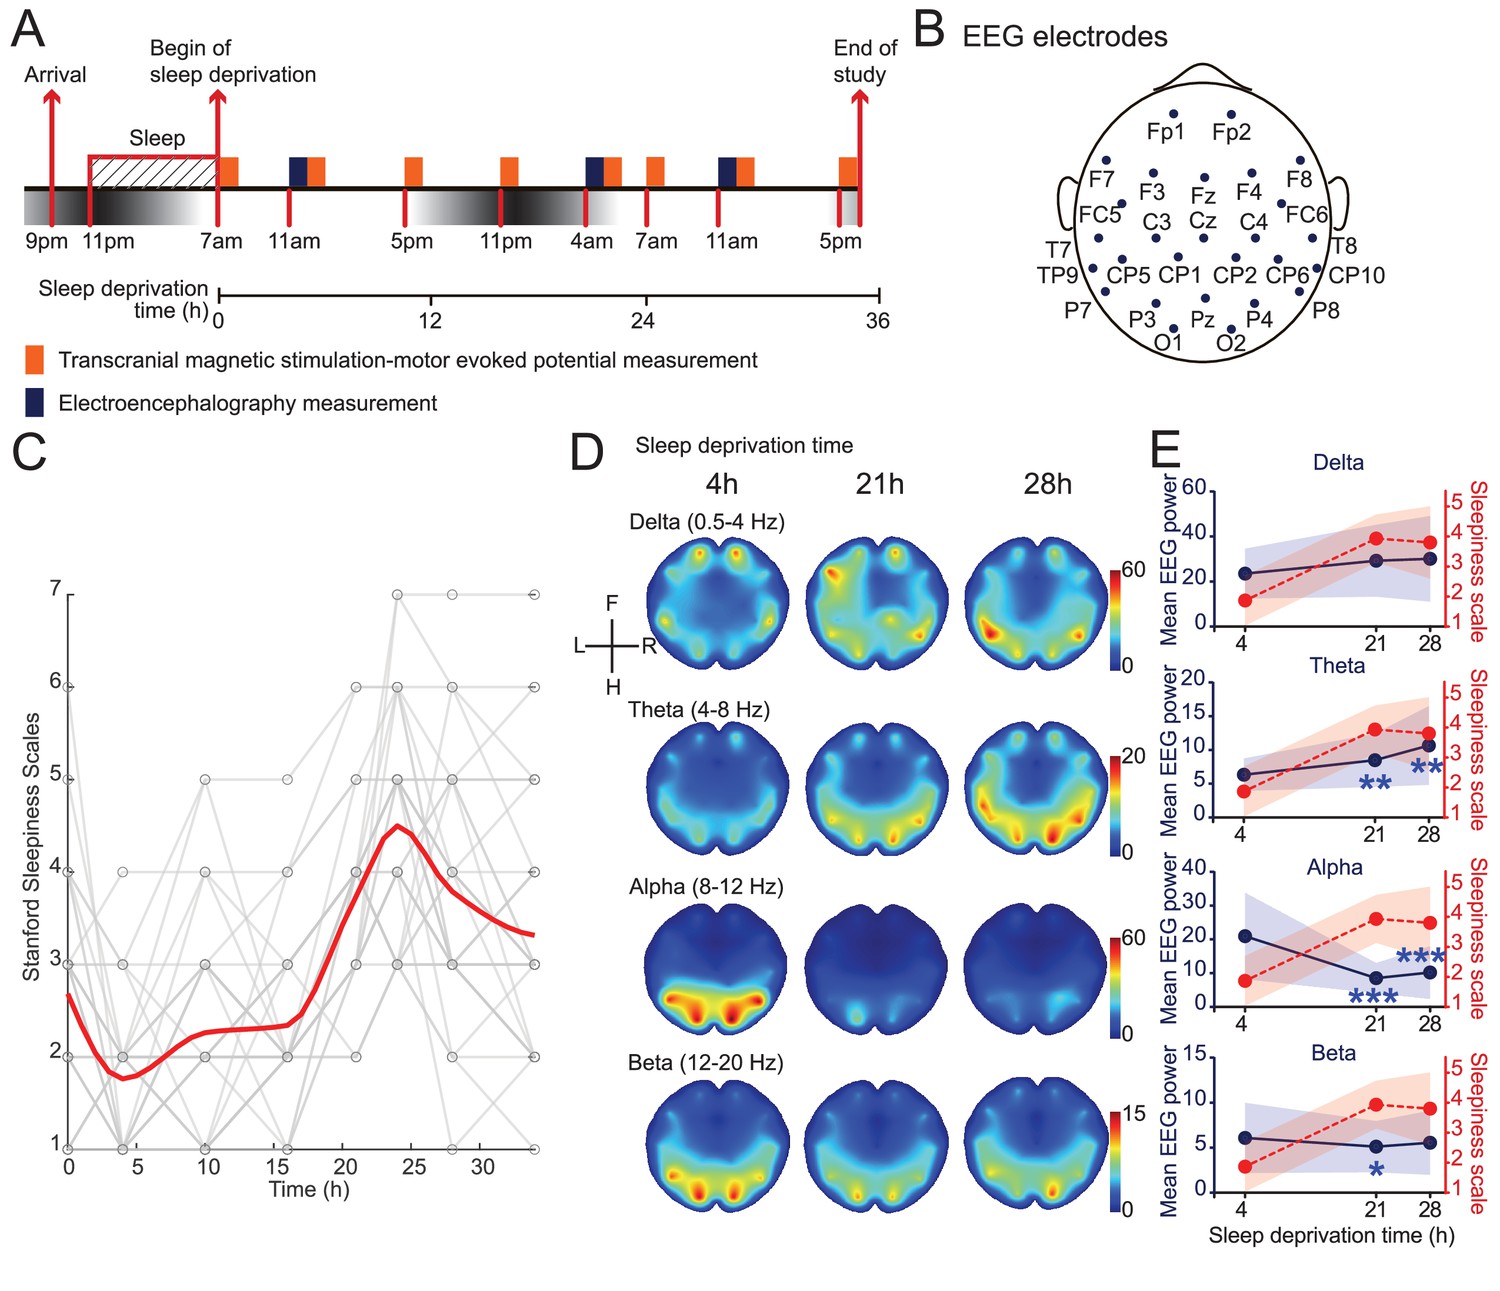
Induction and validation of sleep deprivation in current study.
(A) Schematics of study design. All subjects received eight sessions of transcranial magnetic stimulation (TMS) measurements, but only 15 subjects received electroencephalogram (EEG) measurements (Figure 1—figure supplement 1). (B) Locations of EEG electrodes used in the study. Positionings are labeled following the extended international 10–20 system. (C) Measurements of self-report sleepiness using Stanford Sleepiness Scales (SSS). All individuals received eight measurements. Individuals’ scores were showed in gray and averaged responses were plotted in red curve (applied spline interpolation for smooth visualization). Statistical comparisons between sessions are reported in Figure 1—figure supplement 2. (D) Averaged heatmaps of different frequency bands’ powers in EEG data (N = 15). Interpolations between electrodes were calculated using triangulation-based cubic interpolation method. (E) Quantifications of frequency bands’ powers showed in (D) at different timepoints. Average powers among all electrodes were used for plotting. Red dotted plots show averaged SSS (from C). Data are represented as mean ± SD (in shaded areas). Powers at 21 hr and 28 hr are compared with the 4 hr ones using paired t-test with Bonferroni’s correction for multiple comparisons. Statistically significant points were labeled (*p<0.05; **p<0.01; ***p<0.001).
Figure 1—figure supplement 1
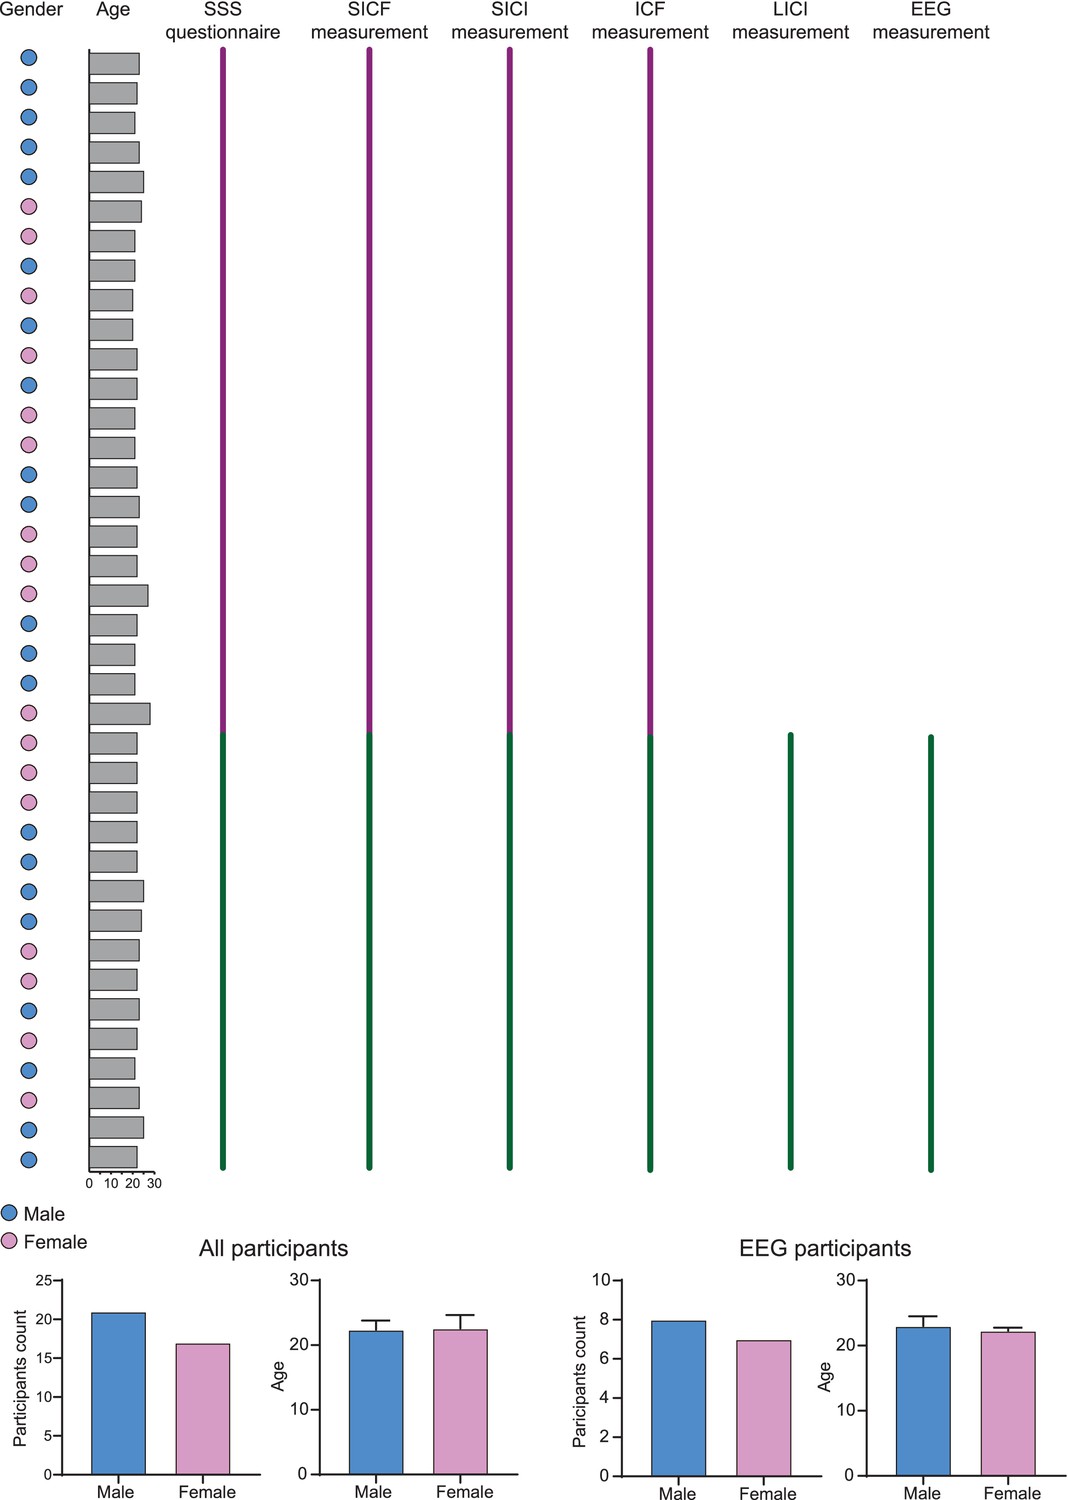
Demographic information of participants.
Gender and age of each participant is shown. 23 subjects received five transcranial magnetic stimulation (TMS) protocols (purple group) and 15 subjects received six TMS protocols and electroencephalogram measurements (green group). Ages and genders are balanced in both groups.
Figure 1—figure supplement 2
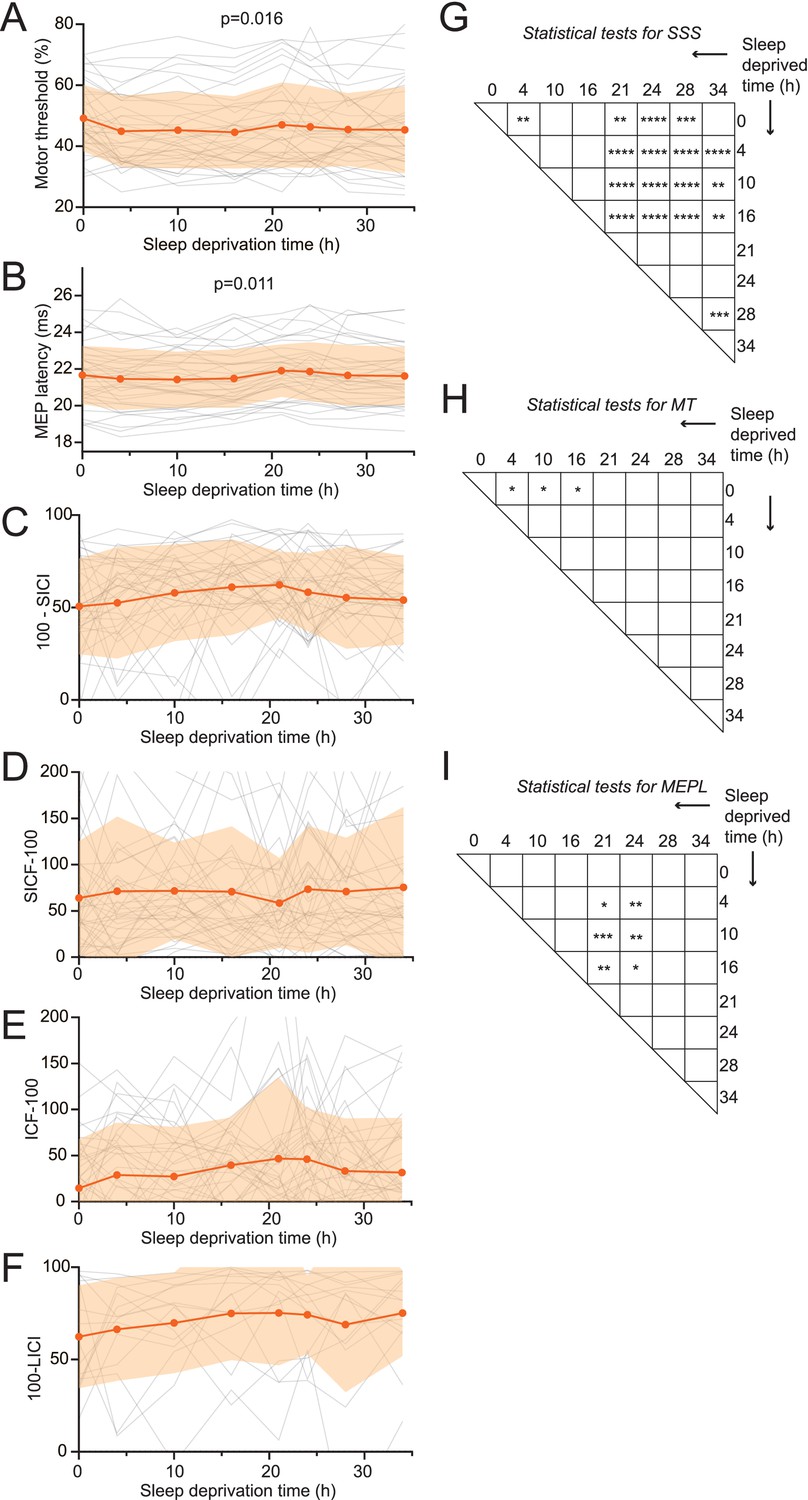
All raw data of transcranial magnetic stimulation (TMS) measurements.
(A-F) Raw data from all TMS measurements of each subject is plotted with group averages, showing mean ± SD. Related to Figure 2. (G–I) Post-hoc pair-wise comparison from ANOVA for Figures 1C, 2C and E. Multiple comparison is corrected with Bonferroni’s correction. *p<0.05; **p<0.01; ***p<0.001; ****p<0.0001.
Figure 2
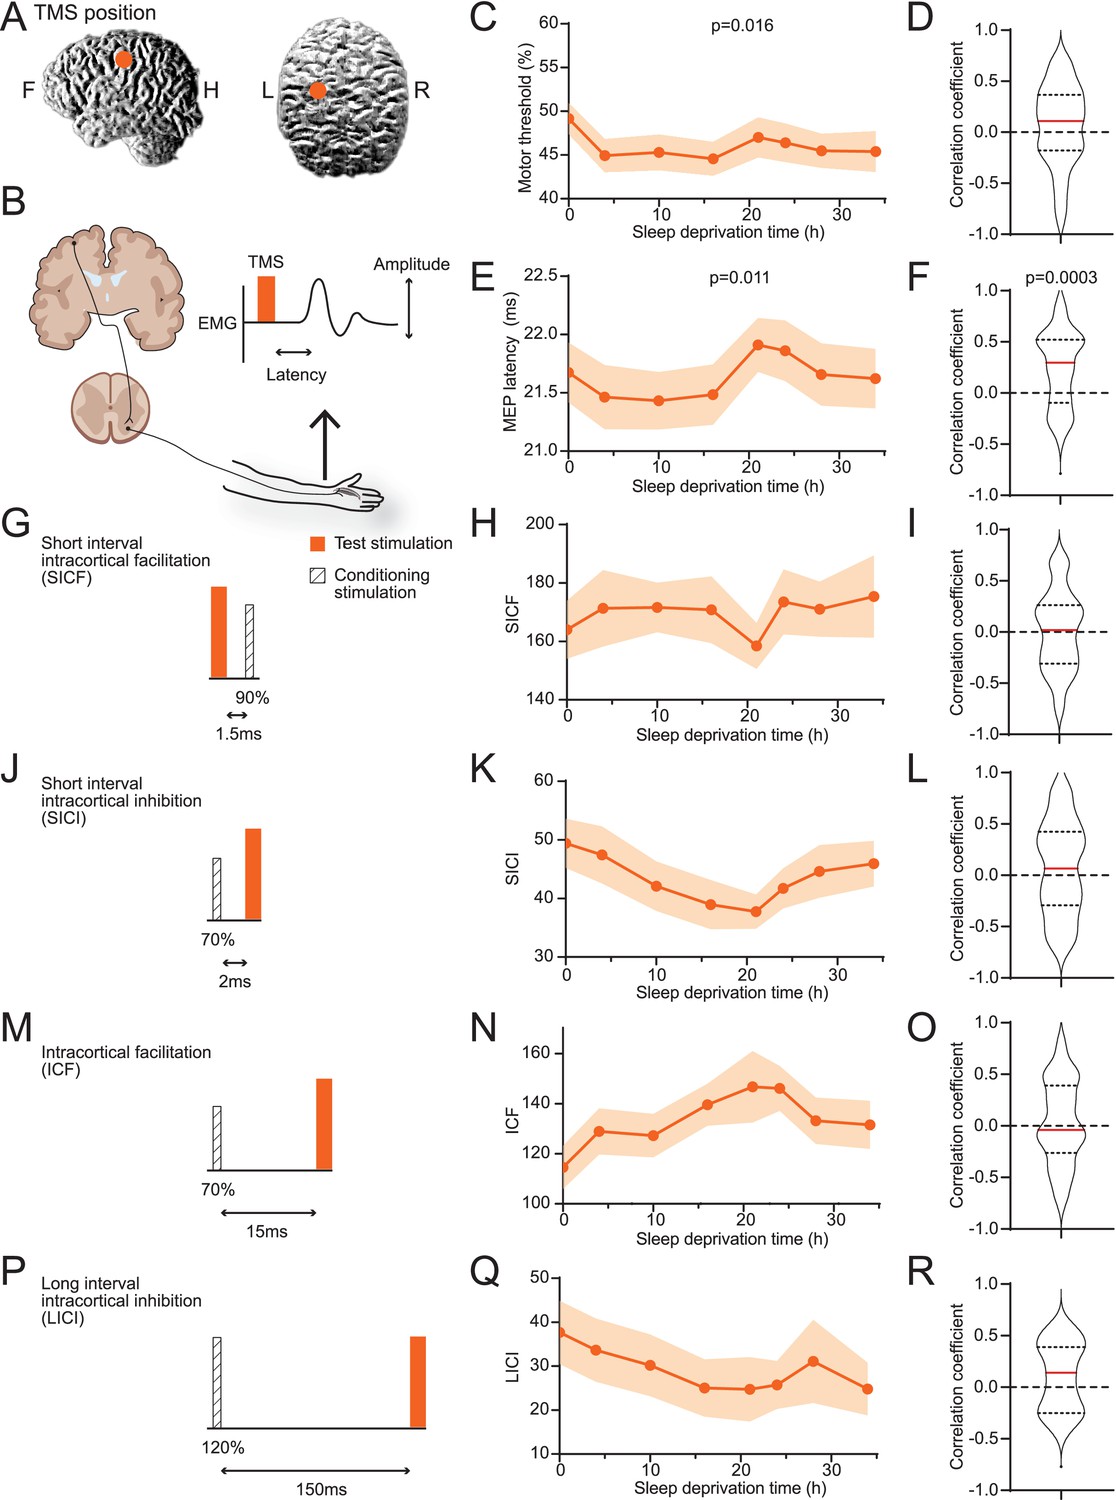
Averages of transcranial magnetic stimulation (TMS) measurements show weak correlations to sleepiness.
(A) Position of TMS targeting. (B) Schematics of the TMS study design. The electroencephalogram (EMG) trace showed is for illustrative purpose only. (C) Averaged measurements of motor threshold. Data are represented as mean ± SD (in shaded areas). ANOVA test was applied to test the differences among timepoints; p-value is showed when statistically significant. (D) Distribution of the correlation coefficients between individuals’ sleepiness scores and motor threshold measurements (median in red line, 25% and 75% quantiles in dotted lines). One-sample t-test was used to compare the distribution to 0; p-value is showed when statistically significant. Equivalent to the formats of (C) and (D), later panels show data for motor-evoked potentials latencies (E, F), short interval intracortical facilitations (SICFs) (H, I), short interval intracortical inhibitions (SICIs) (K, L), intracortical facilitations (ICFs) (N, O), and long interval intracortical inhibition (LICI) (Q, R). For the four pair-pulse protocols, a schematic is showed for the respective protocol, (G) SICF, (J) SICI, (M) ICF, and (P) LICI. For all TMS measurements, N = 38 except for LICI (Q, R, N = 15, Figure 1—figure supplement 1). Statistical comparisons between sessions are reported in Figure 1—figure supplement 2.
Figure 3 with 3 supplements
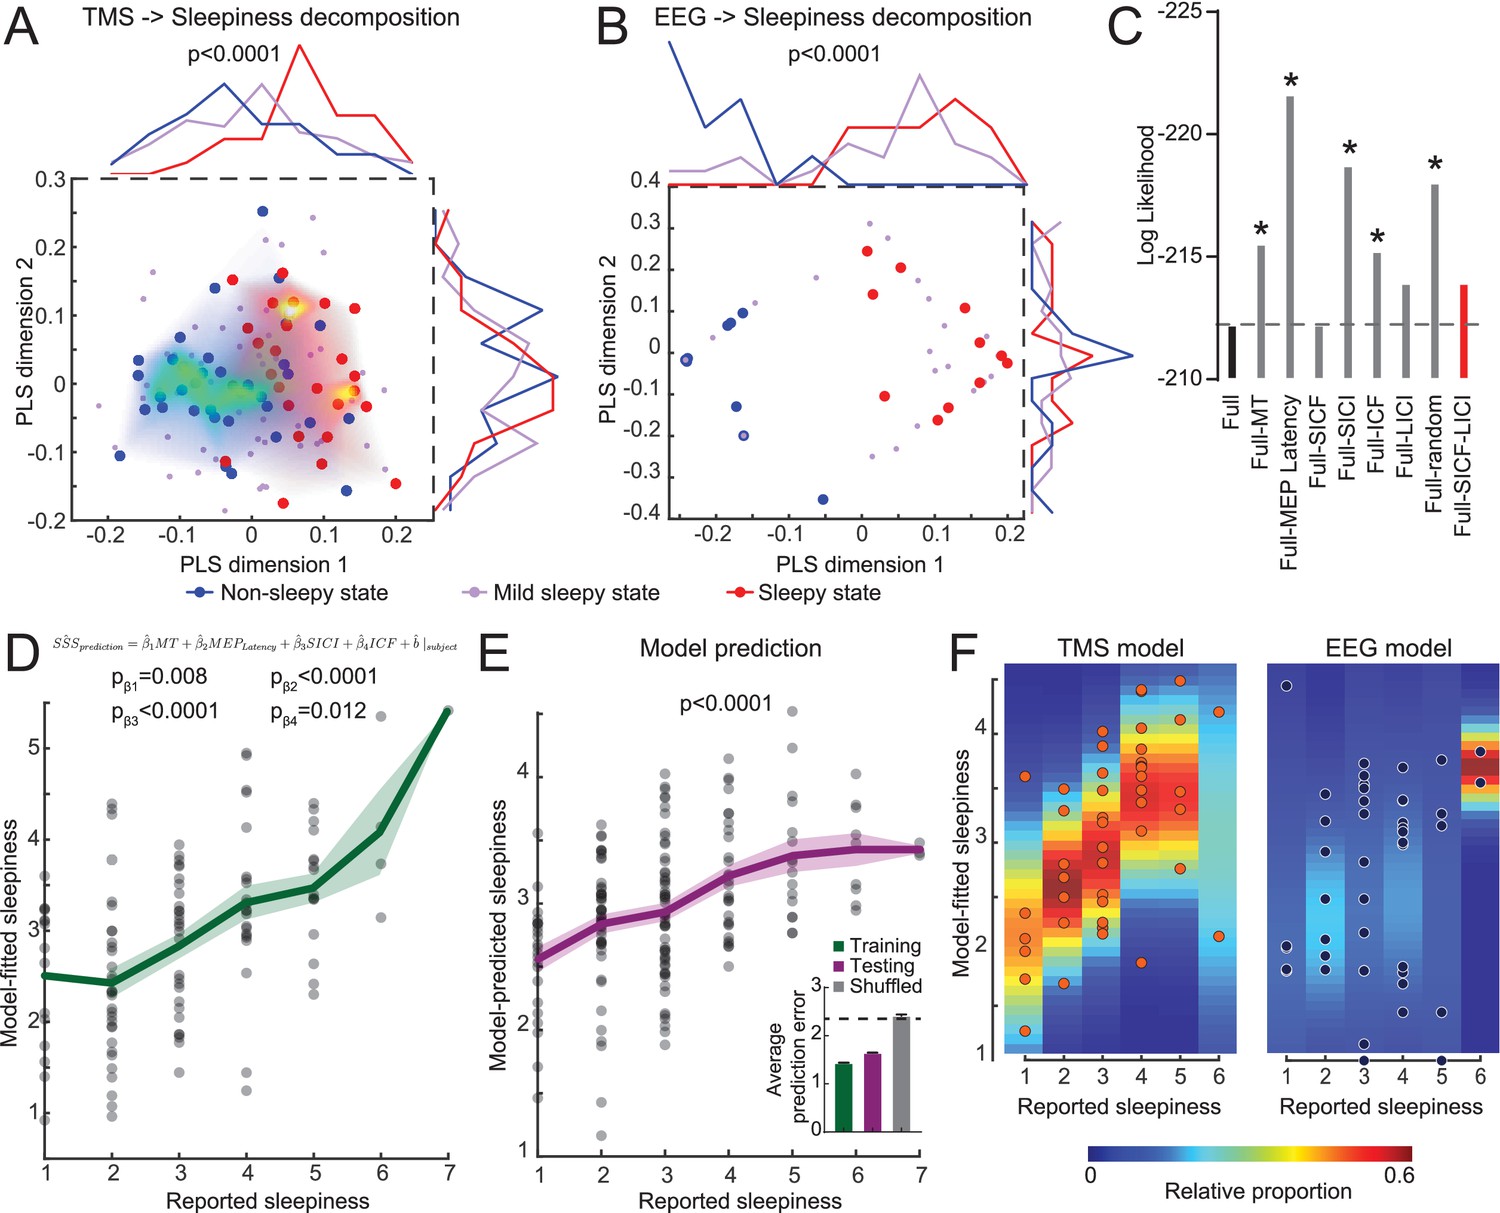
Transcranial magnetic stimulation (TMS) measurements quantitatively predict the degree of sleepiness.
(A) Partial least squares (PLS) regression of TMS measurements to sleepiness scores (15 subjects with eight timepoints each, N = 120 states). The plot shows a scatter plot of each state in the first two PLS dimensions (Stanford Sleepiness Scales [SSS] = 1 or 2 for non-sleepy state, blue dots; SSS = 3 or 4 for mild sleepy state, purple dots; and SSS = 5, 6, or 7 for sleepy state, red dots). The heatmaps show density plots of the blue and red dots. And the distributions along each dimension are plotted on top and right side of the plot. Student’s t-tests were used to compare the distributions between sleepy and non-sleepy states, with p-value indicated if statistically significant. (B) PLS regression of electroencephalogram (EEG) measurements (15 subjects with three timepoints each, N = 45 states), similar to panel (A). (C) Log likelihood of different regression models. Increase in absolute values indicates a worse fit. Dash line indicates the level of full model. All models were compared to the full model using F-test of all four information criteria: Akaike Information Criterion (AIC), Bayesian Information Criterion (BIC), log likelihood and deviance; with asterisks showing statistical significance. The red bar indicates the model chosen for later analysis. (D) Mixed-effect linear model fitting results from the training set (15 subjects with eight timepoints each, N = 120 states). Green line shows mean ± SEM of the model predictions. p-Values of each coefficient was showed. (E) Mixed-effect linear model fitting results from the testing set (23 subjects with eight timepoints each, N = 184 states). All coefficients were kept the same with the training set in (D), except allowing a new random effect on intercept for each new subject. p-value was calculated with a F-test of a linear regression between predicted values to reported values to show the slope is significantly different from 0. Inset in (E) shows average performance from fivefold cross-validation compared to shuffled control. (F) Comparison of mixed-effect linear model fittings between TMS and EEG measurements, with balanced dataset (15 subjects with three timepoints each, N = 45 states for both). Heatmaps were calculated by fitting a normal distribution density function with the predicted values at each reported value bin.
Figure 3—figure supplement 1
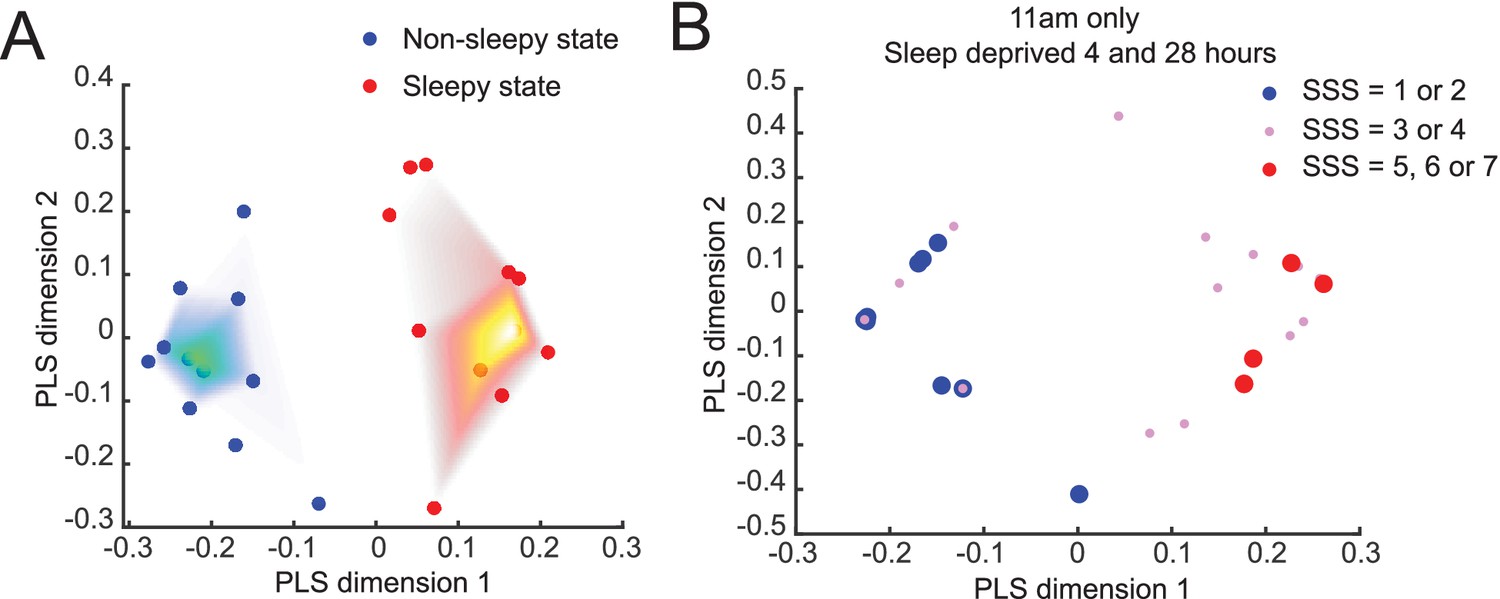
Partial least squares (PLS) regression of electroencephalogram (EEG) measurements to Stanford Sleepiness Scales (SSS).
(A) PLS regression of EEG measurements to SSS using only extreme states. Non-sleepy: SSS = 1 or 2; sleepy state: SSS = 5, 6, or 7. Density heatmaps were generated similar to Figure 3. (B) PLS regression of EEG measurements to SSS using only datasets from 11 a.m. (sleep deprived for 4 and 28 hr). After controlling for this circadian effect, EEG data still show obvious separation between non-sleepy and sleepy states.
Figure 3—figure supplement 2
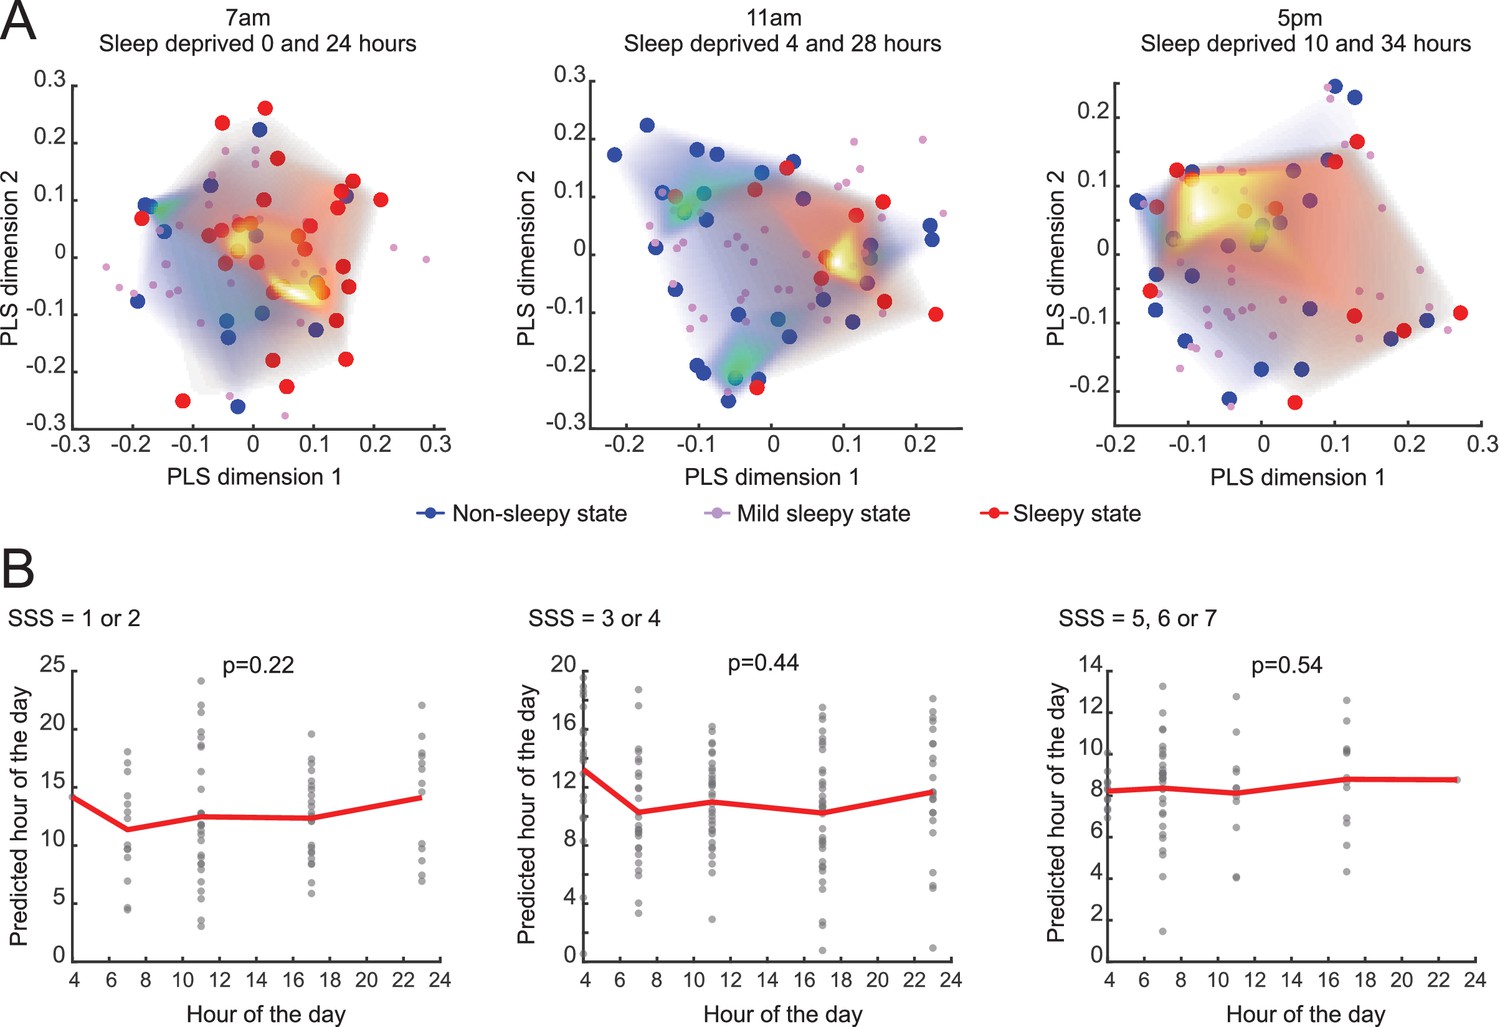
Controlling for circadian modulation of transcranial magnetic stimulation (TMS) measurements.
(A) Partial least squares (PLS) regression of TMS measurements to Stanford Sleepiness Scales (SSS) using matched timepoints. The 7 a.m. and 11 a.m. group showed separation between sleepy and non-sleepy state, but not the 5 p.m. group. (B) Mixed-effect model predictions of hour of the day based on TMS measurements. No significant prediction power is found between TMS measurements and hour of the day.
Figure 3—figure supplement 3
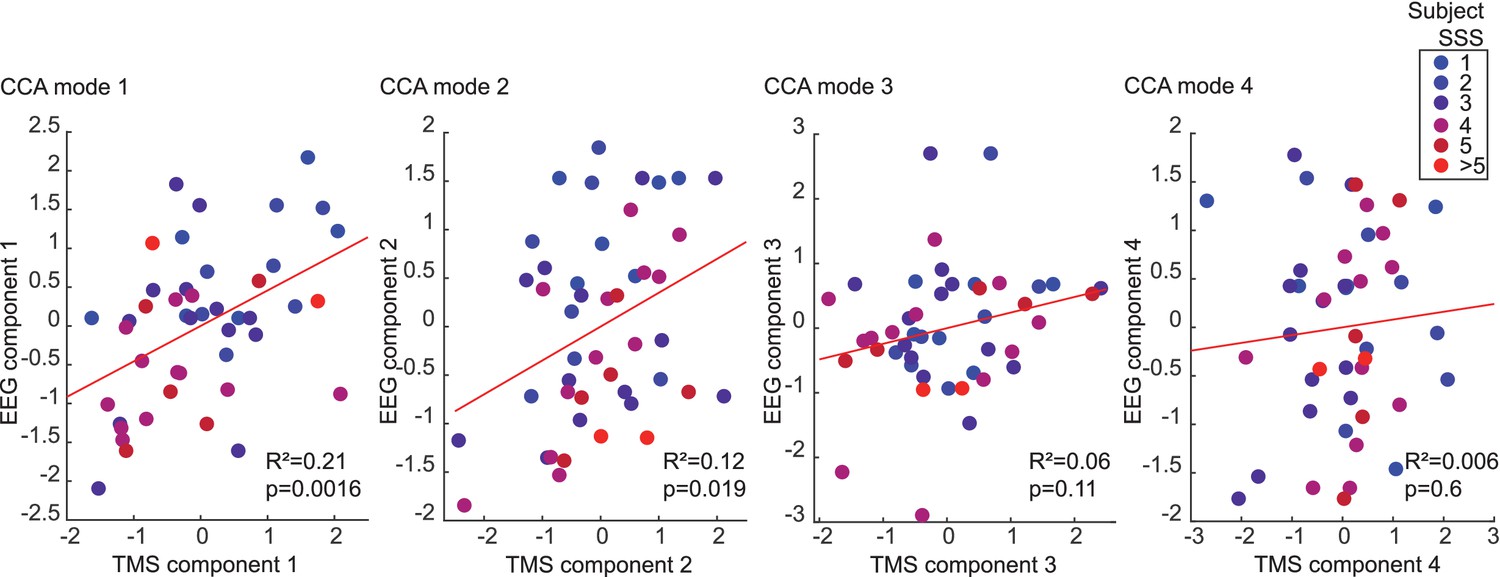
CCA analysis between transcranial magnetic stimulation (TMS) and electroencephalogram (EEG) measurements.
CCA analysis using four variables of TMS (motor response threshold [MT], motor-evoked potentials latentcy [MEPL], short interval intracortical inhibition [SICI], and intracortical facilitation [ICF]) and four variables of EEG (delta, theta, alpha, and beta). Four output modes are plotted, and linear correlation is evaluated with a regression of the scatter plots. The Stanford Sleepiness Scales (SSS) of each datapoint is superimposed on the scatter plot.
Author response image 1

Tables
Table 1
The result of the Stanford Sleepiness Scales (SSS) and transcranial magnetic stimulation (TMS).
| SSS | MT (% MSO) | MEP latency (ms) | SICF | ICF | SICI | LICI | |
|---|---|---|---|---|---|---|---|
| 38 | 38 | 38 | 38 | 38 | 38 | 15 | n |
| 2.68 ± 0.189 | 0.49 ± 0.02 | 21.67 ± 0.26 | 1.64 ± 0.10 | 1.14 ± 0.09 | 0.49 ± 0.04 | 0.39 ± 0.07 | 0 hr |
| 1.76 ± 0.122 | 0.45 ± 0.02 | 21.46 ± 0.27 | 1.71 ± 0.13 | 1.29 ± 0.09 | 0.47 ± 0.05 | 0.35 ± 0.07 | 4 hr |
| 2.26 ± 0.180 | 0.45 ± 0.02 | 2.43 ± 0.25 | 1.72 ± 0.08 | 1.27 ± 0.08 | 0.42 ± 0.04 | 0.31 ± 0.07 | 10 hr |
| 2.34 ± 0.143 | 0.45 ± 0.02 | 21.48 ± 0.26 | 1.71 ± 0.11 | 1.39 ± 0.08 | 0.39 ± 0.04 | 0.26 ± 0.07 | 16 hr |
| 3.74 ± 0.149 | 0.47 ± 0.02 | 21.91 ± 0.23 | 1.58 ± 0.08 | 1.46 ± 0.14 | 0.38 ± 0.03 | 0.24 ± 0.07 | 21 hr |
| 4.50 ± 0.191 | 0.46 ± 0.02 | 21.86 ± 0.26 | 1.73 ± 0.11 | 1.46 ± 0.09 | 0.42 ± 0.03 | 0.25 ± 0.06 | 24 hr |
| 3.79 ± 0.21 | 0.45 ± 0.02 | 21.66 ± 0.27 | 1.71 ± 0.0.9 | 1.33 ± 0.09 | 0.45 ± 0.04 | 0.31 ± 0.09 | 28 hr |
| 3.32 ± 0.223 | 0.45 ± 0.02 | 21.62 ± 0.26 | 1.75 ± 0.14 | 1.31 ± 0.10 | 0.46 ± 0.04 | 0.26 ± 0.07 | 34 hr |
-
MT: motor response threshold; MSO: maximal stimulation output; MEP: motor-evoked potential; SICF: short interval intracortical facilitation; ICF: intracortical facilitation; SICI: short interval intracortical inhibition; LICI: long interval intracortical inhibition.
Table 2
The setting of the ppTMS.
| SICI | LICI | SICF | ICF | |
|---|---|---|---|---|
| CS (%MEP) | 70 | 120 | 90 | 70 |
| TS (%MEP) | Average amplitude reached at 400–1000 μV | |||
| ISI | 2 | 150 | 1.5 | 15 |
-
ppTMS: paired-pulses transcranial magnetic stimulation; SICI: short interval intracortical inhibition; LICI: long interval intracortical inhibition; SICF: short interval intracortical facilitation; ICF: intracortical facilitation; MEP: motor-evoked potential; CS: conditioning stimulation; TS: test stimulation: ISI: interstimulus interval.
Author response table 1
| Fixed effects coefficients (95% CIs): | |||||||
|---|---|---|---|---|---|---|---|
| Name | Estimate | SE | tStat | DF | pValue | Lower | Upper |
| {'Session'} | 0.31713 | 0.043097 | 7.3584 | 115 | 2.99E-11 | 0.23176 | 0.4025 |
| {'MT' } | 0.99275 | 0.30134 | 3.2944 | 115 | 0.001312 | 0.39584 | 1.5897 |
| {'MEPL' } | 1.2578 | 0.27701 | 4.5407 | 115 | 1.39E-05 | 0.70911 | 1.8065 |
| {'ICF' } | 0.099822 | 0.31145 | 0.32051 | 115 | 0.74916 | -0.5171 | 0.71674 |
| {'SICI' } | 0.48192 | 0.30182 | 1.5967 | 115 | 0.11307 | -0.11593 | 1.0798 |
Additional files
-
Transparent reporting form
- https://cdn.elifesciences.org/articles/65099/elife-65099-transrepform1-v2.pdf
-
Source data 1
Raw data collected in this study.
- https://cdn.elifesciences.org/articles/65099/elife-65099-supp1-v2.xlsx
Download links
A two-part list of links to download the article, or parts of the article, in various formats.
Downloads (link to download the article as PDF)
Open citations (links to open the citations from this article in various online reference manager services)
Cite this article (links to download the citations from this article in formats compatible with various reference manager tools)
Cortical excitability signatures for the degree of sleepiness in human
eLife 10:e65099.
https://doi.org/10.7554/eLife.65099


