Conserved visual capacity of rats under red light
- Tactile Perception and Learning Lab, International School for Advanced Studies (SISSA), Italy
- Department of Brain and Cognitive Sciences, McGovern Institute for Brain Research, Massachusetts Institute of Technology, United States
Figures
Figure 1 with 3 supplements
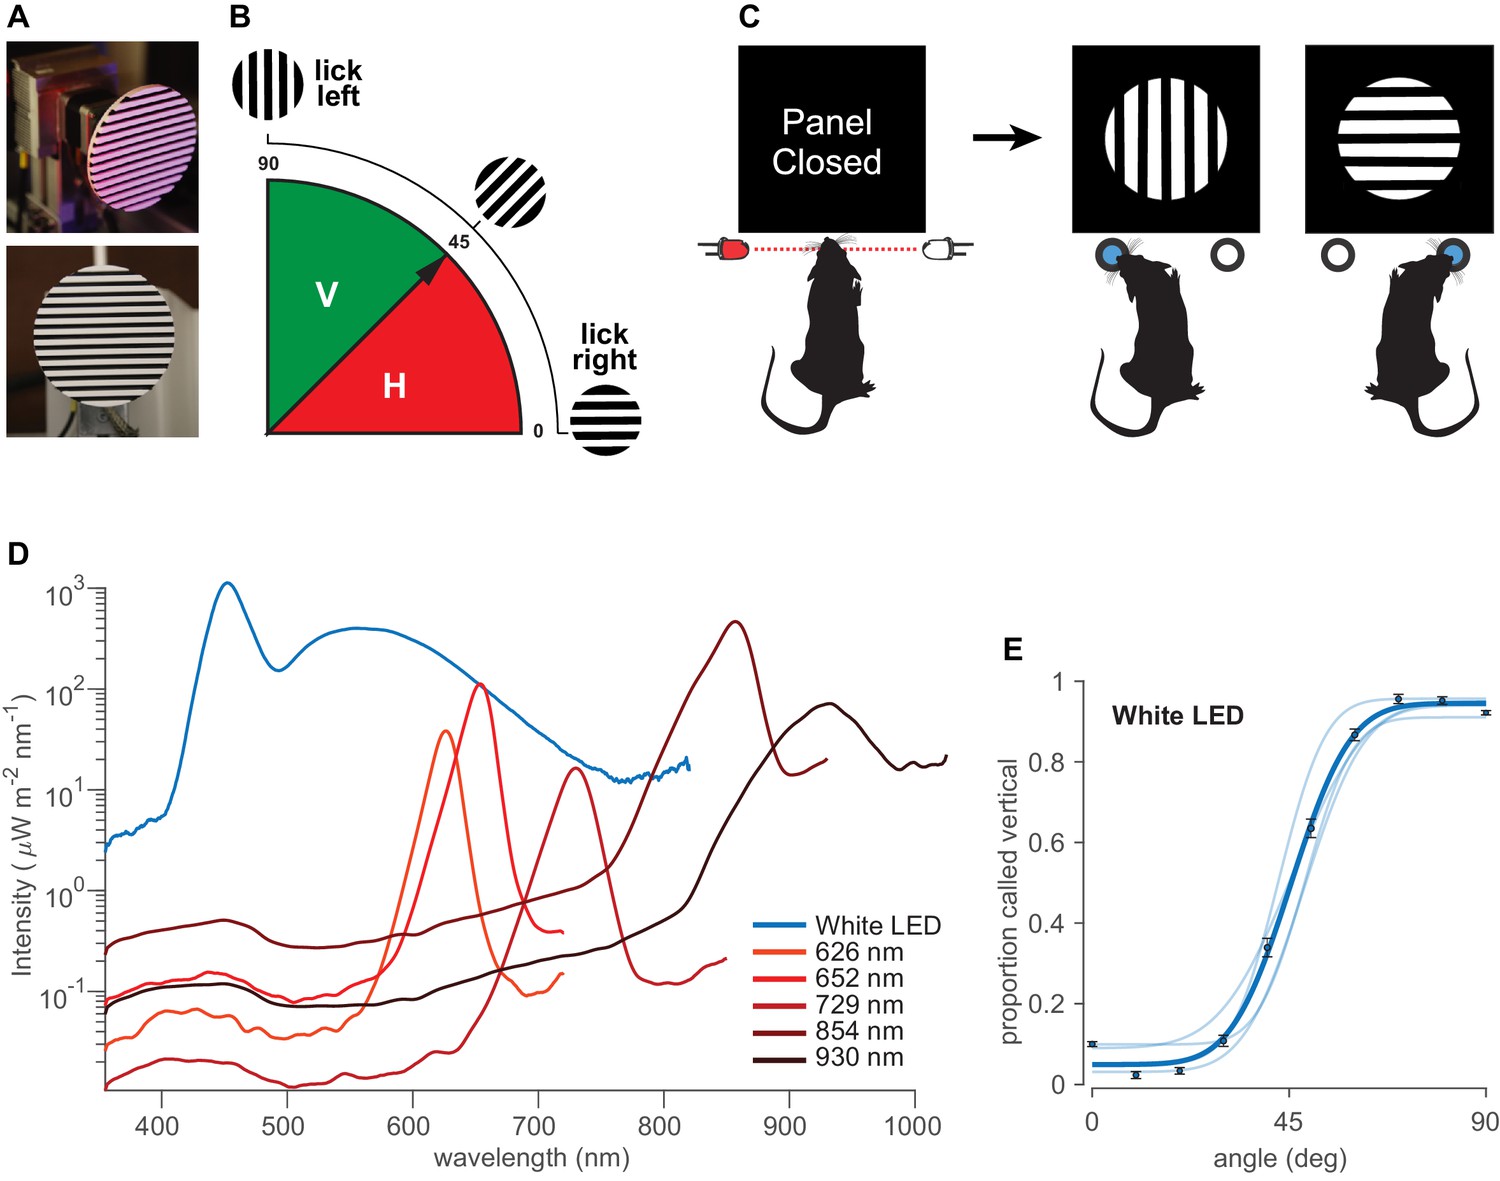
Orientation categorization task.
(A) Discriminandum viewed at an oblique angle (top) and exactly from the front (bottom), the latter approximating the perspective of the rat. (B) Schematic of the orientations of the stimuli and rule of the categorization task. 0°–45° (red) rewarded as ‘horizontal’ and 45°–90° (solid green) rewarded as ‘vertical.’. (C) Sequential steps in the behavioral task. Each trial started with a head poke that interrupted a light beam and triggered the opening of an opaque gate, followed by visual access to the object. After probing the stimulus, the rat turned its head toward one spout, in this illustration left for vertical and right for horizontal. See Figure 1—figure supplement 1 for the experimental setup. (D) Irradiance for each LED, measured by a spectrometer at the stimulus delivery area. Equivalent photon count values are shown in Figure 1—figure supplement 2. Integrating the power under the curves at wavelengths <580 nm reveals that the infrared LEDs emitted from 2 to 50 times higher intensity as compared to red LEDs, in spite of the infrared LEDs being centered at longer wavelengths (infrared 854 nm and 930 nm LEDs emitted 1.95 and 0.48 mW/cm2, respectively, while red 626, 652, and 729 nm LEDs emitted 0.12, 0.28, and 0.04 mW/cm2, respectively). See Figure 1—figure supplement 3 for normalized irradiance for each LED along with rat’s photopigment spectral sensitivity. (E) Pale curves give the performance of four rats under white light. Dark data points and curves show the average over all rats. Error bars are 95% binomial confidence intervals. See Figure 1—figure supplement 1A for the experimental setup.
© 2018, Nikbakht et al. Figure 1A-C has been reproduced from Figure 1 of Nikbakht et al., 2018, under the terms of the Creative Commons Attribution - NonCommercial - NoDerivs (CC BY-NC-ND 4.0) license.
Figure 1—figure supplement 1
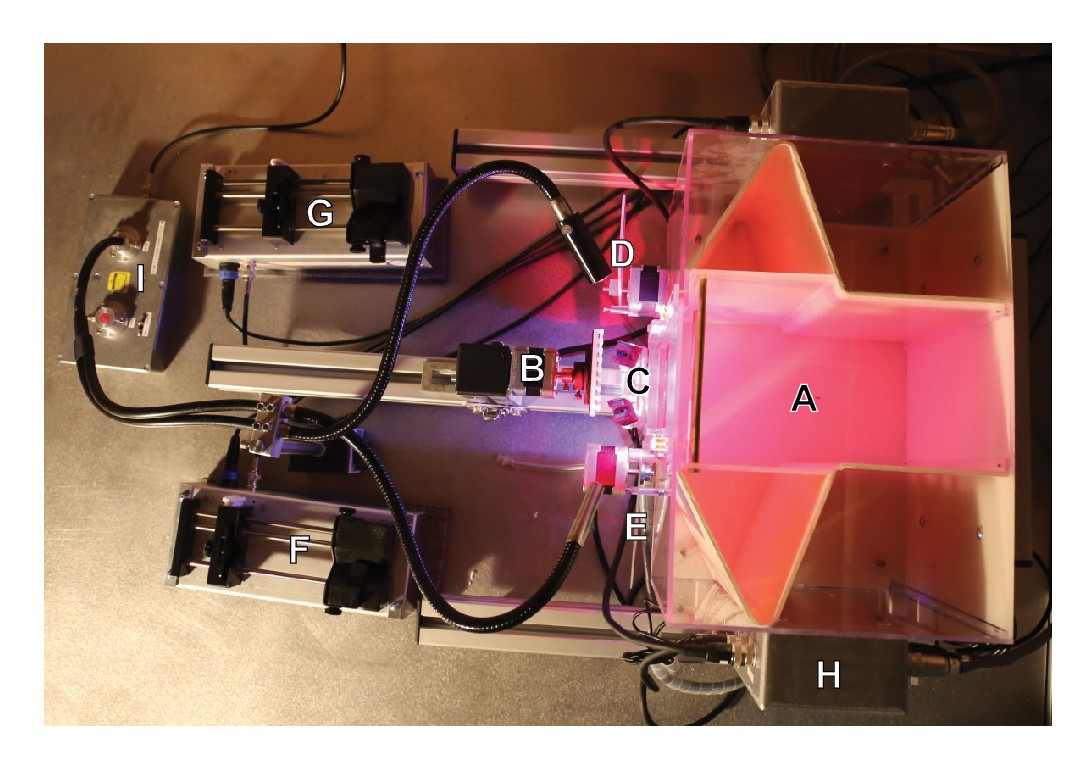
Details of the experimental setup.
View of the behavioral apparatus from above. Labels on the photo refer to the following components. A: the main chamber, B: stimulus and stepper motor controller together with digital step counter, C: the reward delivery area and licking sensors, D and E: transparent and opaque panels respectively, F and G: the pumps which drive the syringes loaded with diluted juice, H: the electronic control box, housing the microcontroller-based D/A boards and sensors and lights controllers, I: the light source attached to optic fibers.
Figure 1—figure supplement 2
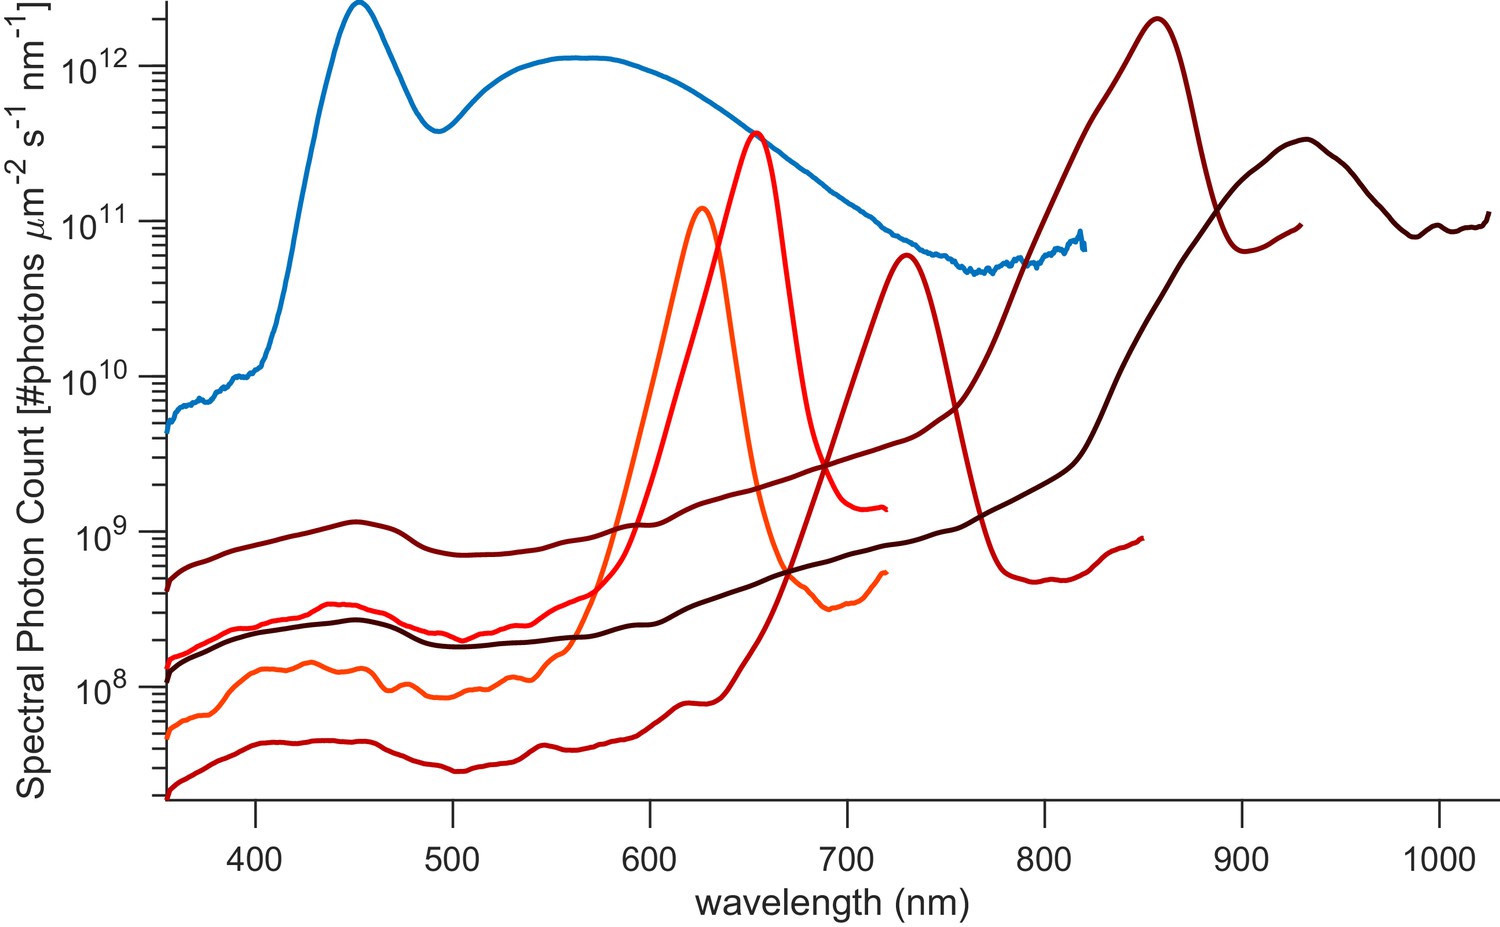
Log-scaled irradiance for each LED, measured by a spectrometer at the stimulus delivery area in units of .
Figure 1—figure supplement 3
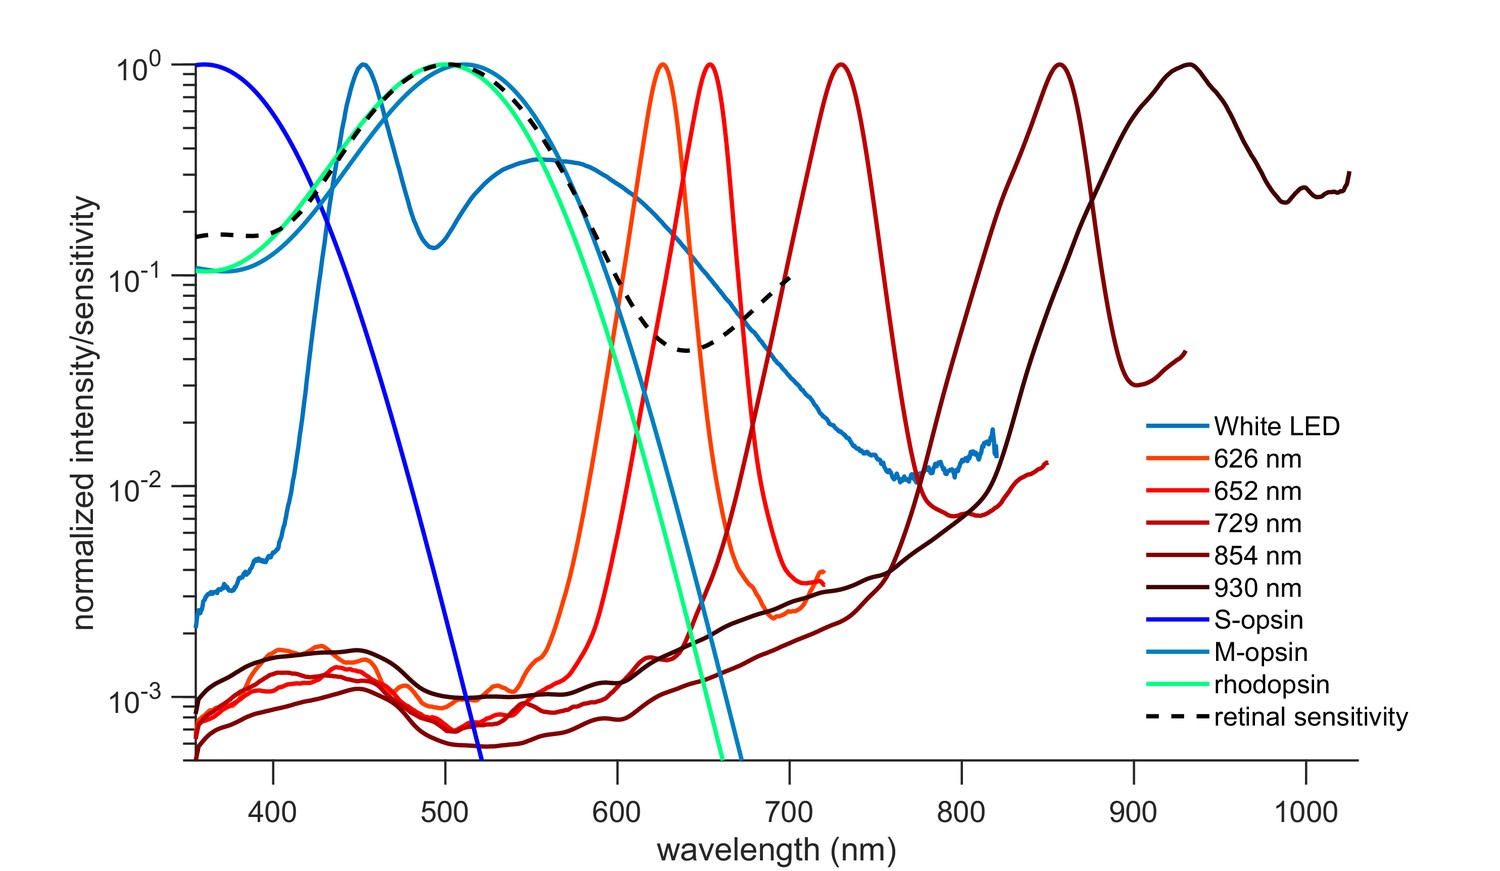
Log-scaled normalized irradiance for each LED along with a template that approximates the photopigment spectral sensitivity of rat’s rhodopsin as well as S-opsin, M-opsin (Stockman and Sharpe, 2000).
The dashed curve shows retinal sensitivity as measured by Rocha et al., 2016.
Figure 2 with 2 supplements
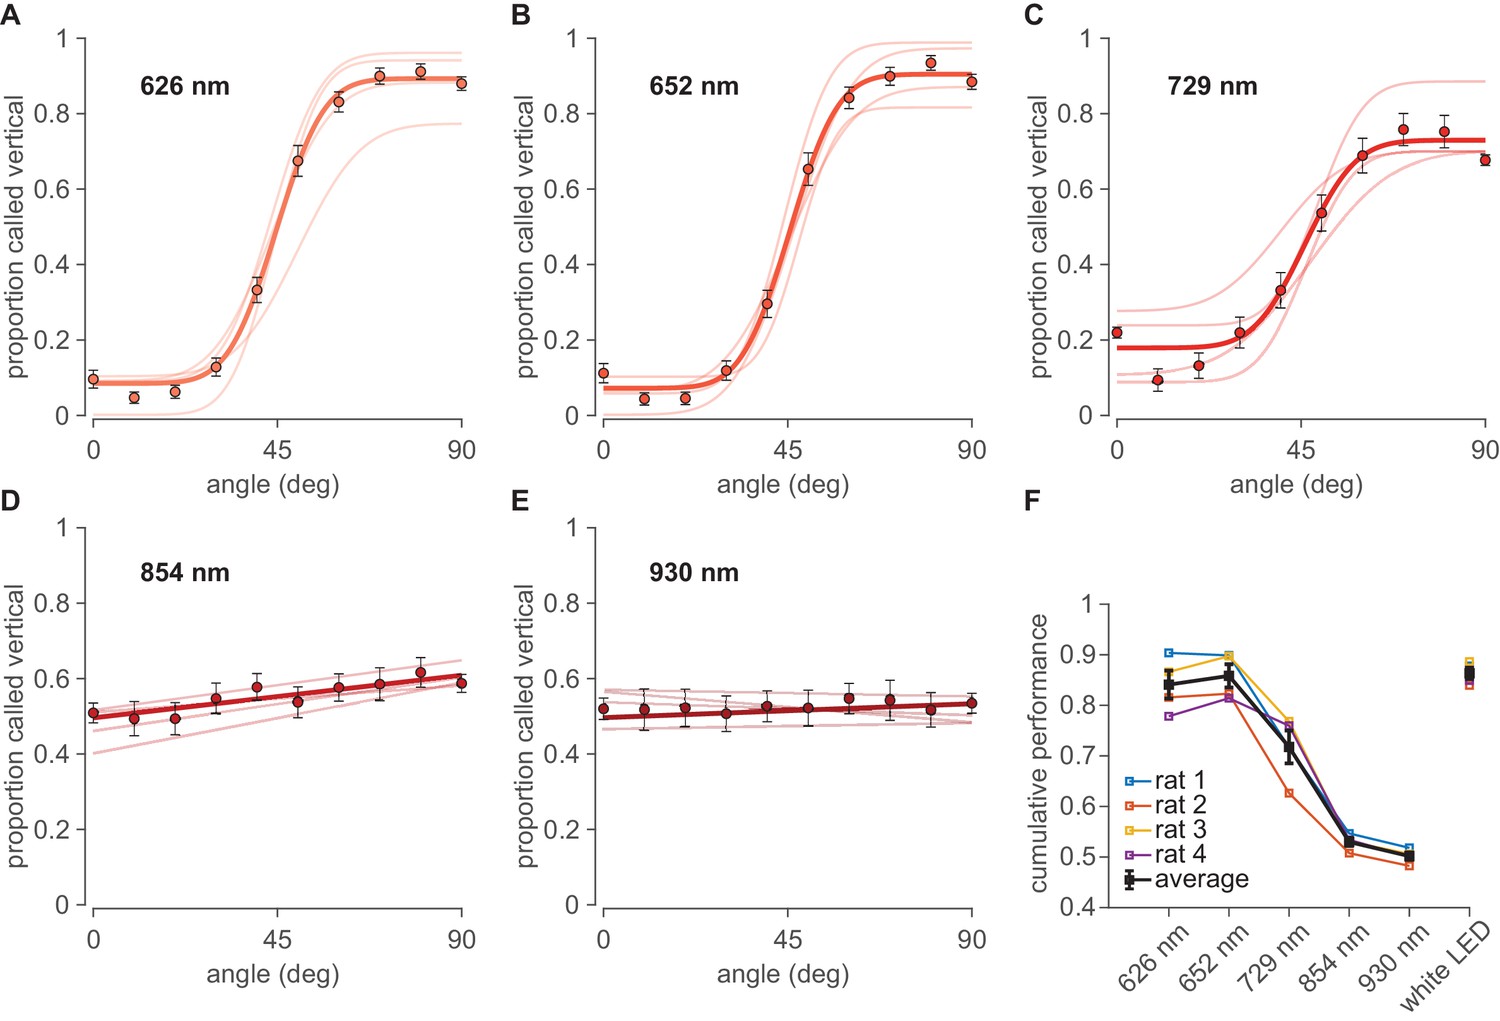
Performance under far-red and infrared illumination.
(A–E) Psychometric curves obtained under illumination with monochrome LEDs in the range of far-red to infrared with peak wavelengths at 626 nm, 652 nm, 729 nm, 854 nm and 930 nm, respectively. Pale curves depict the performance of four rats. Dark data points and lines or curves show the average over all rats. Error bars are 95% binomial confidence intervals. (F) Summary cumulative performance (proportion correct) for all four rats (colored) and the average rat (black) in each illumination condition. Data from all angles (except 45°, uninformative about discriminative capacity) are pooled. See Figure 2—figure supplement 1 for tests of significance.
Figure 2—figure supplement 1
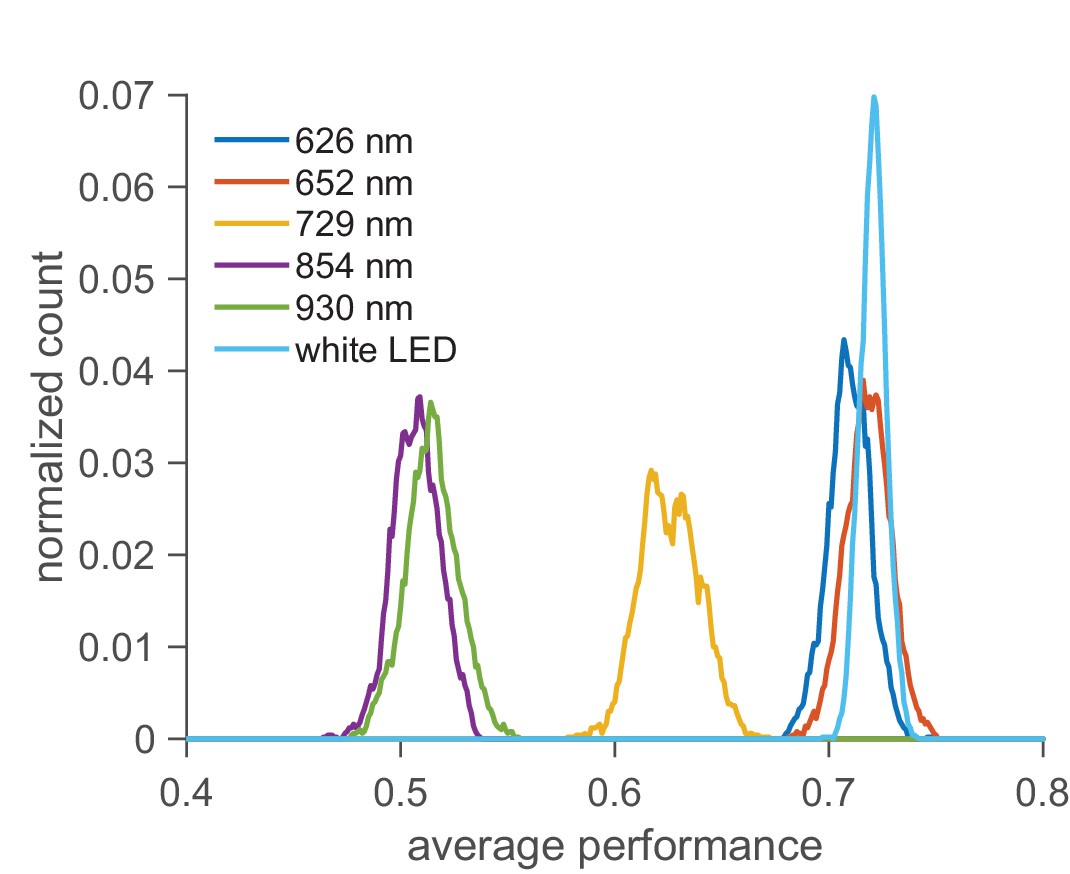
Details of the statistical test of significance.
Normalized bootstrap distributions for average performance based on 1000 rounds of resampling in each illumination condition for all rats averaged together.
Figure 2—figure supplement 2
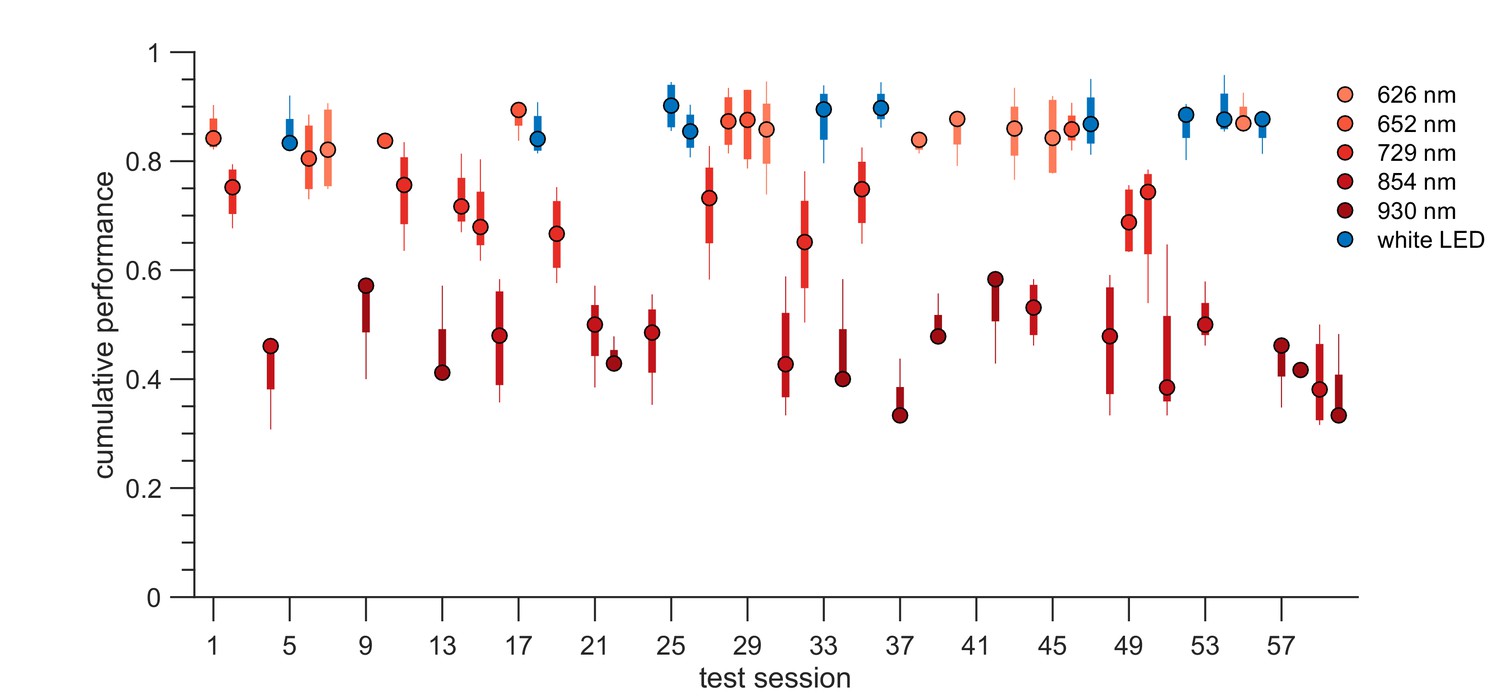
An example sequence of sessions.
Boxplots show the performance, as proportion correct across all orientations, for 60 representative days. Circles are median cumulative performance of four rats tested in parallel across the 60 sessions. Rectangles; upper and lower quartiles.
Tables
Author response table 1
| LED type | Total power density (µW/cm2) | Power density received by rat’s eye (µW/cm2) | Photon flux density by each photoreceptor (photons/µm2/s) |
| White LED | 1.14e+06 | 2.28e+0 | 1.19e+05 |
| RED 626 nm | 1.12e+04 | 2.25e-02 | 1.38e+03 |
| RED 652 nm | 3.36e+04 | 6.72e-02 | 4.31e+03 |
| RED 729 nm | 6.78e+03 | 1.36e-02 | 9.75e+02 |
| IR 854 nm | 2.34e+05 | 4.68e-01 | 3.92e+04 |
| IR 930 nm | 7.59e+04 | 1.52e-01 | 1.40e+04 |
Additional files
-
Supplementary file 1
LED emission characteristics.
Measured intensity of each LED in mW/cm2 and total irradiated power (in mW), as measured through our spectrometer (Supplementary table 1) and Additional LED emission characteristics (Supplementary table 2).
- https://cdn.elifesciences.org/articles/66429/elife-66429-supp1-v2.docx
-
Transparent reporting form
- https://cdn.elifesciences.org/articles/66429/elife-66429-transrepform-v2.pdf
Download links
A two-part list of links to download the article, or parts of the article, in various formats.
Downloads (link to download the article as PDF)
Open citations (links to open the citations from this article in various online reference manager services)
Cite this article (links to download the citations from this article in formats compatible with various reference manager tools)
Conserved visual capacity of rats under red light
eLife 10:e66429.
https://doi.org/10.7554/eLife.66429


