Modeling the impact of racial and ethnic disparities on COVID-19 epidemic dynamics
- Department of Immunology and Infectious Diseases, Harvard TH Chan School of Public Health, United States
- Center for Communicable Disease Dynamics, Department of Epidemiology, Harvard TH Chan School of Public Health, United States
- Division of Infectious Diseases, Brigham and Women’s Hospital and Harvard Medical School, United States
Figures
Figure 1 with 7 supplements
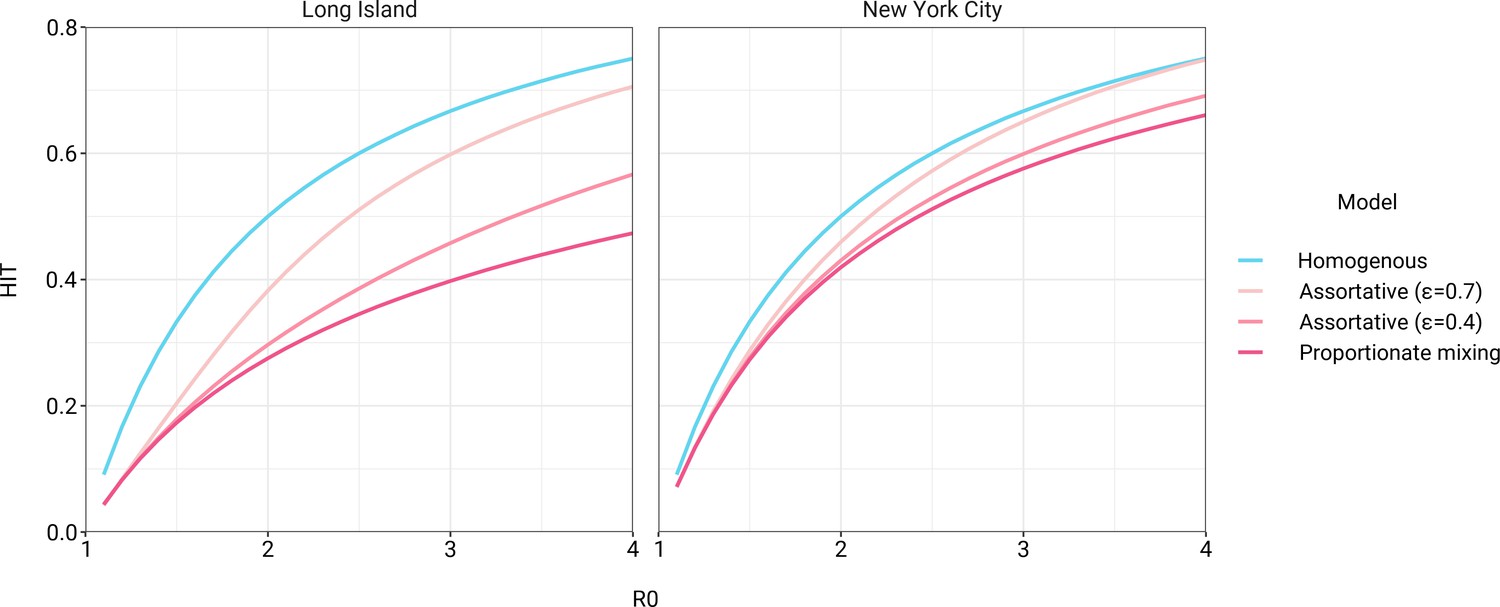
Incorporating assortativity in variable exposure models results in increased herd immunity thresholds across a range of R0 values.
Variable exposure models were fitted to New York City and Long Island serosurvey data.
Figure 1—figure supplement 1
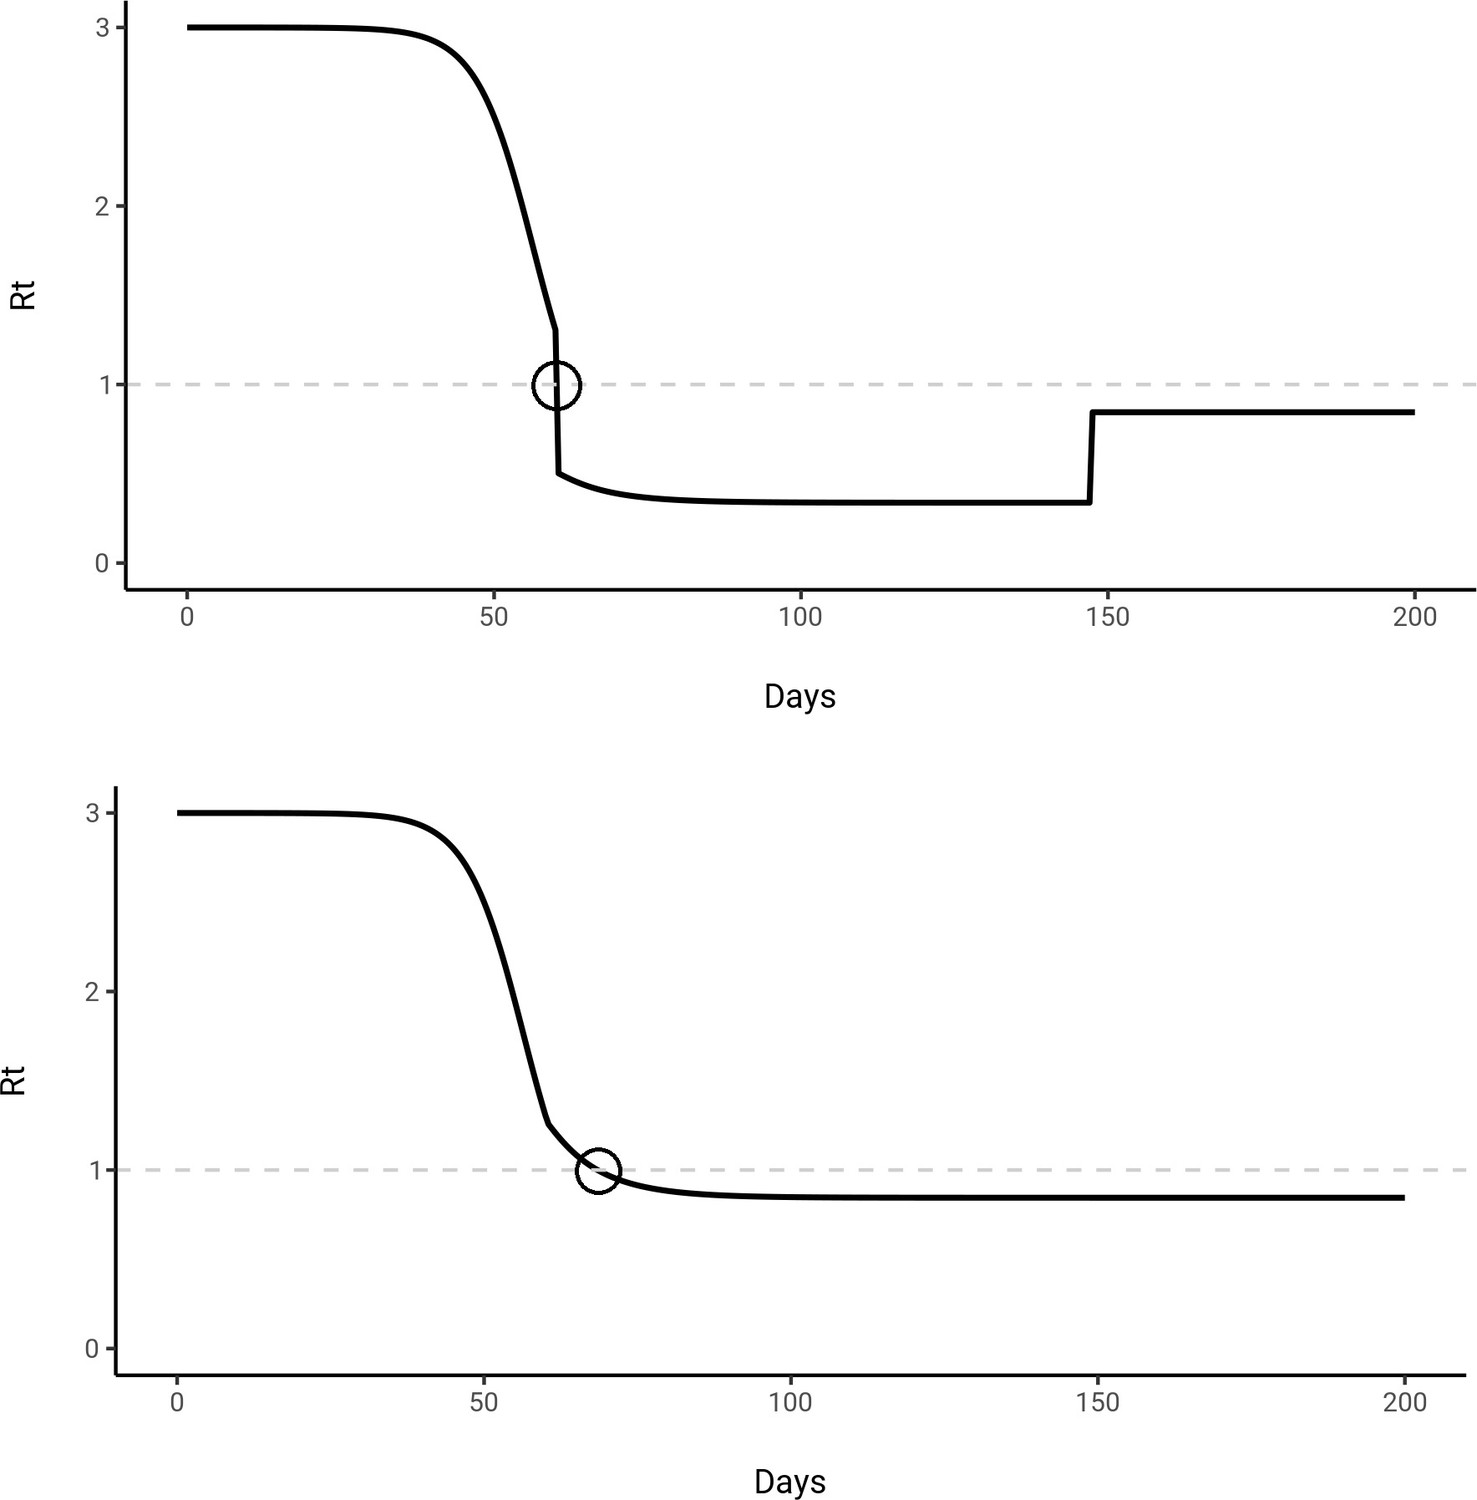
calculation accounting for (top) and without accounting for (bottom) for a mitigated epidemic trajectory.
The model was fit to Long Island census and serosurvey data, and mitigation was initiated on day 60 for 100 days with α = 0.4. The population reaches the herd immunity threshold (HIT) due to mitigation measures in the top trajectory at the circled time point and remains above the HIT after mitigation measures are lifted. However, we are defining the HIT relative to the unmitigated epidemic, which occurs when crosses 1 in the bottom trajectory at the circled time point. The interpretation is that even if all mitigation measures were lifted at this point, the unmitigated population will still have reached the HIT.
Figure 1—figure supplement 2
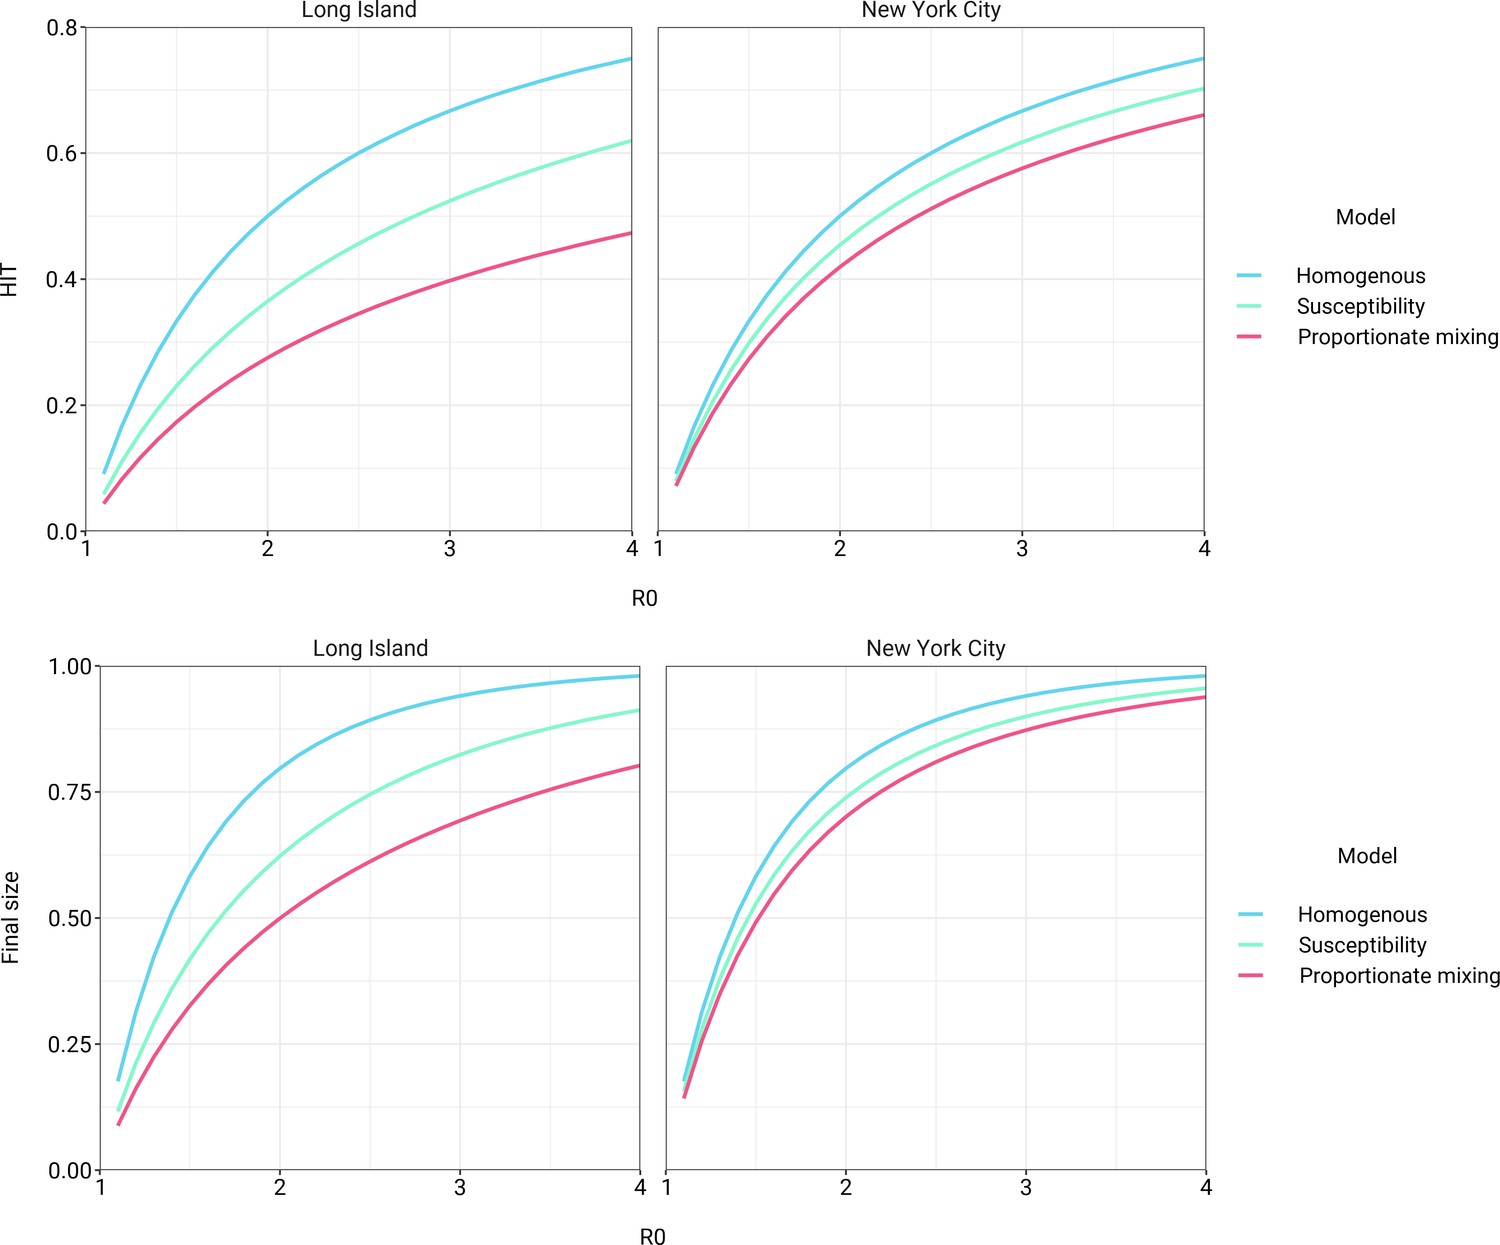
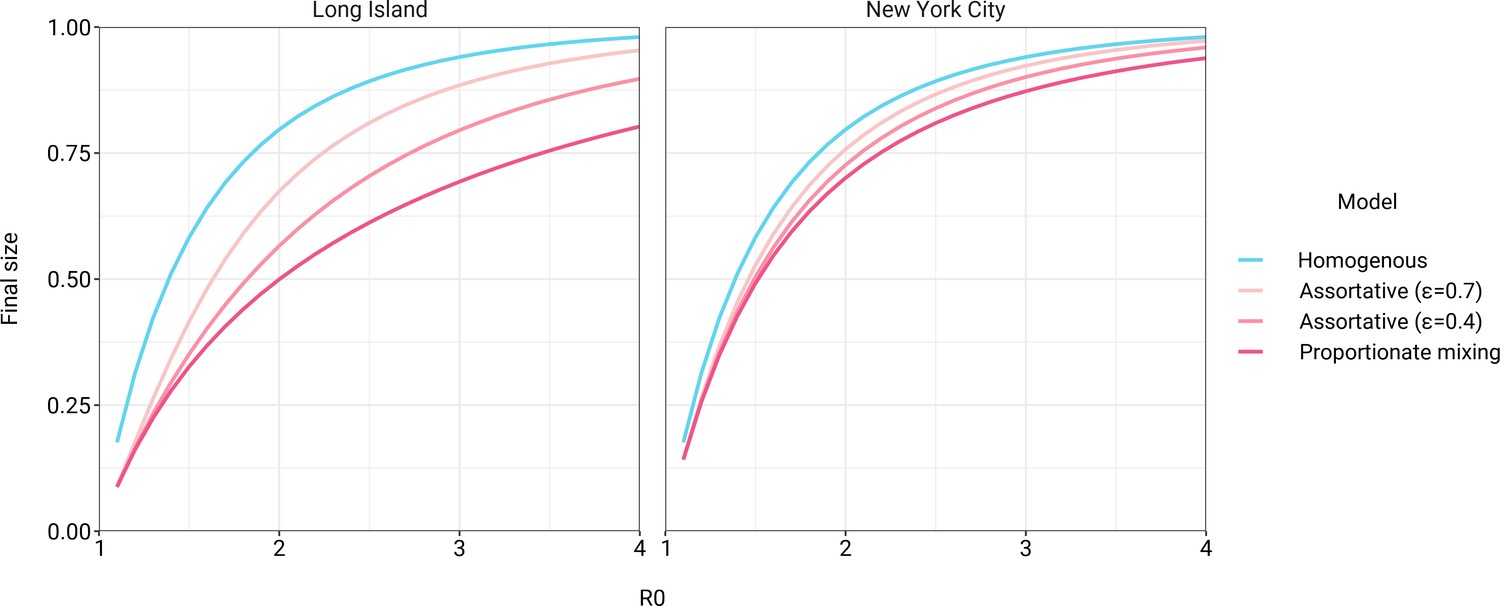
Models incorporating variable susceptibility to COVID-19 fitted to New York City and Long Island serosurvey data result in reduced herd immunity thresholds (top) and final epidemic sizes (bottom) across a range of R0 values.
Figure 1—figure supplement 3
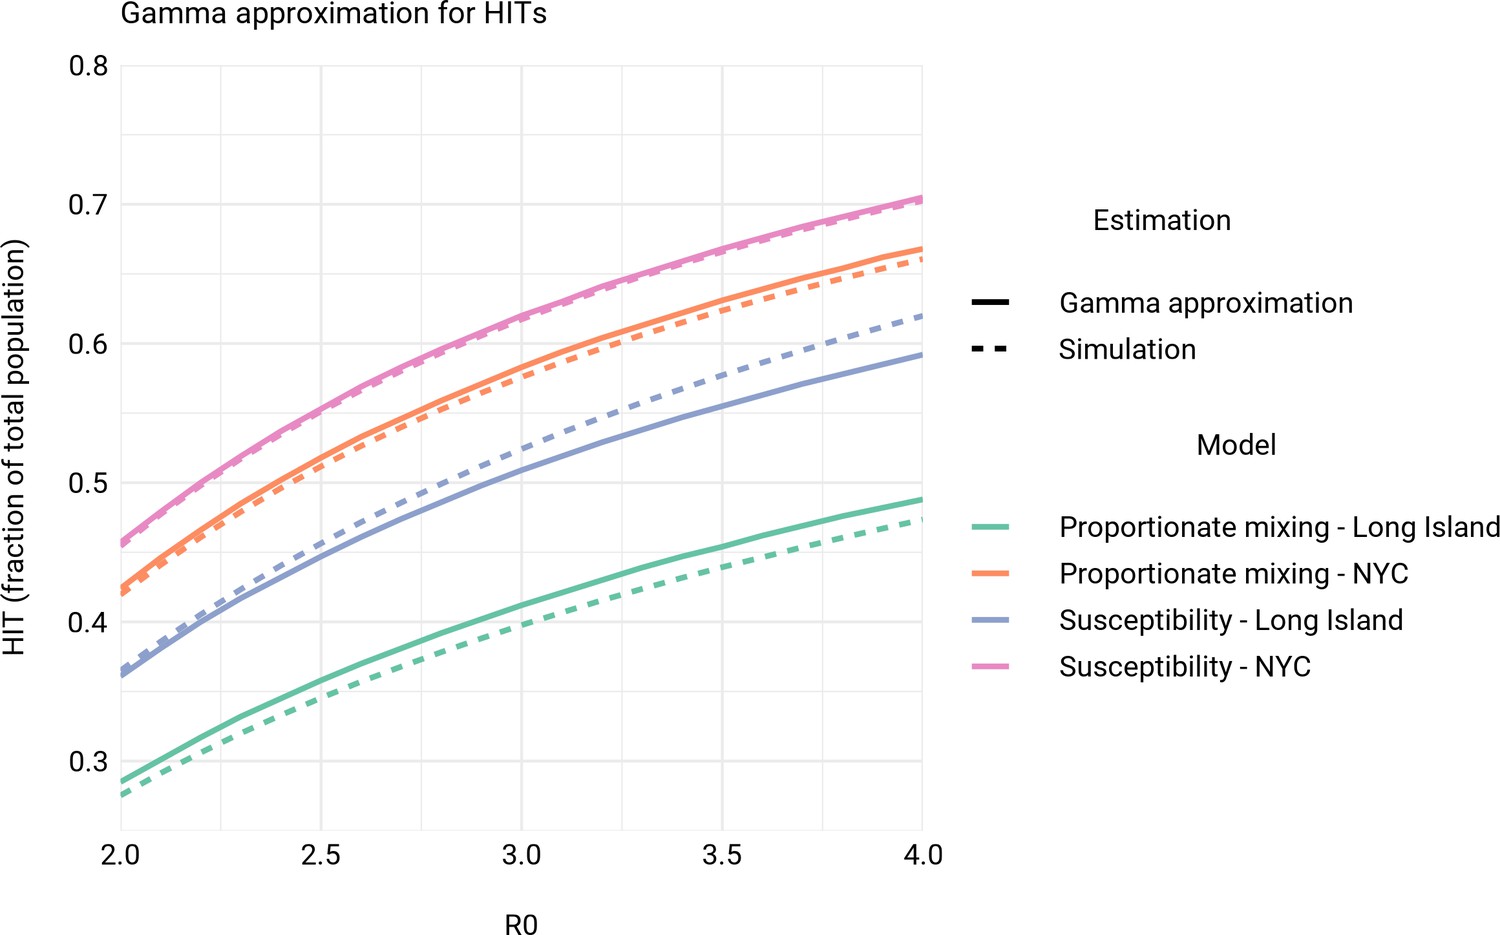
Comparison of herd immunity thresholds (HITs) from simulations to theoretical HIT curves for models with gamma distributed exposure and susceptibility (Tkachenko et al., 2020).
See Materials and methods section for additional details on comparisons.
Figure 1—figure supplement 4
Incorporating assortativity in variable exposure models results in increased final epidemic sizes across a range of R0 values.
Variable exposure models were fitted to New York City and Long Island serosurvey data.
Figure 1—figure supplement 5
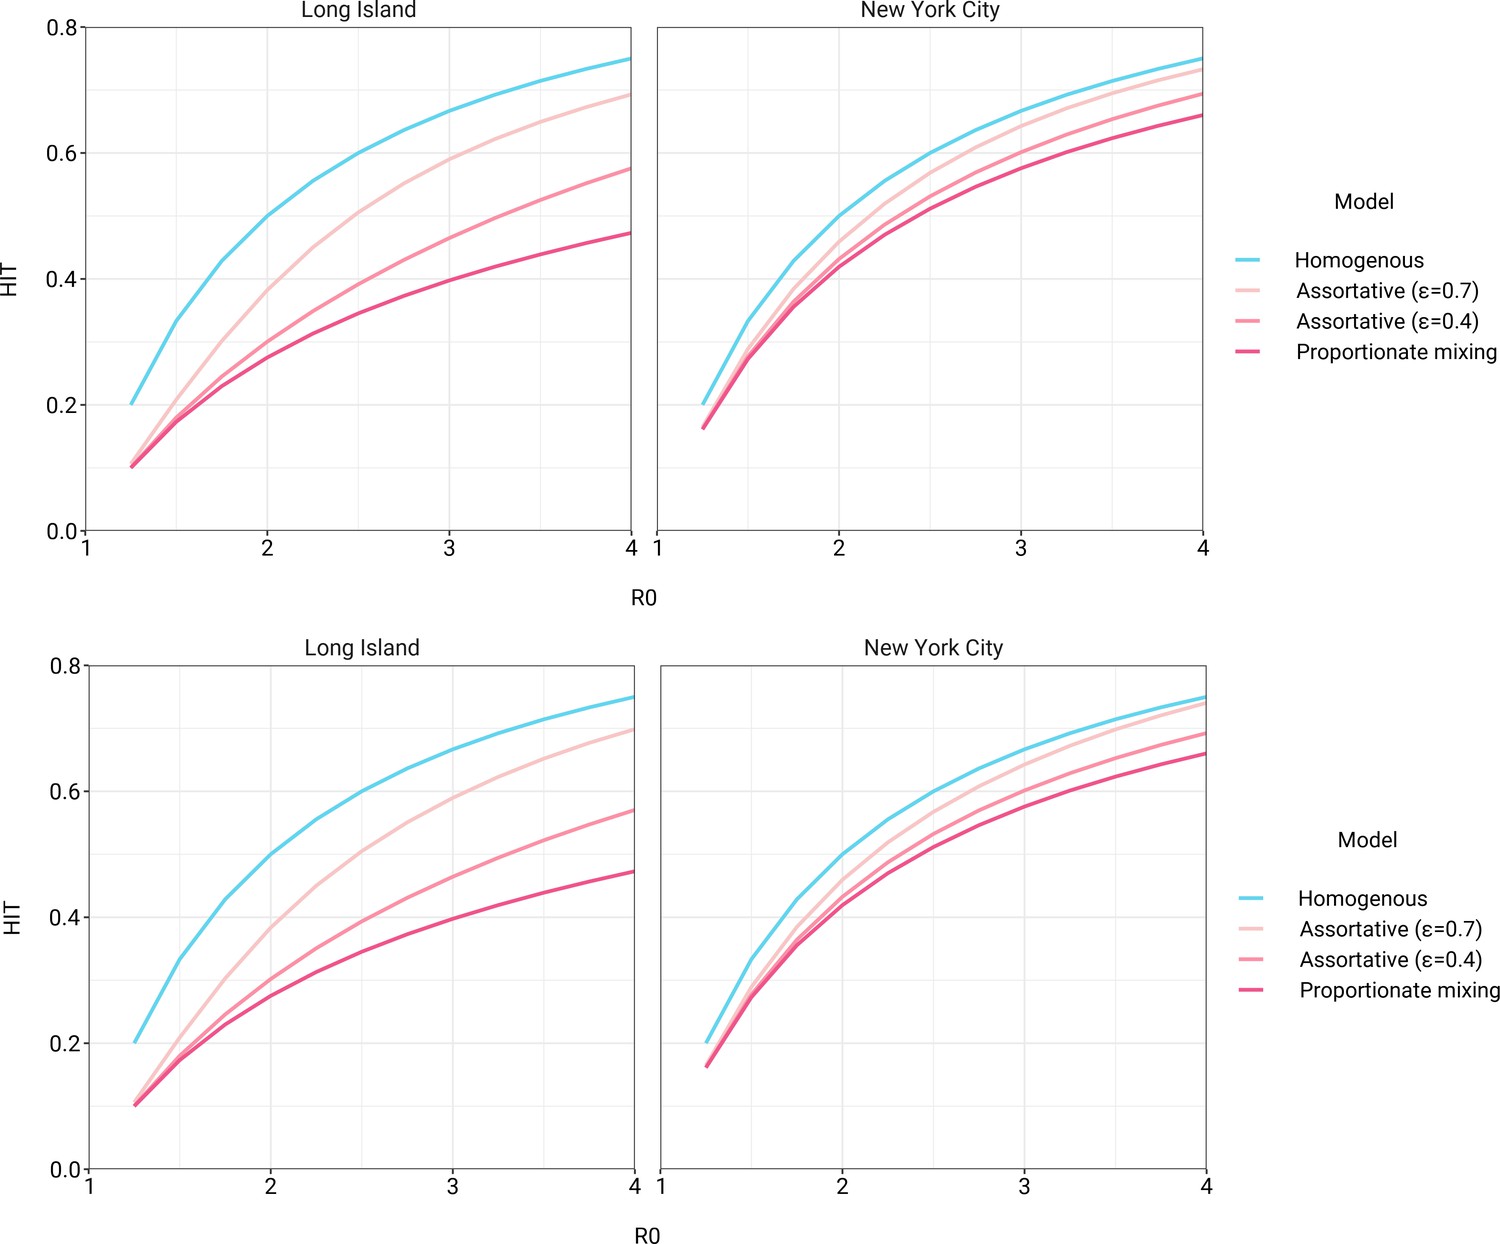
Herd immunity thresholds versus R0 in variable exposure models with mitigation measures for (top) and (bottom).
Non-pharmaceutical interventions were initiated when cumulative incidence reached 5% in all models and continued for 50 days. Models were fitted to New York City and Long Island serosurvey data.
Figure 1—figure supplement 6
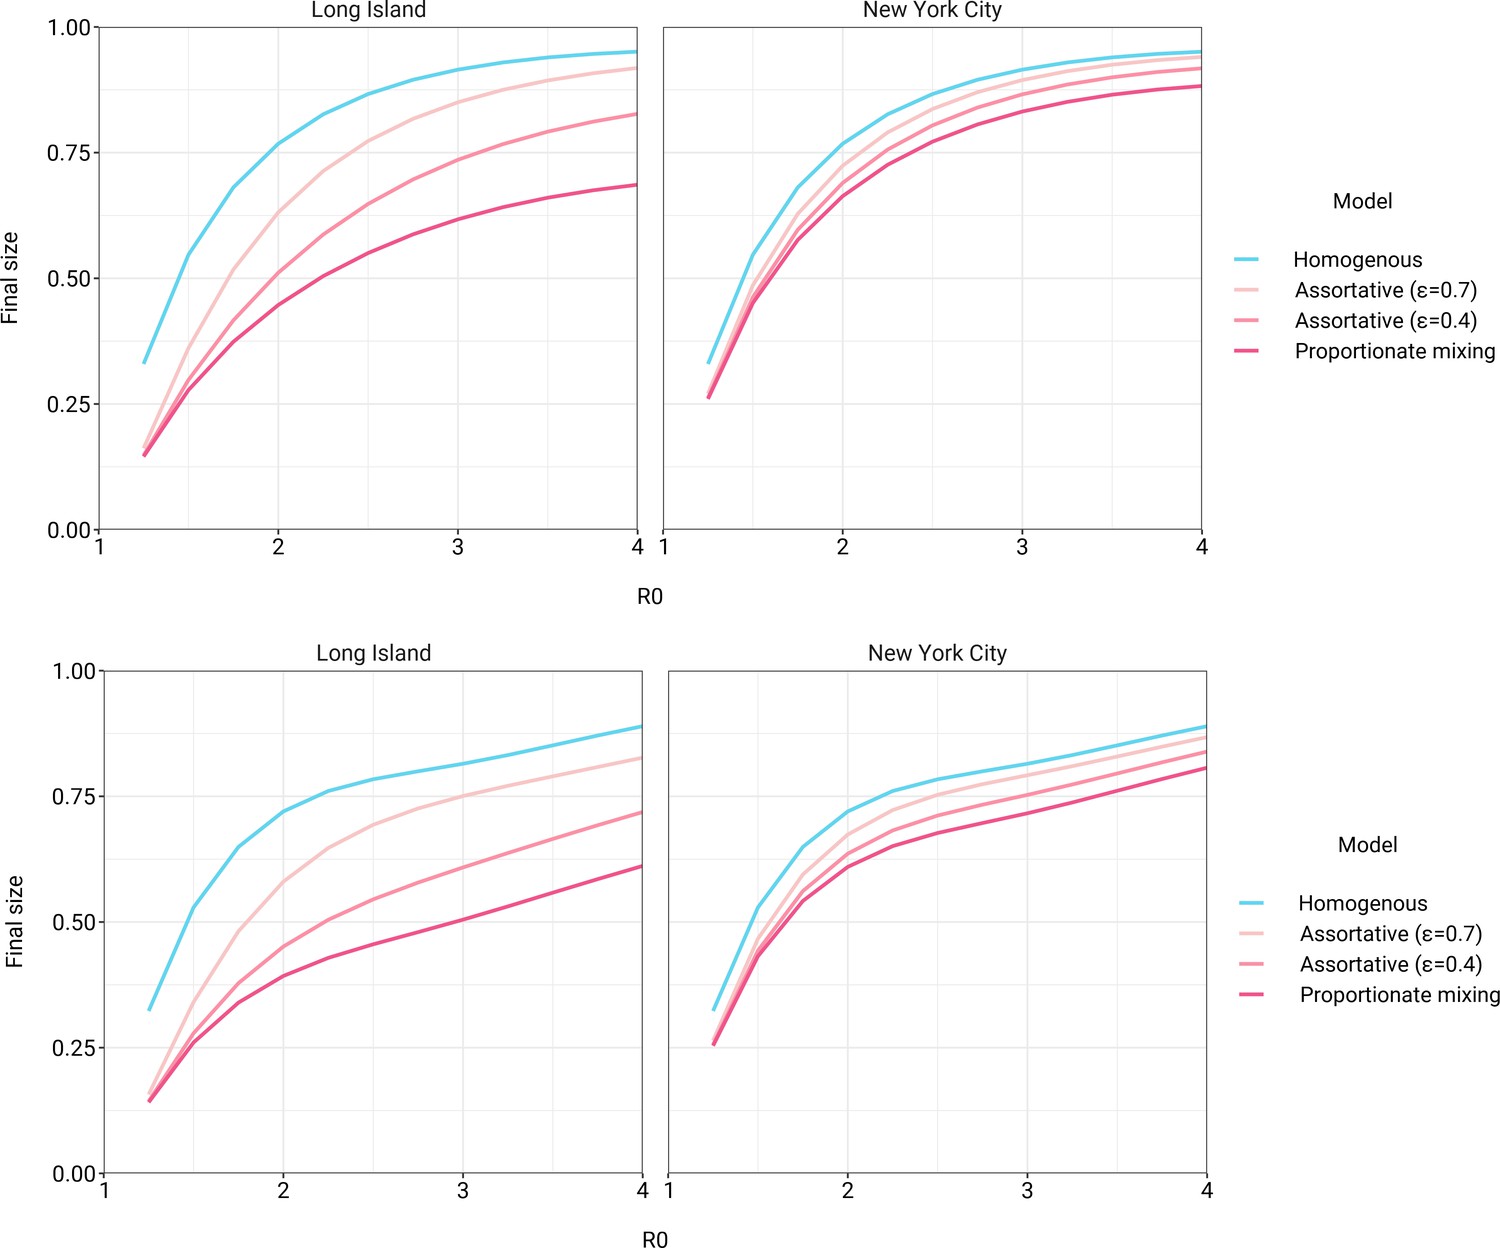
Final epidemic sizes versus R0 in variable exposure models with mitigation measures for (top) and (bottom).
Non-pharmaceutical interventions were initiated when cumulative incidence reached 5% in all models and continued for 50 days. Models were fitted to New York City and Long Island serosurvey data.
Figure 1—figure supplement 7
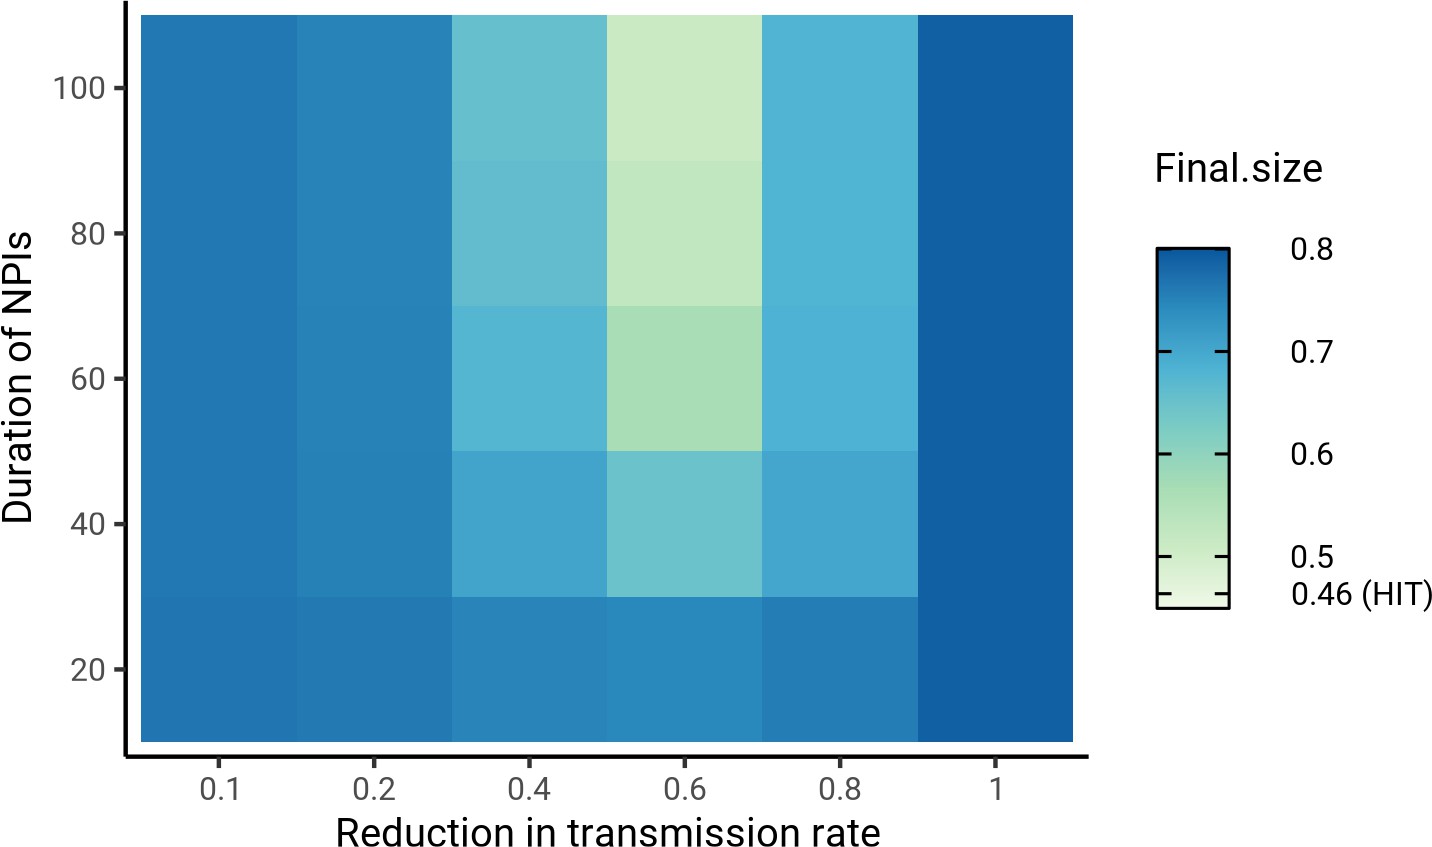
Sensitivity analysis on the impact of intensity and duration of non-pharmaceutical interventions (NPIs) on final epidemic sizes.
Herd immunity threshold values for the same mitigation parameters were 46.4 ± 0.5% (range). The smallest final size, corresponding to and duration = 100, was 51%. Census-informed assortativity models were fit to Long Island seroprevalence data. NPIs were initiated when cumulative incidence reached 5% in all models.
Figure 2 with 8 supplements
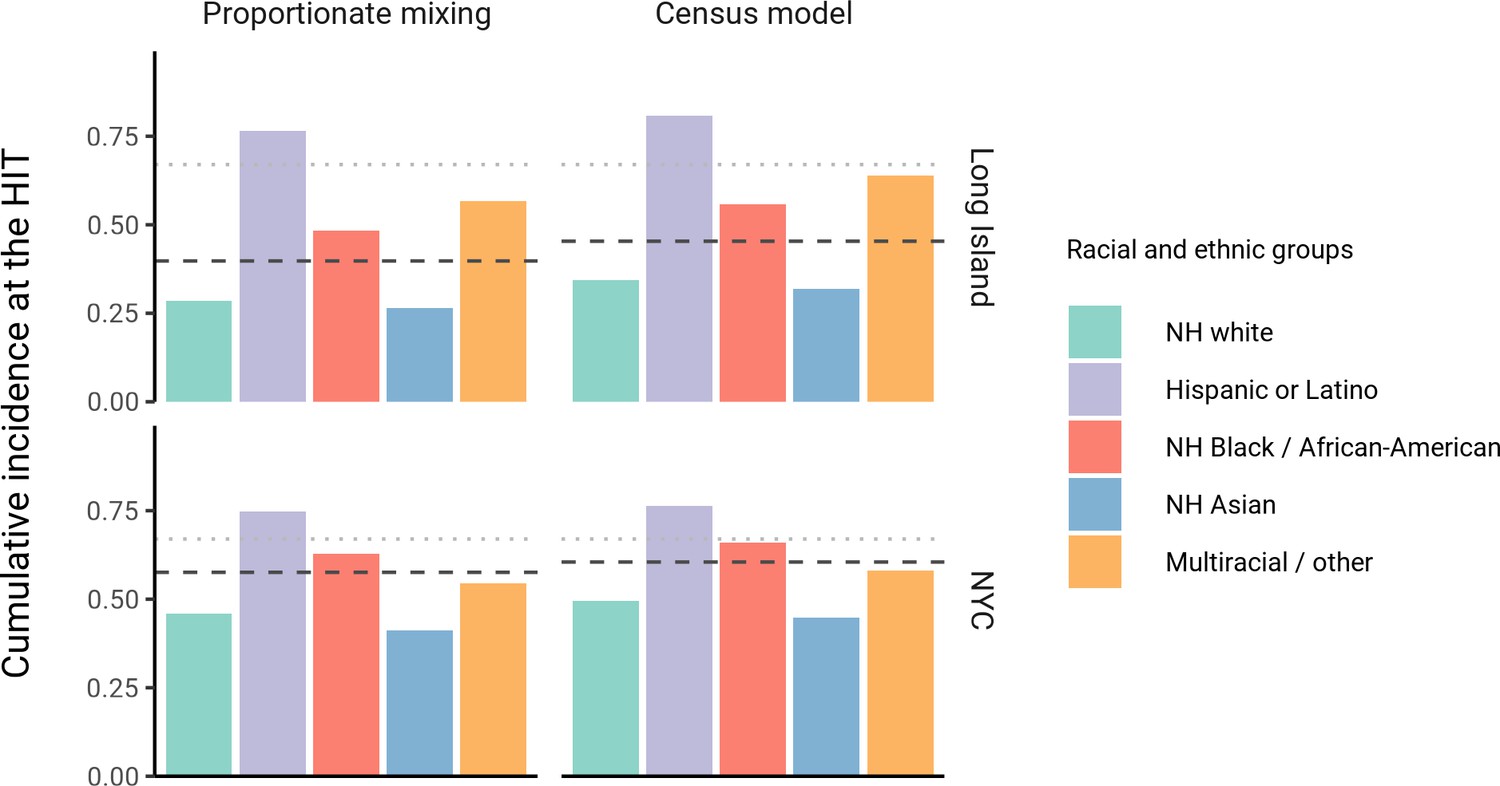
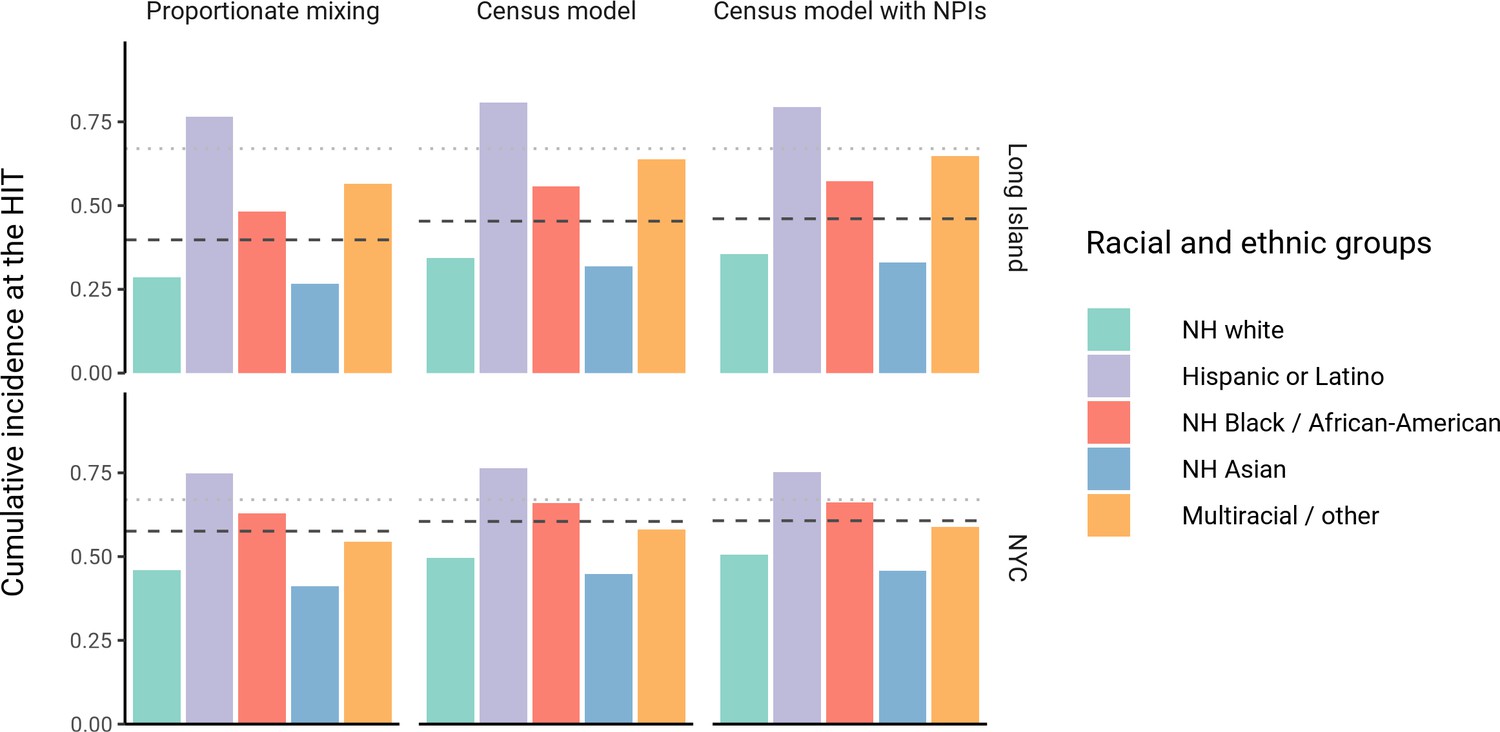
Cumulative incidence is disproportionately higher in some racial and ethnic minorities when the overall herd immunity threshold (HIT) is reached across model types and locations.
Results are shown for an epidemic with R0 = 3. The HIT for the population is indicated with a black line, and the HIT for a homogeneous model with the same R0 is indicated with a gray line.
Figure 2—figure supplement 1
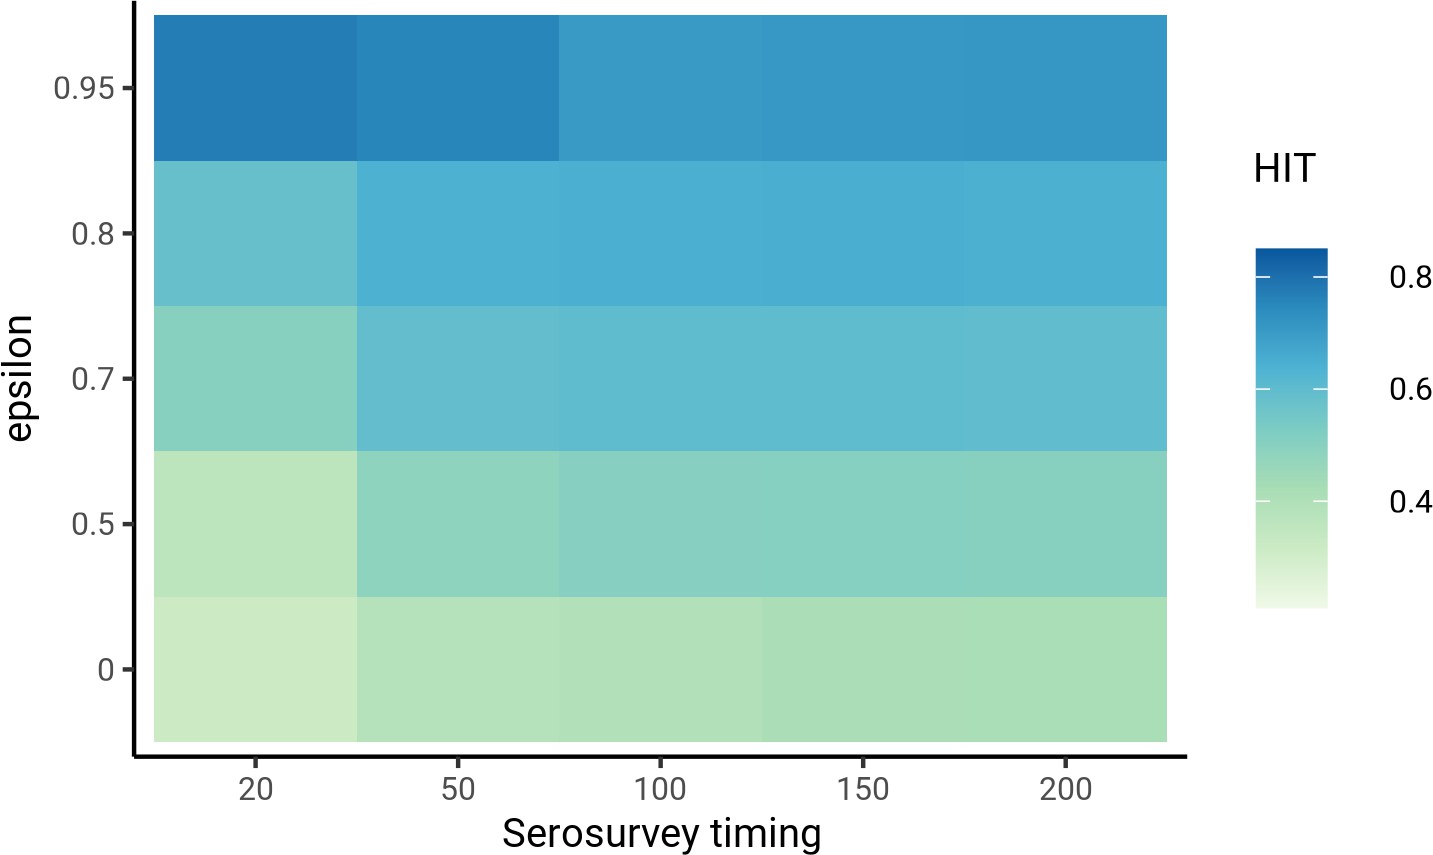
Sensitivity analysis on timing of the serosurvey relative to the start of the epidemic.
Models were fit to Long Island seroprevalence data. Varying the timing of epidemic start did not substantially affect herd immunity threshold estimates as long as the time between epidemic start and serosurvey was reasonable (e.g., >20 days) and assortativity was low ().
Figure 2—figure supplement 2
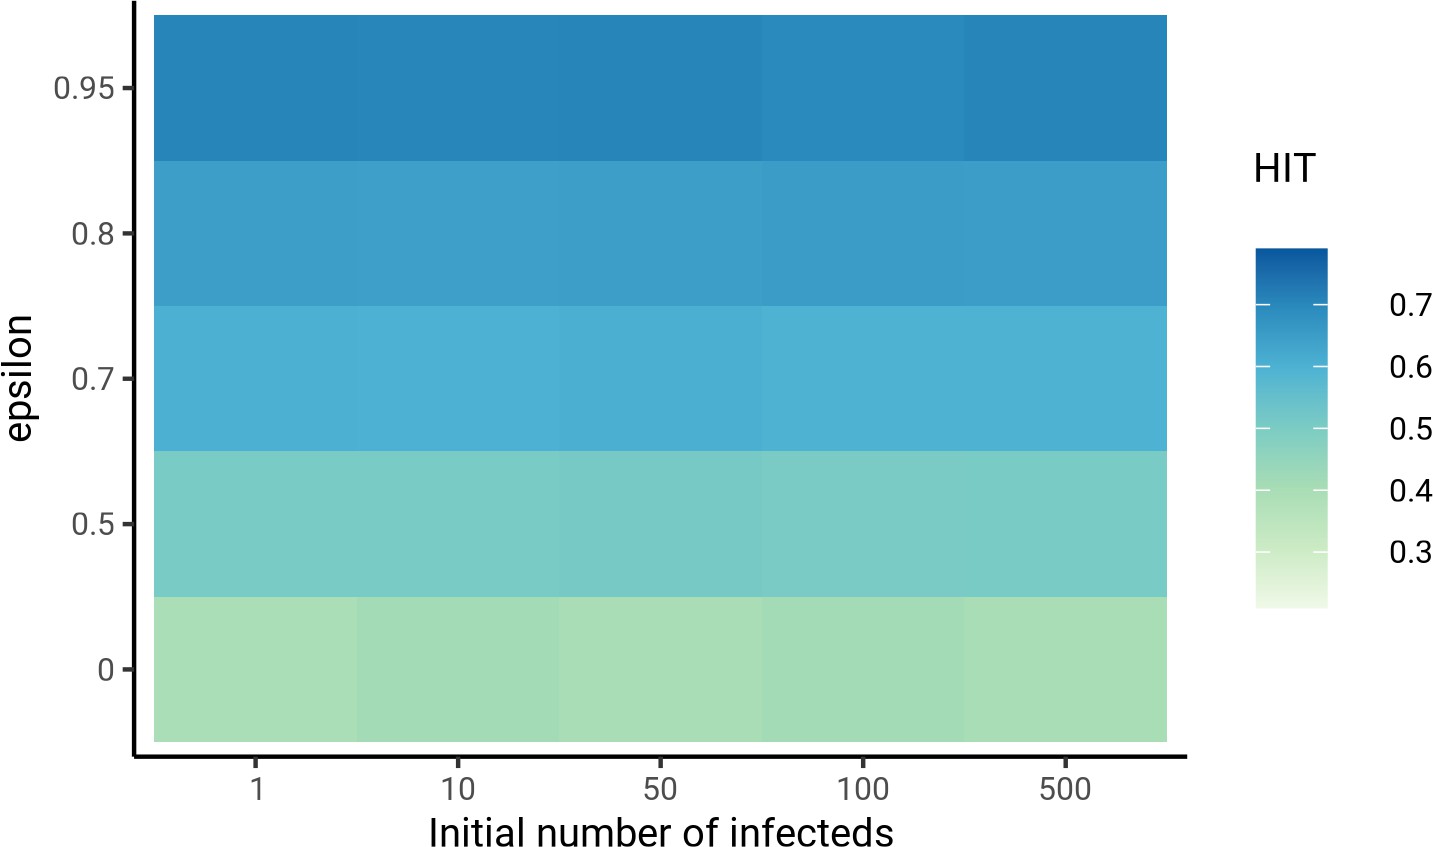
Sensitivity analysis on initial number of infected individuals in each group.
Models were fit to Long Island seroprevalence data. The number of initial infected individuals did not substantially affect herd immunity threshold estimates for low levels of assortativity ().
Figure 2—figure supplement 3
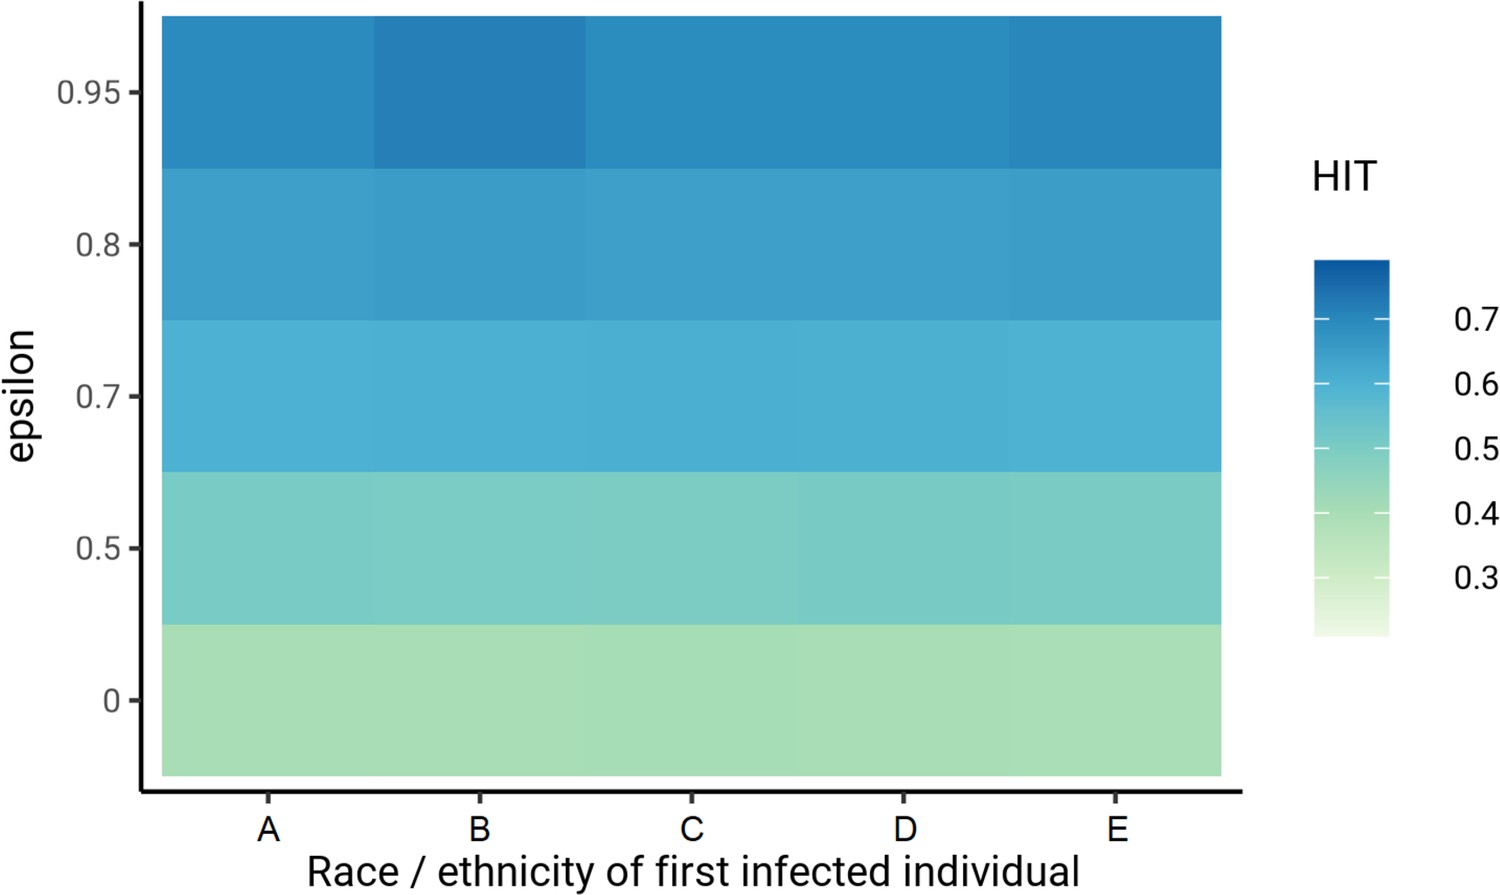
Sensitivity analysis on race or ethnicity of first infected individual.
Models were fit to Long Island seroprevalence data. The race or ethnicity of the first infected individual did not substantially affect herd immunity threshold estimates for low levels of assortativity (). Group A denotes non-Hispanic whites, B denotes Hispanics or Latinos, C denotes non-Hispanic African-Americans, D denotes non-Hispanic Asians, and E denotes multiracial or other demographic groups.
Figure 2—figure supplement 4
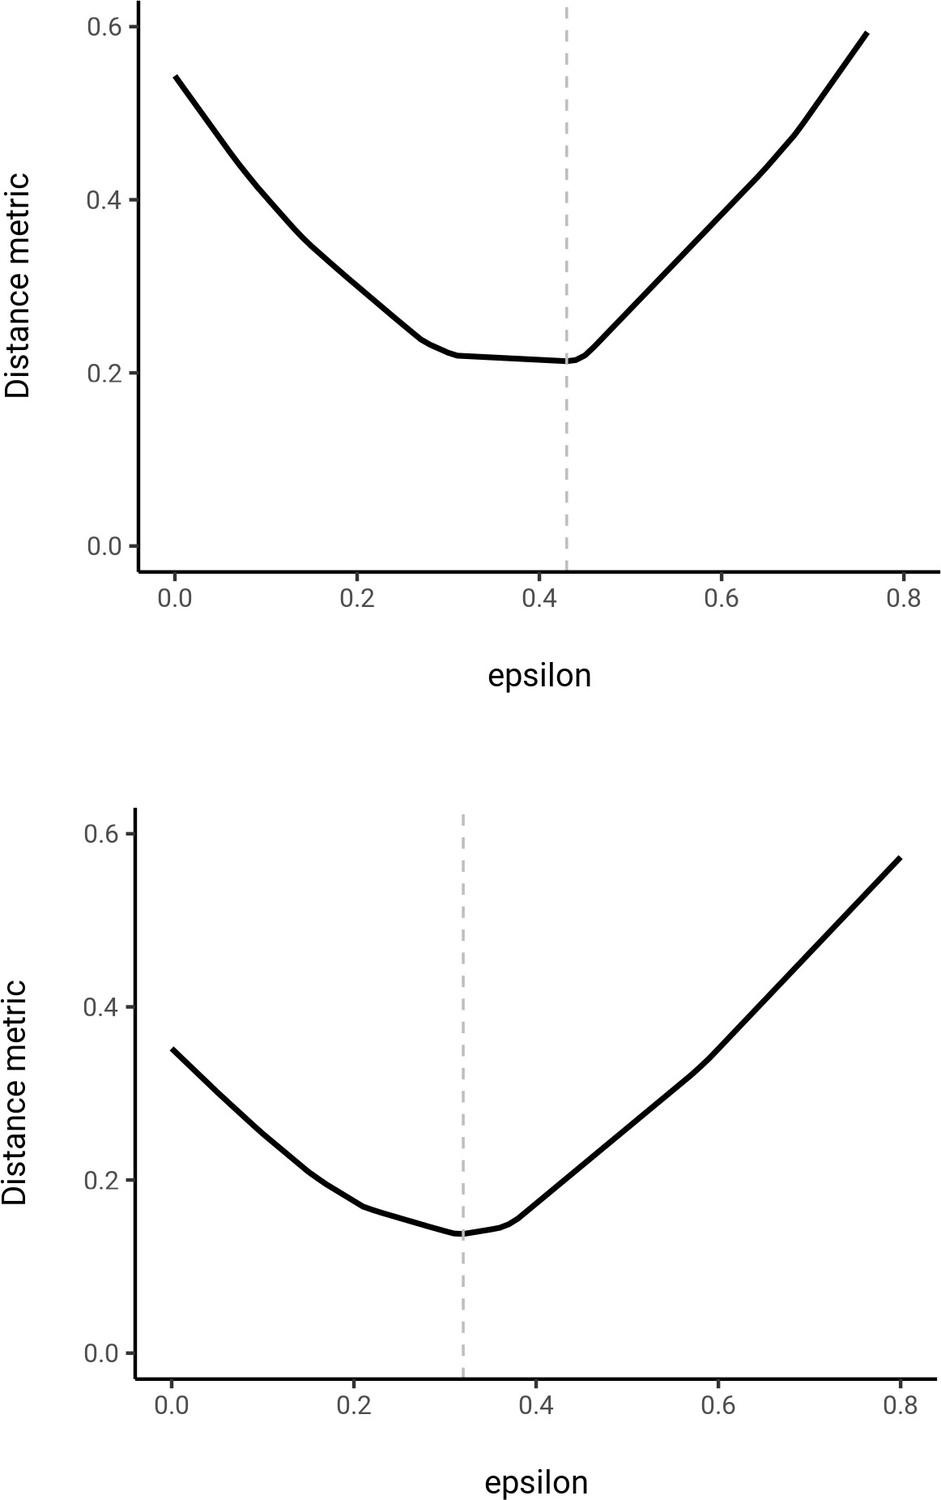
First iteration of fitting in social contact matrices to census data for New York City (top) and Long Island (bottom).
Distance metric denotes the (see Materials and methods) scaled by ; this represents the number of ‘mismatched’ contacts relative to the total number of contacts.
Figure 2—figure supplement 5
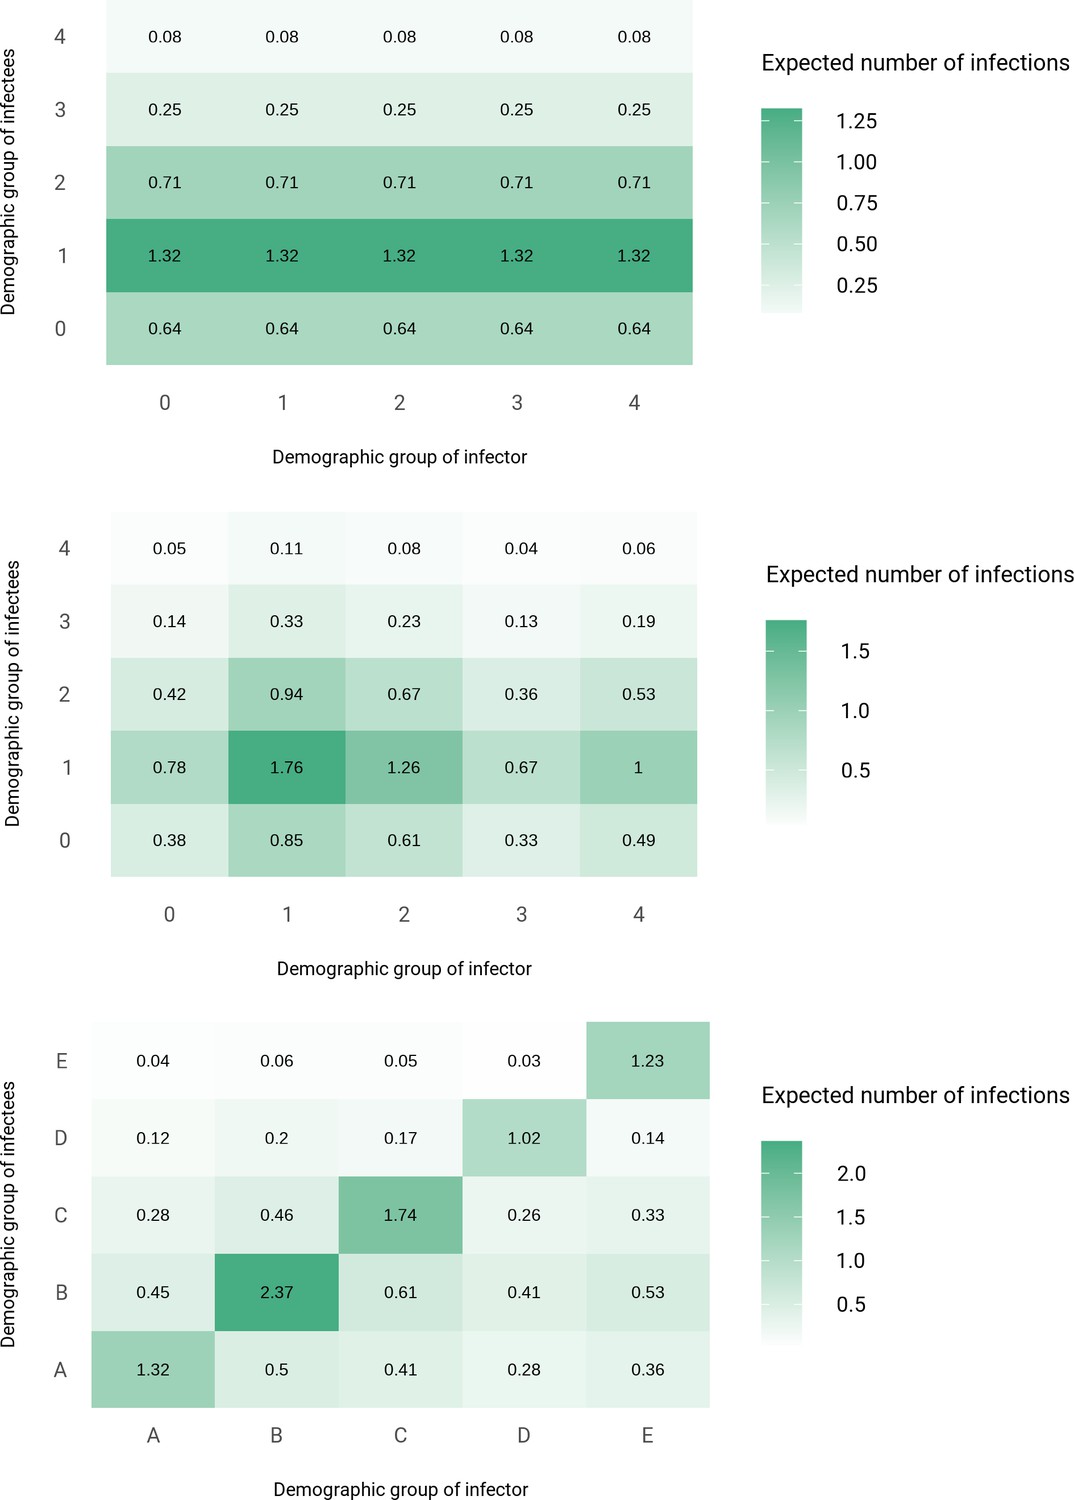
Next-generation matrices for variable susceptibility (top), proportionate mixing (middle), and census-informed assortativity (bottom) models fitted to New York City seroprevalence data.
Each column corresponds to an infected individual from a given demographic group and lists the expected number of secondary infections by group across the rows. Group A denotes non-Hispanic whites, B denotes Hispanics or Latinos, C denotes non-Hispanic African-Americans, D denotes non-Hispanic Asians, and E denotes multiracial or other demographic groups.
Figure 2—figure supplement 6
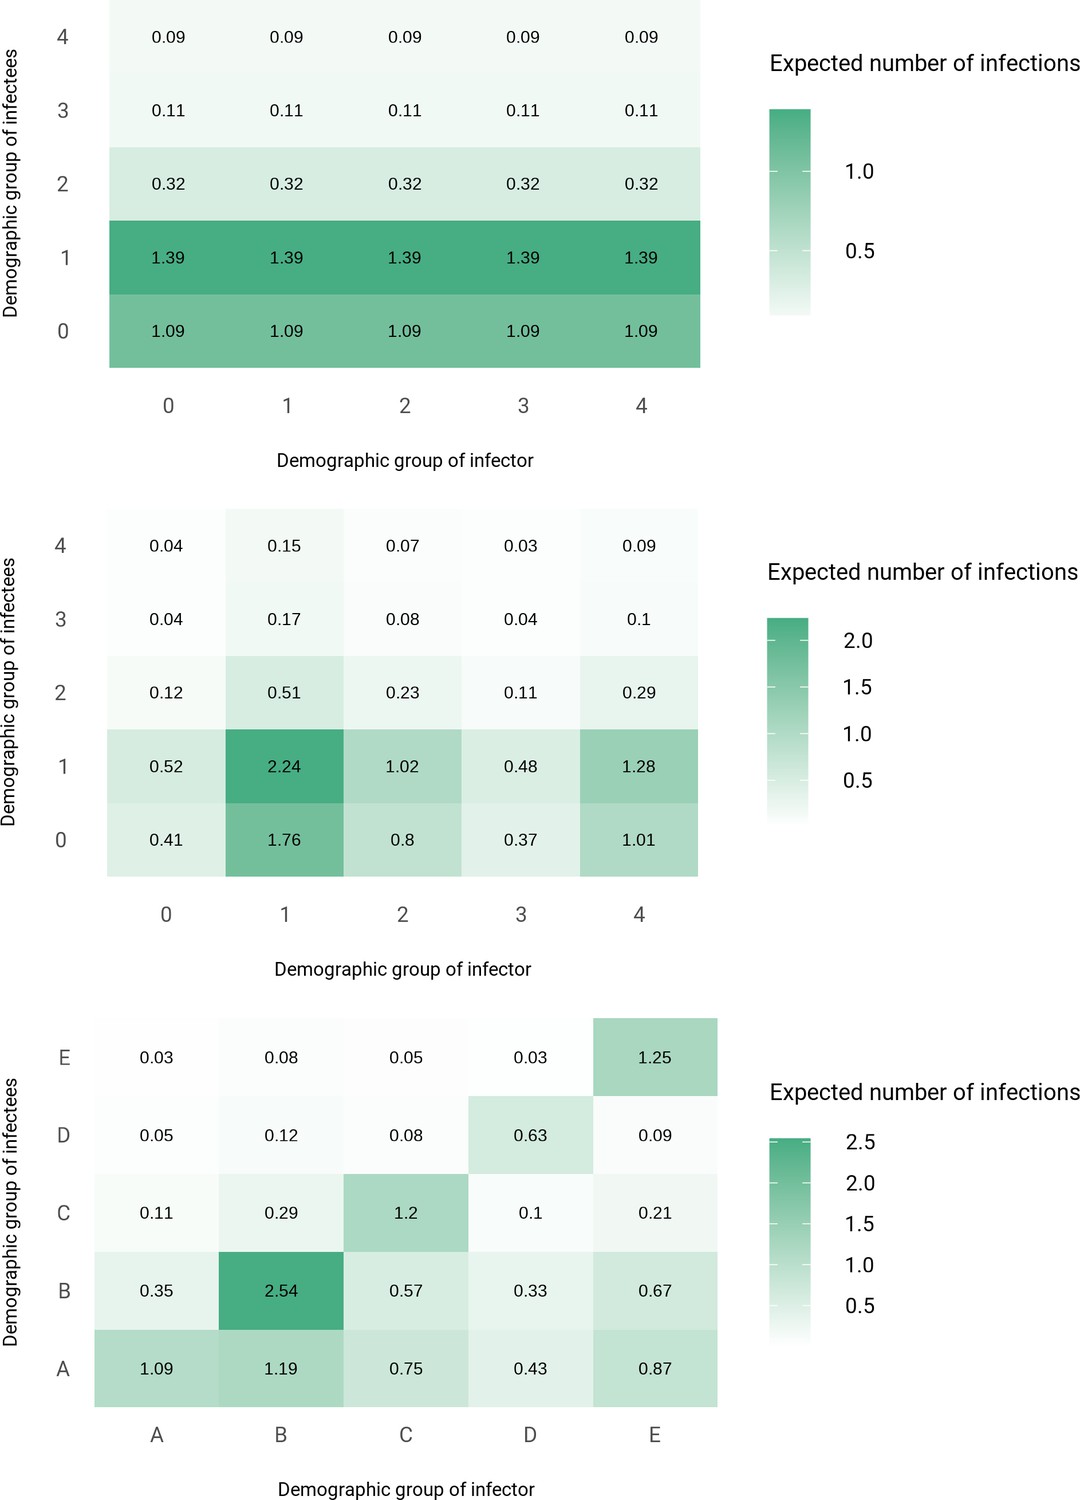
Next-generation matrices for variable susceptibility (top), proportionate mixing (middle), and census-informed assortativity (bottom) models fitted to Long Island seroprevalence data.
Each column corresponds to an infected individual from a given demographic group and lists the expected number of secondary infections by group across the rows. Group A denotes non-Hispanic whites, B denotes Hispanics or Latinos, C denotes non-Hispanic African-Americans, D denotes non-Hispanic Asians, and E denotes multiracial or other demographic groups.
Figure 2—figure supplement 7
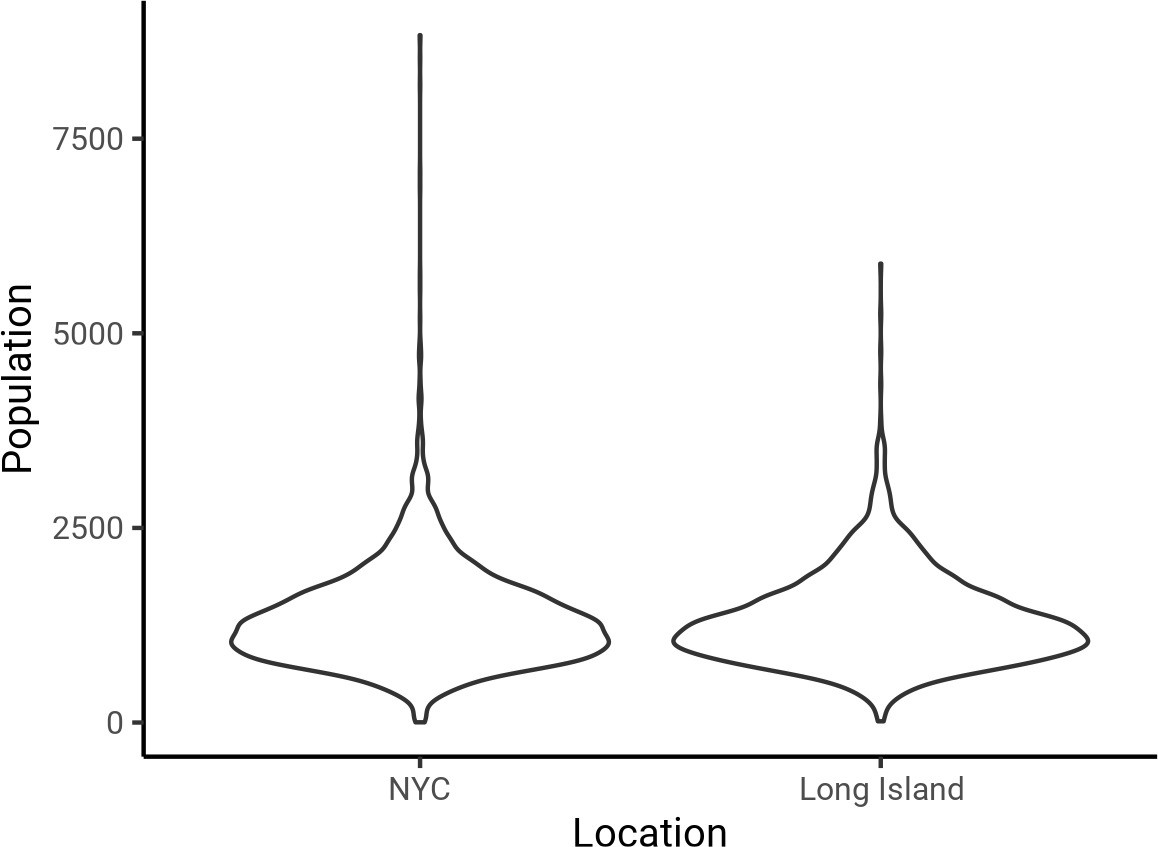
Distribution of census block group sizes in New York City (NYC; left) and Long Island (right).
The mean and SD of the population size were 1357 ± 649 for NYC and 1331 ± 590 for Long Island, indicating that these block groups correspond approximately to local neighborhoods.
Figure 2—figure supplement 8
Cumulative incidence is disproportionately higher in some racial and ethnic minorities when the overall herd immunity threshold (HIT) is reached across model types and locations.
Results are shown for an epidemic with R0 = 3, and non-pharmaceutical interventions (NPIs) were modeled with for 50 days. The HIT for the population is indicated with a black line, and the HIT for a homogeneous model with the same R0 is indicated with a gray line.
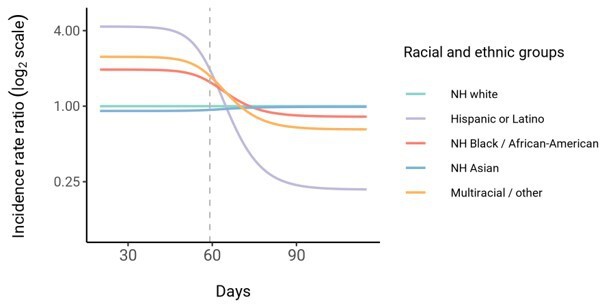
Figure 3 with 3 supplements
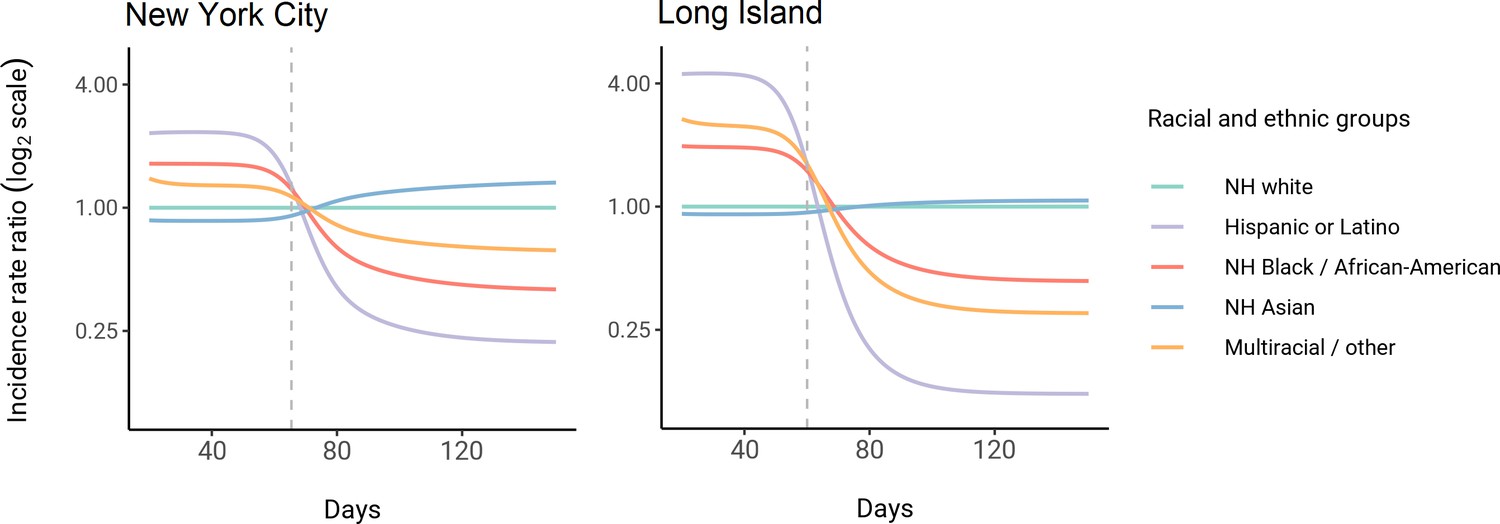
Dynamics of incidence rate ratios relative to non-Hispanic whites in assortative mixing models fitted to census and serosurvey data.
Dashed line represents the peak overall incidence for the epidemic.
Figure 3—figure supplement 1

Comparison of cumulative incidence trajectories for proportionate mixing (top) and assortative mixing (; bottom) models fitted to Long Island seroprevalence data.
Figure 3—figure supplement 2
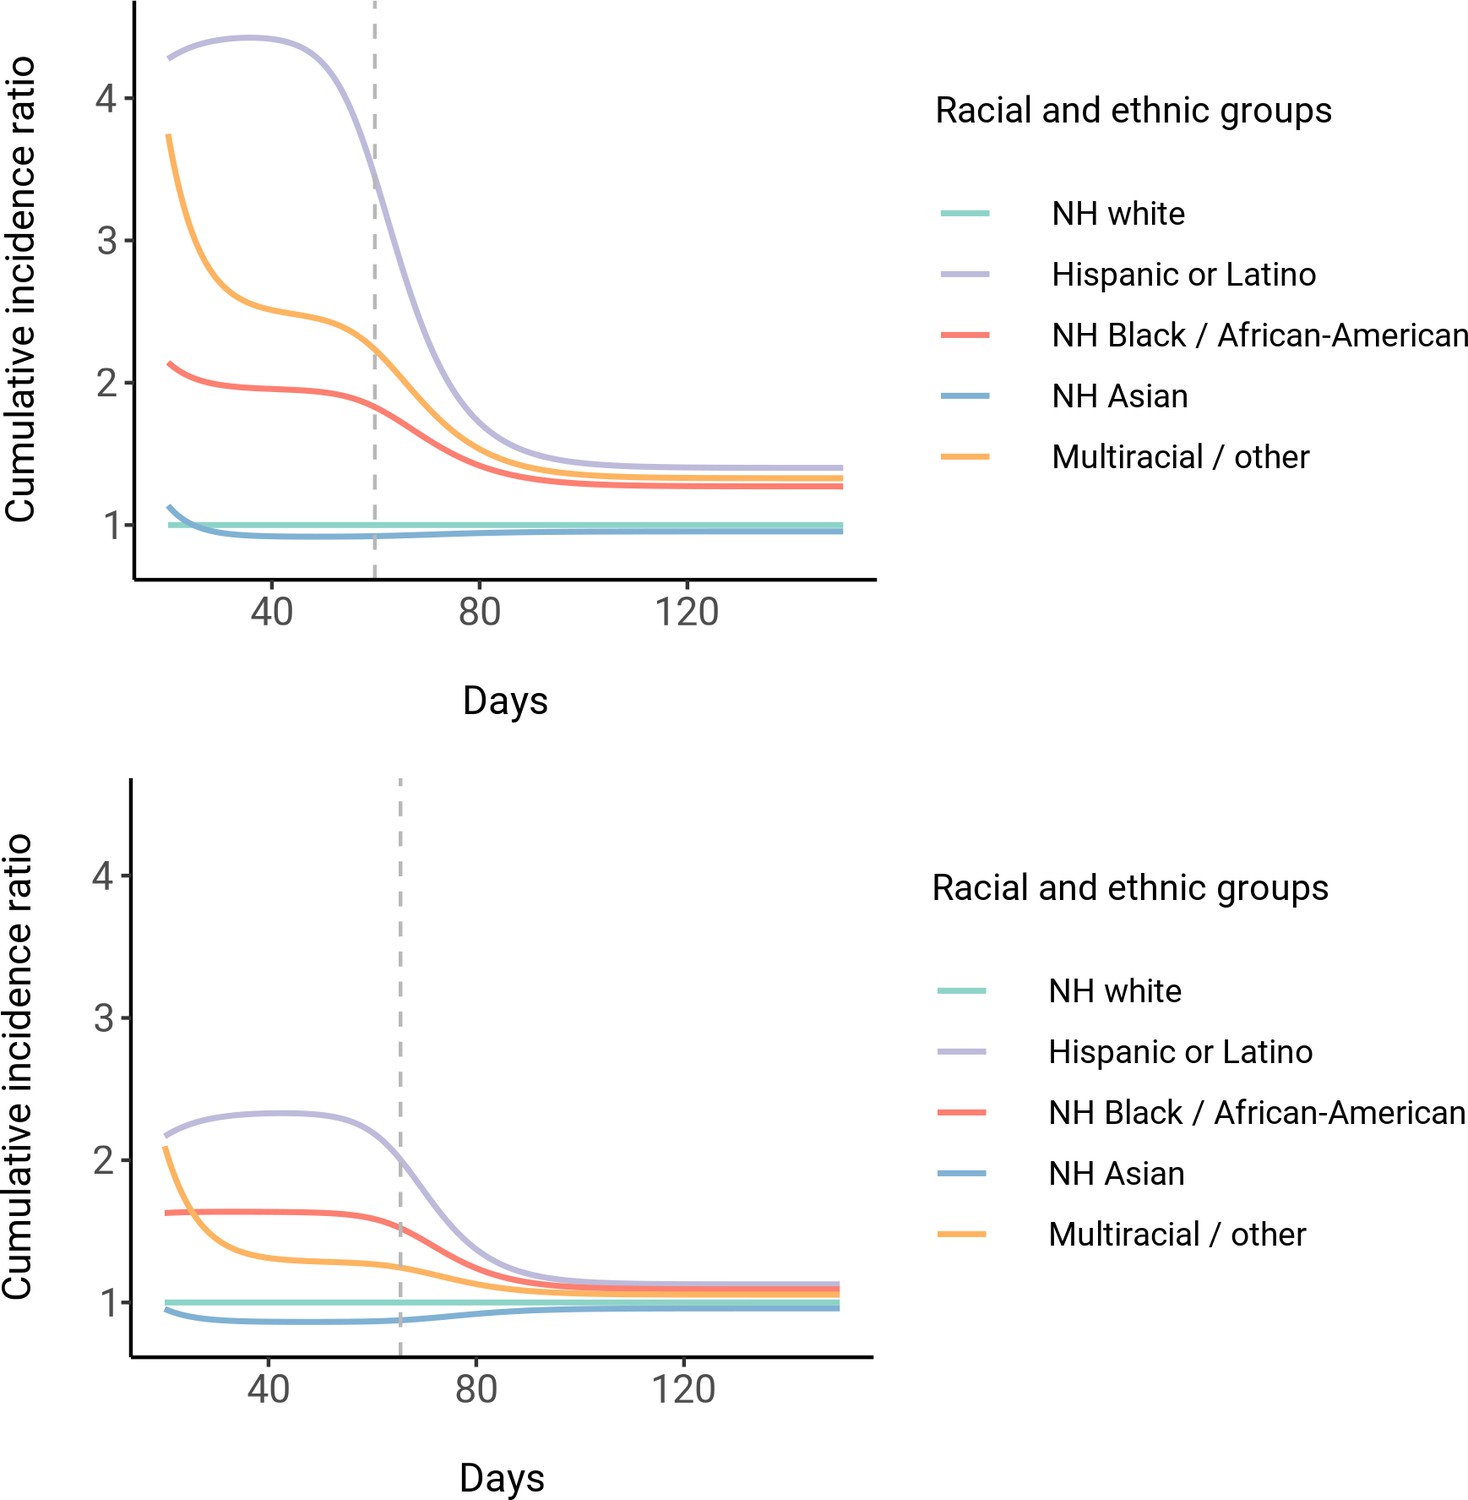
Dynamics of cumulative incidence rate ratios relative to non-Hispanic whites in census-informed assortative mixing models, fitted to New York City (top) and Long Island (bottom) seroprevalence data.
Dashed line represents the peak overall incidence for the epidemic.
Figure 3—figure supplement 3
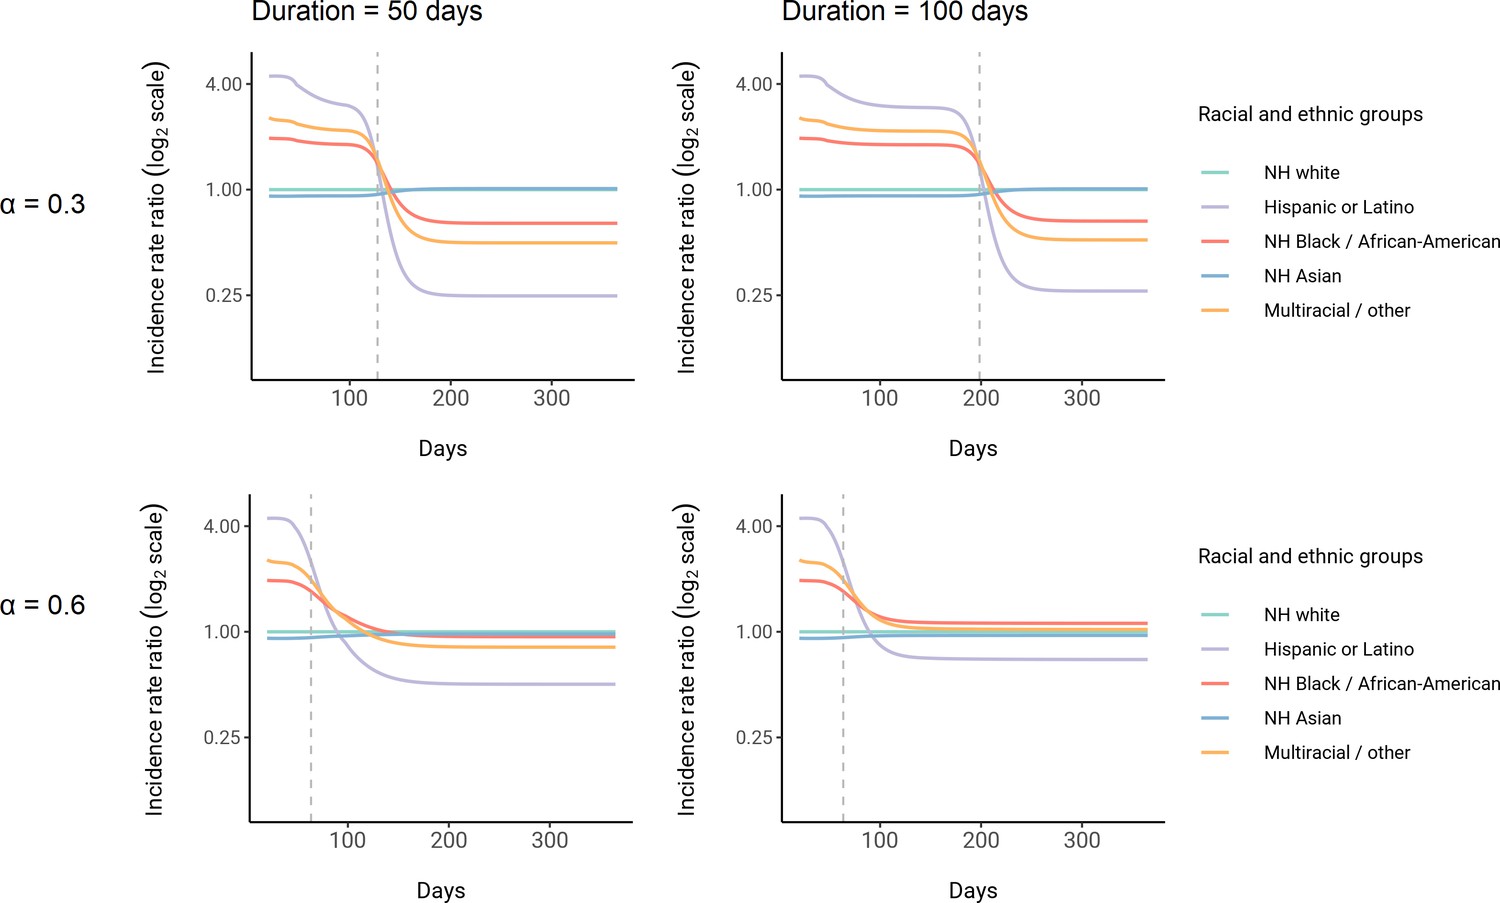
Dynamics of incidence rate ratios relative to non-Hispanic whites in census-informed assortative mixing models with mitigation measures.
Four models were fit to Long Island seroprevalence data with varied non-pharmaceutical intervention intensity and duration parameters as indicated. Dashed line represents the peak overall incidence for the epidemic. Results for no mitigation measures (i.e., ) are shown in Figure 3.
Author response image 1
Additional files
-
Supplementary file 1
Exposure index matrices for New York City and Long Island.
- https://cdn.elifesciences.org/articles/66601/elife-66601-supp1-v3.docx
-
Supplementary file 2
Total contact rate ratios relative to non-Hispanic whites for proportionate mixing and census models fit to New York City and Long Island data.
- https://cdn.elifesciences.org/articles/66601/elife-66601-supp2-v3.docx
-
Supplementary file 3
Iterative census model fitting results for New York City and Long Island.
- https://cdn.elifesciences.org/articles/66601/elife-66601-supp3-v3.docx
-
Transparent reporting form
- https://cdn.elifesciences.org/articles/66601/elife-66601-transrepform1-v3.pdf
Download links
A two-part list of links to download the article, or parts of the article, in various formats.
Downloads (link to download the article as PDF)
Open citations (links to open the citations from this article in various online reference manager services)
Cite this article (links to download the citations from this article in formats compatible with various reference manager tools)
Modeling the impact of racial and ethnic disparities on COVID-19 epidemic dynamics
eLife 10:e66601.
https://doi.org/10.7554/eLife.66601


