Microbiome-pathogen interactions drive epidemiological dynamics of antibiotic resistance: A modeling study applied to nosocomial pathogen control
- Institut Pasteur, Epidemiology and Modelling of Antibiotic Evasion (EMAE), France
- Université Paris-Saclay, UVSQ, Inserm, CESP, Anti-infective evasion and pharmacoepidemiology team, France
- Modélisation, épidémiologie et surveillance des risques sanitaires (MESuRS), Conservatoire national des arts et métiers, France
- PACRI unit, Institut Pasteur, Conservatoire national des arts et métiers, France
Figures
Figure 1
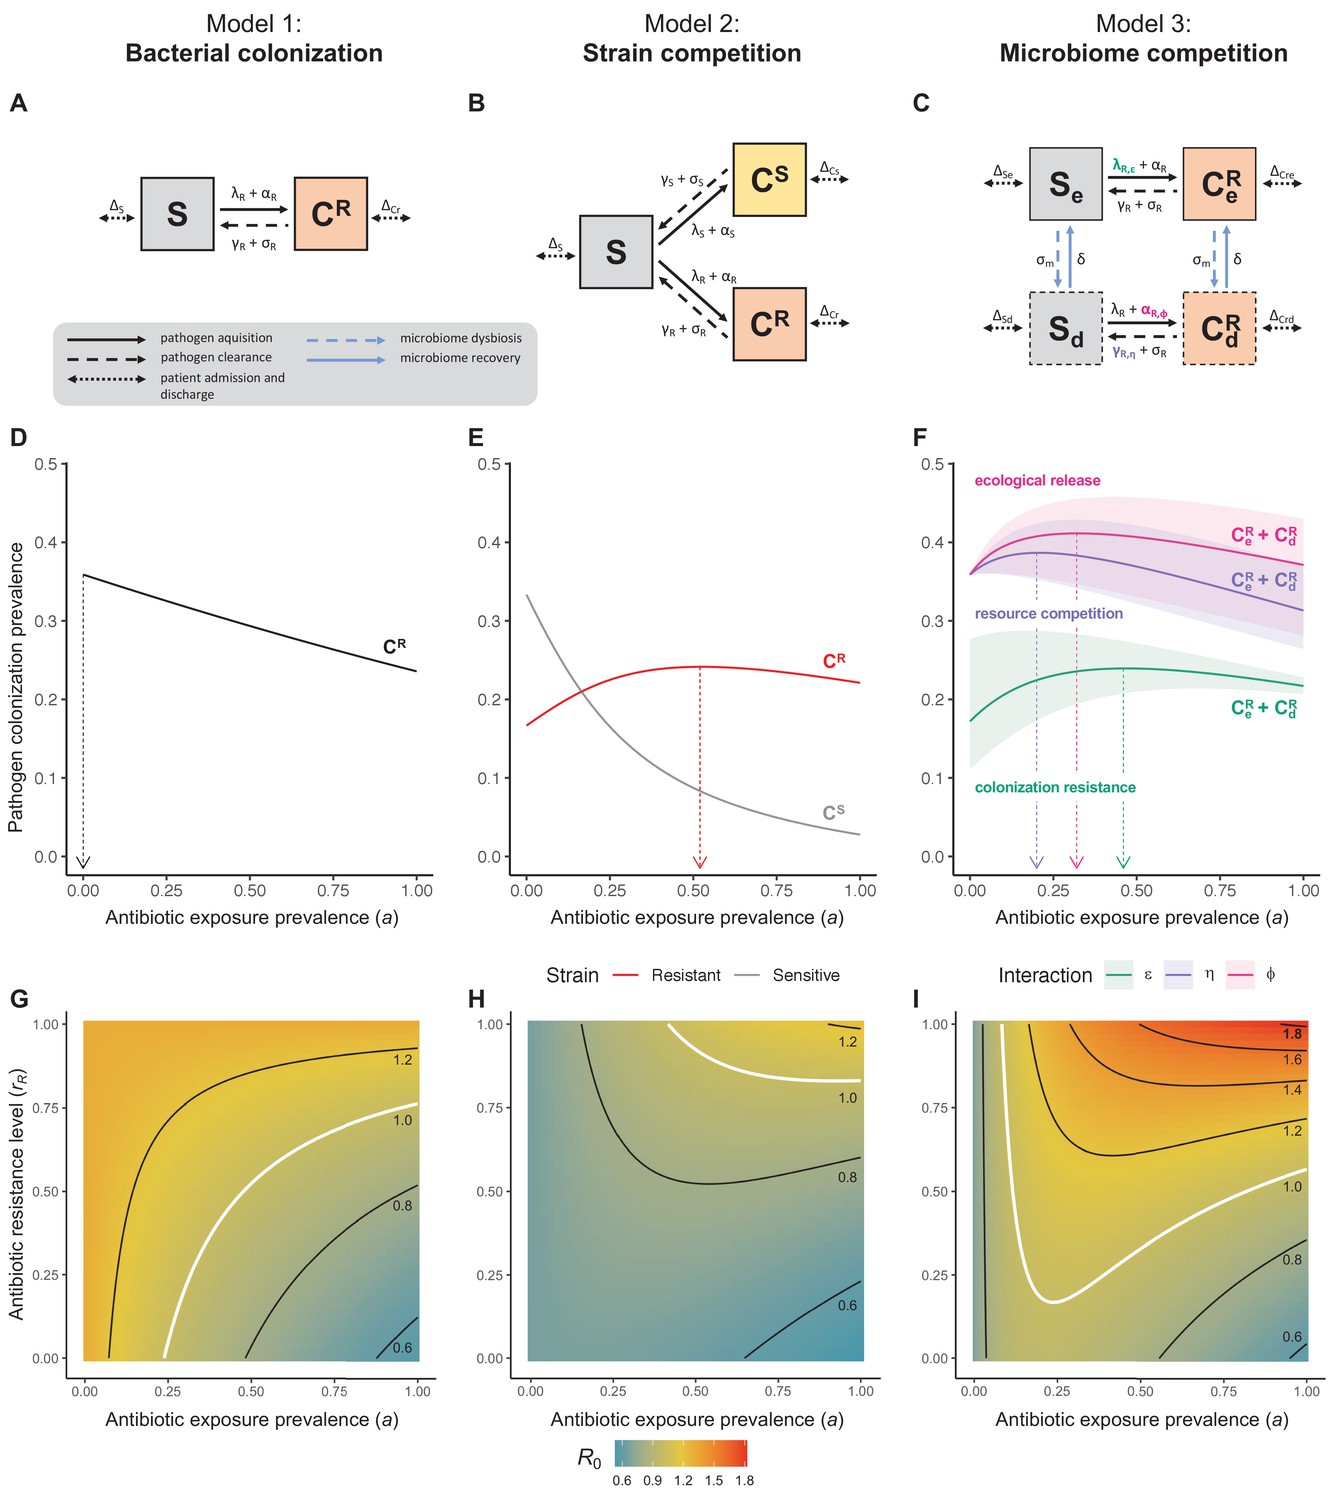
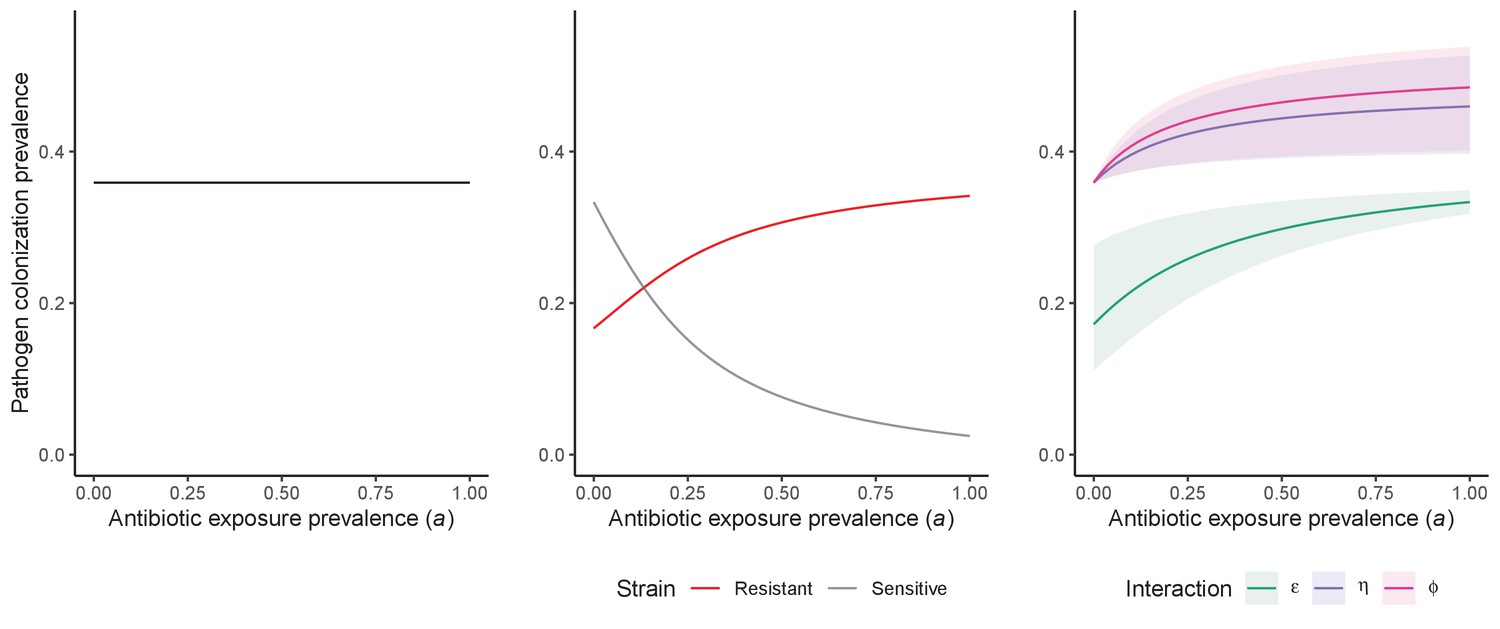
Comparison of models describing bacterial colonization dynamics in healthcare settings: in contrast to predictions from a model with no ecological competition (A, D, G), models including strain competition (B, E, H) or microbiome competition (C, F, I) can explain how antibiotics select for the epidemiological spread of antibiotic-resistant bacteria.
For all models, ODEs are integrated numerically using the same parameter values representing a generic nosocomial pathogen PR (see Appendix 1—table 1). (A,B,C) Compartmental model diagrams representing corresponding ODE systems from the main text (A: Equation 1; B: Equation 3; C: Equation 4). (D,E,F) Pathogen colonization prevalence as a function of antibiotic exposure prevalence (), assuming partial antibiotic resistance (rR = 0.8). For (E) PS and PR circulate simultaneously, assuming strain-specific differences in antibiotic resistance (rS = 0, rR = 0.8), natural clearance (γS = 0.03 day−1, γR = 0.06 day−1) and transmission (λS = β × CS/N, λR = β × CR/N). For (F), epidemiological dynamics are evaluated independently for each interaction and superimposed (ε = colonization resistance; η = resource competition; ϕ = ecological release); shaded intervals represent outcomes across the range of values considered for each interaction (see Figure 2); and antibiotics are assumed to induce dysbiosis after 1 day (θm = 1 day−1), from which microbiome stability recovers after 7 days (δ = 1/7 day−1). Dashed vertical arrows denote the levels of antibiotic use that maximize PR prevalence (the sum of colonized compartments CR). (G,H,I) Numerical evaluation of the basic reproduction number (R0) of PR as a function of and rR. White contour lines indicate R0 = 1, above which a single colonized patient admitted to a naïve hospital population is expected to trigger an outbreak. For I, all three microbiome-pathogen interactions are applied simultaneously using baseline values (ε = 0.5; η = 0.5; ϕ = 5).
Figure 2
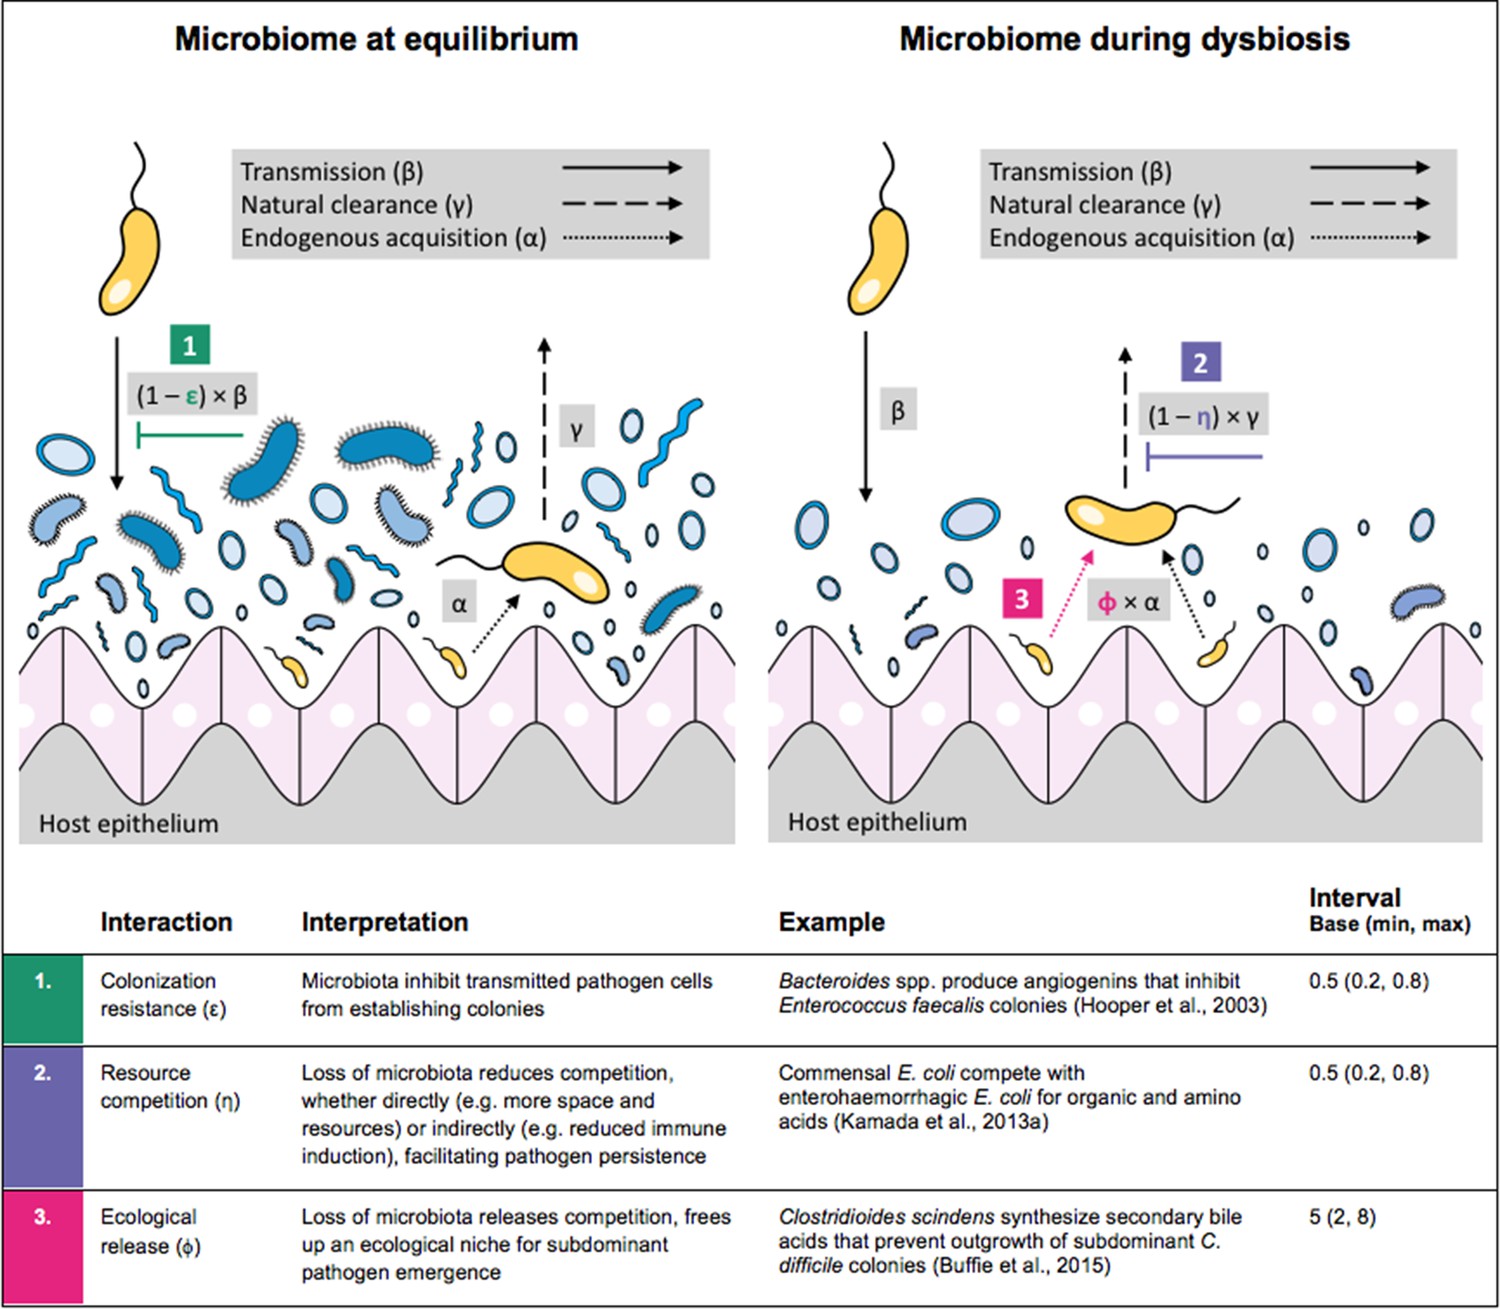
Illustration of within-host ecological interactions between the host microbiome (blue) and a transmissible bacterial pathogen PR (yellow), and their impact on PR’s vital epidemiological parameters β (transmission rate), γ (clearance rate) and α (endogenous acquisition rate).
To illustrate the latter: sub-dominant, non-transmissible PR colonies inhibited by microbiota are represented by small cartoon pathogens, which can grow into dominant, transmissible colonies (large cartoon pathogens) via endogenous acquisition. Microbiome-pathogen interactions are assumed to differ between hosts with a stable microbiome at population dynamic equilibrium (left) and hosts experiencing antibiotic-induced microbiome dysbiosis (right). Interaction coefficients can be interpreted as terms explaining variation in host susceptibility to pathogen colonization, as depending on their recent history of antibiotic exposure. For interaction coefficient parameter values, broad intervals are assumed for the baseline analysis.
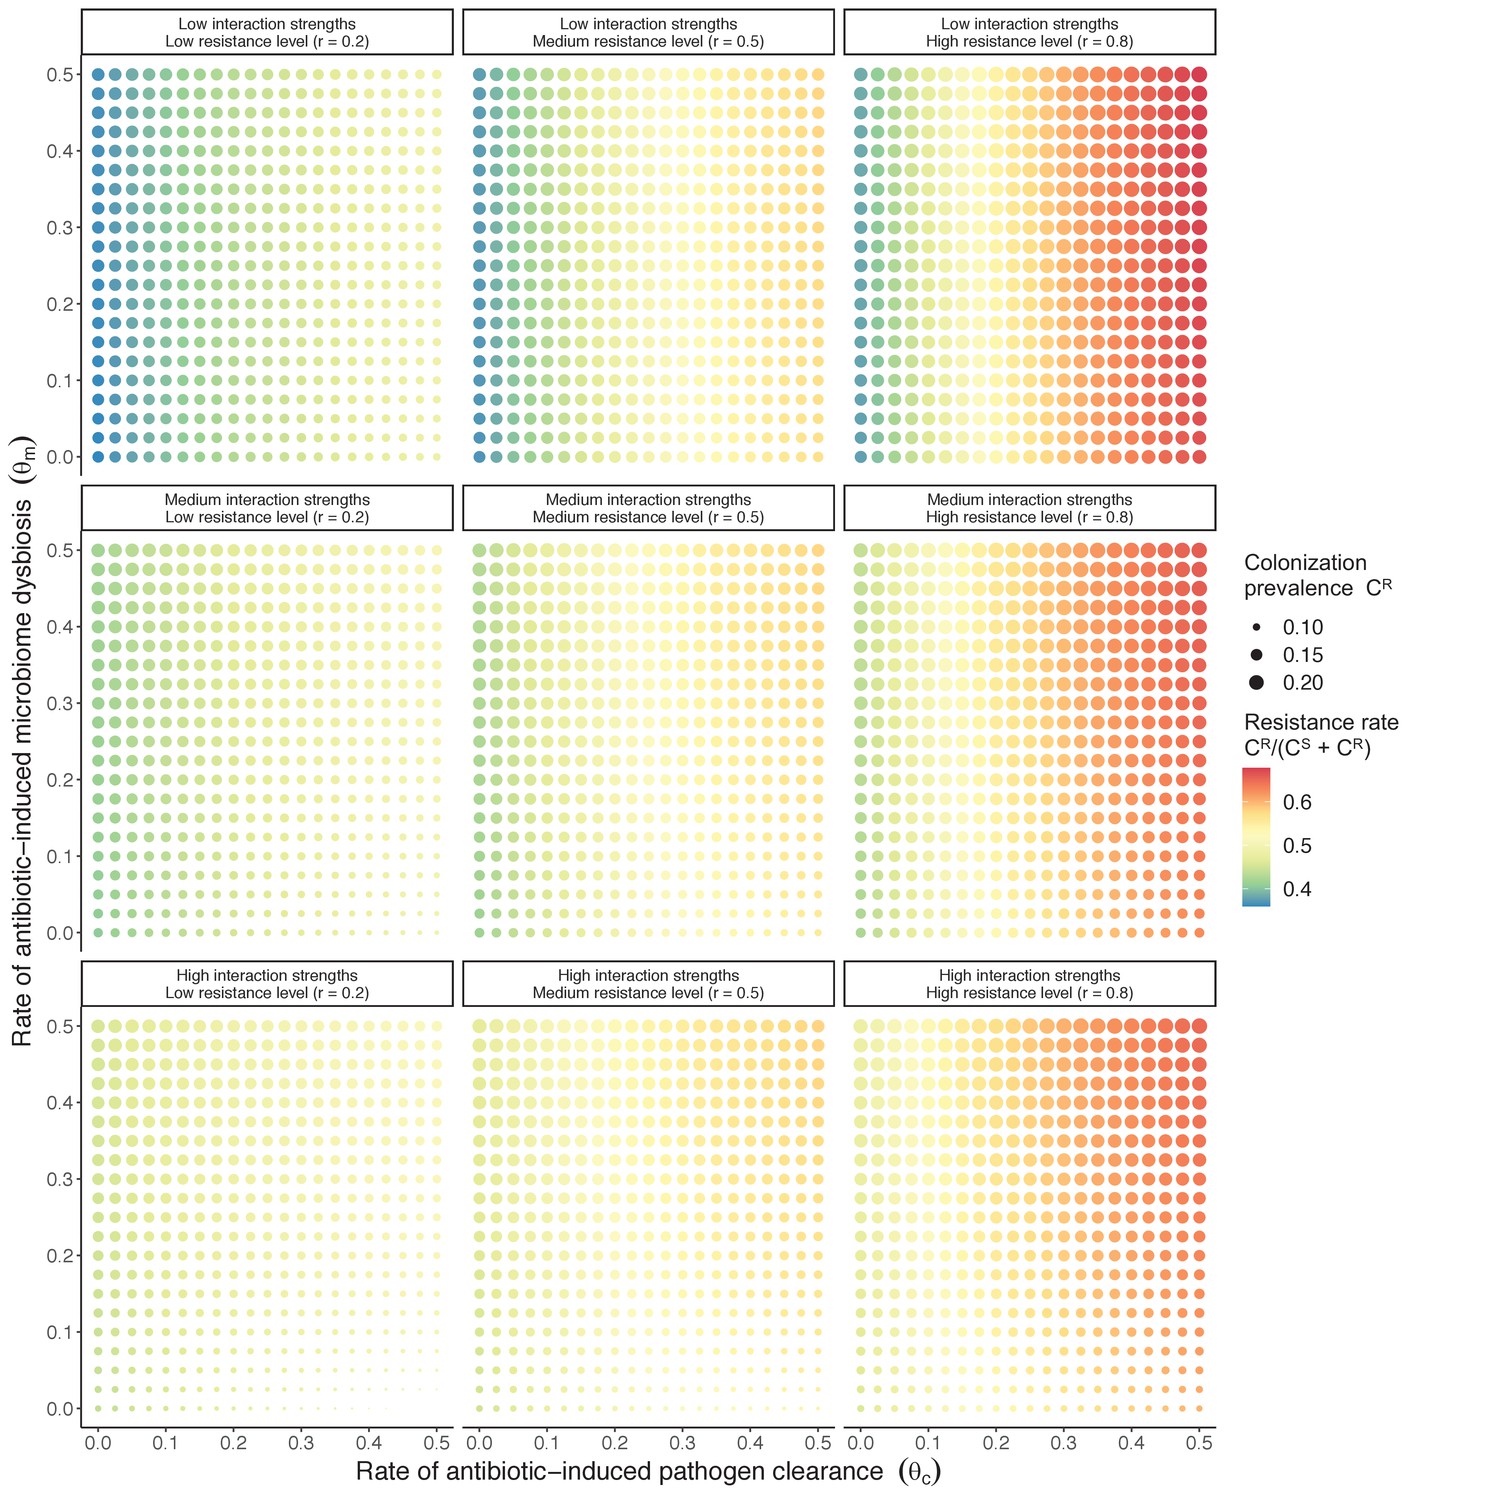
Figure 3
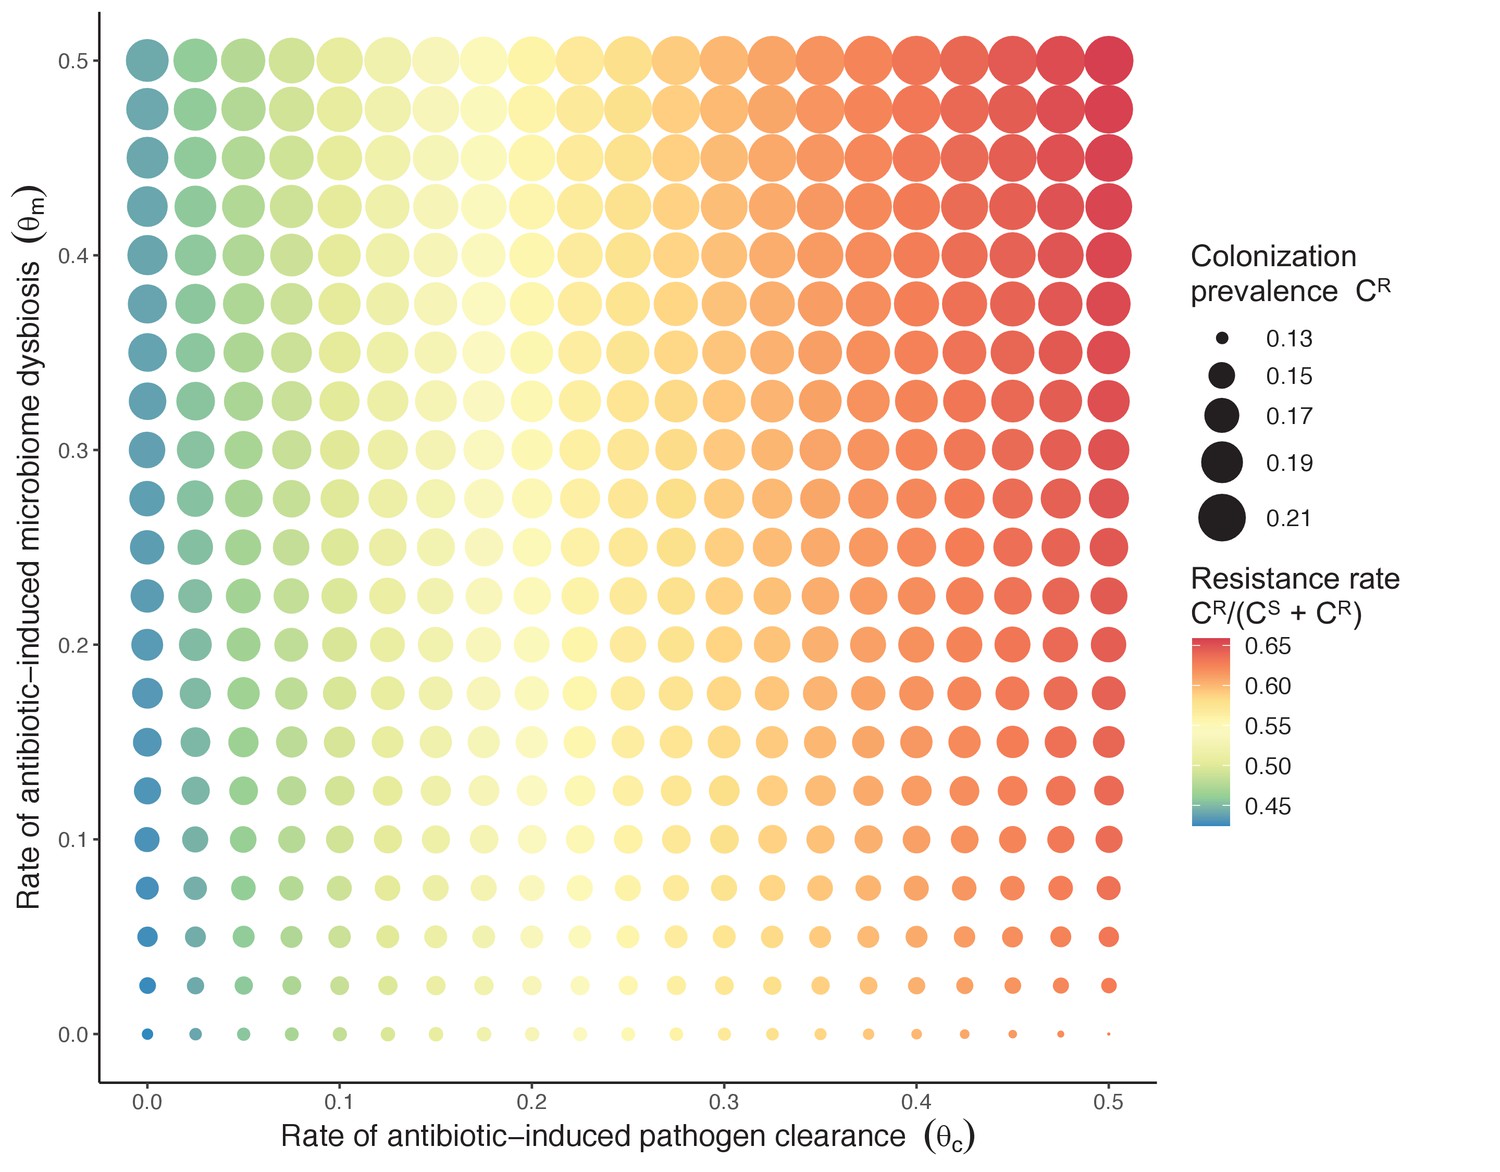
Strain competition and microbiome competition as simultaneous forces of antibiotic selection, with asymmetric impacts on epidemiological indicators.
In a mixed microbiome-strain competition model (Equation 6), colonization prevalence of PR (CR; circle size) and the pathogen’s resistance rate (CR/(CS + CR); color) depend on the relative rates at which antibiotics disrupt microbiota (θm) and clear pathogen colonization (θc). Antibiotics with a stronger effect on pathogen clearance (higher θc) increase the resistance rate, while antibiotics with a stronger effect on microbiota (higher θm) increase prevalence.
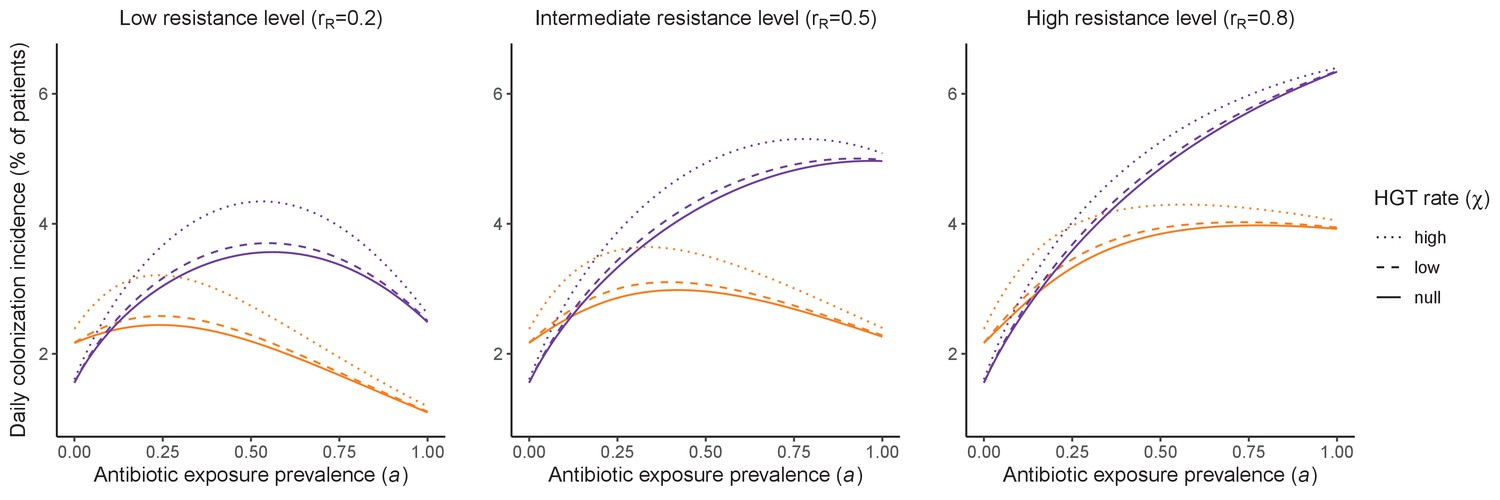
Figure 4
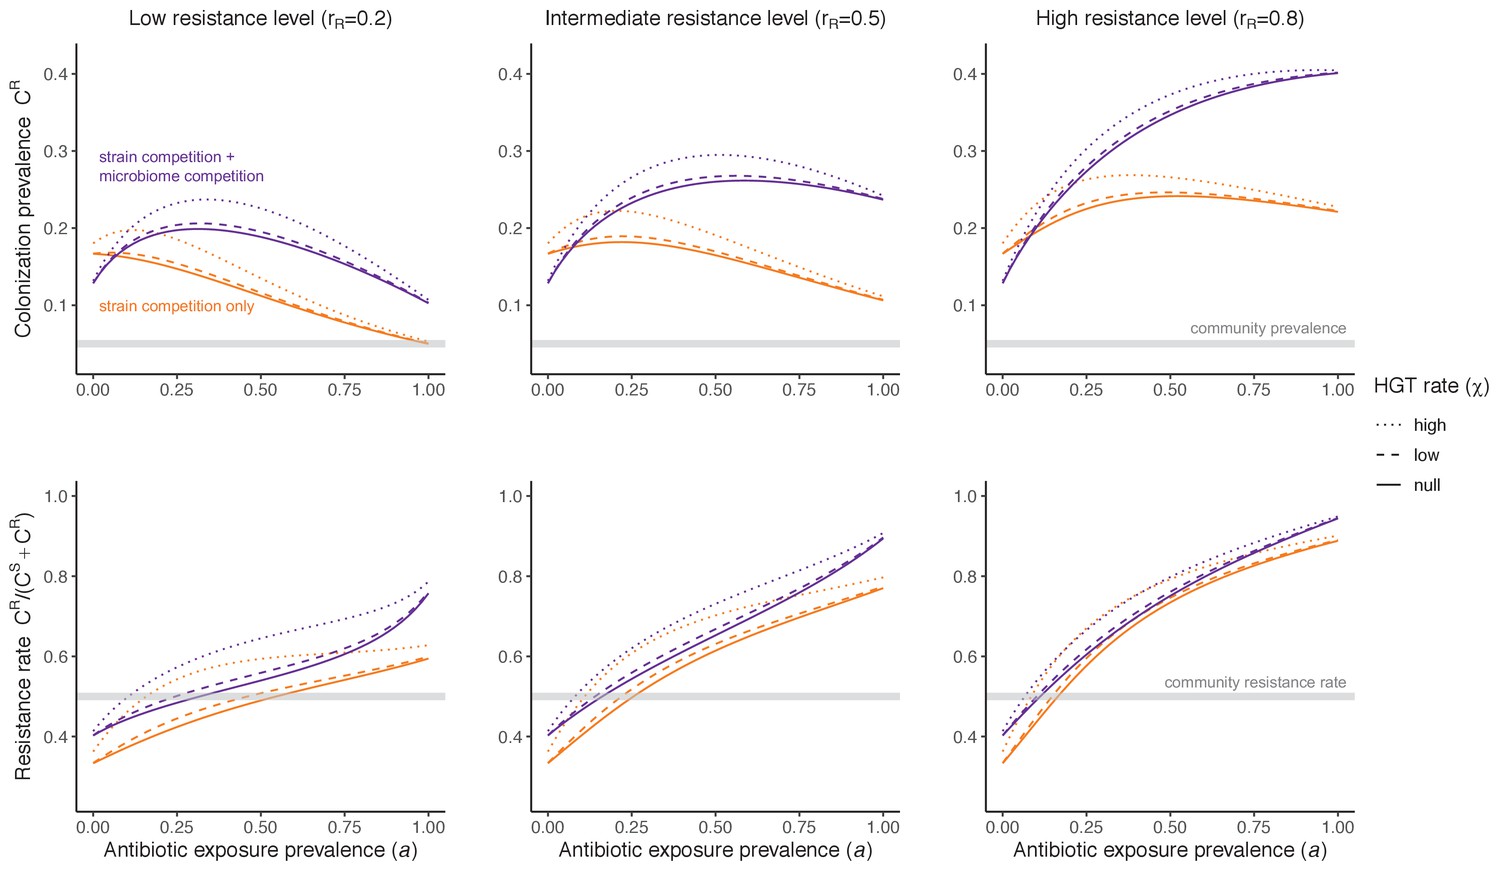
Impacts of horizontal gene transfer (HGT) on antibiotic selection for resistance.
Allowing a resistance gene to transfer horizontally increases prevalence (top row) of the strain PR that bears the gene, as well as its resistance rate (bottom row). The relative impact of HGT depends on the gene’s rate of transfer (χ, line type), antibiotic exposure prevalence (, x-axis), competitive interactions between pathogen strains and host microbiota (colors), the level of resistance conferred by the gene (rR, columns), and any other parameters that drive the dynamics of donor and recipient strains. We assume that χd/χe = 10, such that the low HGT rate corresponds to {χe=0.01 day−1, χd=0.1 day−1} and the high rate to {χe=0.1 day−1, χd=1 day−1}. Impacts of HGT on colonization incidence are shown in Appendix 1—figure 6. Alternative HGT assumptions are explored in Appendix 1—figure 7A.
Figure 5
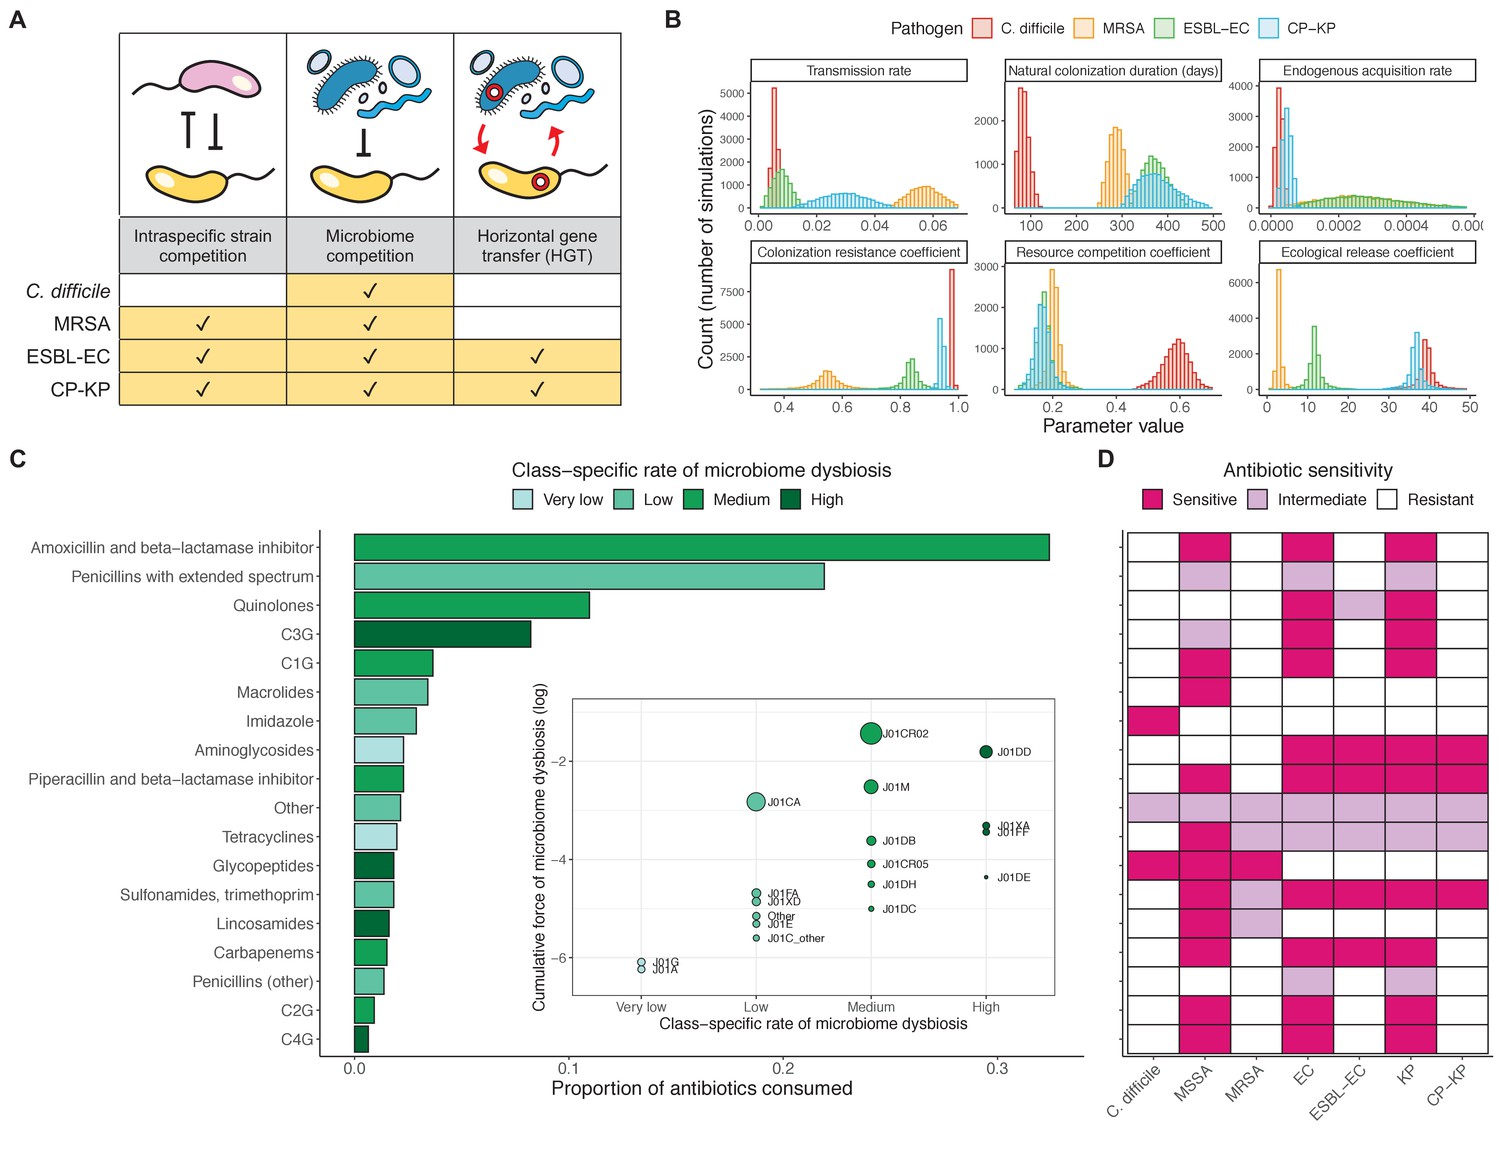
Characterizing the species-specific ecology of four selected antibiotic-resistant bacterial pathogens in the hospital setting.
(A) Model structure: the within-host ecological interactions assumed for each pathogen, based on expert elicitation. (B) Simulation inputs: 95% distributions for selected model parameters drawn stochastically over 10,000 runs (all parameter distributions in Appendix 1—table 2–6). (C) The distribution of antibiotic classes consumed in French hospitals in 2016 (Agence nationale de sécurité du médicament et des produits de santé, 2017), shaded by their assumed impact on intestinal microbiome dysbiosis. Inset: the cumulative impact of each antibiotic class (given as ATC codes, see Appendix 1—table 8 for corresponding names) on dysbiosis (aj × e-k, see Equation 7); circle size represents each class’s contribution to exposure prevalence (aj). (D) Antibiograms for each pathogen strain and antibiotic class, adapted from the Therapeutics Education Collaboration (McCormack and Lalji, 2015).
Figure 6
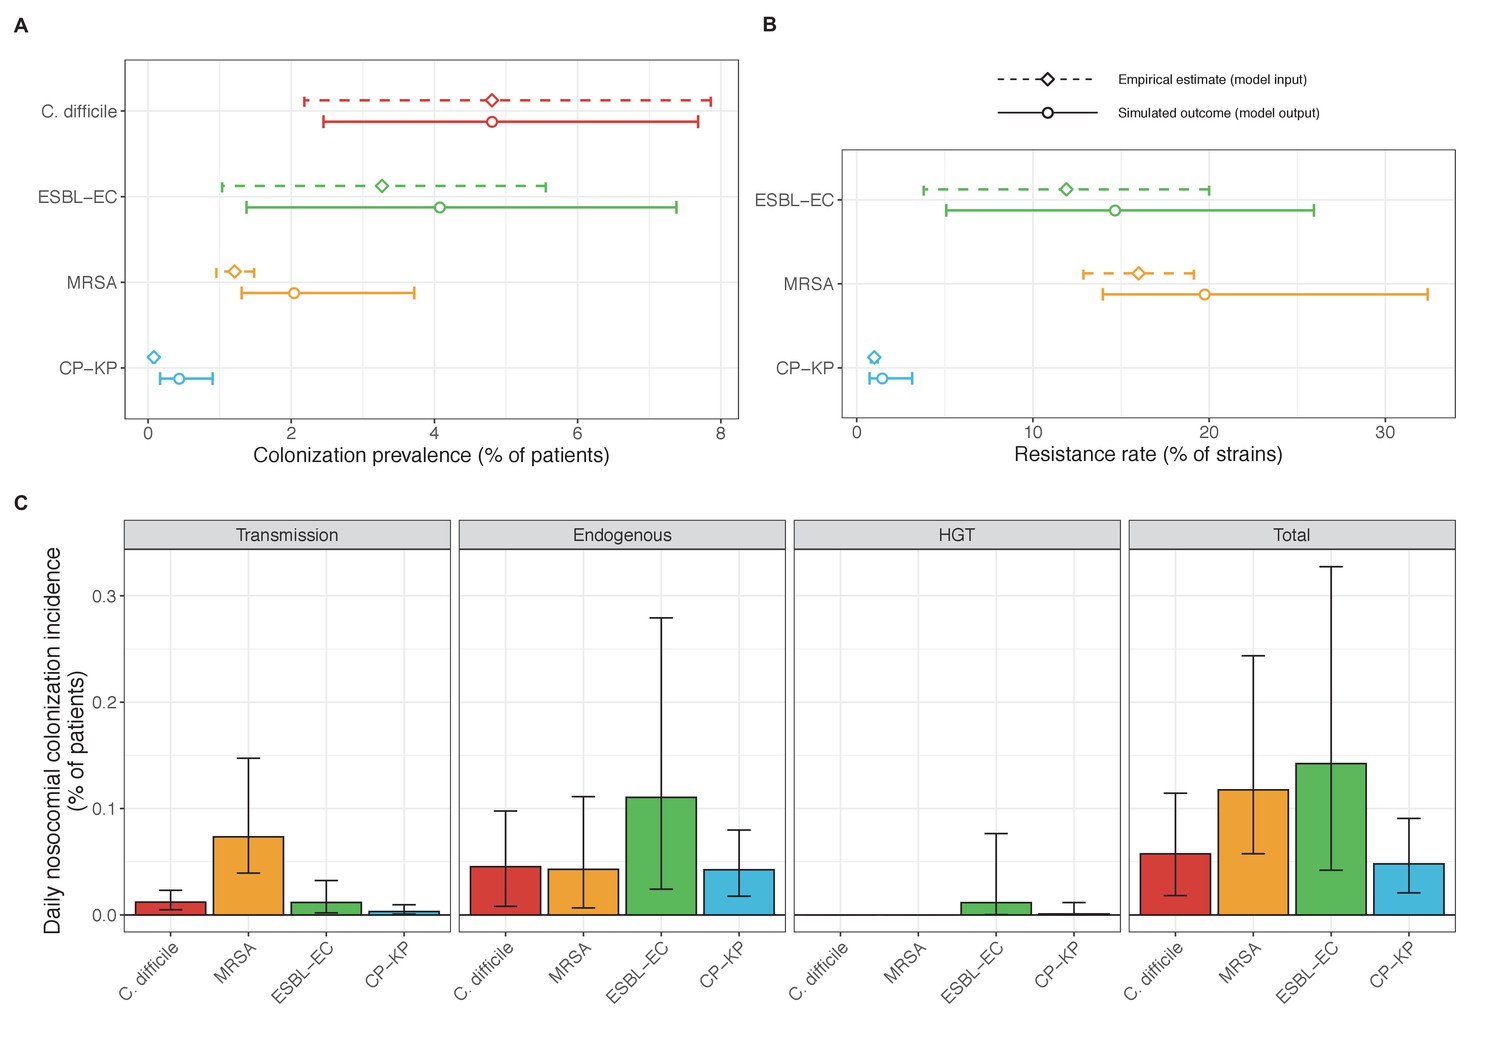
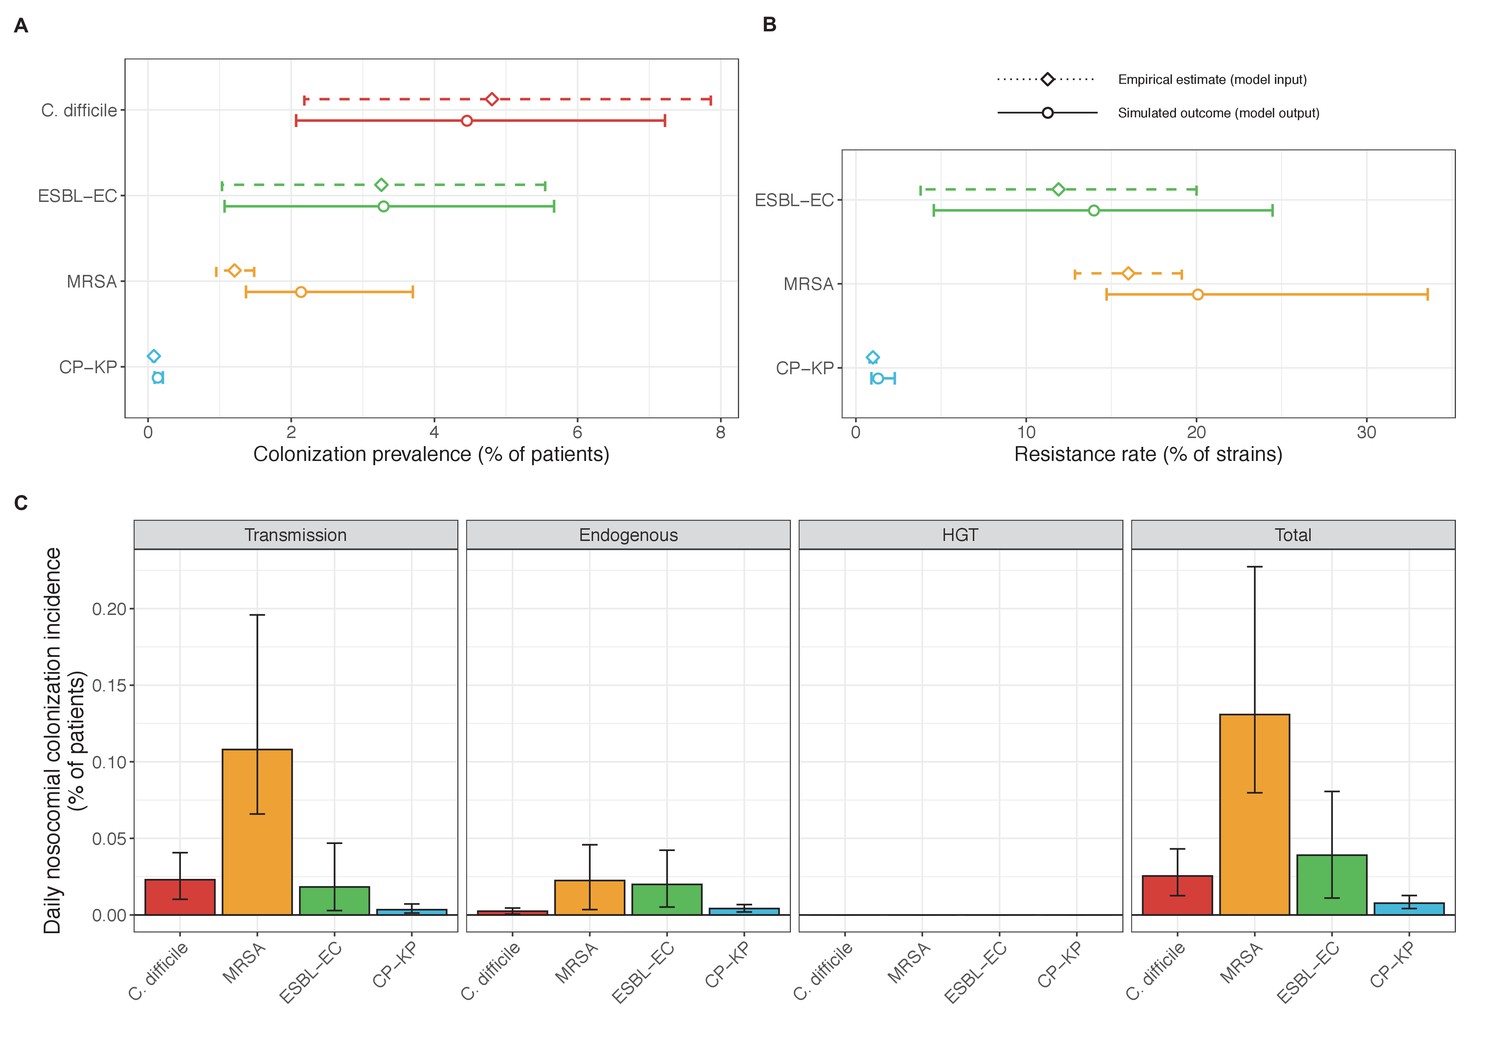
Baseline steady-state pathogen colonization outcomes.
(A) Colonization prevalence, the percentage of patients colonized with the focal strain. Dashed lines (model inputs) represent assumed community prevalence, that is the proportion of patients already colonized upon hospital admission (see Appendix 1—table 3–6). Solid lines represent simulated prevalence within the hospital, as resulting from both importation from the community and within-hospital epidemiology. (B) Resistance rates, the proportion of S. aureus carriers bearing methicillin-resistant strains, E. coli carriers bearing ESBL-producing strains, and K. pneumoniae carriers bearing carbapenemase-producing strains. As in panel A, dashed lines (model inputs) represent assumed community resistance rates, and solid lines represent simulated resistance rates within the hospital. (C) Pathogen incidence (daily rate of within-hospital colonization acquisition), stratified by route of acquisition. Points (in panels A and B) and bar height (panel C) represent medians, and error bars represent 95% uncertainty intervals across 10,000 Monte Carlo simulations. For comparison, the same information for single-species simulations excluding the microbiome is presented in Appendix 1—figure 11.
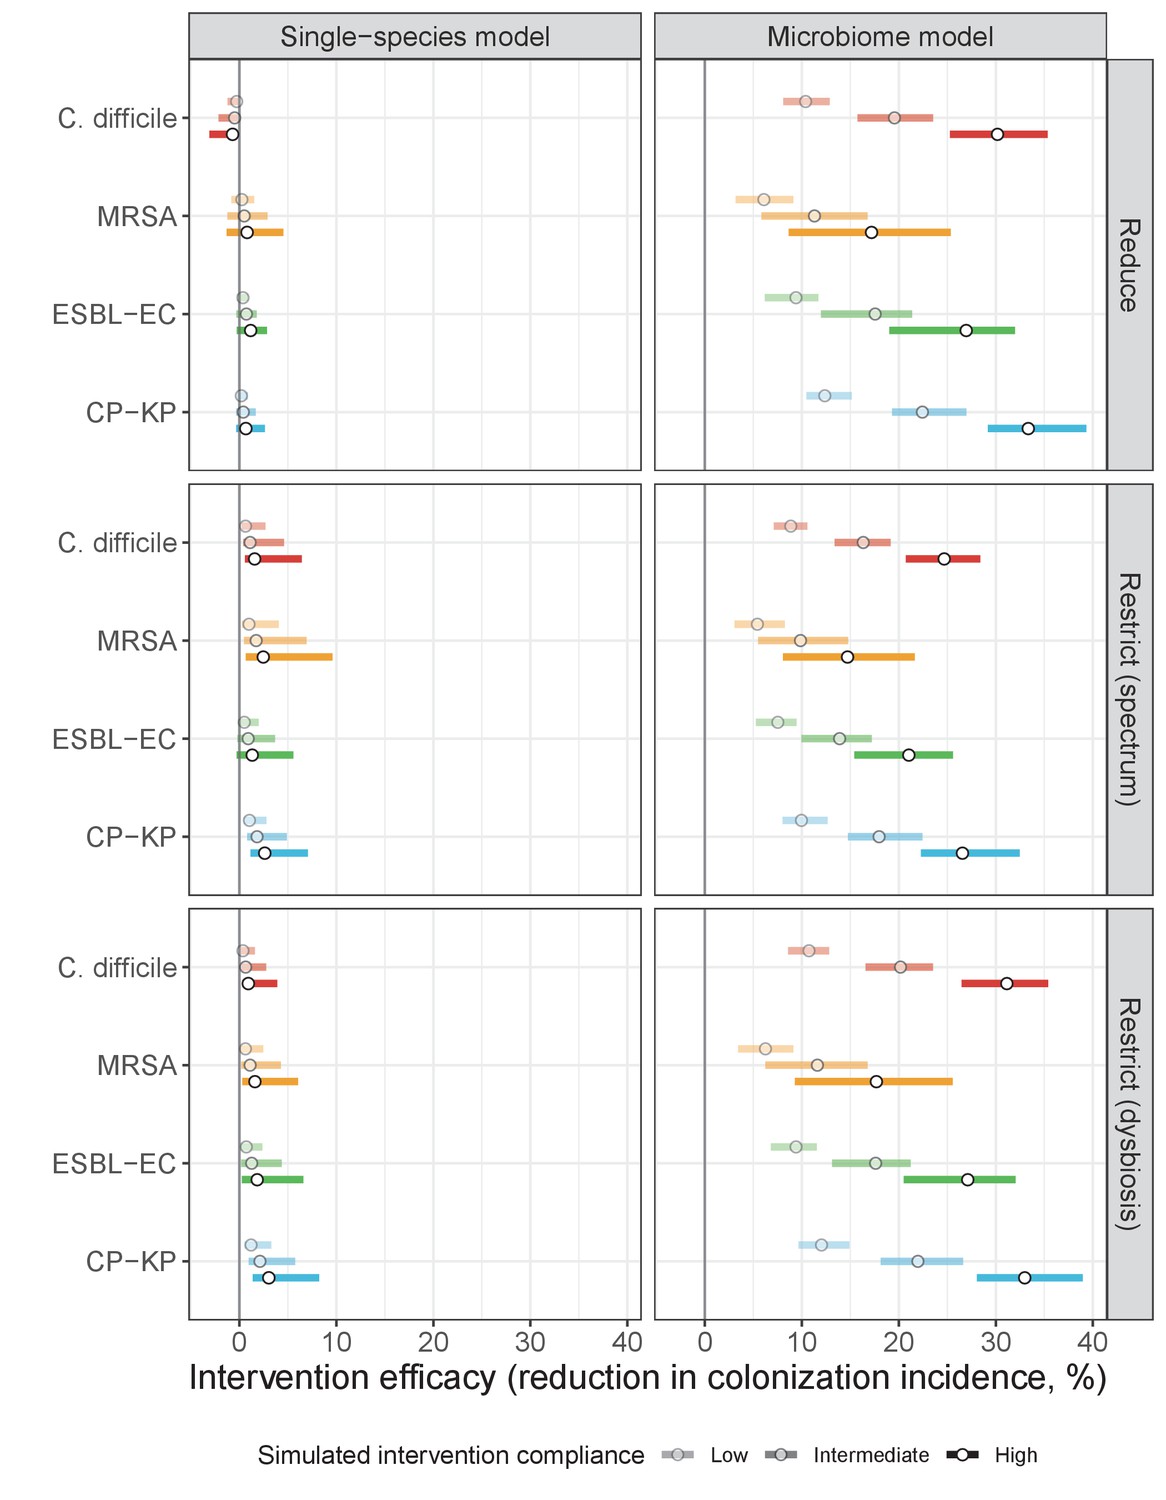
Figure 7
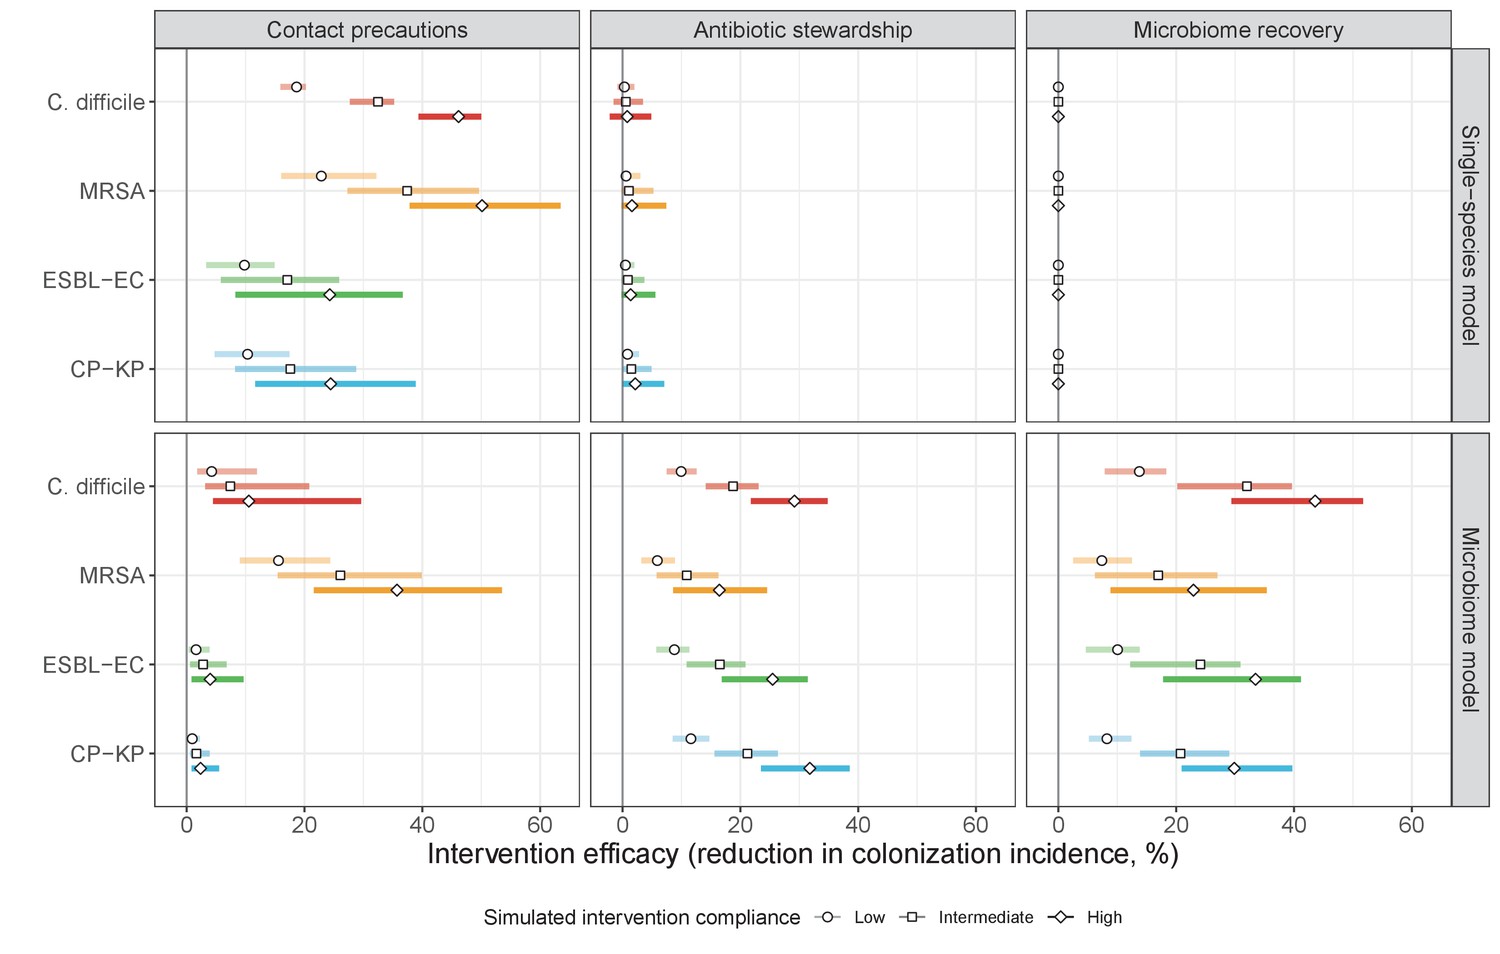
The microbiome drives pathogen-specific responses to simulated public health interventions (left panels, contact precautions; middle, antibiotic stewardship; right, microbiome recovery therapy).
Top panels show results from simulations using classical ‘single-species models’ that only account for the focal pathogen species (including intraspecific strain competition for MRSA, ESBL-EC and CP-KP); bottom panels show simulation results when models also include microbiome-pathogen interactions and antibiotic-induced microbiome dysbiosis. For each intervention, three levels of intervention compliance (shading) are simulated. For antibiotic stewardship, simulation results are pooled across three different types of stewardship (see Appendix 1—figure 17). Points correspond to medians, and bars to 95% uncertainty intervals across 10,000 Monte Carlo simulations.
Appendix 1—figure 1
Antibiotic selection for the epidemiological spread of an antibiotic-resistant bacterial pathogen PR with full resistance to all antibiotics (rR = 1; for the middle panel, rS = 0).
As in Figure 1 in the main text, we compare results from the susceptible-colonized model (left), strain competition model (middle) and microbiome competition model (right). There are no selection trade-offs here because antibiotics have no epidemiological ‘benefit’, i.e. no ability to clear PR. See Appendix 1—table 1 for parameter values.
Appendix 1—figure 2
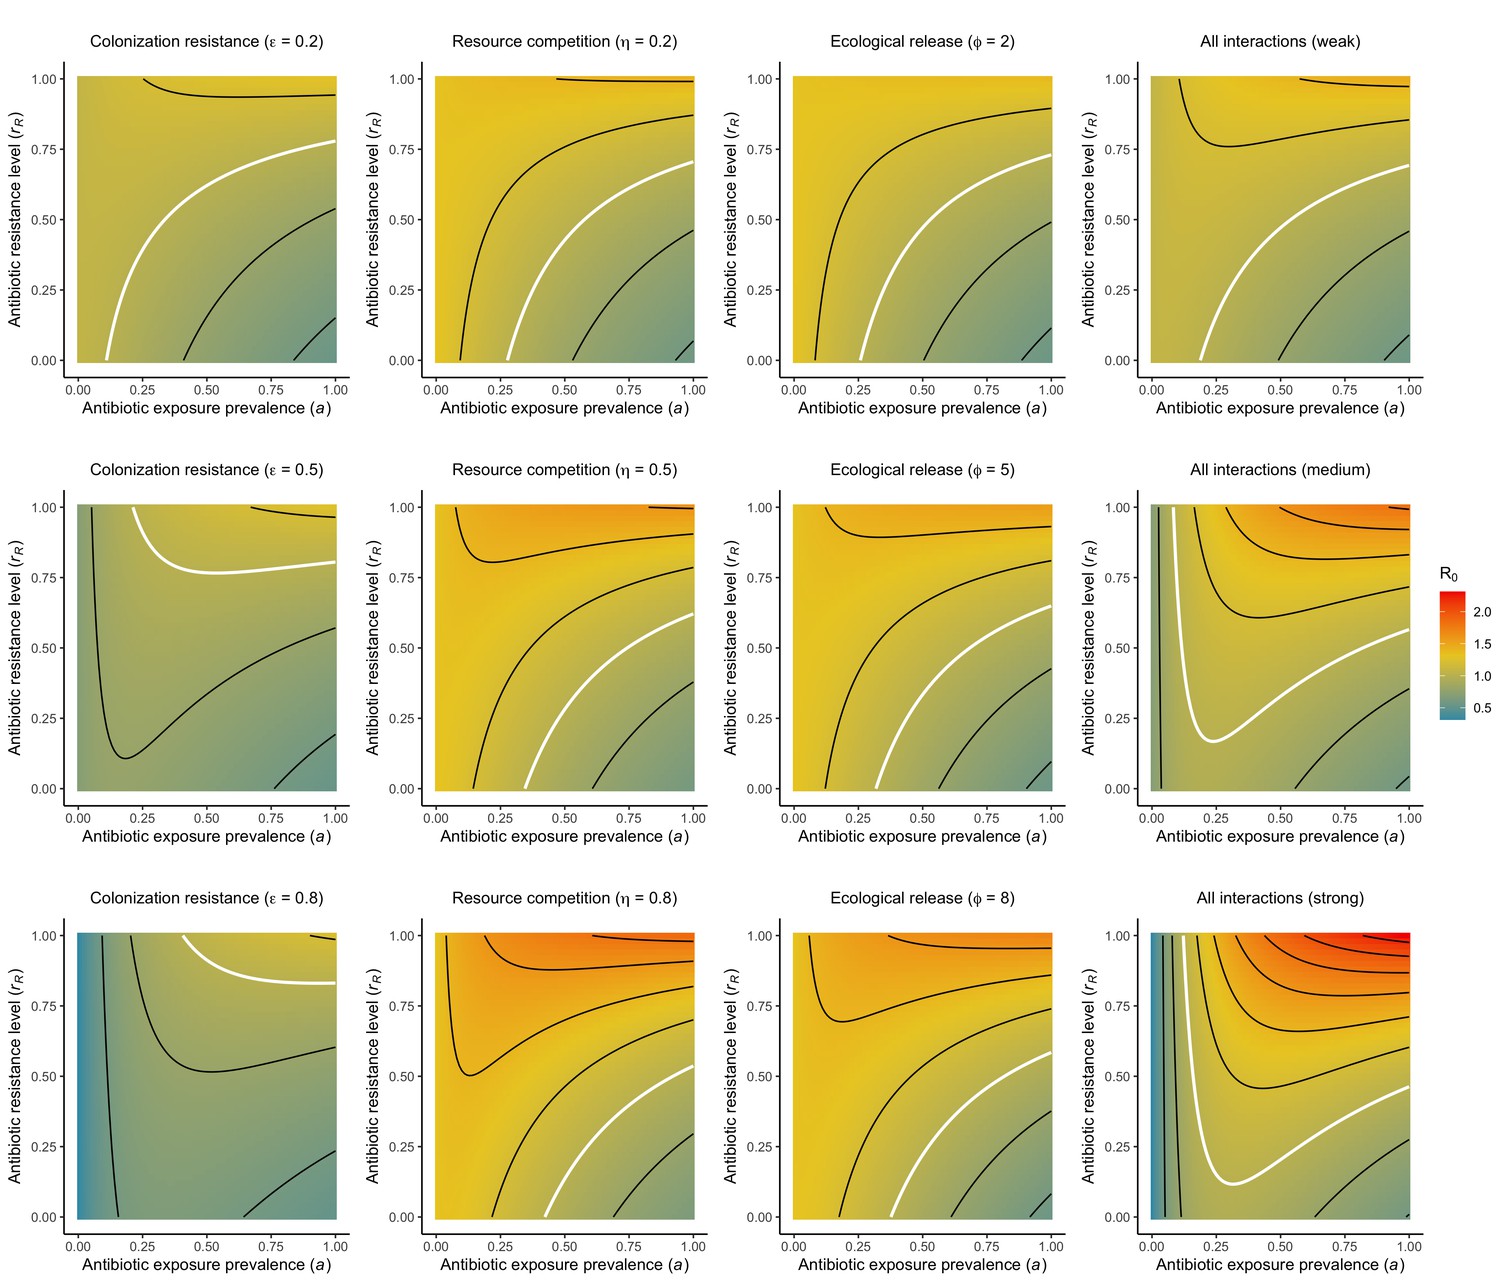
Different microbiome-pathogen interactions of different strengths (figure sub-titles) mediate how antibiotic use (, x-axis) and resistance (rR, y-axis) drive R0 for PR (z-axis, color).
White contour lines indicate R0=1, and each successive black contour line represents an incremental change of 0.2. Microbiome-pathogen interactions are included separately (columns 1, 2, 3) and together (column 4), and their strengths are varied from weak (top row) to medium (middle row) to strong (bottom row) using values from Figure 2 in the main text. See Appendix 1—table 1 for all parameter values.
Appendix 1—figure 3
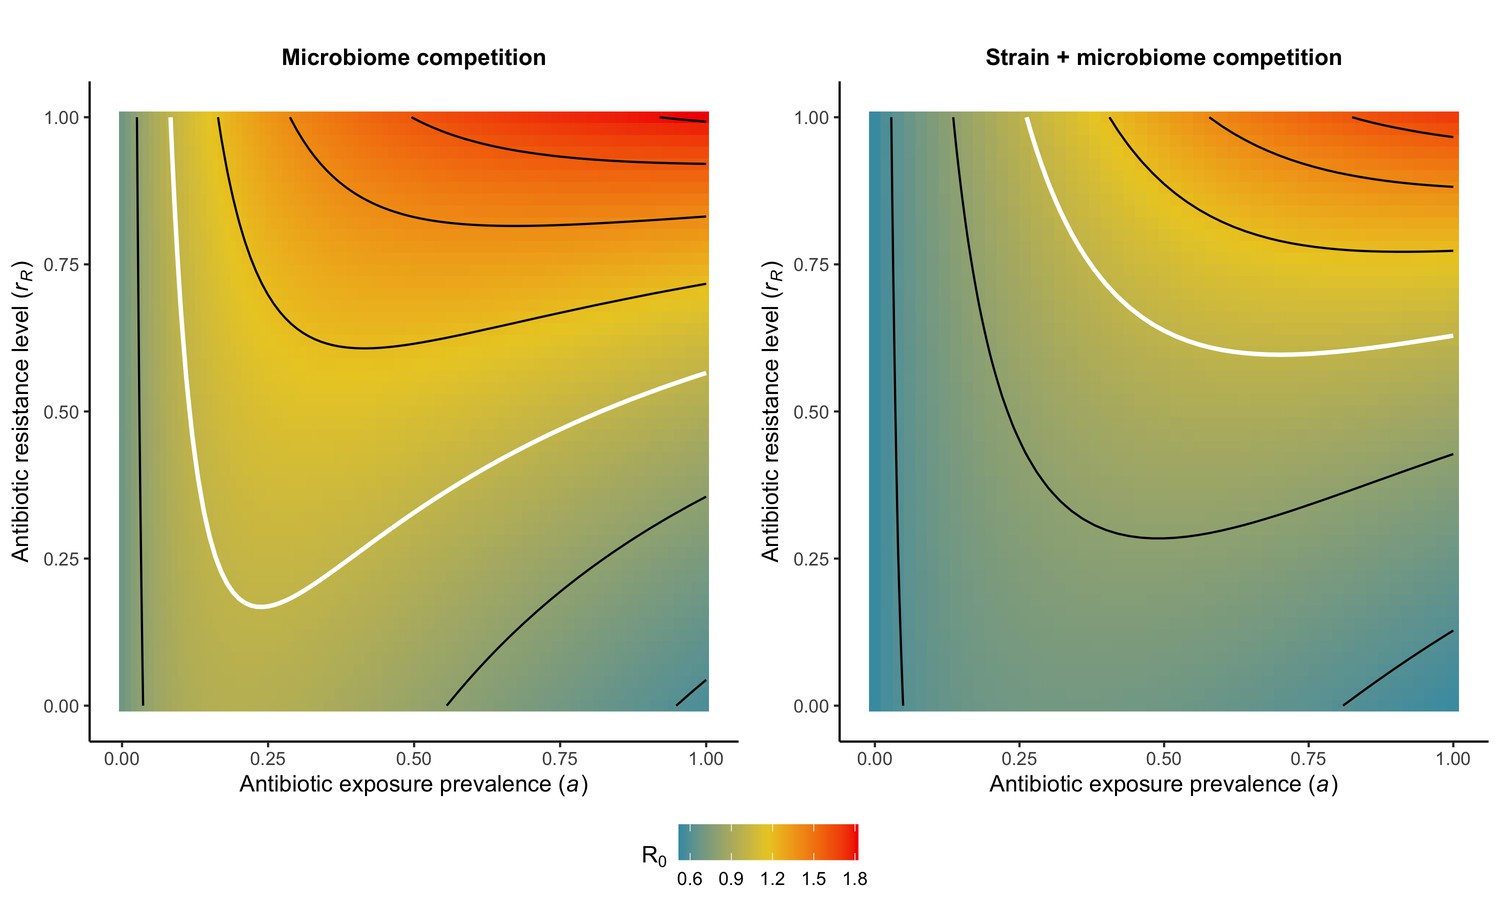
Introducing strain competition to the microbiome competition model reduces R0 for PR.
Over the whole parameter space, the focal strain PR of a two-strain microbiome competition model (right) has a lower R0 than the same pathogen evaluated in the absence of strain competition (left). We assume the competing strain PS is at endemic equilibrium and is completely sensitive to antibiotics (rS=0). White contour lines indicate R0=1, and each successive black contour line represents an incremental change of 0.2. See Appendix 1—table 1 for all parameter values.
Appendix 1—figure 4
Antibiotic selection for the spread of an antibiotic-resistant pathogen strain PR depends on the strength of its interactions with microbiota (rows) and its level of resistance to antibiotics rR (columns).
We assume complete antibiotic sensitivity for PS (rS = 0), and low, medium, and high interactions strengths correspond to values in Figure 2 in the main text, and columns in Appendix 1—figure 2 ({ε = 0.2, η = 0.2, ϕ = 2}, {ε = 0.5, η = 0.5, ϕ = 5} and {ε = 0.8, η = 0.8, ϕ = 8}, respectively). See Appendix 1—table 1 for all parameter values.
Appendix 1—figure 5

Antibiotic prescribing interventions have mixed impacts on PR colonization dynamics, depending on the microbiome interactions in effect (colors) and the epidemiological outcomes measured (top: colonization prevalence; bottom: the resistance rate).
ODEs were integrated numerically for the baseline pathogen PR, introducing successive interventions at 3, 6, and 9 months. Interventions represent changes to parameter values corresponding to presumed changes in antibiotic consumption: for intervention 1, PR’s resistance level rR was halved from 0.8 to 0.4; for intervention 2, the rate of antibiotic-induced microbiome dysbiosis θm was halved from 1 to 0.5; and for intervention 3, the baseline antibiotic exposure prevalence was halved from 0.2 to 0.1. See Appendix 1—table 1 for all parameter values.
Appendix 1—figure 6
Impacts of horizontal gene transfer (HGT) on steady-state daily colonization incidence of PR.
The relative impact of HGT depends on the gene’s rate of transfer (χ, line type), antibiotic exposure prevalence (, x-axis), competitive interactions between pathogen strains and host microbiota (colors: purple=combined strain and microbiome competition; orange=strain competition only), and the level of resistance conferred by the gene (rR, columns). Assumptions match those for Figure 4 in the main text. See Appendix 1—table 1 for all parameter values.
Appendix 1—figure 7

Impacts of HGT on pathogen colonization dynamics are tied to other parameters that mediate the prevalence of competing pathogen strains.
(A) The absolute difference in PR colonization prevalence when including HGT (dashed and dotted lines) compared to prevalence in the absence of HGT (solid horizontal line) depends on assumed values of other parameters (panels) that drive colonization dynamics. For brevity, ω is described as the plasmid acquisition rate, and fω as the plasmid admission fraction. (B) Assuming a higher rate of HGT in patients undergoing dysbiosis (χd) than in patients with stable microbiota (χe) has a modest impact on CR. Here, χe is held constant at χe=0.05, such that changes in the fraction χd/χe result from corresponding increases in χd. (C) Impacts of HGT on total pathogen prevalence (CS + CR) depend on how selectively (dis)advantageous the resistance gene R is for the pathogen bearing it. Here, we show total prevalence (both strains) as proportional to a model assuming the same parameter values but excluding HGT (dashed horizontal line). Colors represent different fitness costs of resistance c, demonstrating that HGT not only changes the relative frequency of competing strains, but can feed forward to alter total prevalence of all strains, tending to increase total prevalence when R has little metabolic cost (low c), but decrease prevalence when R is costly (high c). See Appendix 1—table 1 for all parameter values.
Appendix 1—figure 8

Expert belief about which mechanisms drive epidemiological dynamics of bacterial pathogens.
(A) Expert belief in whether or not intraspecific strain competition influences nosocomial colonization dynamics for each pathogen. (B) Expert belief in whether or not each of the given colonization processes is affected by microbiome dysbiosis, and for HGT, whether or not this process is relevant in clinical settings. CD: Clostridioides difficile; SA: Staphylococcus aureus; EC: Escherichia coli; KP: Klebsiella pneumoniae; HGT: horizontal gene transfer.
Appendix 1—figure 9
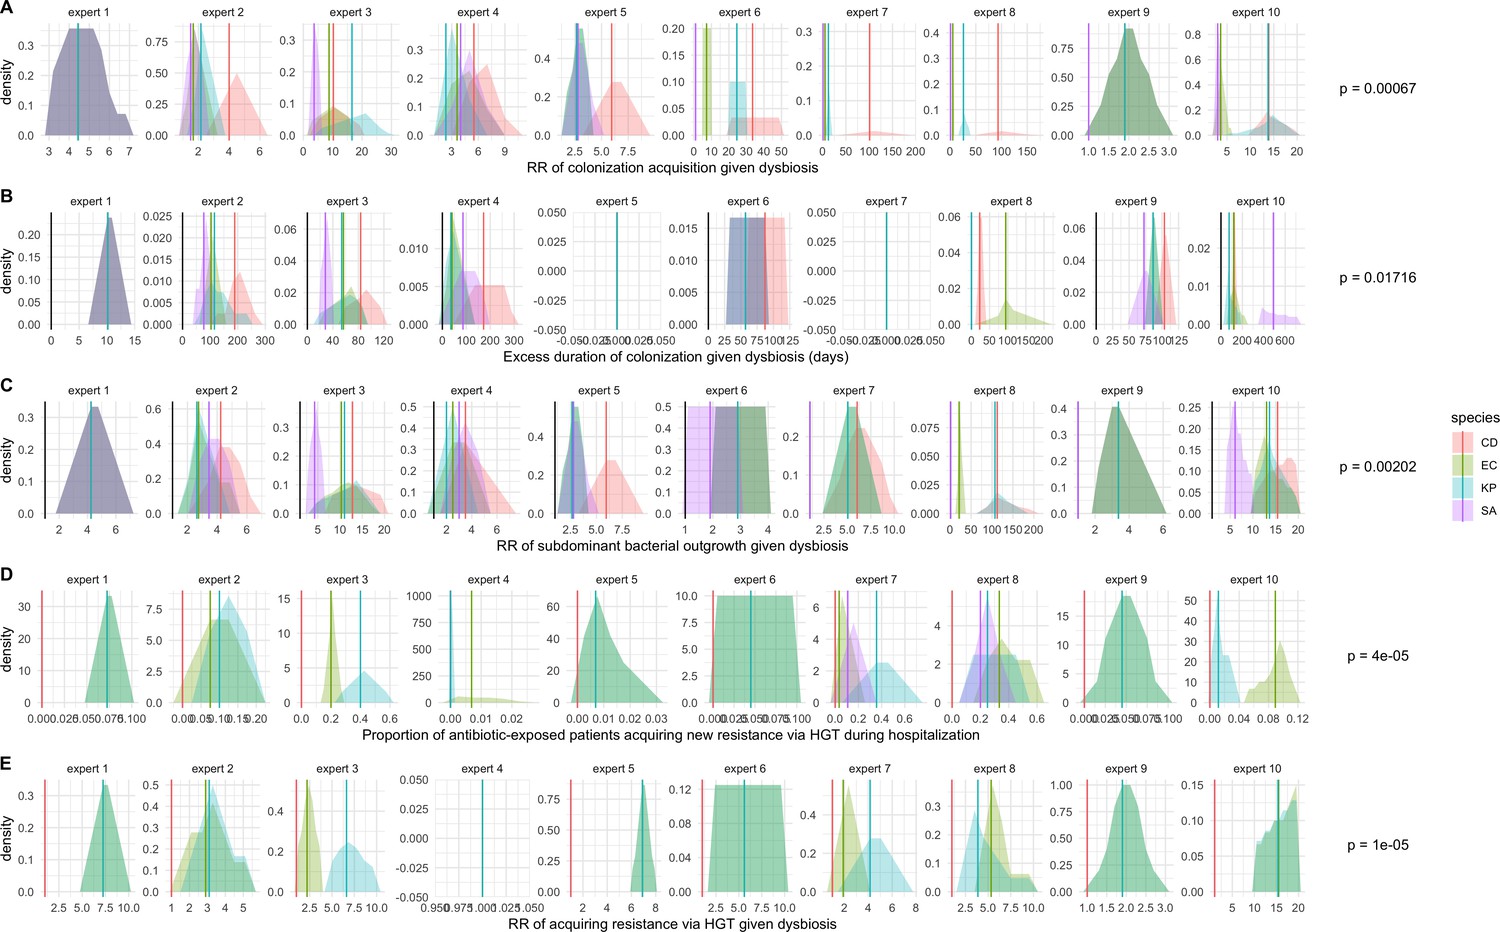
Expert elicitation results (raw data): expert belief and uncertainty about the impact of microbiome dysbiosis on nosocomial colonization dynamics of included bacterial pathogens (colors).
Rows A through E represent, respectively, responses to questions two through six from the expert elicitation (protocol provided separately). Distributions were generated during expert interviews using the MATCH Uncertainty Elicitation Tool with the chips and bins method (Morris et al., 2014) Experts are anonymized and represented by different columns. Vertical bars represent medians of each distribution to visualize the rank order for each pathogen as estimated by each expert. p-values represent results of Friedman’s tests for distribution medians, considering species as groups and experts as blocks for each question; when p<0.05, the species rank order across experts is interpreted as non-random.
Appendix 1—figure 10
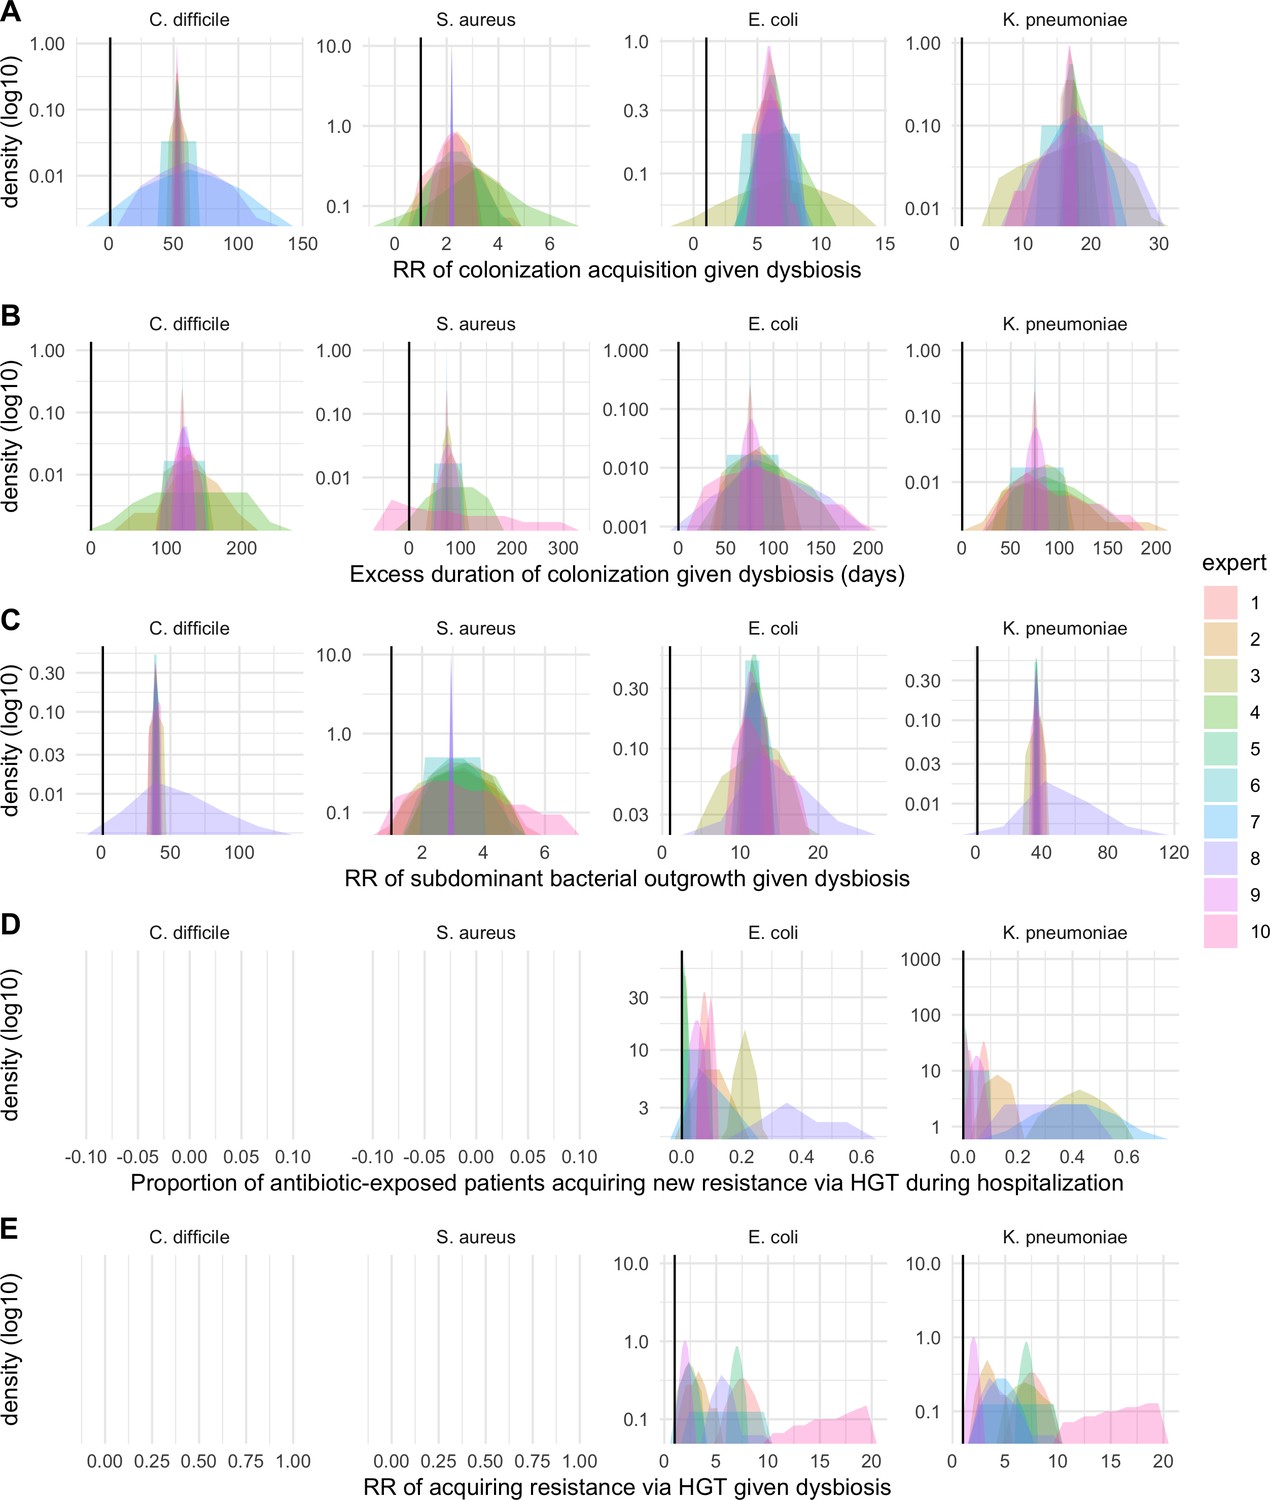
Expert elicitation results (re-centred data): expert belief and uncertainty about the impact of microbiome dysbiosis on nosocomial colonization dynamics of included bacterial pathogens (colors).
Rows A through E represent, respectively, responses to questions two through six from the expert elicitation protocol (provided separately).
Appendix 1—figure 11
Baseline steady-state pathogen colonization outcomes for single-species simulations excluding the microbiome (ε = 0, η = 0, ϕ = 1, χ = 0).
Compared to microbiome simulations (Figure 6 in the main text), pathogens are less prevalent (A), and incidence is more than halved for all ARB except MRSA (C). However, resistance rates are largely unchanged (B). Points (A and B) and bars (C) represent medians, and error bars represent 95% uncertainty intervals across 10,000 Monte Carlo simulations.
Appendix 1—figure 12
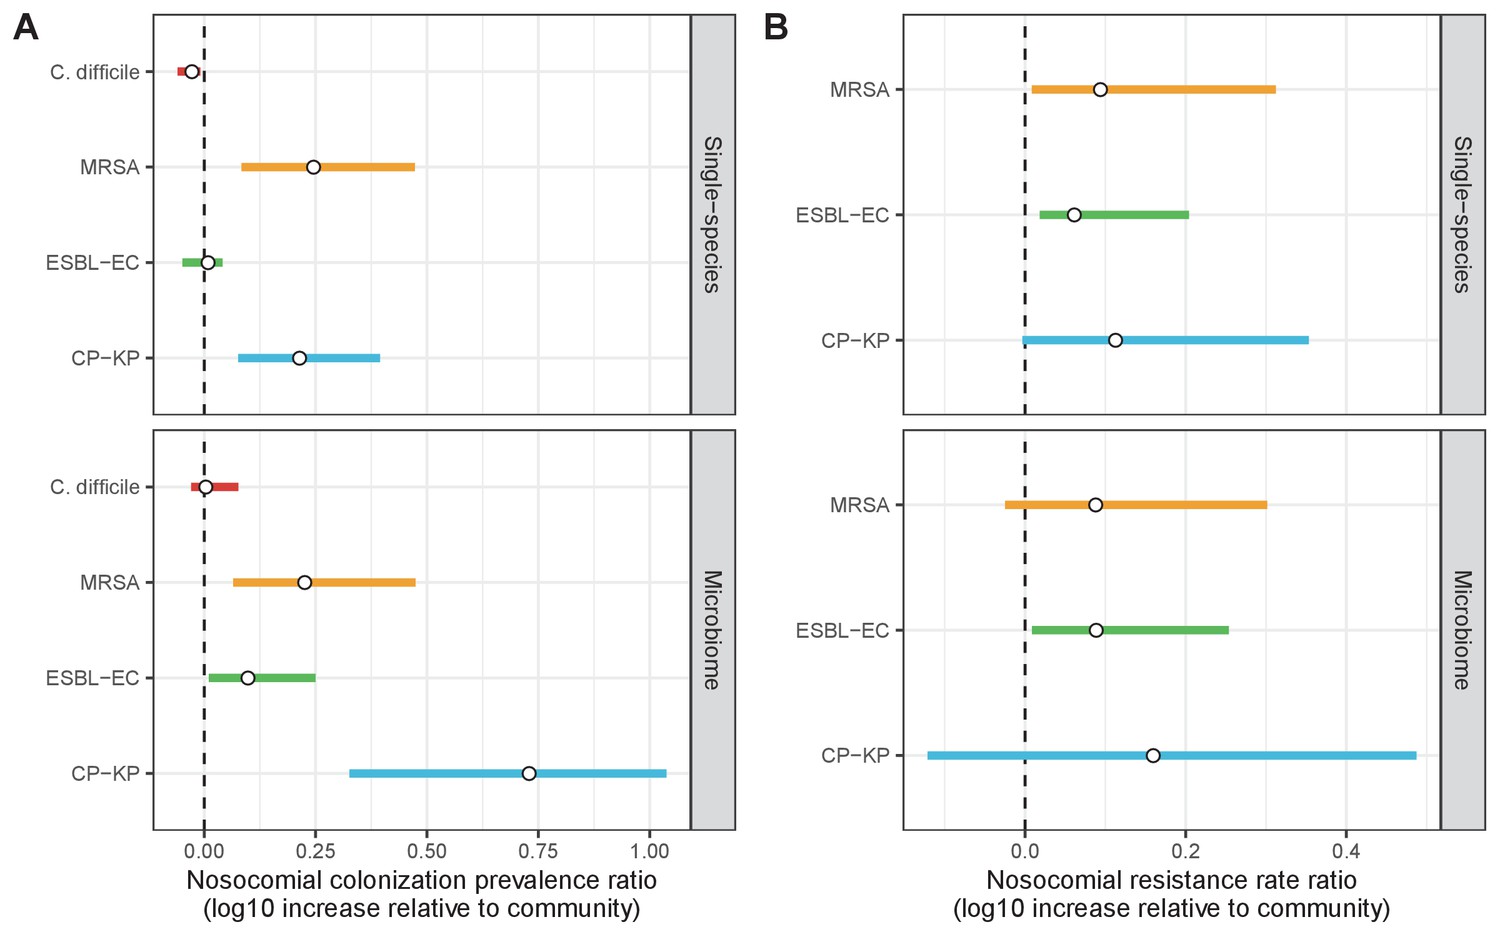
Change in ARB colonization outcomes in the hospital relative to the community (log10 scale), comparing single-species and microbiome simulations.
(A) The ratio of colonization prevalence among hospital patients relative to baseline colonization prevalence in the community. (B) The ratio of resistance rates in the hospital relative to baseline resistance rates in the community. Points represent medians and error bars represent 95% uncertainty intervals across 10,000 Monte Carlo simulations.
Appendix 1—figure 13
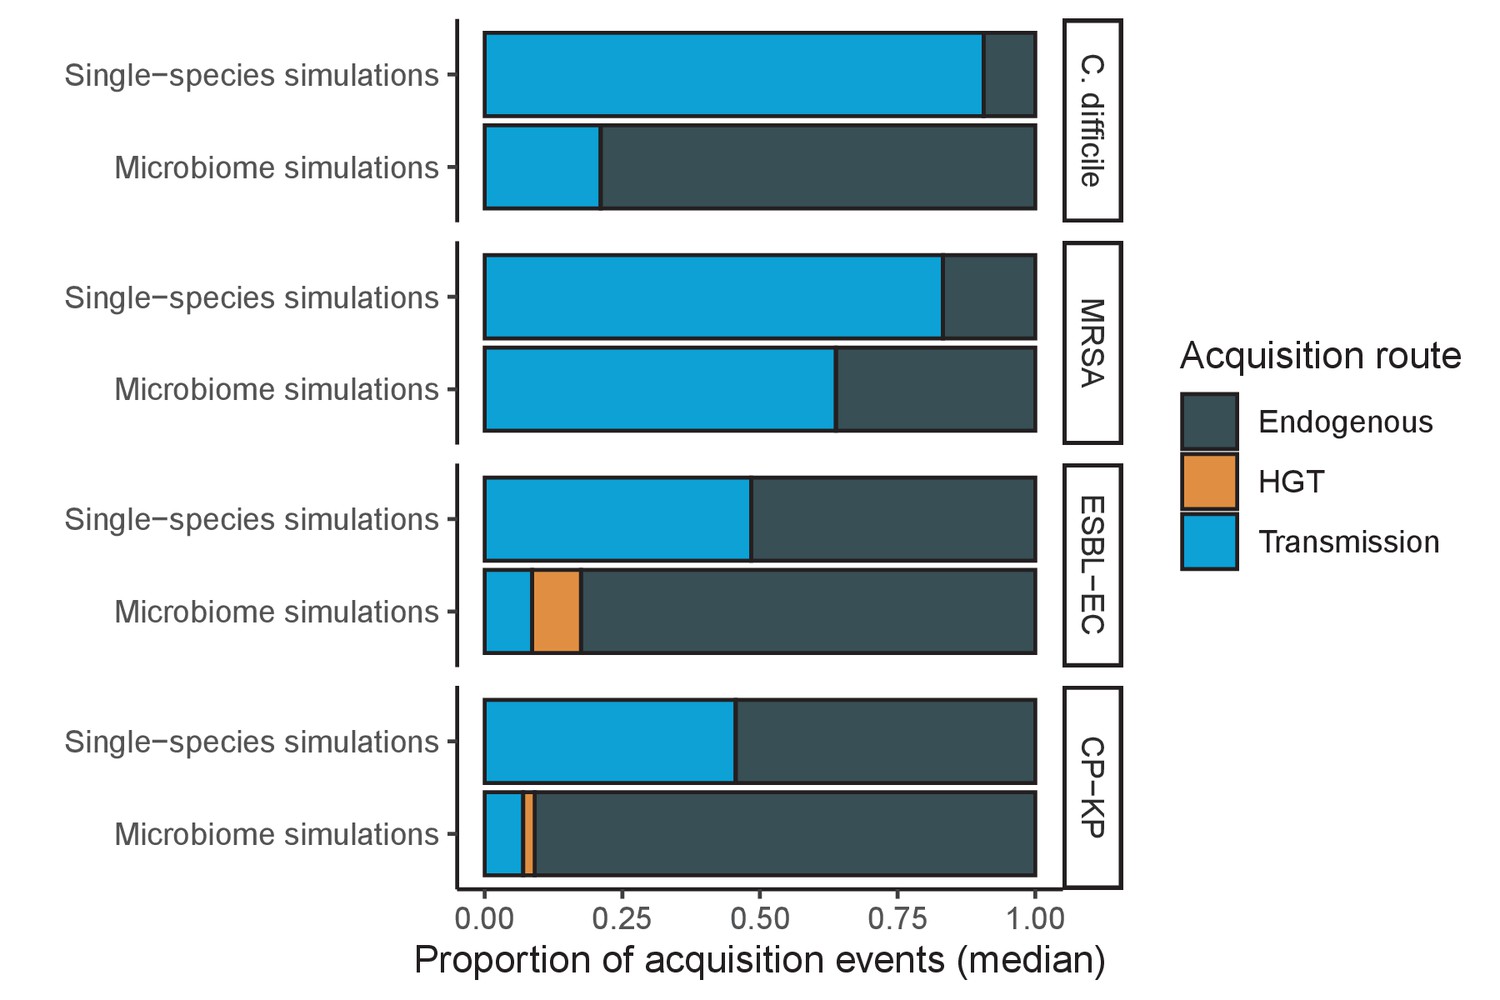
Different ARB spread in different ways, and the importance of different routes depends on potential microbiome interactions.
Each shaded region represents the median estimated proportion of acquisition events explained by each acquisition route over 10,000 Monte Carlo simulations.
Appendix 1—figure 14
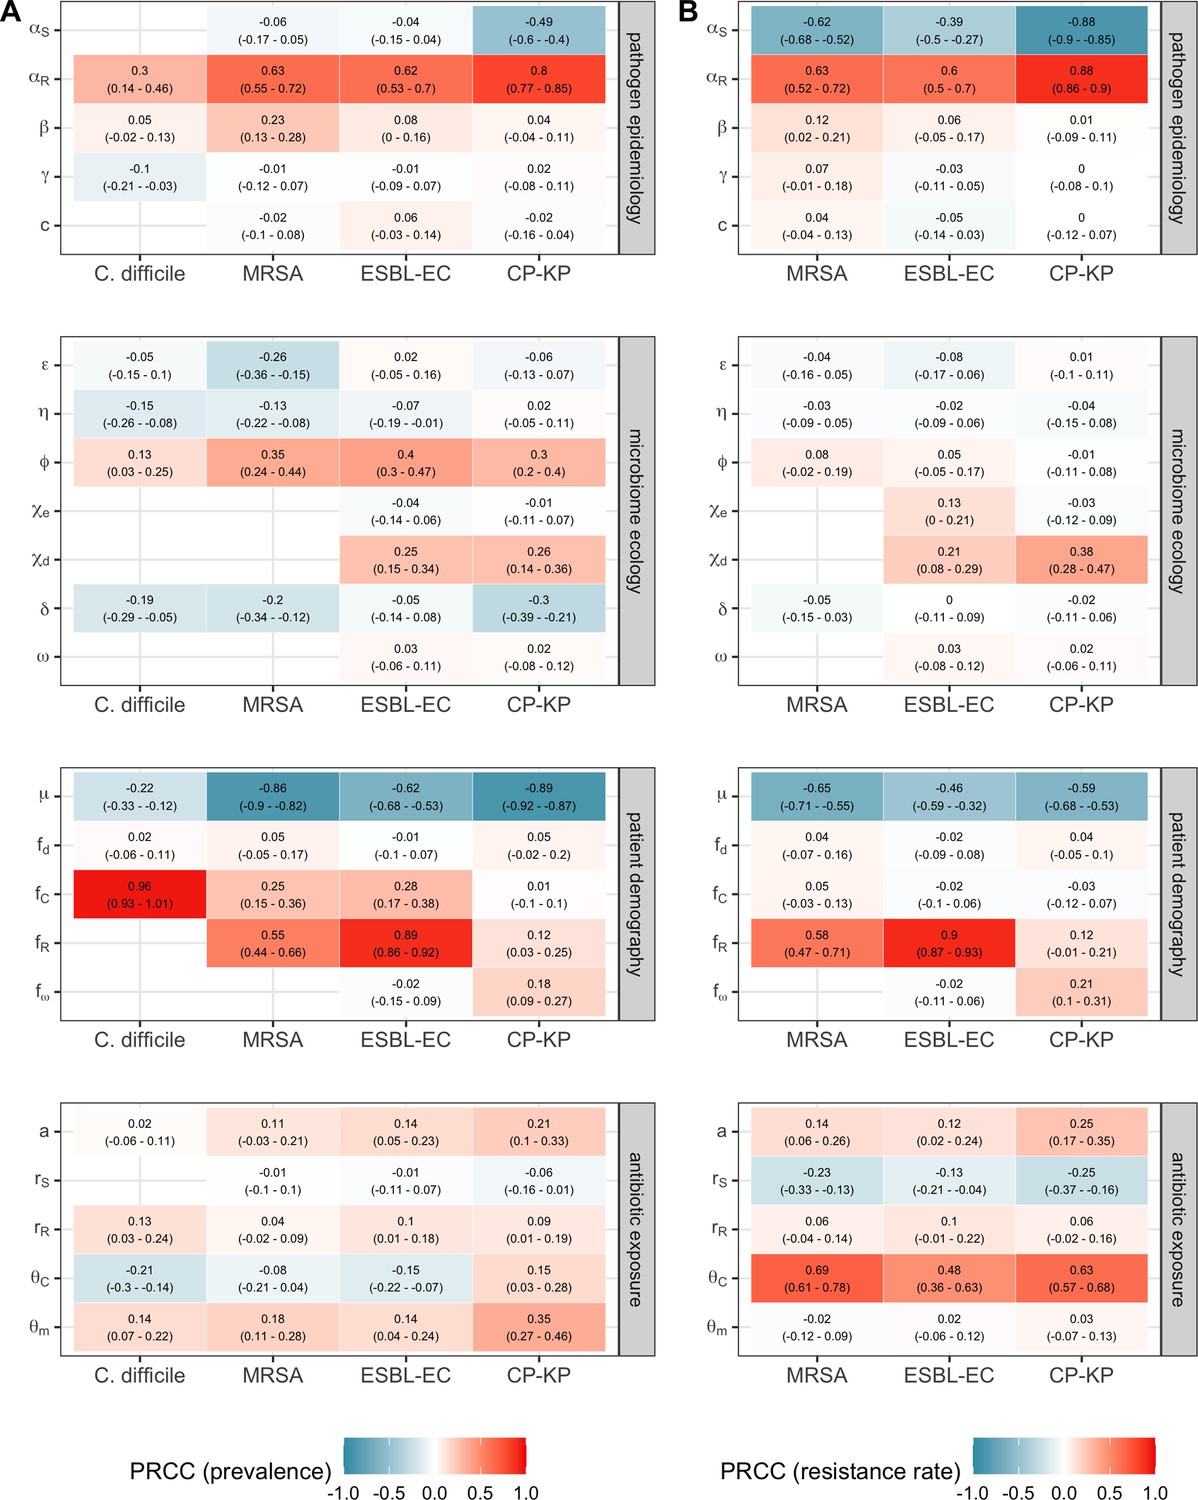
Multivariate sensitivity analysis describing partial rank correlation coefficients (PRCCs) between model parameters and two epidemiological outcomes evaluated at population dynamic equilibrium: in panel A, colonization prevalence of the focal strain PR; in panel B, the pathogen resistance rate.
For all pathogens, prevalence was positively associated with prior colonization upon hospital admission (fC for C. difficile, fR for MRSA, ESBL-EC and CP-KP) and ecological release (ϕ), and negatively associated with a higher rate of discharge and admission, i.e. shorter duration of hospitalisation (μ). Across ARB, higher rates of antibiotic-induced dysbiosis (θm) and microbiome recovery (δ) were generally positively and negatively associated with prevalence, respectively. Conversely, microbiome parameters were minimally associated with resistance rates, with the exception of the HGT rate among patients undergoing dysbiosis (χd).
Appendix 1—figure 15
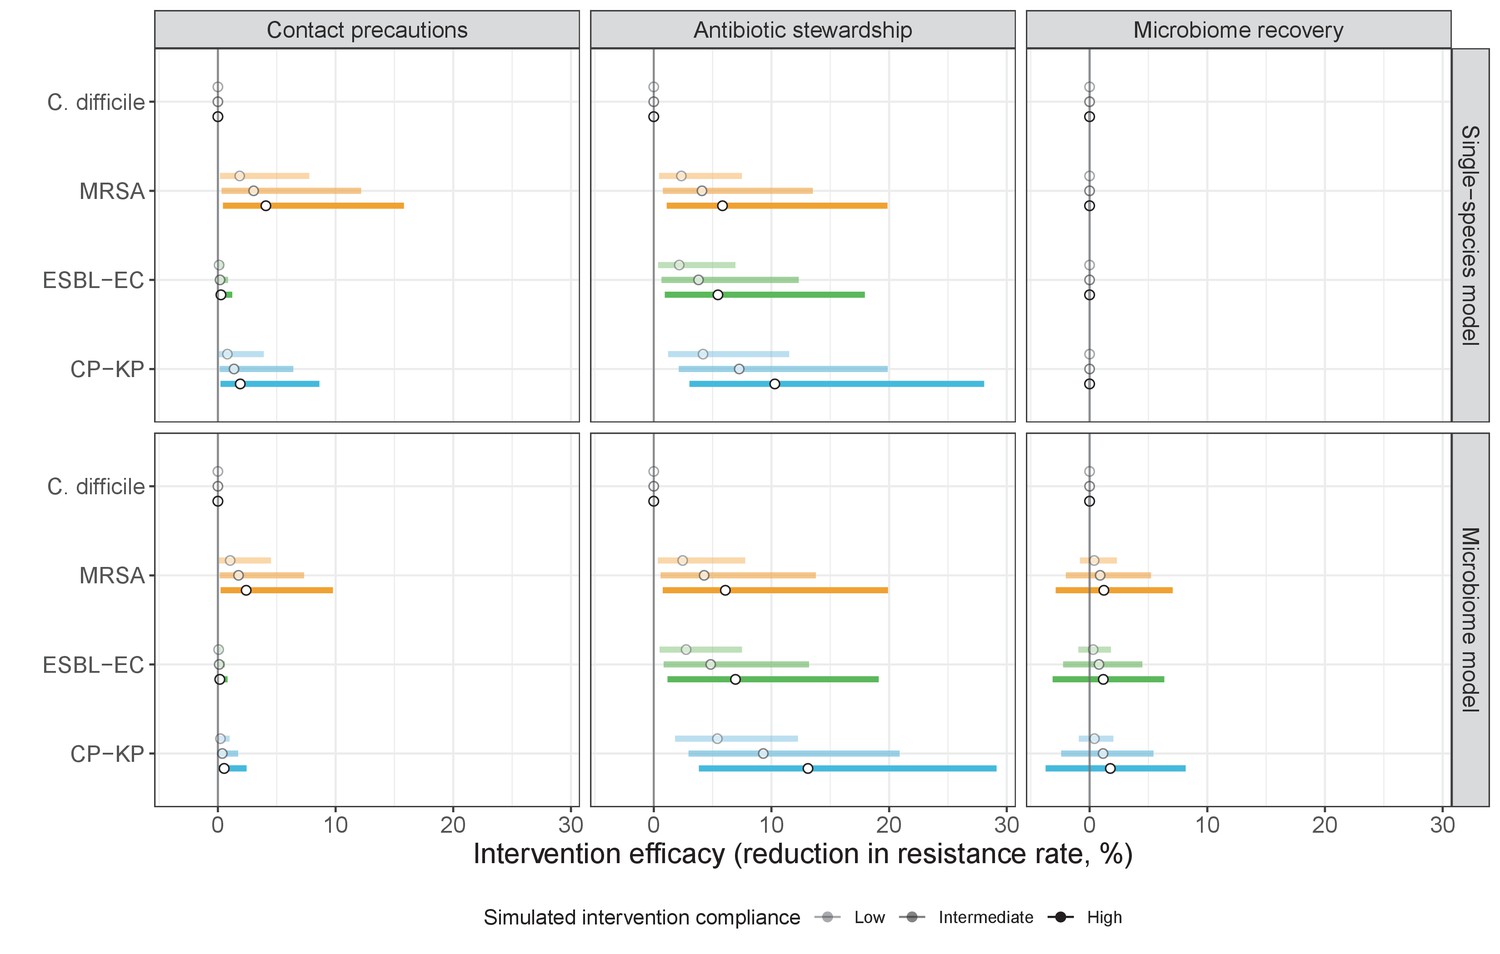
Compared to pathogen incidence (Figure 7), dynamic responses of pathogen resistance rates to public health interventions were similar across single-species and microbiome simulations (left panels, contact precautions; middle, antibiotic stewardship; right, microbiome recovery interventions).
Top panels show results from simulations using ‘single-species models’ that only account for the focal pathogen species (including intraspecific strain competition for MRSA, ESBL-EC and CP-KP); bottom panels show simulation results when models also include microbiome-pathogen interactions and antibiotic-induced microbiome dysbiosis. For each intervention, three levels of intervention compliance (shading) are simulated. Points correspond to medians, and bars to 95% uncertainty intervals across 10,000 Monte Carlo simulations.
Appendix 1—figure 16
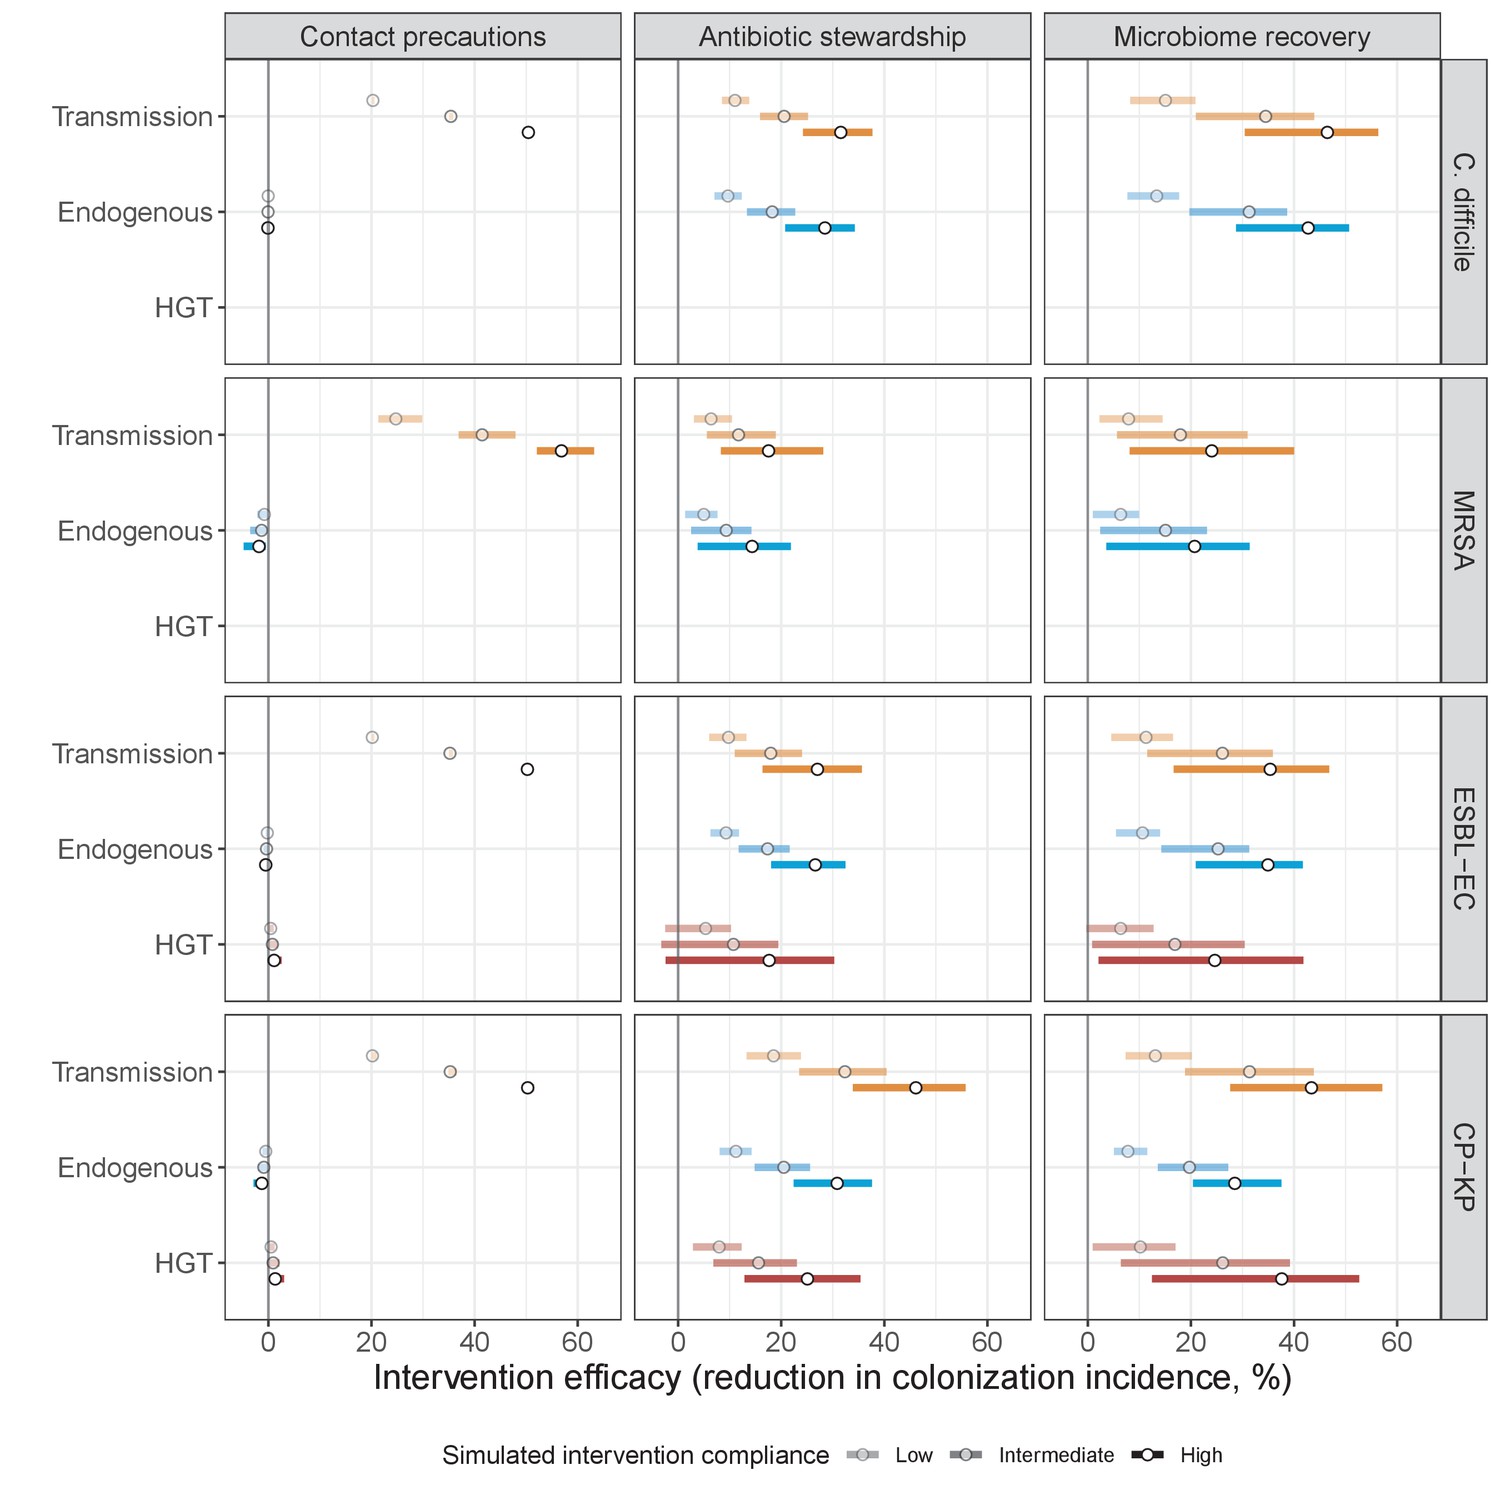
Interventions act on different routes of acquisition.
Intervention efficacy (x-axis) for reducing colonization incidence via different routes of colonization acquisition (colors) for different interventions (columns) and ARB (rows). Unlike contact precautions, which only reduced incidence via transmission, antibiotic stewardship and microbiome recovery interventions reduced colonization incidence through all considered routes. Points correspond to medians, and bars to 95% uncertainty intervals across 10,000 Monte Carlo simulations.
Appendix 1—figure 17
Intervention efficacy for three considered types of antibiotic stewardship: (i) reducing overall antibiotic prescribing, (ii) restricting broad-spectrum antibiotics in favour of narrow-spectrum antibiotics, and (iii) restricting antibiotics categorized as inducing microbiome dysbiosis at high or very high rates in favour of those that induce dysbiosis at medium or low rates.
In microbiome simulations, restricting antibiotics that induce dysbiosis at a high rate was approximately as effective as reducing overall antibiotic prescribing. In single-species simulations, all stewardship interventions were of limited to negligible efficacy. Points correspond to medians, and bars to 95% uncertainty intervals across 10,000 Monte Carlo simulations.
Appendix 1—figure 18
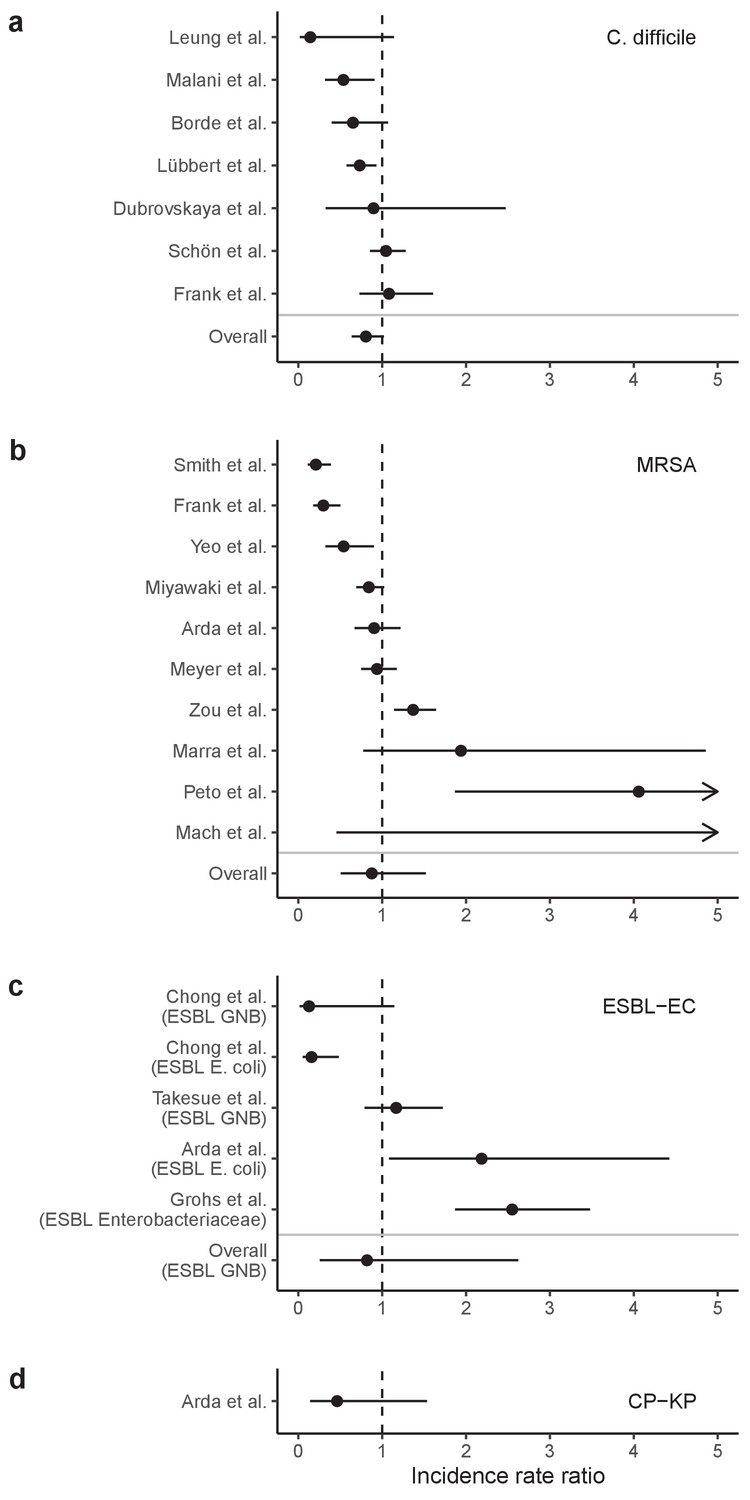
Incidence rate ratios (IRRs) for ARB colonization and infection among hospital inpatients exposed to antibiotic stewardship interventions.
IRRs were calculated using data presented in Baur et al., 2017 Results are stratified by four pathogens: (a) C. difficile, (b) methicillin-resistant S. aureus, (c) ESBL-producing E. coli (and here also including ESBL-producing Enterobacteriaceae or Gram-negative bacteria), and (d) carbapenemase-producing K. pneumoniae. Points represent means and bars represent 95% confidence intervals.
Tables
Appendix 1—table 1
Parameter values and ranges for the generic pathogen PR evaluated over five different colonization models (Figures 1, 3 and 4, and Appendix 1—figures 1–7).
For endogenous acquisition and microbiome recovery, rates presented are assumed rates in untreated hosts, represented by the’ (prime) symbol. Model 1: susceptible-colonized model; Model 2: strain competition model; Model 3: microbiome competition model; Model 4: microbiome-strain competition model; Model 5: microbiome-strain competition model with HGT.
| Symbol | Parameter | Unit | Value {Range} | Model | ||||
|---|---|---|---|---|---|---|---|---|
| 1 | 2 | 3 | 4 | 5 | ||||
| Pathogen colonization | ||||||||
| β | Transmission rate | day−1 | 0.2 | X | X | X | X | X |
| α’ | Endogenous acquisition rate | day−1 | 0.01 | X | X | X | X | X |
| γ | natural clearance rate | day−1 | 0.03 | X | X | X | X | X |
| c | Fitness cost of resistance | / | 1 | X | X | X | X | X |
| Patient demography | ||||||||
| μ | Admission / discharge rate | day−1 | 0.1 | X | X | X | X | X |
| fC | Admission fraction (colonized) | / | 0.1 | X | X | X | X | X |
| fR | Admission fraction (bearing resistant strain) | / | 0.5 | X | X | X | X | X |
| fd | Admission fraction (dysbiosis) | / | 0 | X | X | X | ||
| fω | Admission fraction (microbiota bearing resistance gene) | / | 0 | X | ||||
| Antibiotics | ||||||||
| Antibiotic exposure prevalence | / | 0.2 {0–1} | X | X | X | X | X | |
| rR | Antibiotic resistance level (PR) | / | 0.8 {0–1} | X | X | X | X | X |
| rS | Antibiotic resistance level (PS) | / | 0 | X | X | X | ||
| θc | Antibiotic-induced pathogen clearance rate | day−1 | 0.2 | X | X | X | X | X |
| θm | Antibiotic-induced microbiome dysbiosis rate | day−1 | 1 | X | X | X | ||
| Microbiome ecology | ||||||||
| ε | Colonization resistance | / | 0.5 {0.2–0.8} | X | X | X | ||
| η | Resource competition | / | 0.5 {0.2–0.8} | X | X | X | ||
| ϕ | Ecological release | / | 5 {2–8} | X | X | X | ||
| χe | HGT rate (equilibrium) | day−1 | {0, 0.01, 0.1} | X | ||||
| χd | HGT rate (dysbiosis) | day−1 | χe × 10 | X | ||||
| δ’ | Microbiome recovery rate | day−1 | 0.143 | X | X | X | ||
| ω | Proportion of patients acquiring the resistance gene among microbiota following antibiotic exposure | / | 0.01 | X | ||||
Appendix 1—table 2
Parameters and probability distributions for baseline hospital and host parameters applied across all ARB.
| Symbol | Parameter | Unit | Distribution | Reference | Reference setting | Notes |
|---|---|---|---|---|---|---|
| μ | Admission / discharge rate | day−1 | 1 / Normal (8, 2.55) | Touat et al., 2019 | French hospitals | / |
| fd | Admission fraction (dysbiosis) | / | Normal (0.0756, 0.0190) | Bernier et al., 2014 | French community | Taken as proportion of the French community exposed to antibiotics in previous 28 days, extrapolating weekly reimbursed antibiotic prescriptions/1000 inhabitants (18.9, 9.6–28.3) to 4 weeks and assuming independent prescriptions = 75.6 (38.4–113.2) prescriptions/1000 inhabitants |
| Antibiotic exposure prevalence | / | Normal (0.195, 0.0195) | Alfandari et al., 2015 | 314 French hospitals | / | |
| ri,j | Antibiotic resistance level | / | if sensitive, 0; if resistant, 1; if intermediate sensitivity, ri,j ~ Uniform (0,1) | For all strains i, the resistance level to each antibiotic class j depends on whether the strain is classified as sensitive, resistant, or of intermediate sensitivity in its assumed antibiogram | ||
| θc | Antibiotic-induced pathogen clearance rate | day−1 | 1 / Uniform (1, 10) | Tepekule et al., 2017 | Simulation study | / |
| θm | Antibiotic-induced microbiome dysbiosis rate | day−1 | 1 / Normal (2, 0.4) | Bhalodi et al., 2019 | Mixed | Circumstantial evidence of same-day microbiome disruption following antibiotic therapy; assumed an average minimum 12 hr to disruption |
| δ’ | Microbiome recovery rate | day−1 | 1 / Normal (28, 10.71) | Burdet et al., 2019; Rafii et al., 2008 | Mixed; French hospital | Across studies in a review of antibiotic-induced microbiome disruption, intestinal microflora were observed to ‘return to normal’ 1–49 days after antibiotic cessation; in a French hospital, two measures of microbiome diversity were observed to ‘return to normal’ after 16–21 days. |
Appendix 1—table 3
Parameters and probability distributions for C. difficile.
| Symbol | Parameter | Unit | Distribution | Reference | Reference setting | Notes |
|---|---|---|---|---|---|---|
| β | Transmission rate | day−1 | Normal (0.00555, 0.000944) | van Kleef et al., 2016 | English hospitals (modeling study) | Mean of point estimates of the daily probability of transmission from colonized patients (0.0037) and infected patients (0.0074) |
| α’ | Endogenous acquisition rate | day−1 | Normal (0.0000253, 0.0000114) | Durham et al., 2016 | USA hospitals (modeling study) | Proxy measure: the estimated daily rate of progression from colonization to infection in hospital patients, divided by the relative risk of progression in patients exposed to antibiotics |
| γ | Natural clearance rate | day−1 | Normal (0.0119, 0.00170) | Simor et al., 1993 | Canadian care home | Fit longitudinal colonization data using exponential decay model |
| fC | Admission fraction (colonized) | / | Binomial (229, 0.048) / 229 | Barbut, 1996 | 11 French hospitals | Stool prevalence among asymptomatic patients |
| r | Antibiotic resistance level | / | median 94.3%, (range 93.3–95.4%) | estimated | / | Cumulative resistance level across simulated antibiotic consumption data and assumed antibiograms |
| ε | Colonization resistance | / | 1–1 / Cauchy (52.85, 1.62) | estimated | / | From expert opinion |
| η | Resource competition | / | (1/γ)/(1/γ + Cauchy (121.11, 4.85)) | estimated | / | From expert opinion |
| ϕ | Ecological release | / | Cauchy (39.22 0.922) | estimated | / | From expert opinion |
Appendix 1—table 4
Parameters and probability distributions for S. aureus.
| Symbol | Parameter | Unit | Distribution | Reference | Reference setting | Notes |
|---|---|---|---|---|---|---|
| β | Transmission rate | day−1 | Normal (0.057, 0.0057) | Di Ruscio et al., 2019 | Norwegian hospitals (modeling study) | / |
| α’ | Endogenous acquisition rate | day−1 | Normal (0.0016, 0.0008) | Coello et al., 1997; Di Ruscio et al., 2019 | Spanish hospital | Proxy measure: the estimated daily rate of progression from colonization to infection in hospital patients |
| γ | Natural clearance rate | day−1 | 1 / Normal (287, 17.9) | Shenoy et al., 2014 | Mixed | / |
| c | Fitness cost of resistance | / | Normal (0.2, 0.02) | Kouyos et al., 2013; Laurent et al., 2001 | French hospitals | Growth cultures showed 20% fitness benefit to MSSA over MRSA strains |
| fC | Admission fraction (colonized) | / | Normal (0.0757, 0.00364) | Cravo Oliveira Hashiguchi et al., 2019; Scanvic et al., 2001 | French hospitals | Estimated as the proportion of patients arriving to a French hospital with MRSA colonization, divided by the estimated proportion of S. aureus strains that are methicillin-resistant in France |
| fR | Admission fraction (bearing resistant strain) | / | Normal (0.16, 0.016) | Cravo Oliveira Hashiguchi et al., 2019 | France | / |
| rS | Antibiotic resistance level (MSSA) | / | median 33.1% (range 17.2–48.9%) | estimated | / | Cumulative resistance level across simulated antibiotic consumption data and assumed antibiograms |
| rR | Antibiotic resistance level (MRSA) | / | median 94.5% (range 90.8–98.2%) | estimated | / | Cumulative resistance level across simulated antibiotic consumption data and assumed antibiograms |
| ε | Colonization resistance | / | 1–1 / Cauchy (2.21, 0.15) | estimated | / | From expert opinion |
| η | Resource competition | / | (1/γ) / (1/γ + Cauchy (73.09, 3.09)) | estimated | / | From expert opinion |
| ϕ | Ecological release | / | Cauchy (2.97, 0.28) | estimated | / | From expert opinion |
Appendix 1—table 5
Parameters and probability distributions for E. coli.
| Symbol | Parameter | Unit | Distribution | Reference | Reference setting | Notes |
|---|---|---|---|---|---|---|
| β | Transmission rate | day−1 | Normal (0.0078, 0.00334) | Gurieva et al., 2018 | 13 European ICUs | / |
| α’ | Endogenous acquisition rate | day−1 | Normal (0.0024, 0.000663) | Gurieva et al., 2018 | 13 European ICUs | / |
| γ | Natural clearance rate | day−1 | Normal (0.00269, 0.000216) | Bar-Yoseph et al., 2016 | Mixed | Fit longitudinal colonization data using exponential decay model |
| c | Fitness cost of resistance | / | Normal (0.2, 0.02) | / | / | In absence of data for ESBL resistance, used same distribution as for MRSA |
| fC | Admission fraction (colonized) | / | Normal (0.275, 0.0140) | Ebrahimi et al., 2016; Gurieva et al., 2018 | Mixed | Estimated as the proportion of patients arriving to 13 European ICUs with ESBL-EC carriage, divided by the estimated proportion of E. coli that are ESBL-producing in a Hungarian hospital |
| fR | Admission fraction (bearing resistant strain) | / | Normal (0.119, 0.0413) | Ebrahimi et al., 2016 | Hungarian hospital | Proportion of fecal E. coli that were ESBL-producing from a non-outbreak setting |
| fω | Admission fraction (microbiota bearing ESBL gene) | Binomial(857, 0.0665)/857 | Pilmis et al., 2018; Vidal-Navarro et al., 2010 | 2 French hospitals | Estimated by pooling 857 samples from two studies reporting fecal carriage of ESBL-producing species other than E. coli | |
| rS | Antibiotic resistance level (EC) | / | median 23.1% (range 9.6–36.5%) | Estimated | / | Cumulative resistance level across simulated antibiotic consumption data and assumed antibiograms |
| rR | Antibiotic resistance level (ESBL-EC) | / | median 84.9% (range 77.4–92.2%) | Estimated | / | Cumulative resistance level across simulated antibiotic consumption data and assumed antibiograms |
| ε | Colonization resistance | / | 1–1/Cauchy (6.06, 0.64) | Estimated | / | From expert opinion |
| η | Resource competition | / | (1/γ)/(1/γ + Cauchy(76.38, 5.35)) | Estimated | / | From expert opinion |
| ϕ | Ecological release | / | Cauchy(11.80, 0.80) | Estimated | / | From expert opinion |
| χe | HGT rate (equilibrium) | day−1 | χd/Log-Normal (1.36, 0.81) | Estimated | / | From expert opinion |
| χd | HGT rate (dysbiosis) | day−1 | -log(1-Weibull (0.94, 0.11)) /10 | Estimated | / | From expert opinion |
| ω | Proportion of patients whose microbiota acquire ESBL gene following antibiotic exposure | / | Binomial(132, 18/132)/132 × 0.382 | Agence nationale de sécurité du médicament et des produits de santé, 2017; Bar-Yoseph et al., 2016 | Mixed | The proportion of patients in a meta-analysis who, subsequent to treatment, express resistance to the antibiotic with which treated (18/132), multiplied by the proportion of ESBLs among antibiotics consumed in French hospitals (38.2%) |
Appendix 1—table 6
Parameters and probability distributions for K. pneumoniae.
| Symbol | Parameter | Unit | Distribution | Reference | Reference setting | Notes |
|---|---|---|---|---|---|---|
| β | Transmission rate | day−1 | Normal (0.029, 0.00842) | Gurieva et al., 2018 | 13 European ICUs | Estimate for non-E. coli Enterobacteriaceae |
| α’ | Endogenous acquisition rate | day−1 | Normal (0.0048, 0.00133) | Gurieva et al., 2018 | 13 European ICUs | Estimate for non-E. coli Enterobacteriaceae |
| γ | Natural clearance rate | day−1 | Normal (0.00267, 0.000324) | Bar-Yoseph et al., 2016 | Meta-analysis | Fit longitudinal colonization data using exponential decay model |
| c | Fitness cost of resistance | / | Normal (0.2, 0.02) | / | / | In absence of data for CP resistance, used same distribution as for MRSA |
| fC | Admission fraction (colonized) | / | Binomial (11420, (928 / 11420)) / 11420 | Cravo Oliveira Hashiguchi et al., 2019; Gurieva et al., 2018 | Mixed | The proportion of patients arriving to 13 European ICUs with CP-KP carriage, divided by the estimated proportion of K. pneumoniae that produce carbapenemase in France |
| fR | Admission fraction (bearing resistant strain) | / | Normal (0.01,0.001) | Cravo Oliveira Hashiguchi et al., 2019 | France | / |
| fω | Admission fraction (microbiota bearing CP gene) | Binomial(1135, 0.00441) / 1135 | Pantel et al., 2015 | 7 French hospitals | Rectal carriage of carbapenemase-producing bacteria | |
| rS | Antibiotic resistance level (KP) | / | median 23.1% (range 9.6–36.5%) | estimated | / | Cumulative resistance level across simulated antibiotic consumption data and assumed antibiograms |
| rR | Antibiotic resistance level (CP-KP) | / | median 91.7% (range 89.7–93.7%) | estimated | / | Cumulative resistance level across simulated antibiotic consumption data and assumed antibiograms |
| ε | Colonization resistance | / | 1–1 / Cauchy (17.16, 0.97) | estimated | / | From expert opinion |
| η | Resource competition | / | (1/γ) / (1/γ + Cauchy (74.93, 4.03)) | estimated | / | From expert opinion |
| ϕ | Ecological release | / | Cauchy (36.63, 0.82) | estimated | / | From expert opinion |
| χe | HGT rate (equilibrium) | day−1 | χd / Gamma (2.01,0.36) | estimated | / | From expert opinion |
| χd | HGT rate (dysbiosis) | day−1 | -log(1-Gamma(0.54, 3.67))/10 | estimated | / | From expert opinion |
| ω | Proportion of patients whose microbiota acquire CP gene following antibiotic exposure | Binomial (132, 0.1363) / 132 × 0.0151 | estimated from Agence nationale de sécurité du médicament et des produits de santé, 2017; Bar-Yoseph et al., 2016 | Mixed | The proportion of patients in a meta-analysis who, subsequent to treatment, express resistance to the antibiotic with which treated (18/132), multiplied by the proportion of carbapenems among antibiotics consumed in French hospitals (1.5%) |
Appendix 1—table 7
Relationship between model parameters and the clinical parameters estimated by experts.
| Model parameter | Clinical parameter | Assumed relationship between model and clinical parameters | |||
|---|---|---|---|---|---|
| Name | Symbol | Description | Symbol | ||
| Colonization resistance | ε | Relative risk of acquiring colonization among patients experiencing microbiome dysbiosis | RRβ | ||
| Resource competition | η | Excess duration of colonization among patients experiencing microbiome dysbiosis | d | ||
| Ecological release | ϕ | Relative risk of pathogen outgrowth among patients experiencing microbiome dysbiosis | RRα | ||
| HGT rate (dysbiosis) | χd | Proportion of antibiotic-exposed patients colonized with the specified species that acquire the specified resistance via HGT during their hospital stay | pχd | ||
| HGT rate (equilibrium) | χe | Relative risk of acquiring the specified resistance via HGT among patients experiencing microbiome dysbiosis | RRχ | ||
Appendix 1—table 8
Antibiotic classes, their contribution to total hospital antibiotic consumption, their spectrum, and their relative rate of inducing microbiome dysbiosis.
Consumption data come from the French ANSM and are supplemented with data from Baggs et al. (Agence nationale de sécurité du médicament et des produits de santé, 2017; Baggs et al., 2016). The literature was used to classify antibiotic classes in terms of their spectrum, (Abbara et al., 2020; Tan et al., 2017) and relative rate of causing microbiome dysbiosis. (Baggs et al., 2018; Brown et al., 2013) The percentage column does not total to 100 due to rounding error.
| Antibiotic class | ACT code | % of consumption | Spectrum | Rate of inducing microbiome dysbiosis |
|---|---|---|---|---|
| Amoxicillin and beta-lactamase inhibitor | J01CR02 | 32.4 | Broad | High |
| Penicillins with extended spectrum | J01CA | 21.9 | Narrow | Medium |
| Quinolones | J01M | 11.0 | Broad | High |
| C3G | J01DD | 8.2 | Broad | Very high |
| C1G | J01DB | 3.7 | Narrow | High |
| Macrolides | J01FA | 3.4 | Narrow | Medium |
| Imidazole | J01XD | 2.9 | Narrow | Medium |
| Piperacillin and beta-lactamase inhibitor | J01CR05 | 2.3 | Broad | High |
| Aminoglycosides | J01G | 2.3 | Narrow | Low |
| Tetracyclines | J01A | 2.0 | Narrow | Low |
| Sulfonamides, trimethoprim | J01E | 1.8 | Narrow | Medium |
| Glycopeptides | J01XA | 1.8 | Narrow | Very high |
| Lincosamides | J01FF | 1.6 | Broad | Very high |
| Carbapenems | J01DH | 1.5 | Broad | High |
| Penicillins (other) | J01C_other | 1.4 | Narrow | Medium |
| C2G | J01DC | 0.9 | Narrow | High |
| C4G | J01DE | 0.6 | Broad | Very high |
| Other | Other | 2.1 | Narrow | Medium |
Additional files
-
Supplementary file 1
Expert elicitation protocol.
- https://cdn.elifesciences.org/articles/68764/elife-68764-supp1-v2.docx
-
Transparent reporting form
- https://cdn.elifesciences.org/articles/68764/elife-68764-transrepform-v2.docx
Download links
A two-part list of links to download the article, or parts of the article, in various formats.
Downloads (link to download the article as PDF)
Open citations (links to open the citations from this article in various online reference manager services)
Cite this article (links to download the citations from this article in formats compatible with various reference manager tools)
Microbiome-pathogen interactions drive epidemiological dynamics of antibiotic resistance: A modeling study applied to nosocomial pathogen control
eLife 10:e68764.
https://doi.org/10.7554/eLife.68764


