Spatially patterned excitatory neuron subtypes and projections of the claustrum
- Department of Cellular and Physiological Sciences, Life Sciences Institute, University of British Columbia, Canada
- Neuroscience and Mental Health Institute, University of Alberta, Canada
- Janelia Research Campus, Howard Hughes Medical Institute, United States
- Department of Physiology, University of Alberta, Canada
- Djavad Mowafaghian Centre for Brain Health, University of British Columbia, Canada
- School of Biomedical Engineering, University of British Columbia, Canada
Figures
Figure 1 with 4 supplements
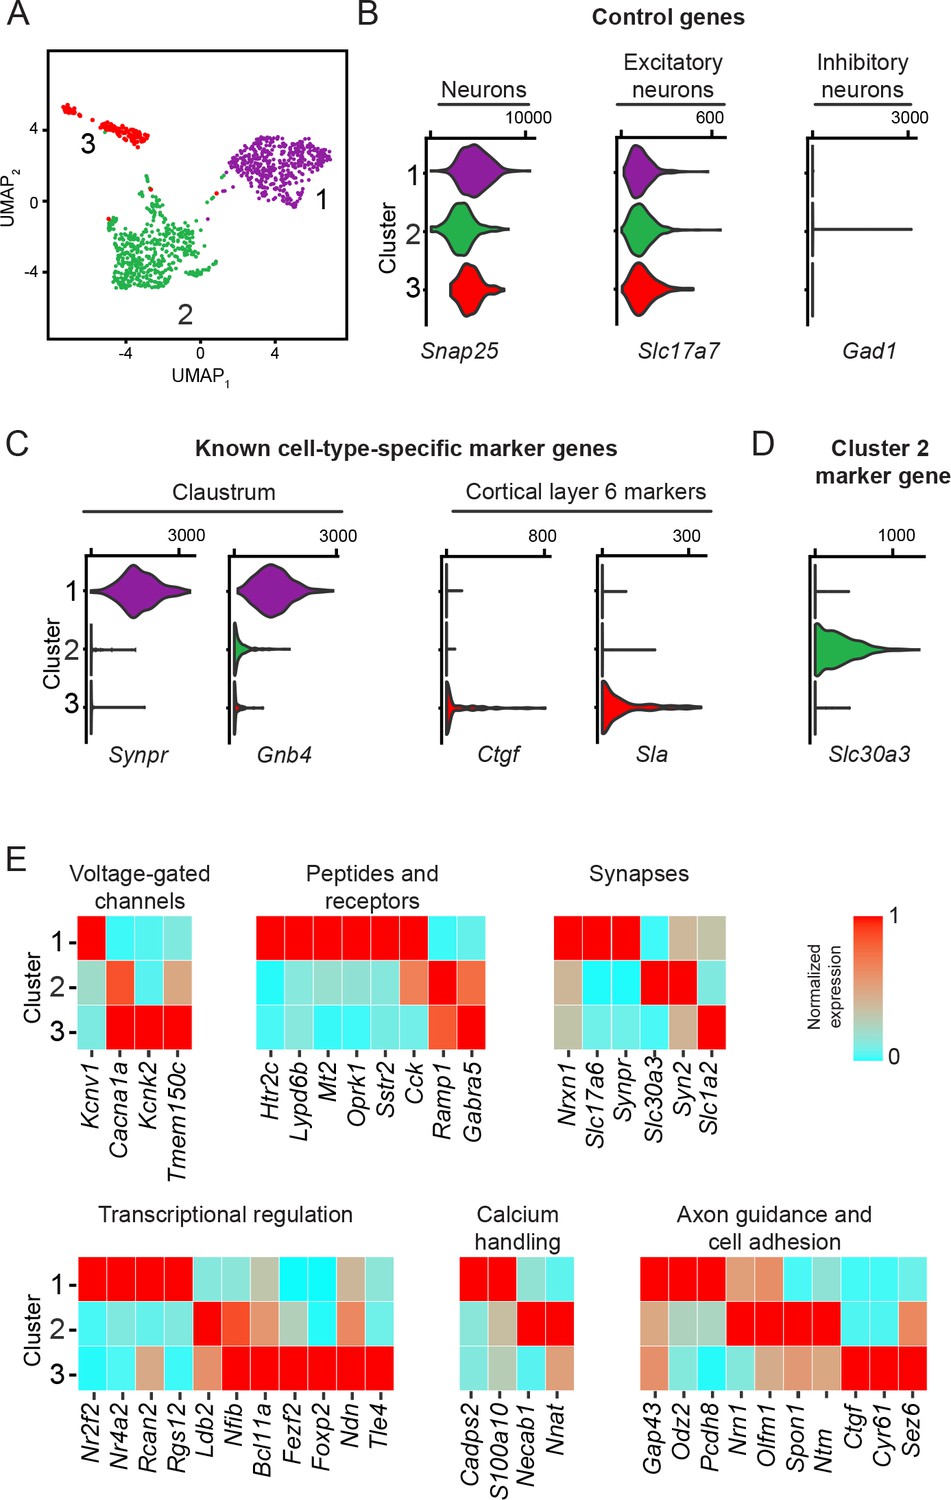
Excitatory claustrum-occupying cells are separable into discrete transcriptomic populations.
(A) UMAP dimensionality reduction of single-cell transcriptomes. Points denote individual cells, with coloring denoting cluster identity obtained by graph-based clustering. (B) Violin plots illustrating expression of control marker genes, with accompanying values denoting normalized and log-transformed count value associated with right tick mark. (C) As in (B), but for known marker genes of claustrum neurons and layer 6 cortical neurons. (D) As in (B), but for the novel Cluster 2 marker gene Slc30a3. (E) Heatmap illustrating expression of genes associated with neuronal functionality that are enriched or depleted in a cell-type-specific fashion.
Figure 1—figure supplement 1
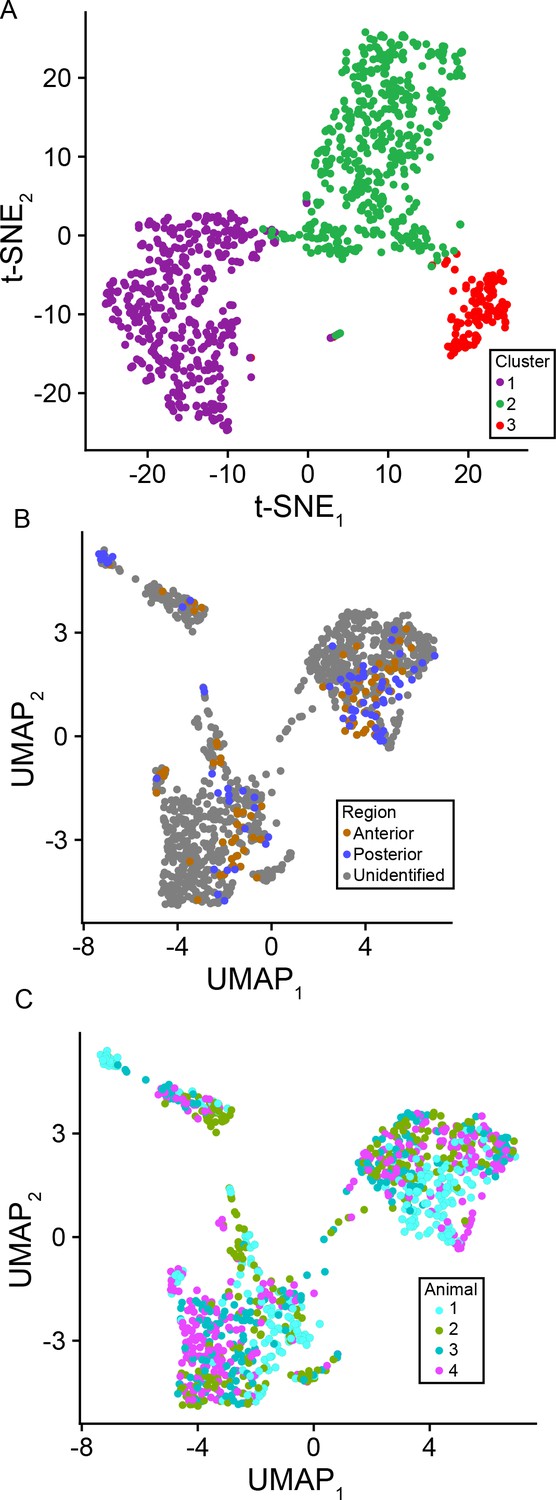
Consistency and reproducibility of scRNA-seq data.
(A) t-SNE dimensionality reduction of scRNA-seq dataset, illustrating separation of clusters. Cells are colored according to cluster identity as in Figure 1. (B) Cells colored according to location of slice (anterior vs. posterior), depicted in UMAP space. Anterior and posterior cells occupy identical clusters. (C) Cells colored according to animal, depicted in UMAP space, illustrating clustering of cells across animals.
Figure 1—figure supplement 2
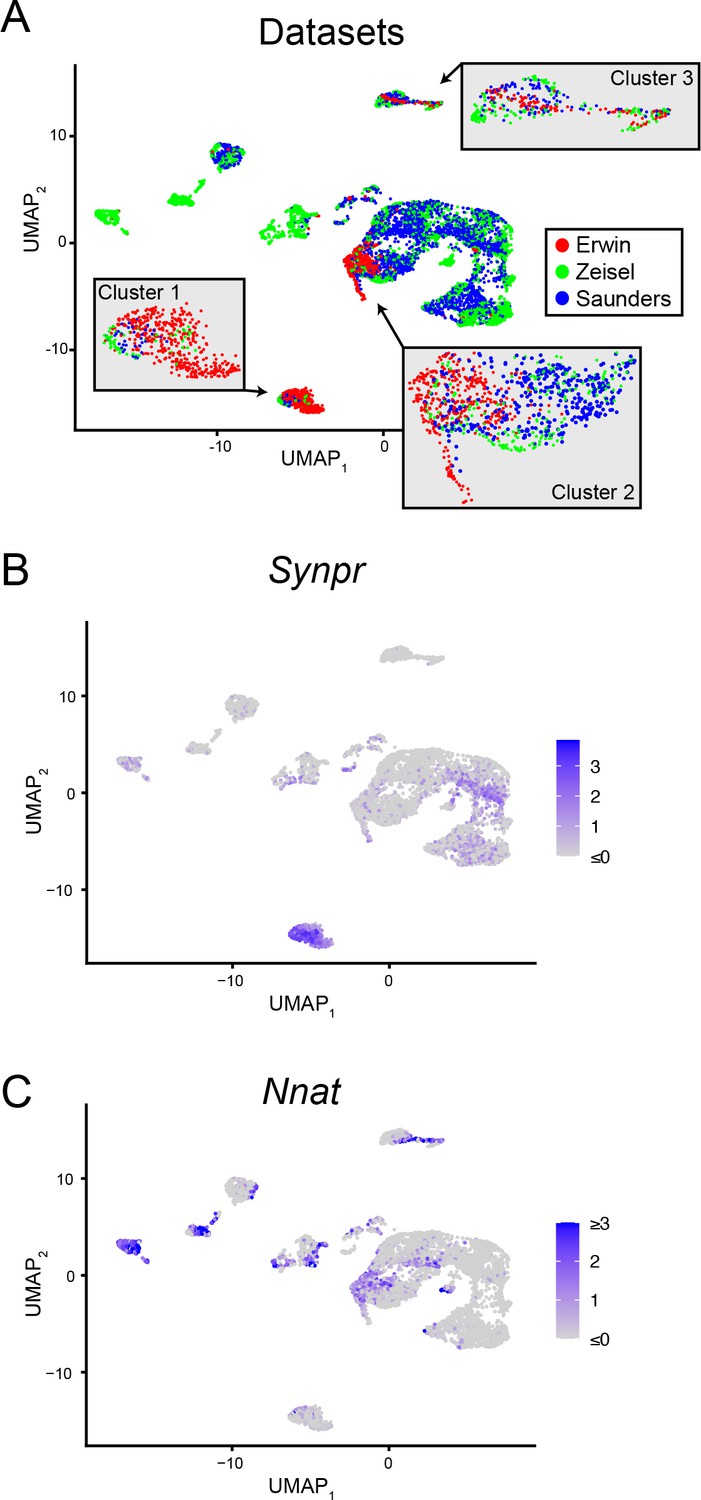
Comparison of new and published scRNA-seq datasets.
(A) scRNA-seq analysis, integrating the new (‘Erwin’) dataset with published data from Zeisel et al., 2018 and Saunders et al., 2018 (‘Zeisel’ and ‘Saunders,’ respectively). Cells in the integrated dataset are depicted in UMAP embedding and colored according to source dataset. Insets provide expansion of cell types enriched in the Erwin dataset. (B) Expression of Synpr in the integrated dataset, helping to illustrate cells associated with Cluster 1 in Erwin dataset. Color map and units reflects scaled expression across integrated datasets (dimensionless). (C) As in (B), but for Nnat, illustrating cells associated with Cluster 2 in Erwin dataset.
Figure 1—figure supplement 3
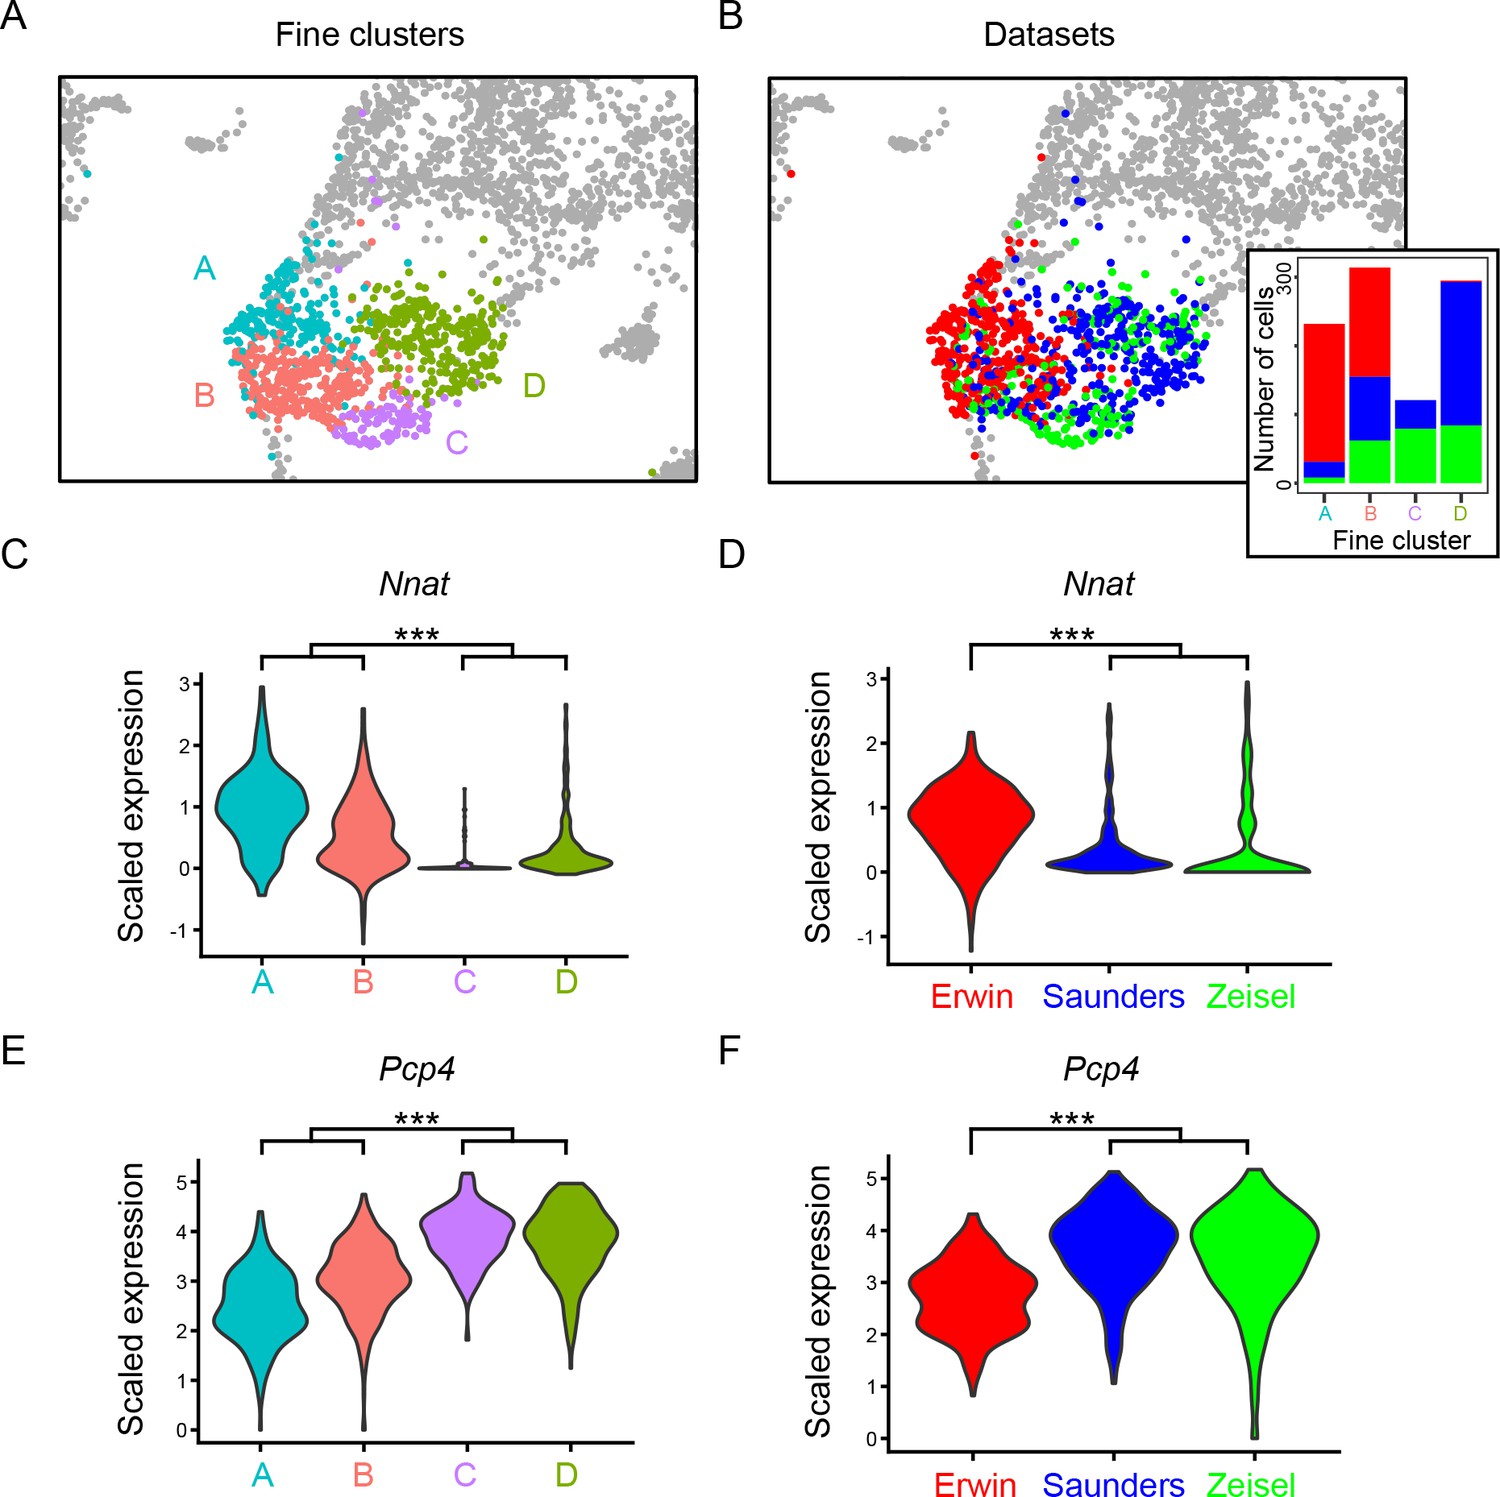
Nnat and Pcp4 differentiate similar cells across datasets.
(A) Clusters of neurons obtained at a relatively fine clustering resolution, encompassing Nnat-expressing claustrum shell neurons from Erwin dataset, as well as similar neurons from published Saunders and Zeisel datasets. (B) As in (A), but colored according to dataset of origin. Inset illustrates the number of cells from each dataset on a per-cluster basis. Expression presented in scaled (dimensionless) units. (C) Expression of Nnat across the clusters in (A). (D) As in (C), but expression illustrated by dataset of origin rather than cluster. (E, F) As in (C, D), but for Pcp4.
Figure 1—figure supplement 4
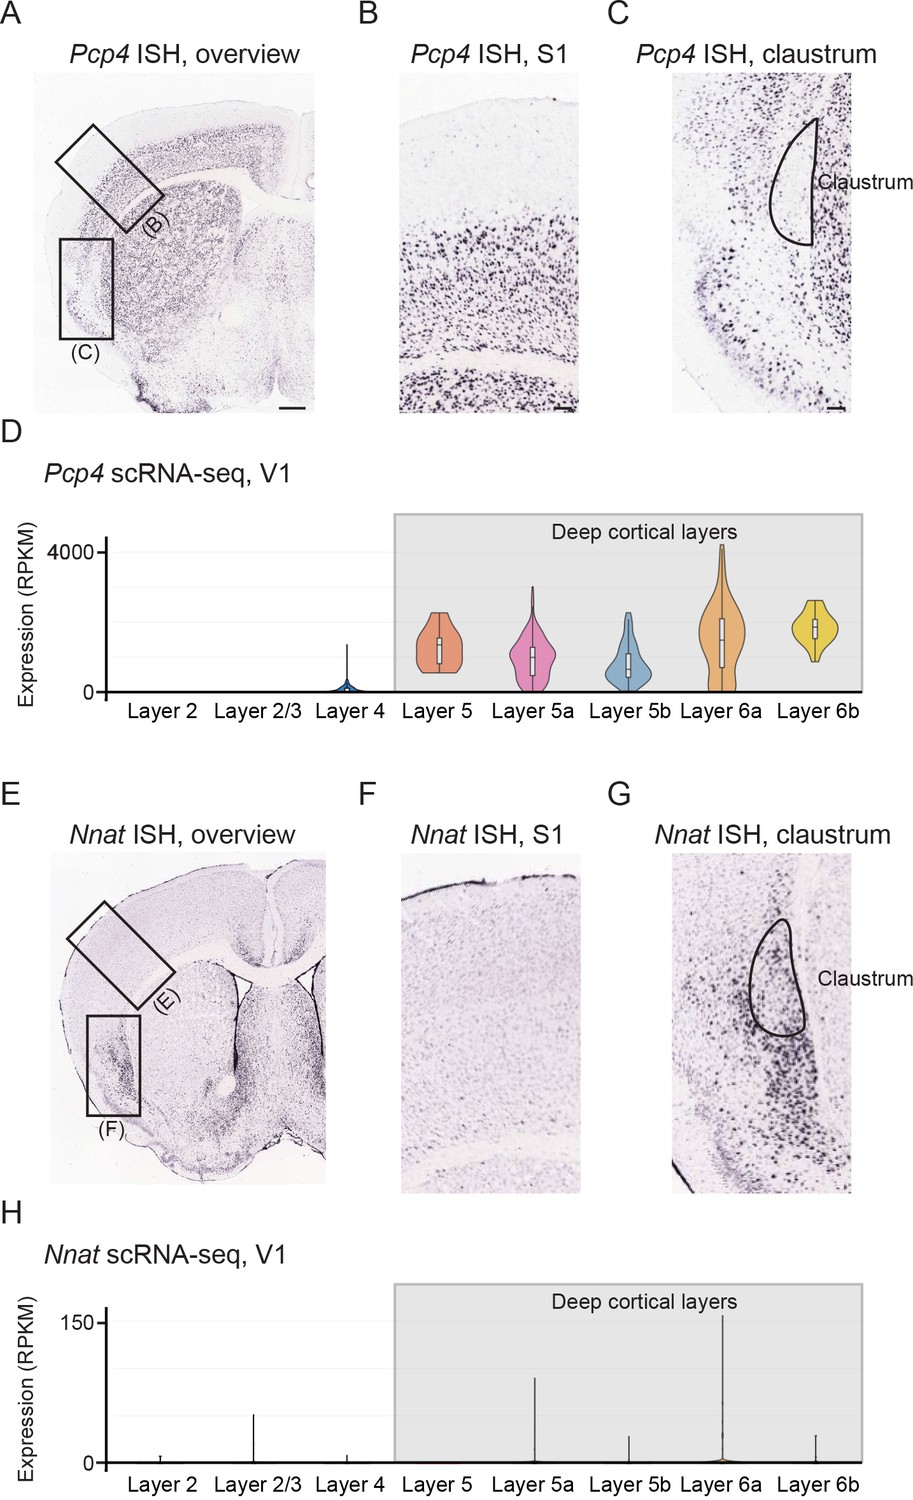
Pcp4 and Nnat differentiate deep cortical layers from claustrum shell.
(A) Chromogenic in situ hybridization showing Pcp4 expression in a coronal section of the mouse brain. Scale bar: 500 µm. (B, C) Expansion of the regions highlighted in (A). Note that Pcp4 exhibits near-ubiquitous expression across the deep cortical layers (e.g., S1), which sharply decreases upon emergence of the claustrum. Data in (A–C) from Allen Mouse Brain Atlas (Lein et al., 2007). Scale bars: 100 µm. (D) Single-cell RNA sequencing data from V1 further supporting strong, ubiquitous expression of Pcp4 across deep cortical layers. Data from Tasic et al., 2016 with cluster identities and associated analysis conducted via the Broad Institute Single Cell Portal (https://singlecell.broadinstitute.org/single_cell), with results presented in reads per kilobase per million mapped reads (RPKM). (E–H) As in (A–D), but for Nnat.
Figure 2 with 5 supplements
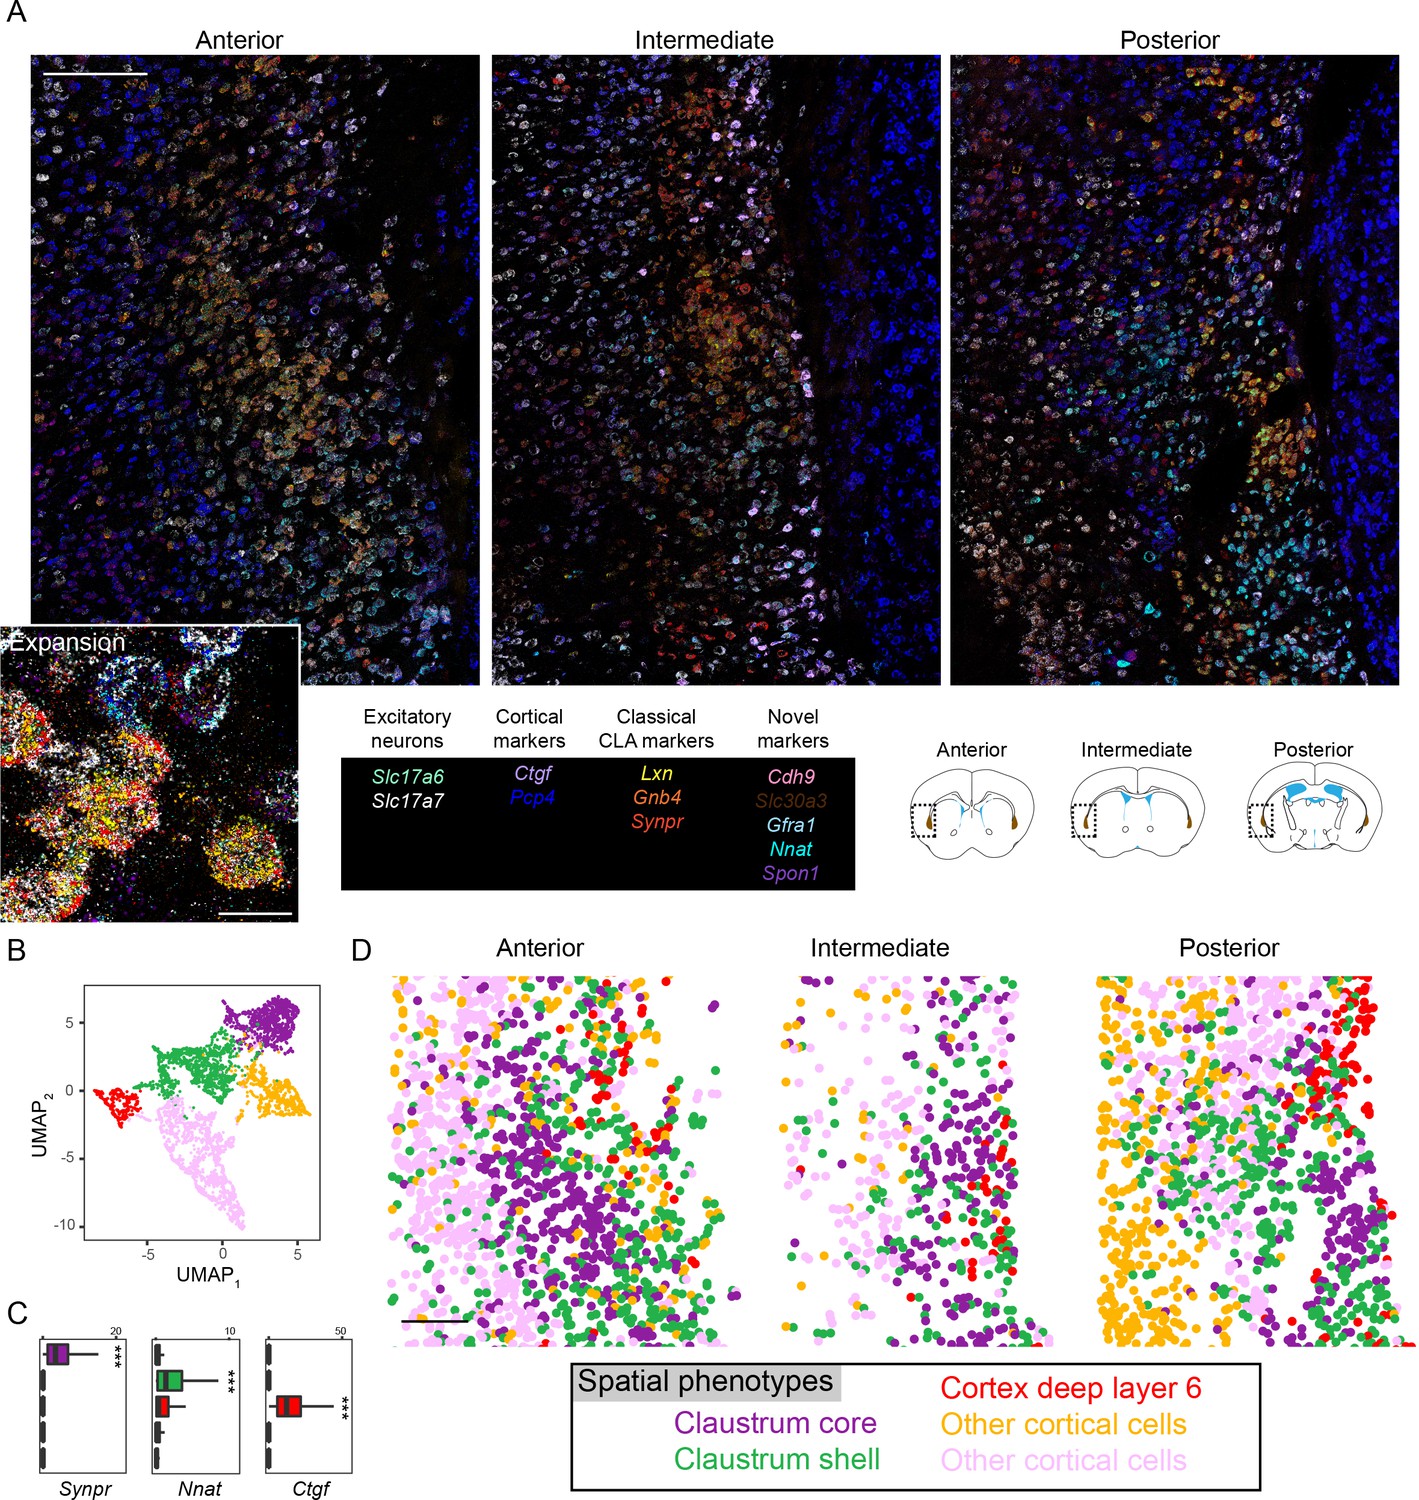
Multiplexed fluorescent in situ hybridization analysis of the claustrum.
(A) Overview of anterior (left), intermediate (middle), and posterior (right) sections of the claustrum. Inset shows expansion of anterior section. Probe list provided at bottom middle, with atlas schematics denoting coronal section locations at bottom right, as well as imaged regions and claustrum definition of atlas (brown). Scale bars: overview: 200 µm; expansion: 20 µm. Atlas schematic adapted from Franklin and Paxinos, 2013. (B) UMAP-based nonlinear dimensionality reduction for Slc17a7-expressing cells (putative excitatory neurons) segmented from (A) and colored according to Leiden cluster identity. (C) Expression of example marker genes for core claustrum (Synpr), shell claustrum (Nnat), and layer 6 neurons (Ctgf). (D) Excitatory neurons from (B) plotted in spatial coordinates. Purple and green clusters respectively occupy the claustrum core and shell. Red neurons occupy deep layer 6 cortex, whereas yellow and pink clusters occupy other cortical regions. Scale bar: 200 µm.
© 2013, Franklin and Paxinos. Atlas schematic adapted from Franklin and Paxinos, 2013. Further reproduction of this figure would need permission from the copyright holder.
Figure 2—figure supplement 1

scRNA-seq profiles of multiplexed fluorescent in situ hybridization-targeted genes.
(A) scRNA-seq expression profiles of excitatory neuronal markers Slc17a7 and Slc17a6. Expression depicted in UMAP embedding, plotted as counts per million with color scale provided. (B) As in (A), but for previously known claustral marker genes. (C) As in (A), but for cortical marker genes. (D) As in (A), but for genes identified in this study that were enriched or depleted in a cluster-specific manner.
Figure 2—figure supplement 2
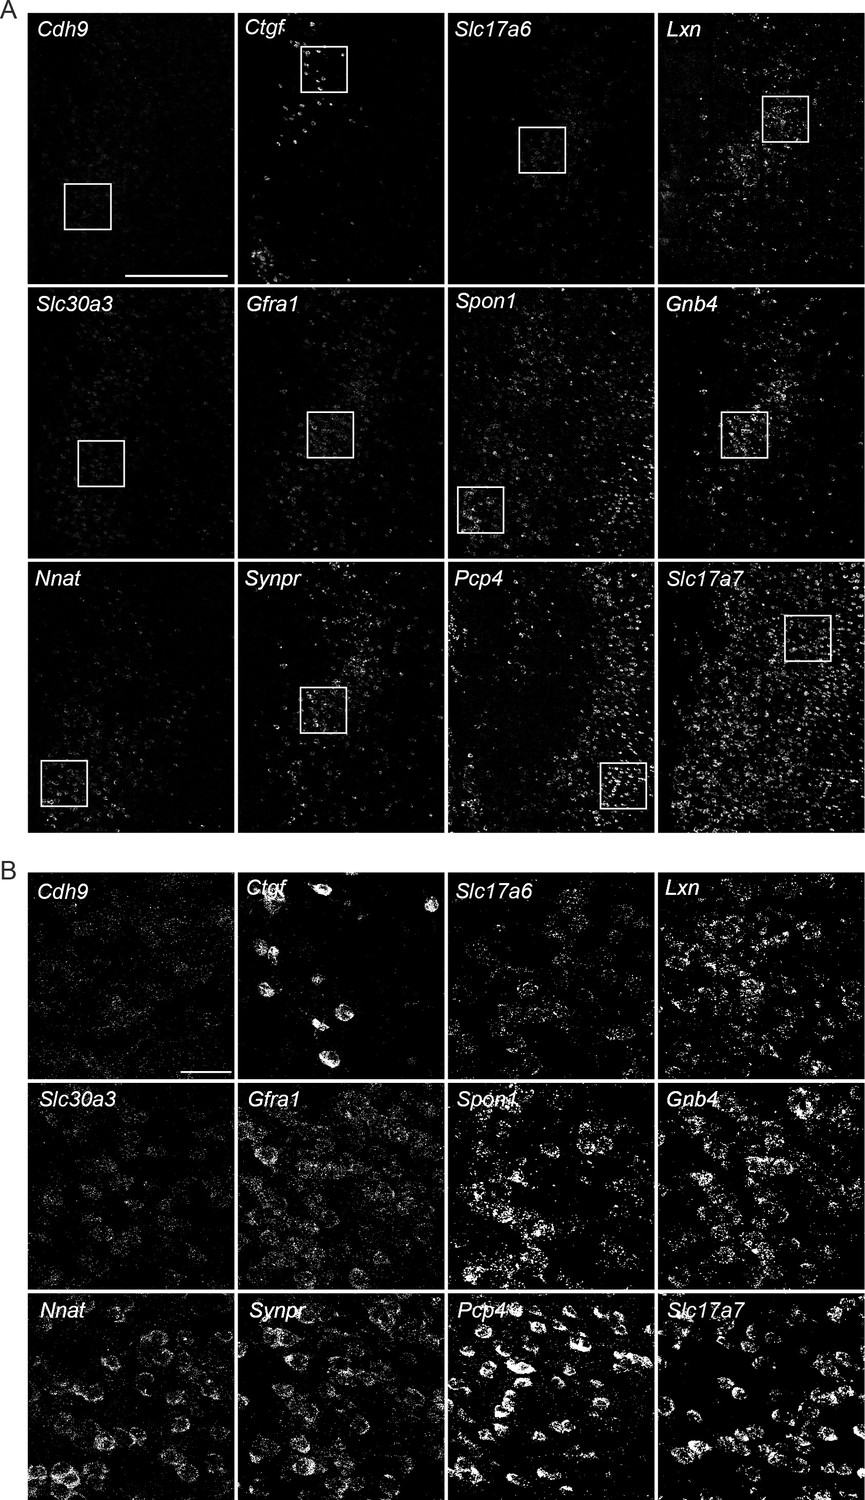
Representative expansions of RNA signals detected via multiplexed fluorescent in situ hybridization (mFISH).
(A) Overview of signals associated with the 12 genes targeted by mFISH. Scale bar: 500 μm. (B) For each gene, expansions of the areas shown in (A). Scale bar: 50 μm.
Figure 2—figure supplement 3
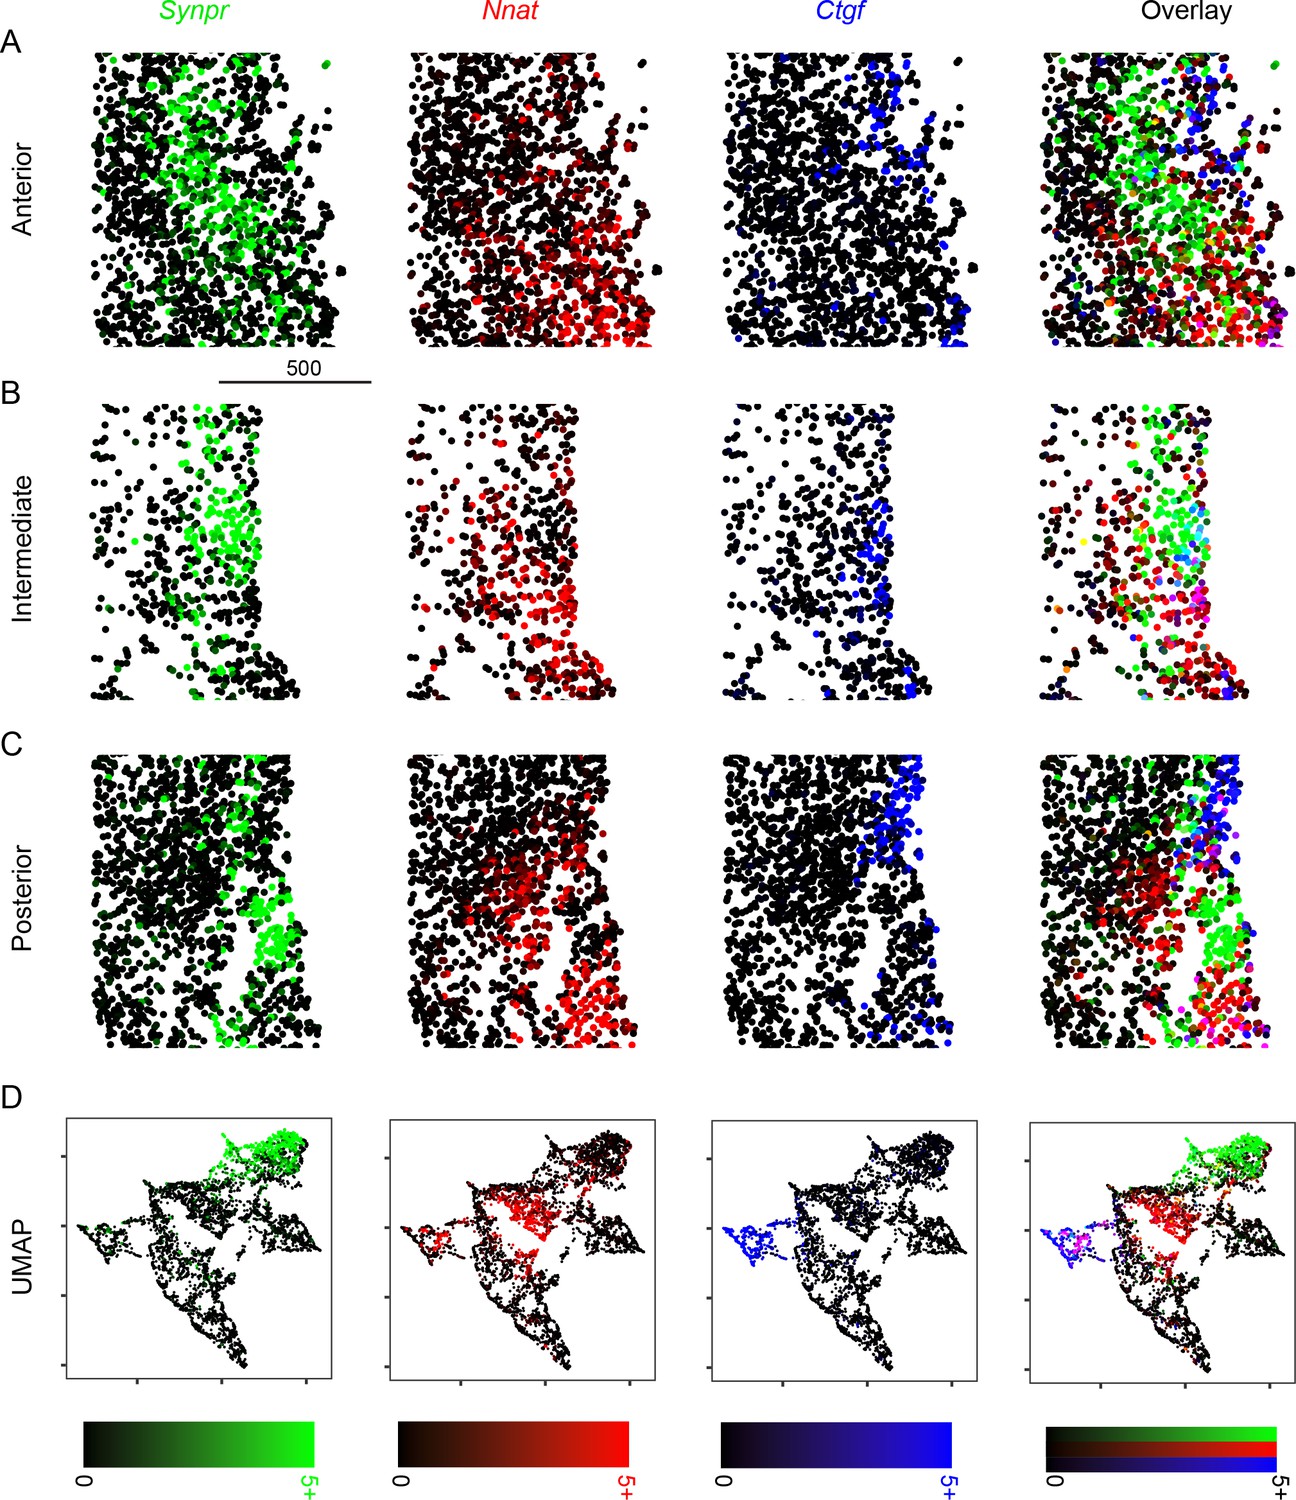
Expression of core, shell, and layer 6 marker genes across the anterior-posterior axis.
(A) Expression of Synpr (green), Nnat (red), and Ctgf (blue) in anterior sections, as well as three-color overlay. Scale bar: 500 μm. (B, C) As in (A), but for intermediate (B) and posterior (C) sections. (D) Expression of Synpr, Nnat, and Ctgf in UMAP embedding pooling across all shown sections. Scale bars, illustrating percent area covered (PAC), are provided at bottom for each column.
Figure 2—figure supplement 4

Overview of cellular phenotyping across sections and mice.
(A) Cellular phenotyping across relatively anterior (left), intermediate (middle), and posterior (right) sections for a replicate animal, with cells colored according to cluster identity as in Figure 2. (B–D) As in (A), but for other replicate animals. Scale bar: 500 µm.
Figure 2—figure supplement 5
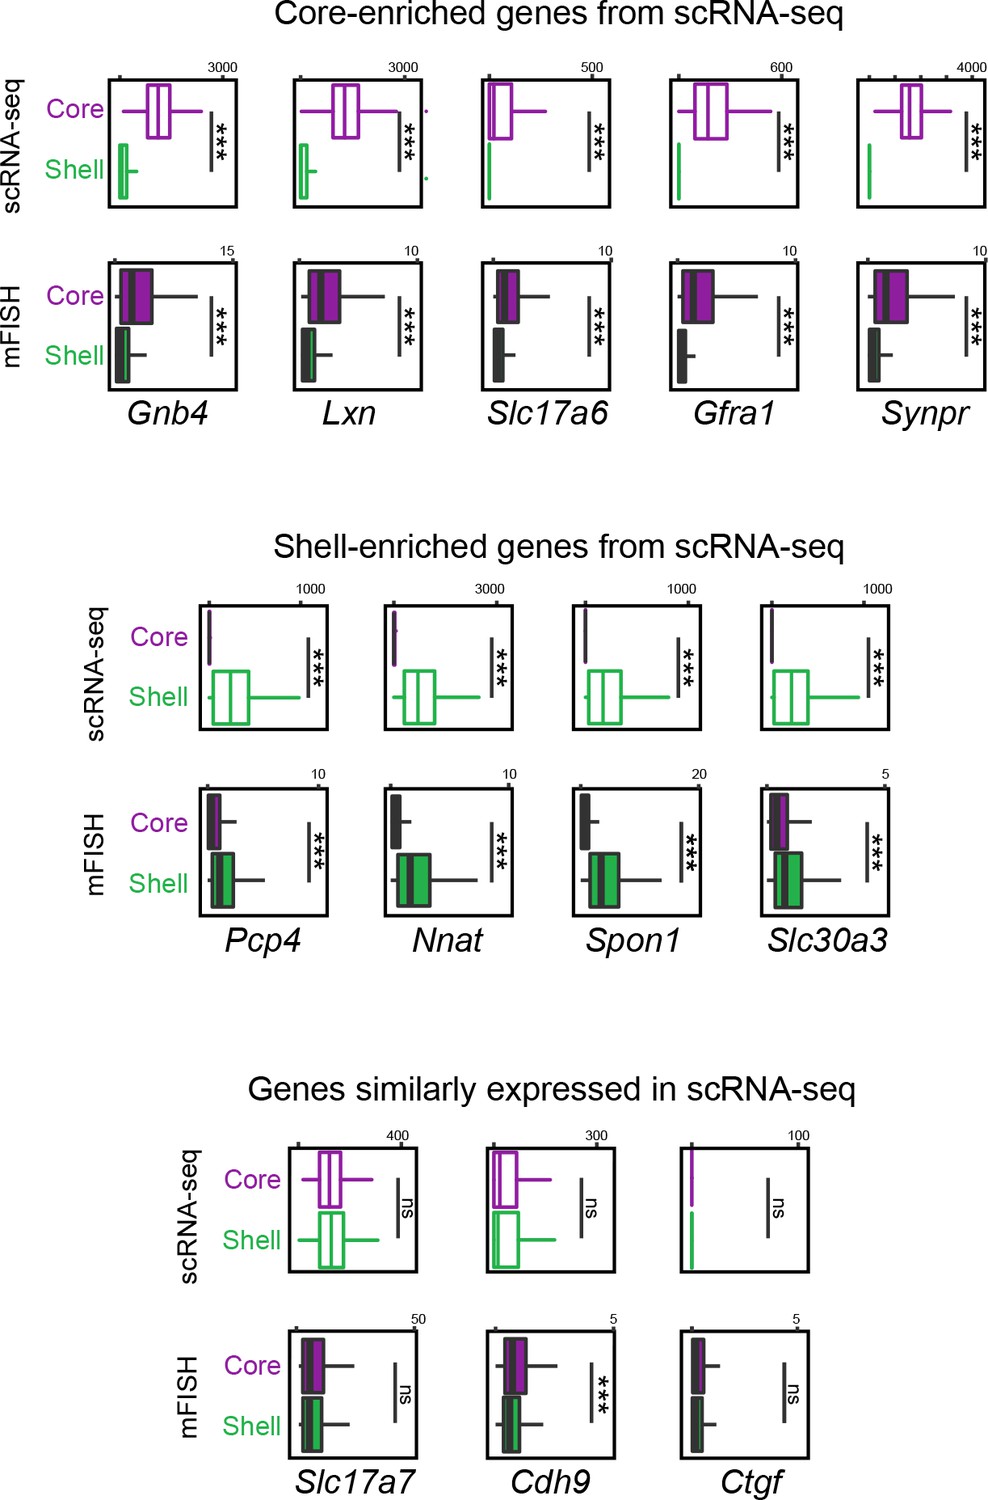
Comparison of gene expression of putative core and shell populations across scRNA-seq and multiplexed fluorescent in situ hybridization (mFISH).
Top row: box plots illustrating expression of core-associated marker genes in scRNA-seq and mFISH datasets for core and shell clusters. Middle row: as in top row, but for shell-associated marker genes. Bottom row: as in top row, but for genes similarly expressed in scRNA-seq core and shell datasets.
Figure 3 with 1 supplement

Claustrum transcriptomic subtypes are associated with different projections.
(A) Projections to the retrosplenial cortex (RSC; magenta) and lateral entorhinal cortex (LEC; green) emanate from different spatial locations. Atlas schematic denotes coronal section location, adapted from Franklin and Paxinos, 2013. Scale bar: 200 µm. (B) Left: UMAP visualization of scRNA-seq claustrum transcriptomes, with coloring of individual cells corresponding to their associated projection. Labels denote cluster phenotypes and example marker genes. (C) Counts of RSC-projecting and LEC-projecting cells according to scRNA-seq core and shell phenotypes. (D) Representative multiplexed fluorescent in situ hybridization (mFISH) of intermediate claustrum section, including circuit mapping of long-range projections to the RSC (magenta) and LEC (green). Scale bars: overview: 200 µm; expansion: 20 µm. (E) Cellular segmentation and cluster identification based upon gene expression detected via mFISH, for section shown in (D). (F) UMAP dimensionality reduction of mFISH-characterized cells in (D), colored according to cluster identity as in (E). Putative phenotypes of clusters, based upon marker gene expression, are provided in inset. (G) Locations of neurons projecting to the RSC (magenta), LEC (green), or both (yellow), for section shown in (D). Scale bar: 200 µm. (H) As in (G), but with projections shown in UMAP embedding. (I) mFISH-derived expression of Synpr and Nnat in cells that project to either the RSC (magenta) or LEC (green). Results depict all projection-labeled cells across all sections and animals. (J) As in (C), but for mFISH core and shell phenotypes across all sections and animals.
© 2013, Franklin and Paxinos. Atlas schematic denotes coronal section location, adapted from Franklin and Paxinos, 2013. Further reproduction of this figure would need permission from the copyright holder.
Figure 3—figure supplement 1

Multiplexed fluorescent in situ hybridization (mFISH)-derived gene expression profiles for retrosplenial cortex (RSC)- and lateral entorhinal cortex (LEC)-projecting neurons.
Box plots illustrating expression of genes in mFISH dataset according to projections to either the RSC or LEC. Plots grouped according to scRNA-seq-derived expression profiles.
Author response image 1

Similar expression of Pcp4 in the cortical cell cluster across datasets.
Using cortical cells from our dataset (Erwin et al.), we identified the corresponding cluster from the integrated analysis including other published datasets (Saunders t al., Zeisel et al.). Pcp4 expression is illustrated (via dimensionless units, corresponding to integrated scaled data), both for individual cells from each dataset (black dots), as well as associated violin plots on a per-dataset basis (coloured contours).
Videos
Video 1
Example multiplexed fluorescent in situ hybridization image across fine and coarse spatial scales.
Tables
Key resources table
| Reagent type (species) or resource | Designation | Source or reference | Identifiers | Additional information |
|---|---|---|---|---|
| Sequence-based reagent | Cdh9 ISH probe | Advanced Cell Diagnostics | 443221-T1 | mFISH |
| Sequence-based reagent | Ctgf ISH probe | Advanced Cell Diagnostics | 314541-T2 | mFISH |
| Sequence-based reagent | Slc17a6 ISH probe | Advanced Cell Diagnostics | 319171-T3 | mFISH |
| Sequence-based reagent | Lxn ISH probe | Advanced Cell Diagnostics | 585801-T4 | mFISH |
| Sequence-based reagent | Slc30a3 ISH probe | Advanced Cell Diagnostics | 496291-T5 | mFISH |
| Sequence-based reagent | Gfra1 ISH probe | Advanced Cell Diagnostics | 431781-T6 | mFISH |
| Sequence-based reagent | Spon1 ISH probe | Advanced Cell Diagnostics | 492671-T7 | mFISH |
| Sequence-based reagent | Gnb4 ISH probe | Advanced Cell Diagnostics | 460951-T8 | mFISH |
| Sequence-based reagent | Nnat ISH probe | Advanced Cell Diagnostics | 432631-T9 | mFISH |
| Sequence-based reagent | Synpr ISH probe | Advanced Cell Diagnostics | 500961-T10 | mFISH |
| Sequence-based reagent | Pcp4 ISH probe | Advanced Cell Diagnostics | 402311-T11 | mFISH |
| Sequence-based reagent | Slc17a7 ISH probe | Advanced Cell Diagnostics | 416631-T12 | mFISH |
| Software, algorithm | R | https://www.r-project.org | SCR_001905 | - |
| Software, algorithm | Seurat | https://satijalab.org/seurat/ | SCR_007322 | - |
| Software, algorithm | Fiji | https://imagej.net/Fiji | RRID:SCR_002285 | - |
| Other | rAAV2-retro-CAG-GFP | Janelia Viral Core | - | scRNA-seq |
| Other | pAAV-CAG-GFP | Addgene | RRID:Addgene_37825 | mFISH |
| Other | pAAV-CAG-tdTomato | Addgene | RRID:Addgene_59462 | mFISH |
Additional files
-
Supplementary file 1
List of core-enriched genes and enrichment properties.
- https://cdn.elifesciences.org/articles/68967/elife-68967-supp1-v1.txt
-
Supplementary file 2
List of shell-enriched genes and enrichment properties.
- https://cdn.elifesciences.org/articles/68967/elife-68967-supp2-v1.txt
-
Supplementary file 3
List of layer 6-enriched genes and enrichment properties.
- https://cdn.elifesciences.org/articles/68967/elife-68967-supp3-v1.txt
-
Transparent reporting form
- https://cdn.elifesciences.org/articles/68967/elife-68967-transrepform1-v1.pdf
Download links
A two-part list of links to download the article, or parts of the article, in various formats.
Downloads (link to download the article as PDF)
Open citations (links to open the citations from this article in various online reference manager services)
Cite this article (links to download the citations from this article in formats compatible with various reference manager tools)
Spatially patterned excitatory neuron subtypes and projections of the claustrum
eLife 10:e68967.
https://doi.org/10.7554/eLife.68967


