Machine learning sequence prioritization for cell type-specific enhancer design
- Computational Biology Department, School of Computer Science, Carnegie Mellon University, United States
- Biological Sciences Department, Mellon College of Science, Carnegie Mellon University, United States
- Neuroscience Institute, Carnegie Mellon University, United States
- Medical Scientist Training Program, University of Pittsburgh, United States
- Department of Psychiatry, Translational Neuroscience Program, University of Pittsburgh, United States
- Department of Neurobiology, University of Pittsburgh, United States
- Systems Neuroscience Center, Brain Institute, Center for Neuroscience, Center for the Neural Basis of Cognition, United States
- Department of Ophthalmology, University of Pittsburgh, United States
- Division of Experimental Retinal Therapies, Department of Clinical Sciences & Advanced Medicine, School of Veterinary Medicine, University of Pennsylvania, United States
- Department of Bioengineering, University of Pittsburgh, United States
Figures
Figure 1 with 6 supplements
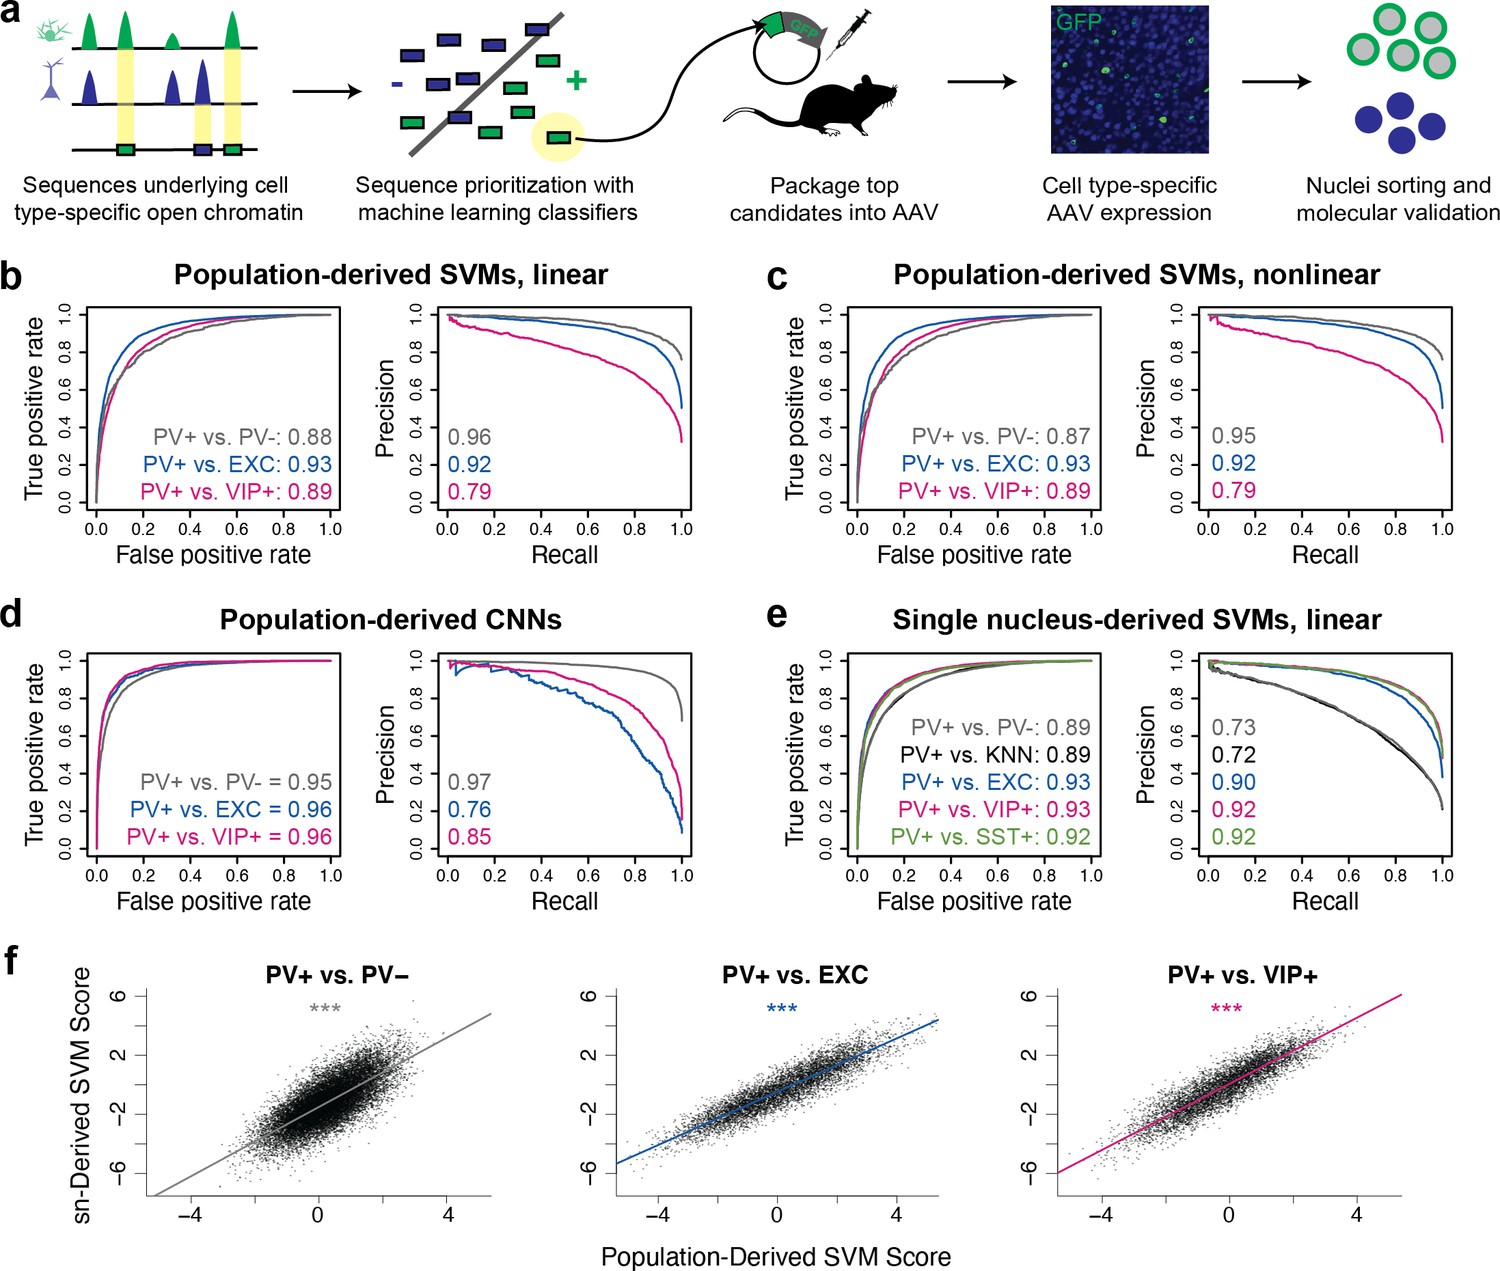
Classification of neuron subtype-specific enhancer activity from sequence.
(a) Schematic representation of the Specific Nuclear-Anchored Independent Labeling (SNAIL) workflow. (b–e) Receiver operator characteristic and precision-recall performance metrics for various cell type-specific enhancer sequence model strategies and data modalities. The reported numbers are the areas under the curves for each model. (f) Scatter plots for support vector machine (SVM) scores reported by equivalent population-derived models and single-nucleus-derived models. ***p-Value of Pearson correlation <0.001.
-
Figure 1—source data 1
Support vector machine (SVM) parameter tuning and performance evaluations.
- https://cdn.elifesciences.org/articles/69571/elife-69571-fig1-data1-v1.xlsx
-
Figure 1—source data 2
Convolutional neural network (CNN) parameter tuning and performance evaluations.
- https://cdn.elifesciences.org/articles/69571/elife-69571-fig1-data2-v1.xlsx
-
Figure 1—source data 3
Model scores on externally screened parvalbumin-expressing (PV+) enhancer candidates.
- https://cdn.elifesciences.org/articles/69571/elife-69571-fig1-data3-v1.xlsx
-
Figure 1—source data 4
Identification of motif sites within external parvalbumin-expressing (PV+) neuron enhancer screen, E1–E34.
- https://cdn.elifesciences.org/articles/69571/elife-69571-fig1-data4-v1.xlsx
Figure 1—figure supplement 1
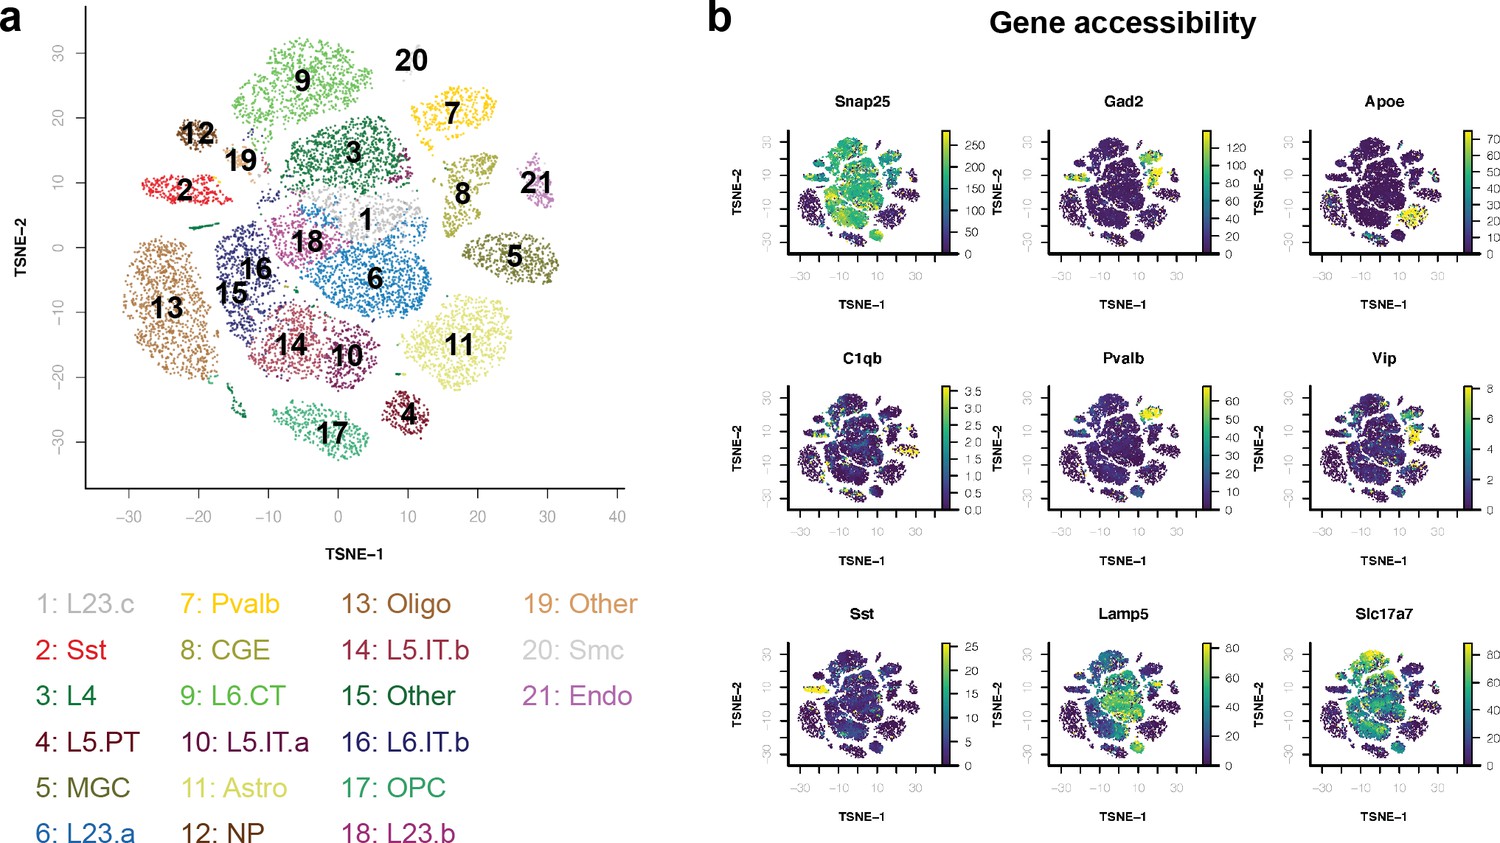
snATAC-seq cluster assignments.
(a) Cluster annotations in t-SNE space. (b) Gene body accessibility of population marker genes. Data reprocessed from Li et al., 2021.
Figure 1—figure supplement 2
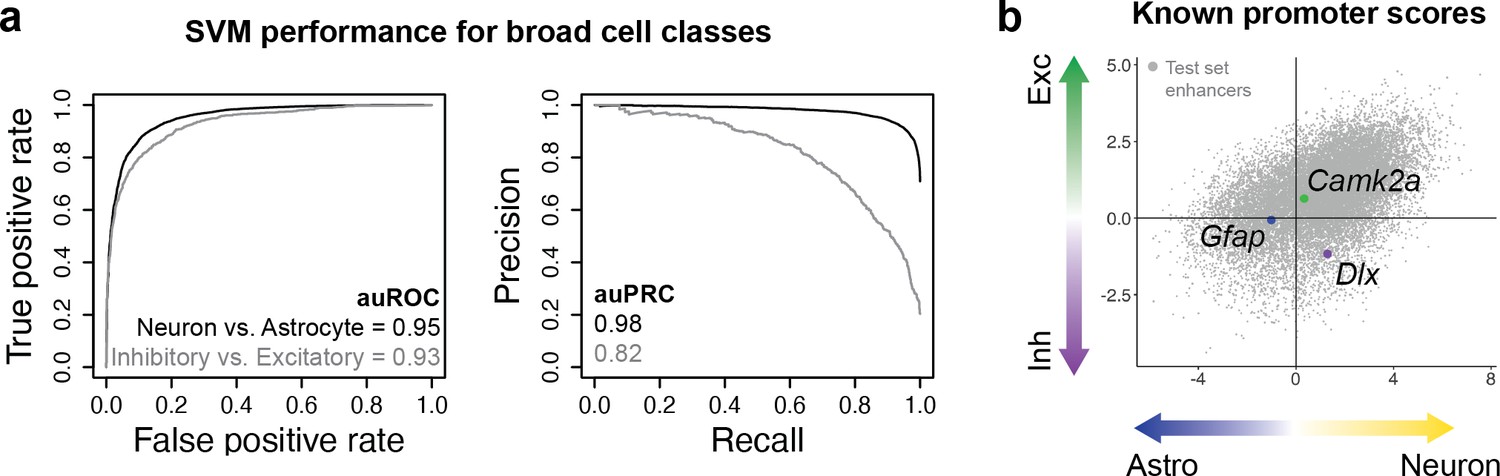
Validation of modeling strategy using known promoters targeting broad cell classes.
(a) Performance metrics for support vector machines (SVMs) trained to distinguish differential open chromatin regions (OCRs) between neurons vs. astrocytes or inhibitory neurons vs. excitatory neurons. (b) Model scores for Gfap, Camk2a, and Dlx cell type-specific promoter sequences.
Figure 1—figure supplement 3
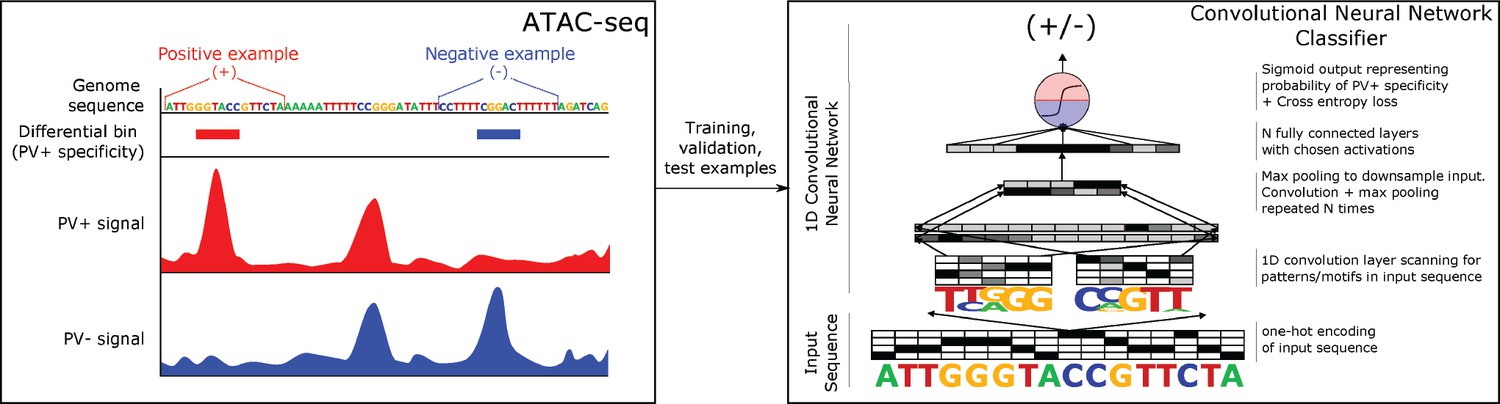
Convolutional neural network (CNN) strategy overview.
Figure 1—figure supplement 4
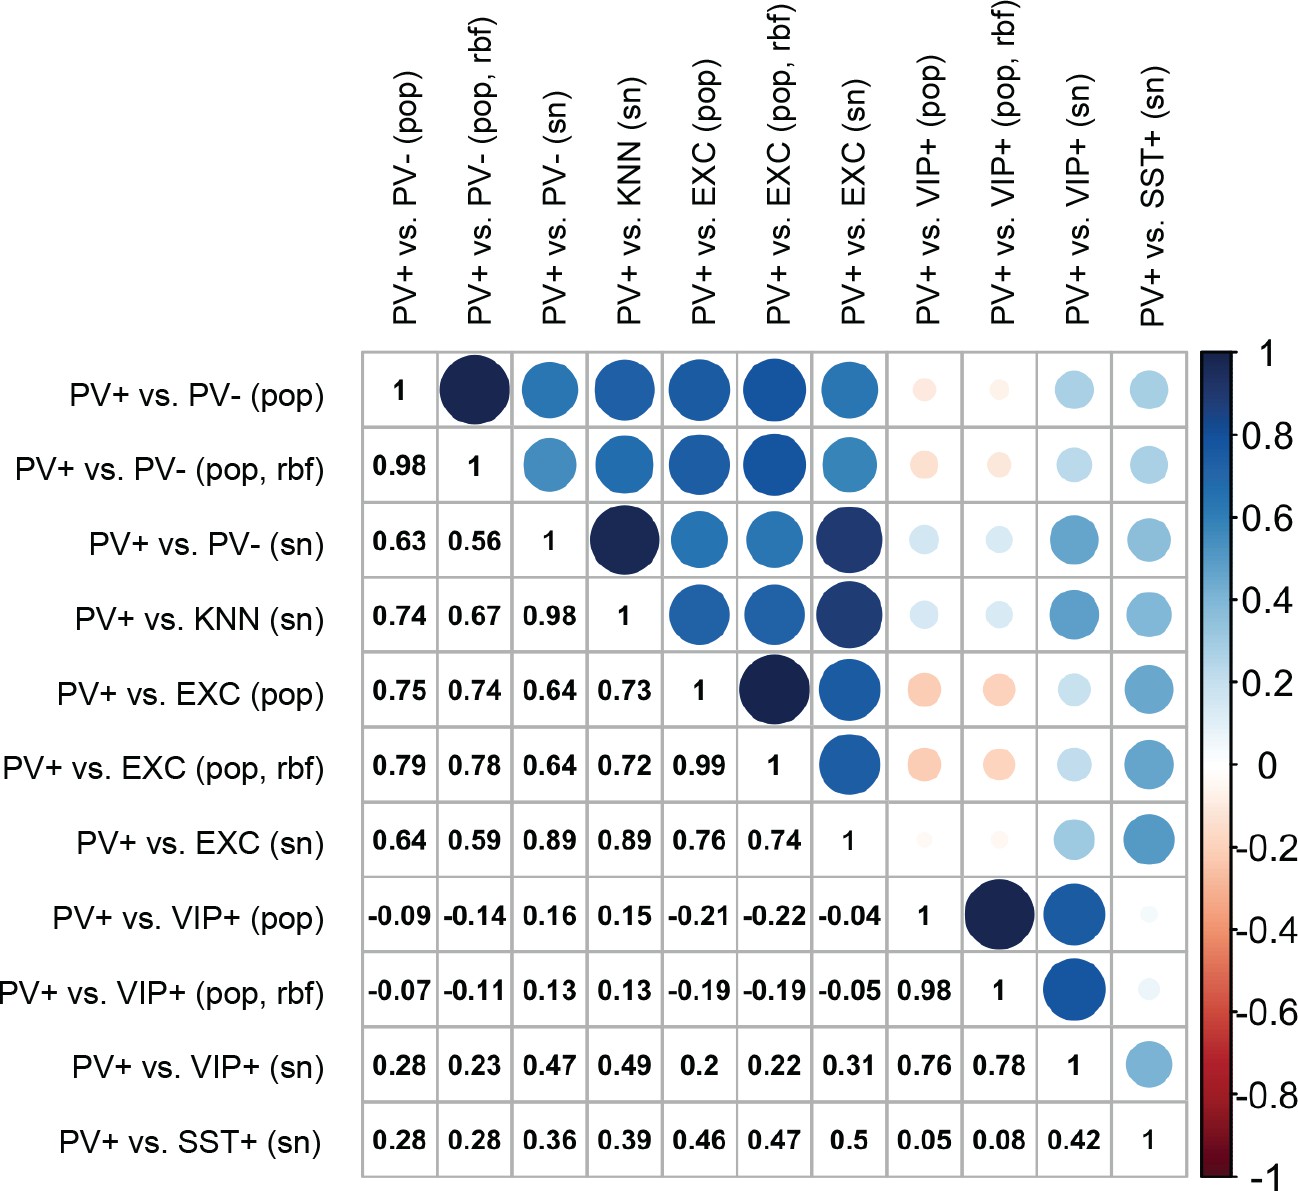
Pearson correlations of enhancer scores between support vector machines (SVMs).
The color and size of circles are proportional to the correlation coefficients, which are also listed in the lower triangle. Scores were evaluated on 33 enhancer sequences from Vormstein-Schneider et al., 2020.
Figure 1—figure supplement 5
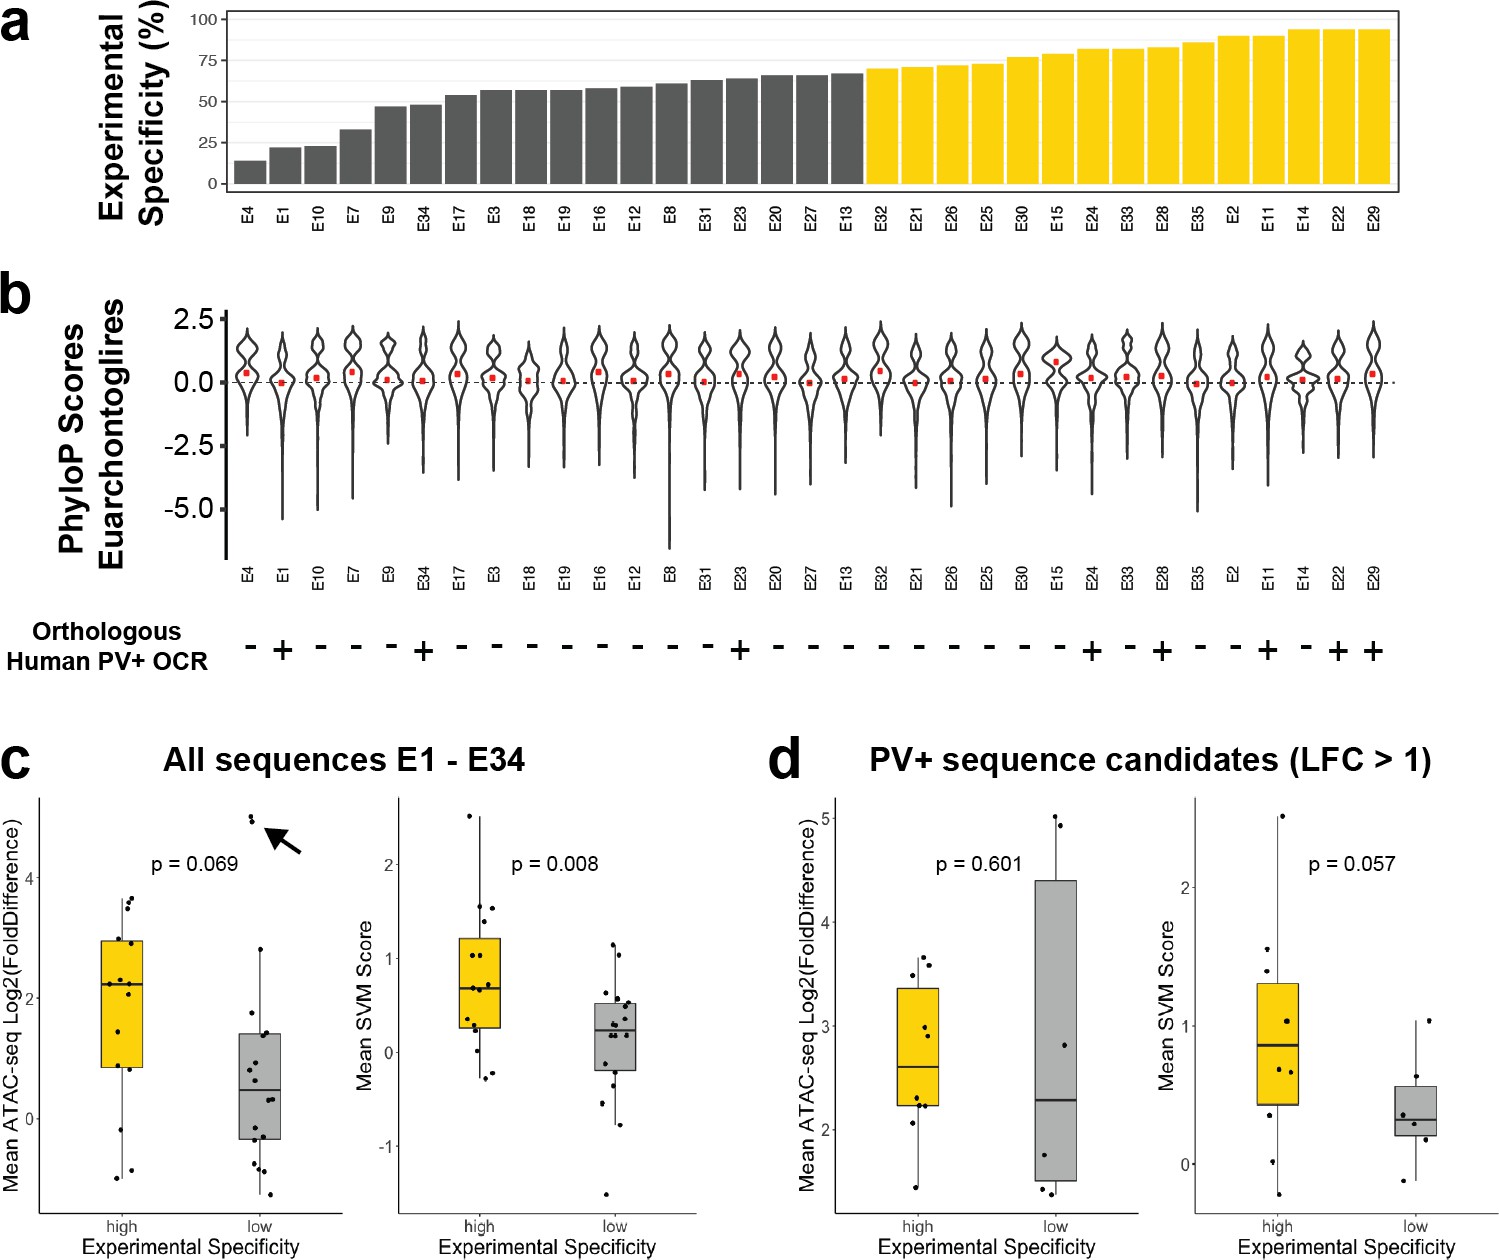
Comparison to alternative enhancer prioritization strategies.
(a) Previously reported experimental parvalbumin-expressing (PV+) neuron specificity of enhancer adeno-associated viruses (AAVs) E1–E34 grouped into low-specificity (gray, < 70%) or high-specificity (gold, > 70%) sets. (b) Distributions of phyloP conservation scores across EuarchontoGlires for nucleotides within enhancer regions. The median score per enhancer is shown by the red point. The bottom of the panel shows presence (+) or absence (-) of an overlapping human open chromatin region (OCR) from human Snare-seq data (Bakken et al., 2020). (c, d) Log2(FoldDifference) or mean support vector machine (SVM) scores of enhancers in the high-specificity and low-specificity groups. Panel (c) contains data from all enhancers in each set, while panel (d) shows the subset of enhancers with log 2 fold difference > 1. The p-values are from one-sided t-tests. The black arrow points to two outlier examples of false-positive probe candidates.
Figure 1—figure supplement 6
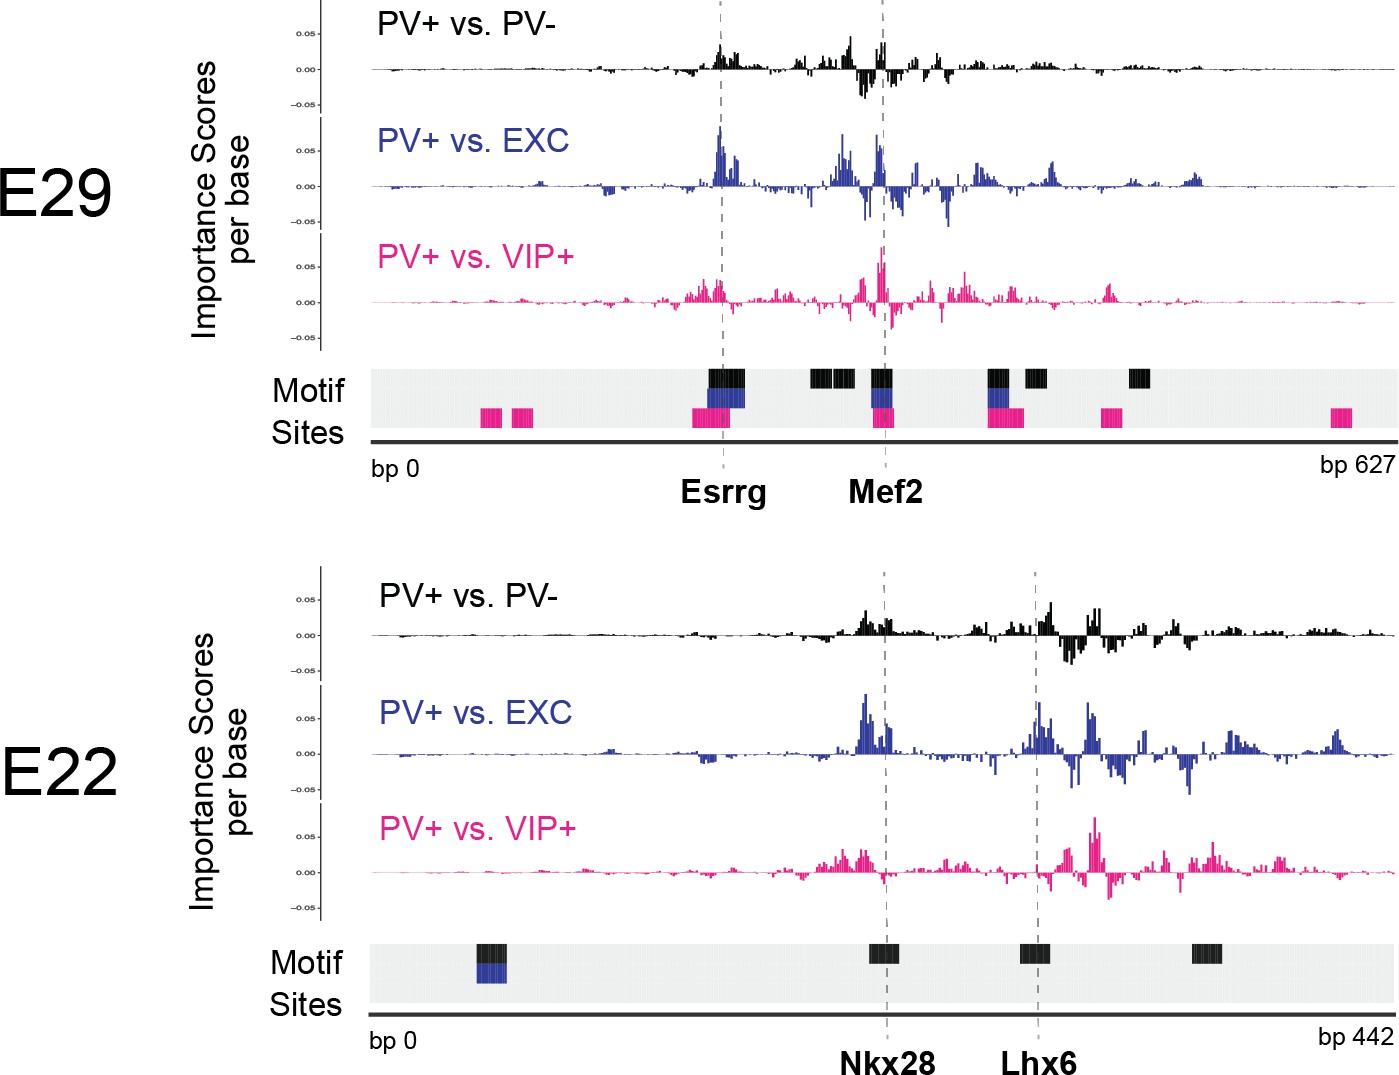
Interpretation of top external parvalbumin-expressing (PV+) adeno-associated virus (AAV) enhancer sequences.
Normalized importance scores per base of PV+ enhancer candidates E29 and E22 across linear, population-derived support vector machines (SVMs). The locations of TF-MoDISco motif sites are shown at the bottom of each panel.
Figure 2
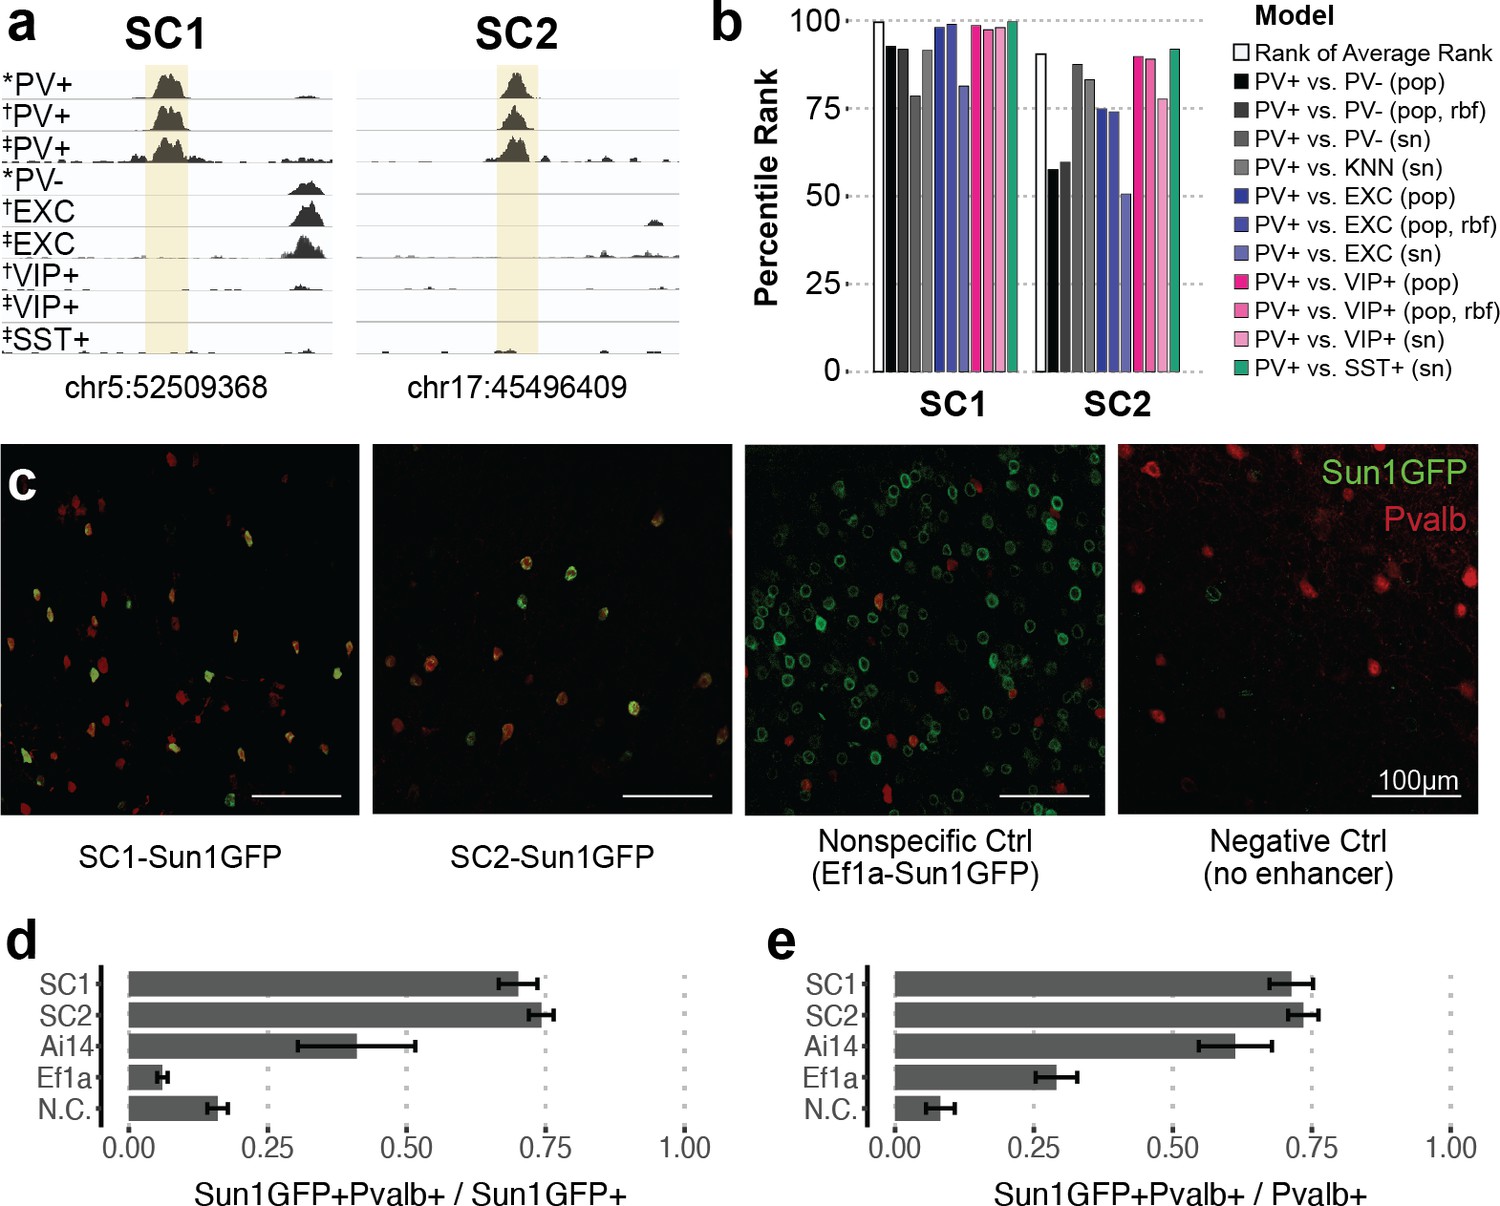
Two sequence candidates selectively activate adeno-associated virus (AAV) expression in parvalbumin-expressing (PV+) neurons.
(a) Genome browser visualization of PV+-specific ATAC-seq signal at sequence candidates SC1 and SC2. * cSNAIL data, † INTACT data from Mo et al., 2015, ‡ snATAC-seq from Li et al., 2021. (b) Percentile rank of support vector machine (SVM) scores among 1755 true PV+-specific enhancer sequence candidates that scored positively across all models. Linear population-derived models are denoted with ‘pop,’ nonlinear population-derived models are denoted with ‘pop, rbf,’ and linear single-nucleus-derived models are denoted with ‘sn.’ (c) Example images of AAV Sun1GFP expression against parvalbumin (Pvalb) antibody staining. (d, e) Quantification of AAV Sun1GFP or Pvalb-2A-Cre/Ai14 reporter overlap with Pvalb+ cells. Bar heights represent the mean among images, and the error of the mean is shown. N cells = 1322 (SC1), 2570 (SC2), 1340 (Ai14), 2013 (Ef1a), and 504 (N.C.). N.C., negative control.
-
Figure 2—source data 1
Detailed information for 1755 experimental parvalbumin (PV)-enriched open chromatin regions (OCRs) with positive parvalbumin-expressing (PV+) model scores.
Genomic coordinates, peak log2 fold difference, adjusted p-value, support vector machine (SVM) scores, convolutional neural network (CNN) scores, snATAC-seq overlap, species conservation, and subcortical SVM scores are provided.
- https://cdn.elifesciences.org/articles/69571/elife-69571-fig2-data1-v1.xlsx
-
Figure 2—source data 2
Image quantification for Specific Nuclear-Anchored Independent Labeling (SNAIL) viruses or the Pvalb-2A-Cre mouse strain reporter with Pvalb immunohistochemistry.
- https://cdn.elifesciences.org/articles/69571/elife-69571-fig2-data2-v1.xlsx
Figure 3
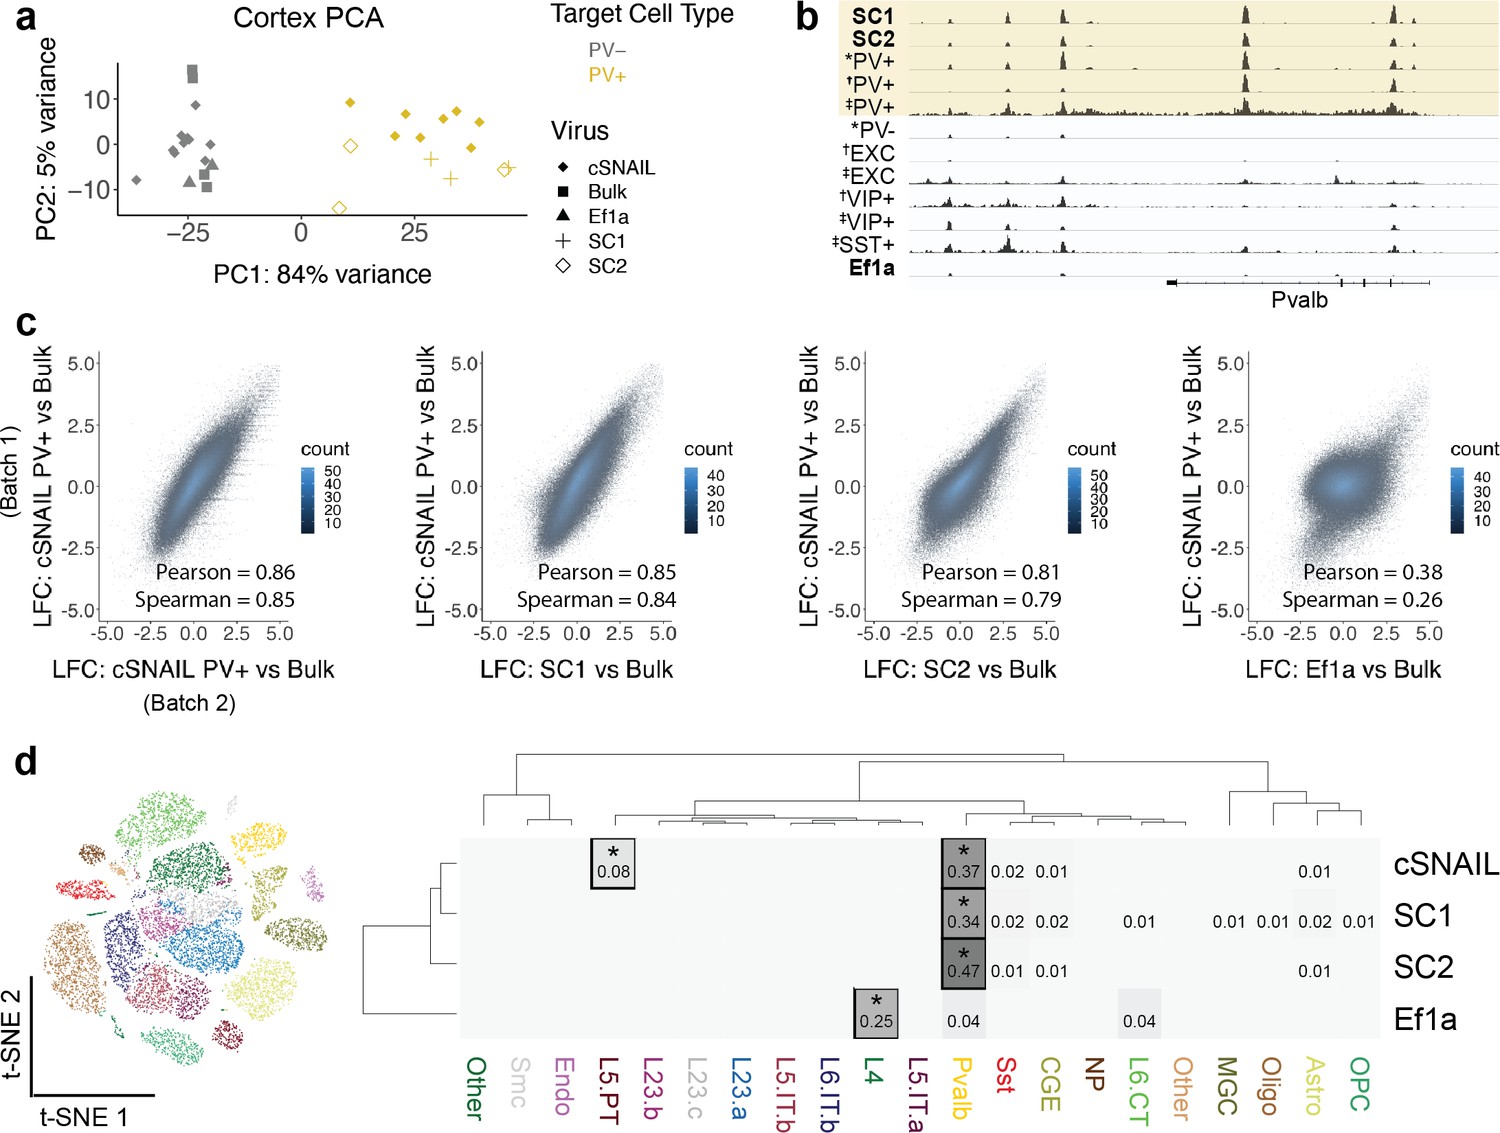
Cortical SC1 and SC2 Specific Nuclear-Anchored Independent Labeling (SNAIL)-isolated nuclei recapitulate parvalbumin-expressing (PV+) GABAergic interneuron ATAC-seq signatures.
(a) Principal component analysis (PCA) of ATAC-seq counts across samples. (b) Genome browser visualization of ATAC-seq signal at the Pvalb gene locus. Tracks represent the pooled sample p-value signal. Each track of similar data type is normalized to the same scale: SNAIL data range 0–335, *cSNAIL data range 0–93, †INTACT data range 0–200, ‡snATAC-seq data range 0–2. (c) Scatter plots of ATAC-seq log2 fold difference relative to bulk tissue ATAC-seq, comparing PV+ cSNAIL to other adeno-associated viruses (AAVs). The density of overlapping points is shown by the plot color. (d) snATAC-seq nuclei clusters as visualized by t-SNE. The dendrograms show hierarchical clustering of Euclidean sample distances by Ward’s minimum variance method D2. The heatmap shows the percentage of population open chromatin regions (OCRs) enriched relative to bulk that are also cluster-specific marker OCRs. *Hypergeometric enrichment p<0.01.
-
Figure 3—source data 1
Differential open chromatin region (OCR) statistics for parvalbumin-expressing (PV+) Specific Nuclear-Anchored Independent Labeling (SNAIL)-isolated cortical ATAC-seq relative to bulk tissue cortical ATAC-seq.
- https://cdn.elifesciences.org/articles/69571/elife-69571-fig3-data1-v1.xlsx
Figure 4 with 2 supplements
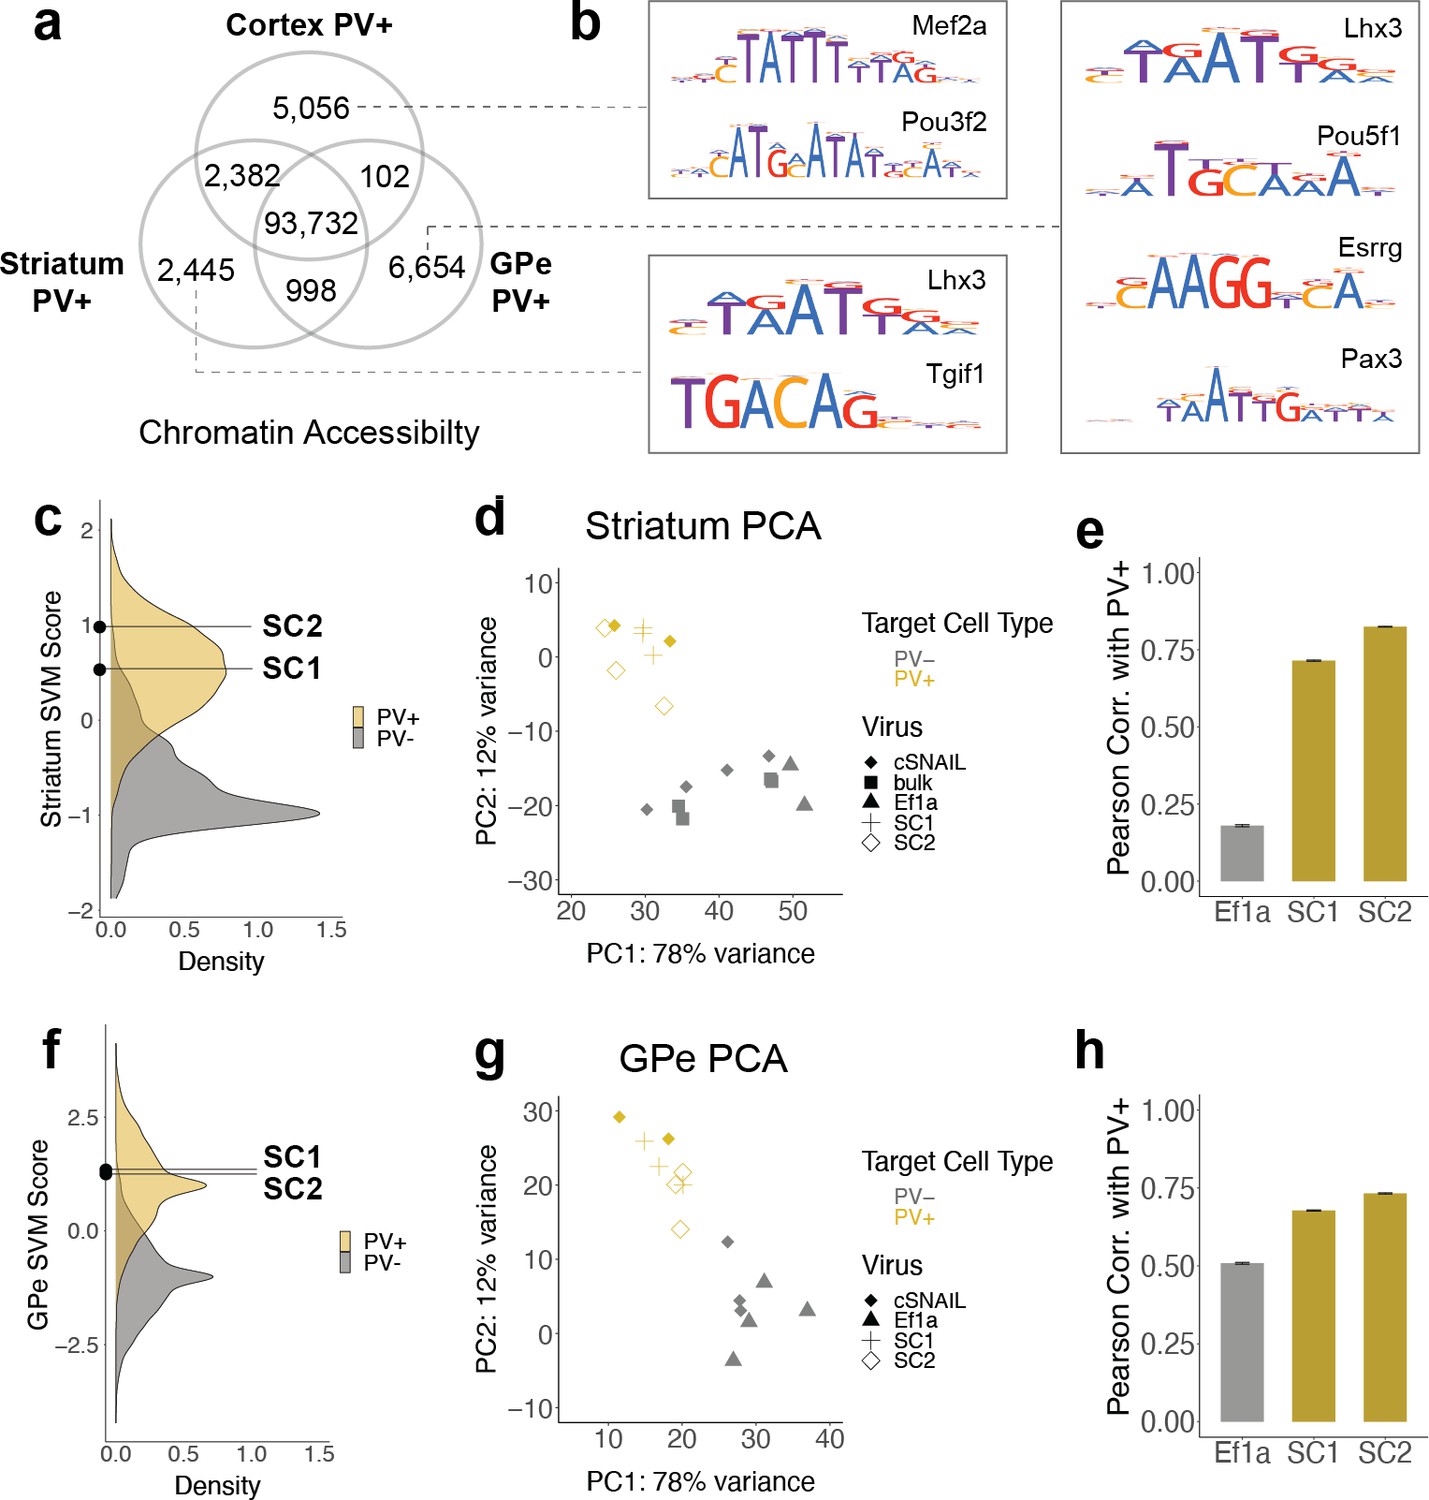
SC1 and SC2 generalize to parvalbumin-expressing (PV+) neurons in the striatum and external globus pallidus (GPe).
(a) Numbers of differential open chromatin regions (OCRs) between PV+ neuron populations in three brain regions (DESeq2 padj<0.01 and |log2FoldDifference| > 1). Brain region-specific OCRs are those that were significantly enriched in that tissue relative to each of the other two tissues. OCRs shared between two brain regions on the Venn diagram are those that were significantly enriched in each of those tissues relative to the excluded tissue. The shared center of the Venn diagram shows all remaining OCRs that have ambiguous or no tissue preference. (b) Examples of enriched motifs in brain region-specific PV+ open chromatin relative to all PV+ open chromatin. (c, f) Distributions of validation data support vector machine (SVM) scores and SC1 and SC2 scores within striatum and GPe PV+ vs. PV- models. (d, g) Principal component analysis (PCA) visualization of ATAC-seq counts in each sample. (e, h) Pearson correlation coefficients when comparing the log2 fold difference of cSNAIL PV+ ATAC-seq relative to bulk tissue ATAC-seq and the log2 fold difference of SNAIL ATAC-seq relative to bulk tissue ATAC-seq. Error bars show the 95% confidence intervals.
-
Figure 4—source data 1
Differential open chromatin region (OCR) statistics for tissue-specific parvalbumin-expressing (PV+) neuron OCRs in cortex, striatum, and external globus pallidus (GPe).
- https://cdn.elifesciences.org/articles/69571/elife-69571-fig4-data1-v1.xlsx
-
Figure 4—source data 2
Motif enrichments among tissue-specific parvalbumin-expressing (PV+) neuron open chromatin region (OCR) sequences.
- https://cdn.elifesciences.org/articles/69571/elife-69571-fig4-data2-v1.xlsx
-
Figure 4—source data 3
Pathway enrichments among tissue-specific parvalbumin-expressing (PV+) neuron open chromatin region (OCR) sequences.
- https://cdn.elifesciences.org/articles/69571/elife-69571-fig4-data3-v1.xlsx
-
Figure 4—source data 4
Differential open chromatin region (OCR) statistics for parvalbumin-expressing (PV+) Specific Nuclear-Anchored Independent Labeling (SNAIL)-isolated striatal ATAC-seq relative to bulk tissue striatal ATAC-seq.
- https://cdn.elifesciences.org/articles/69571/elife-69571-fig4-data4-v1.xlsx
-
Figure 4—source data 5
Differential open chromatin region (OCR) statistics for parvalbumin-expressing (PV+) Specific Nuclear-Anchored Independent Labeling (SNAIL)-isolated external globus pallidus (GPe) ATAC-seq relative to PV- GPe ATAC-seq.
- https://cdn.elifesciences.org/articles/69571/elife-69571-fig4-data5-v1.xlsx
Figure 4—figure supplement 1
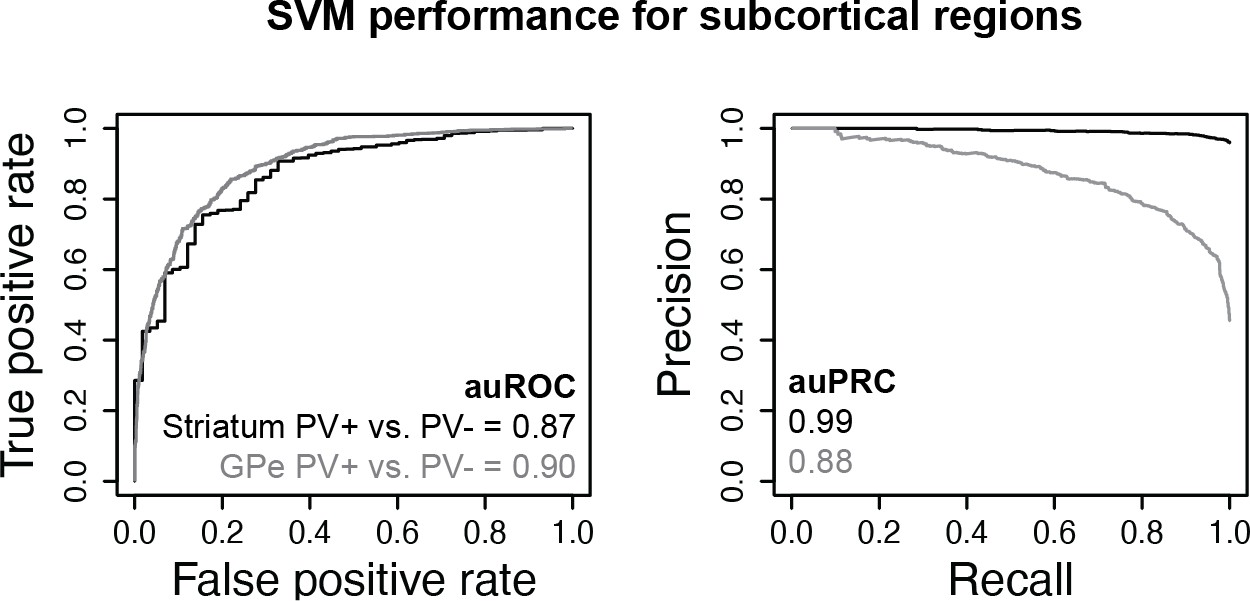
Subcortical parvalbumin (PV)+ vs. PV- support vector machines (SVMs).
Receiver operator curve (ROC) and precision-recall curve (PRC) performance metrics on held-out test sequences are shown.
Figure 4—figure supplement 2
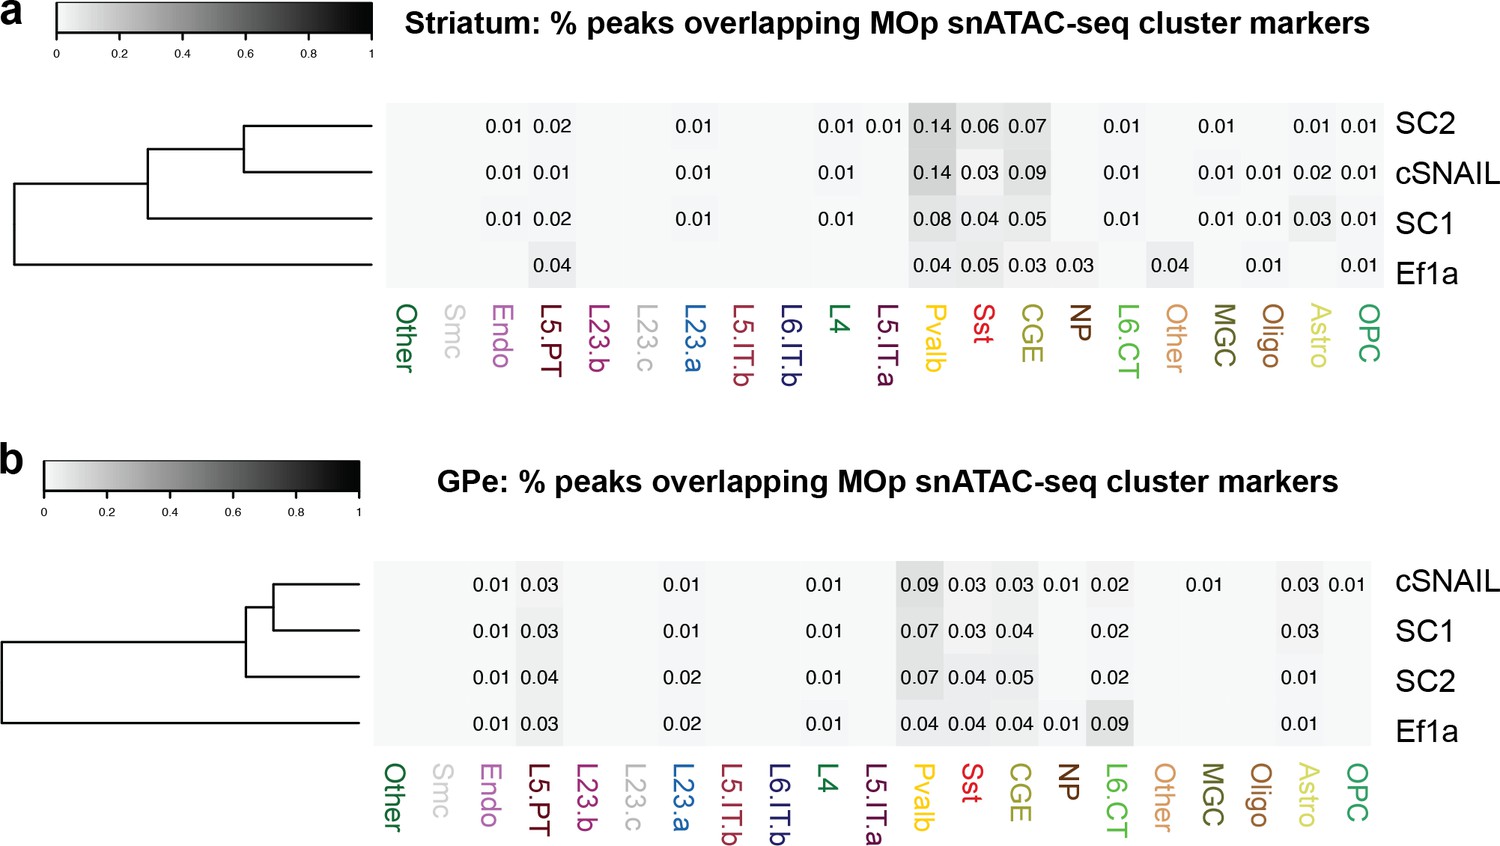
Comparison of subcortical SC1 and SC2-labeled populations with cortical snATAC-seq cluster markers.
Figure 5
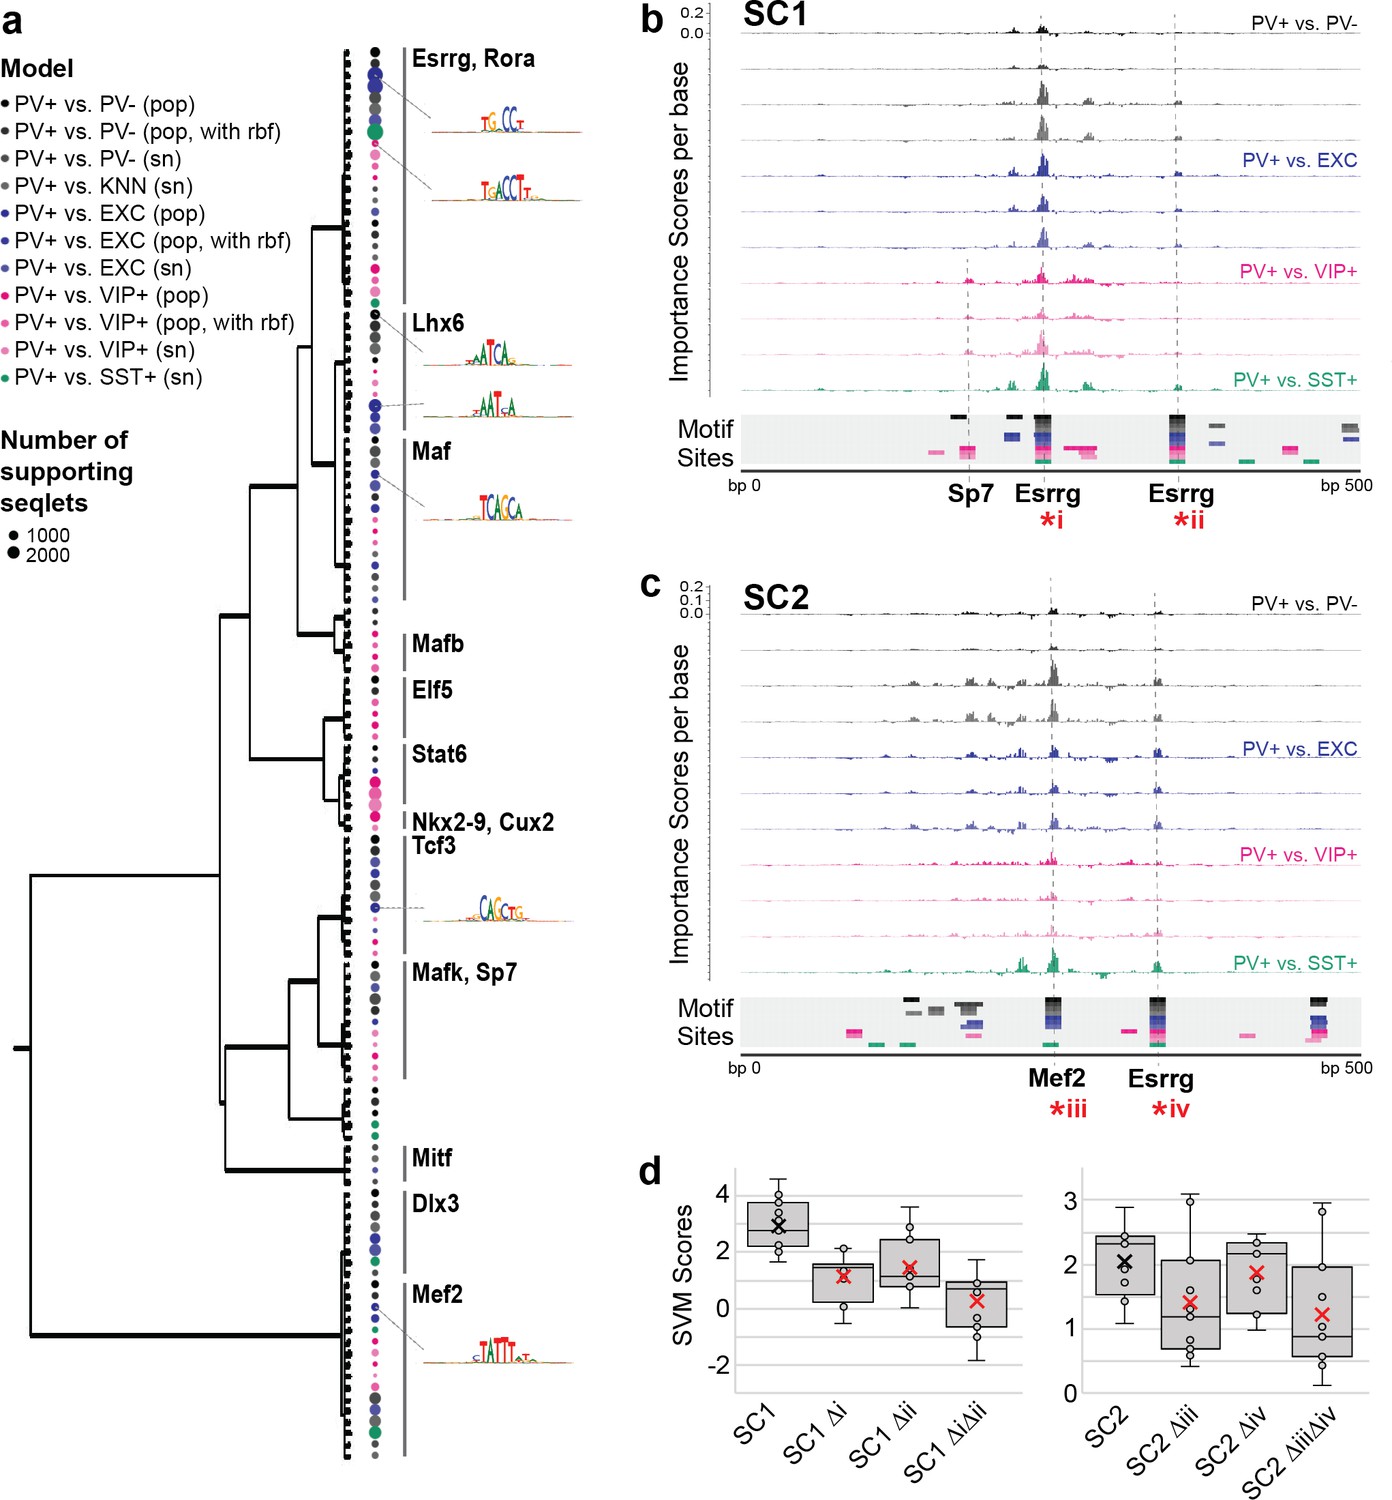
Motif interpretation of parvalbumin-expressing (PV+) neuron-specific open chromatin region (OCR) activity.
(a) Motifs with high contributions to PV+ scores in each support vector machine (SVM), clustered by sequence similarity. The bubble color at each node shows the model that motif was discovered in and the size of the bubble shows the number of seqlets supporting that motif. Clusters are labeled by the clade majority best match for known transcription factor binding motifs. The full list of matches can be found in Figure 5—source data 1. (b, c) Normalized importance of each base in SC1 (b) and SC2 (c) sequences for their PV+-specific scores in each SVM. Locations with sequence matches for identified motifs in each SVM (from panel a) are shown at the bottom. (d) Predicted impacts of motif scrambling on PV+ specificity. Motif mutation sites are shown with asterisks in panels (a) and (b). Each point is the sequence score from one SVM and ‘x’ is the mean.
-
Figure 5—source data 1
Association of TF-MoDISco motifs to known transcription factor binding motifs.
- https://cdn.elifesciences.org/articles/69571/elife-69571-fig5-data1-v1.xlsx
-
Figure 5—source data 2
Identification of motif sites within SC1 and SC2.
- https://cdn.elifesciences.org/articles/69571/elife-69571-fig5-data2-v1.xlsx
-
Figure 5—source data 3
Normalized per-base importance scores for SC1 and SC2 sequences.
- https://cdn.elifesciences.org/articles/69571/elife-69571-fig5-data3-v1.xlsx
Figure 6
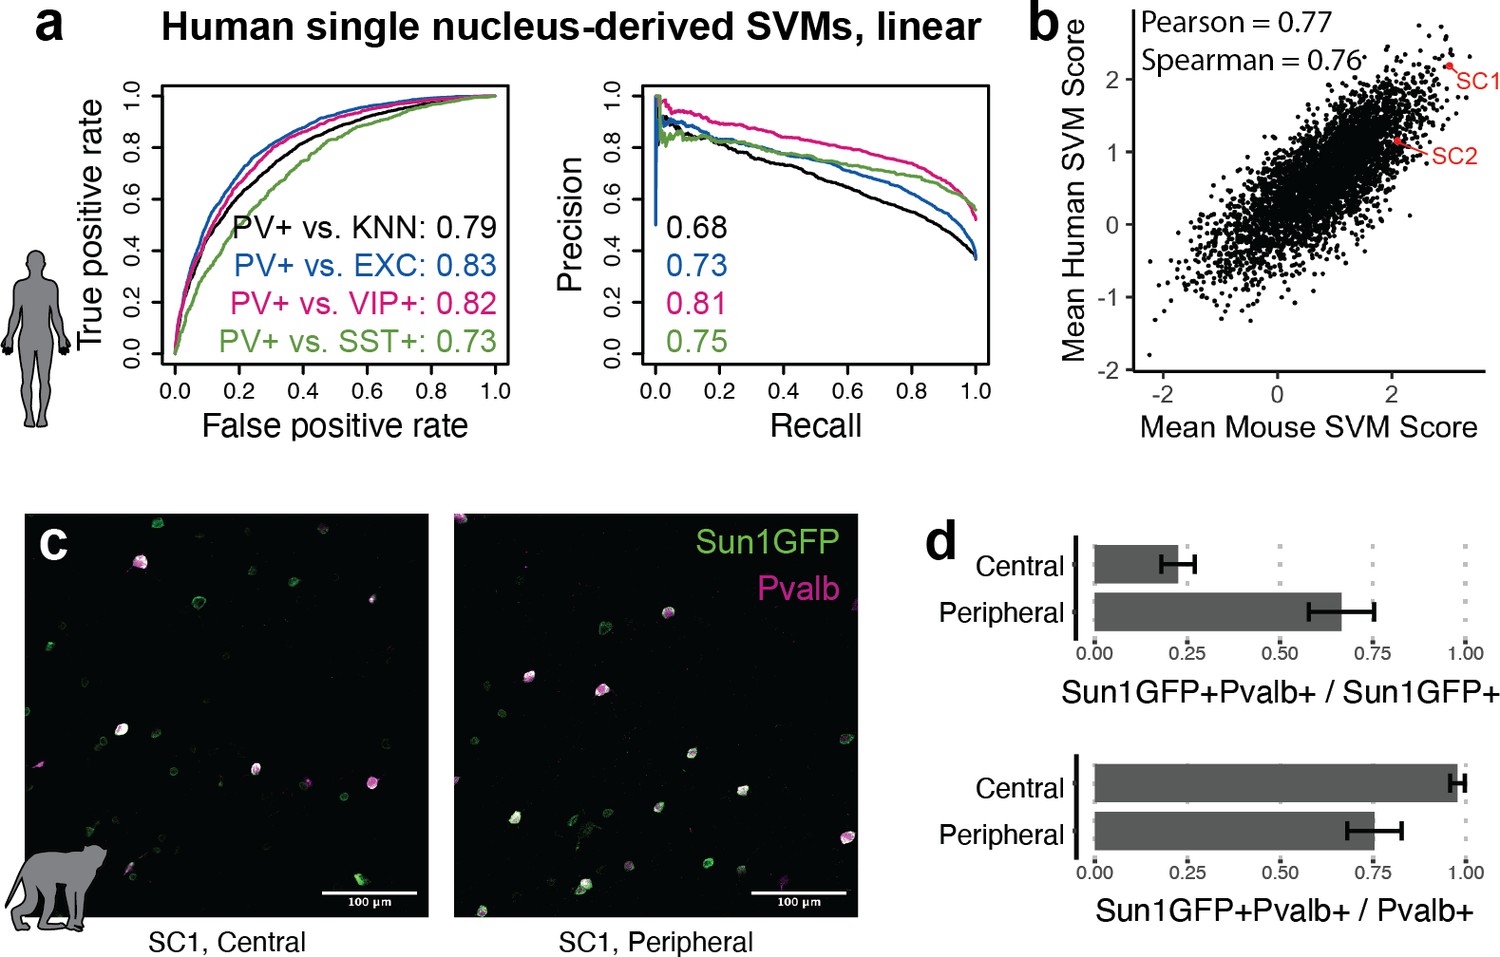
Extensions of Specific Nuclear-Anchored Independent Labeling (SNAIL) technologies in primates.
(a) Receiver operator characteristic and precision-recall performance metrics for parvalbumin-expressing (PV+) support vector machines (SVMs) derived from single-nucleus chromatin accessibility assays of human cortical tissue. The reported numbers are the areas under the curve for each model. (b) Comparison of mouse PV+ open chromatin sequences scored by mouse and human SVMs. Axes are the mean SVM scores among the 11 mouse SVMs or 4 human SVMs. (c) Images of SC1 AAV activation in the rhesus macaque cortex. (d) Quantification of SC1 and Pvalb antibody staining in the macaque cortex. Image sets near the center or peripheral of the injection site were quantified separately.
Tables
Key resources table
| Reagent type (species) or resource | Designation | Source or reference | Identifiers | Additional information |
|---|---|---|---|---|
| Strain, strain background (Mus musculus) | Pvalb-2A-Cre | Jackson Laboratories | Stock # 012358 | B6.Cg-Pvalbtm1.1(cre)Aibs |
| Strain, strain background (M. musculus) | Ai14 | Jackson Laboratories | Stock # 007914 | B6.Cg-Gt(ROSA)26Sortm14(CAG-tdTomato)Hze/J |
| Recombinant DNA reagent | pAAV-Ef1a-DIO-Sun1GFP-WPRE-pA | Addgene | Plasmid #160141 | cSNAIL vector from Lawler et al., 2020 |
| Recombinant DNA reagent | pAAV-Ef1a-Sun1GFP-WPRE-pA | This paper | Ef1a vector (+ control) | |
| Recombinant DNA reagent | pAAV-SC1-Sun1GFP-WPRE-pA | This paper | SC1 vector targeting PV+ neuron expression | |
| Recombinant DNA reagent | pAAV-SC2-Sun1GFP-WPRE-pA | This paper | SC2 vector targeting PV+ neuron expression | |
| Recombinant DNA reagent | pAAV-neg-Sun1GFP-WPRE-pA | This paper | Negative control vector | |
| Antibody | Anti-Pvalb (rabbit polyclonal) | Swant | Cat# PV27 | IF (1:750) |
| Antibody | Anti-Pvalb (mouse monoclonal) | Swant | Cat# 235 | IF (1:1000) |
| Antibody | Anti-GFP (rabbit polyclonal) | Invitrogen | Cat# A-11122 | IF (1:1000) |
| Antibody | Anti-GFP (rabbit monoclonal) | Invitrogen | Cat# G10362 | Affinity purification (1:150) |
| Software, algorithm | ls-gkm | Lee, 2016 | https://github.com/Dongwon-Lee/lsgkm | SVM training |
| Software, algorithm | Keras | https://keras.io | CNN training |
Additional files
-
Supplementary file 1
Sample metadata information.
- https://cdn.elifesciences.org/articles/69571/elife-69571-supp1-v1.xlsx
-
Transparent reporting form
- https://cdn.elifesciences.org/articles/69571/elife-69571-transrepform1-v1.pdf
Download links
A two-part list of links to download the article, or parts of the article, in various formats.
Downloads (link to download the article as PDF)
Open citations (links to open the citations from this article in various online reference manager services)
Cite this article (links to download the citations from this article in formats compatible with various reference manager tools)
Machine learning sequence prioritization for cell type-specific enhancer design
eLife 11:e69571.
https://doi.org/10.7554/eLife.69571


