Environmental selection overturns the decay relationship of soil prokaryotic community over geographic distance across grassland biotas
- College of Resources and Environment, University of Chinese Academy of Sciences, China
- Yanshan Earth Critical Zone National Research Station, University of Chinese Academy of Sciences, China
- Key Laboratory of Adaptation and Evolution of Plateau Biota, Chinese Academy of Sciences, China
- College of Life Sciences, University of Chinese Academy of Sciences, China
- State Key Laboratory of Remote Sensing Science, Aerospace Information Research Institute, Chinese Academy of Sciences, China
- Environmental Futures Research Institute, School of Environment and Science, Griffith University, Australia
- State Key Laboratory of Tibetan Plateau Earth System Science (LATPES), China
Figures
Figure 1 with 4 supplements

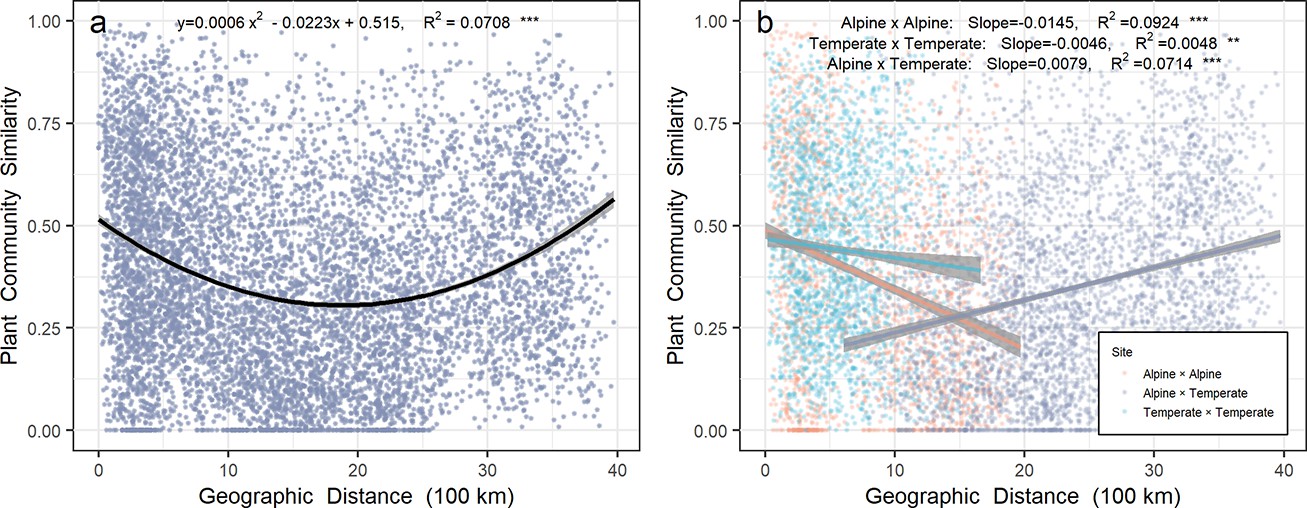
Relationship between prokaryotic community similarity over geographic distance in Chinese northern grassland.
Panels (a) and (c) represent the prokaryotic community in topsoil, while panels (b) and (d) represent the prokaryotic community in subsoil. Orange and light blue points represent pairwise sites within the alpine and temperate biota, respectively. Gray points represent pairwise sites between the alpine biota cross temperate biota. Gray shades stand for 95% confidence interval.
Figure 1—figure supplement 1
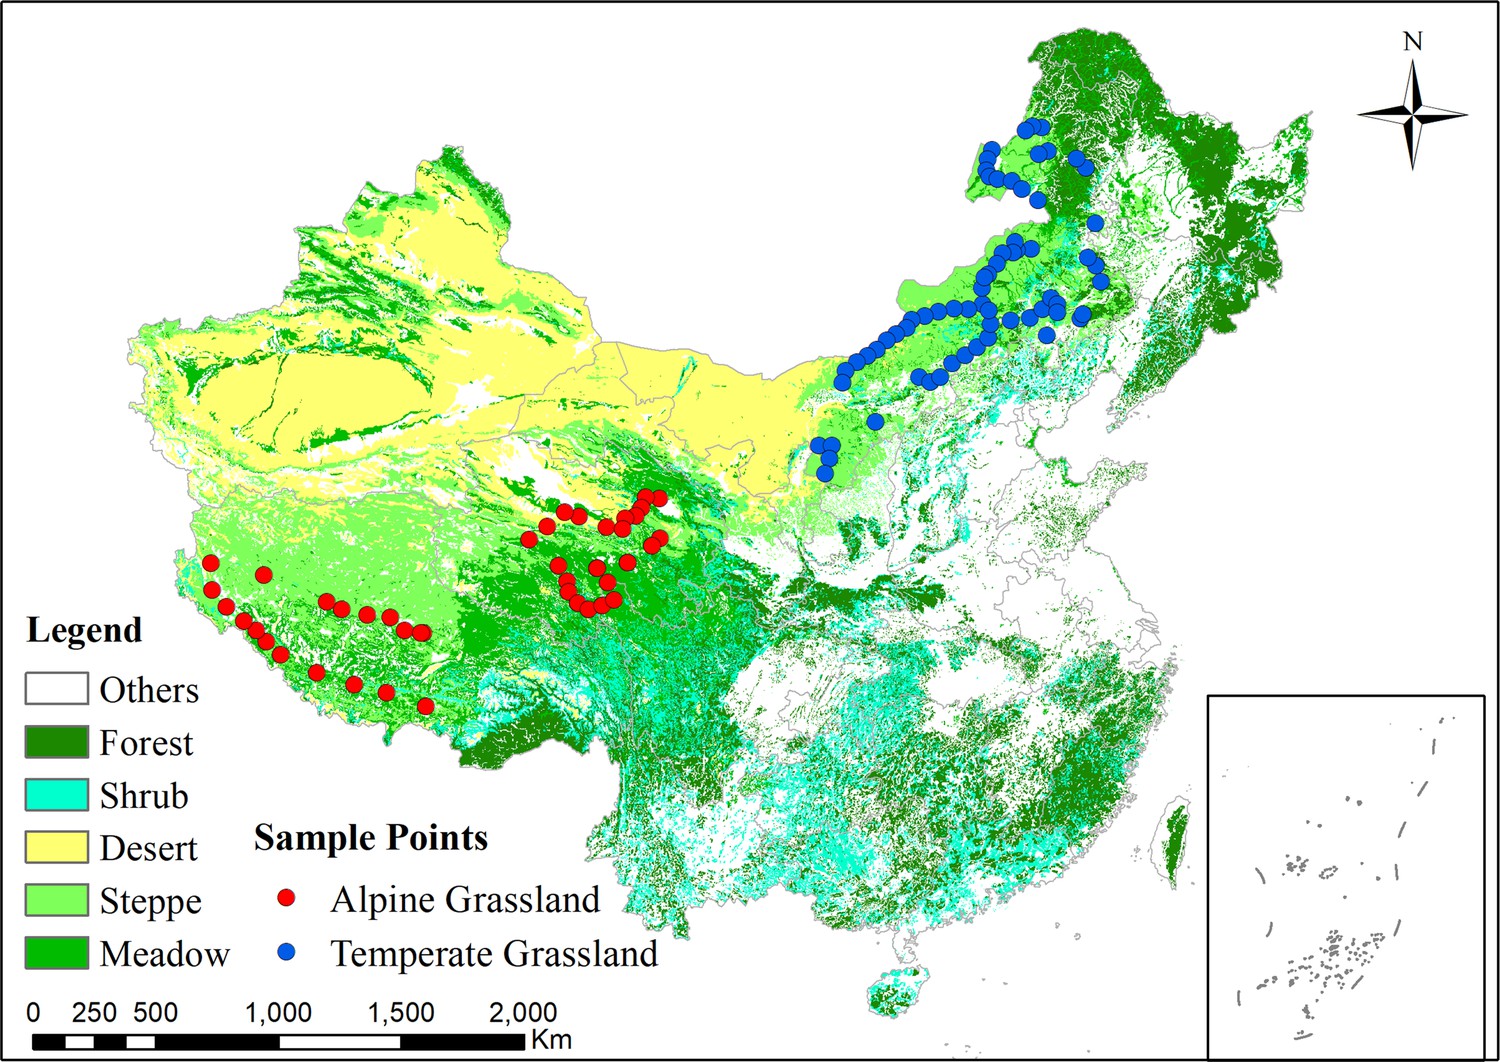
Sampling sites across 1921 km of the alpine grassland in Qinghai-Tibet Plateau (in red) and 1661 km of the temperate grassland in Inner Mongolia (in blue).
Figure 1—figure supplement 2
Relationship between plant community similarity over geographic distance in northern grassland of China.
Light blue points are for pairwise sites in the alpine grassland. Orange points are for pairwise sites in the temperate grassland. Gray points are for pairwise sites between the alpine grassland cross temperate grassland. Gray shades stand for 95% confidence interval.
Figure 1—figure supplement 3
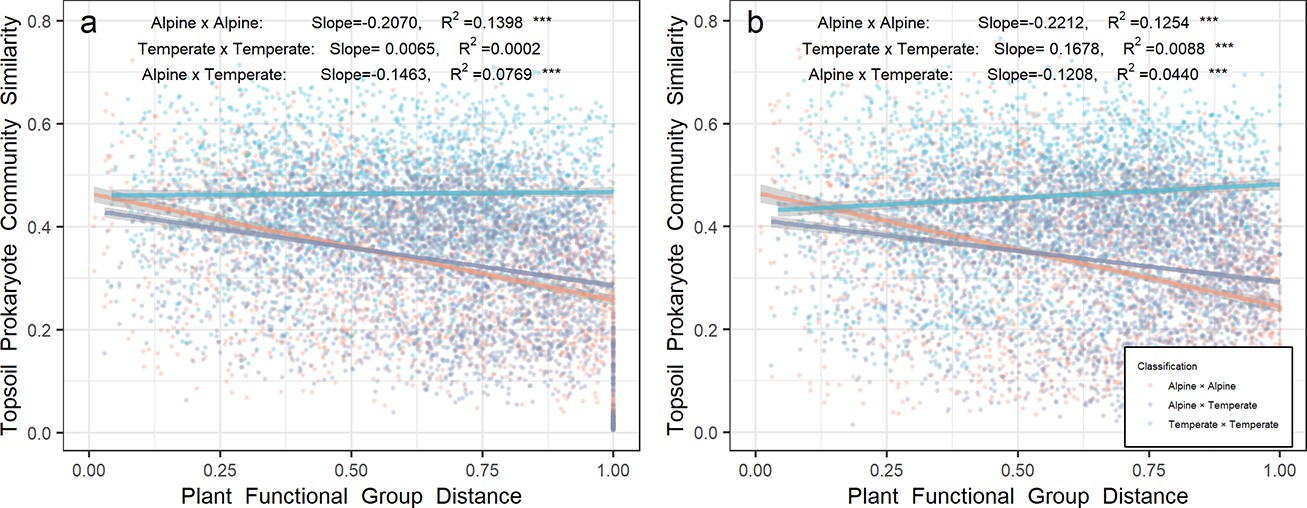
Relationship between prokaryote community over plant community dissimilarity.
(a) Topsoil; (b) subsoil. Light blue points are for pairwise sites in the alpine grassland. Orange points are for pairwise sites in the temperate grassland. Gray points are for pairwise sites between the alpine grassland cross temperate grassland. Gray shades stand for 95% confidence interval.
Figure 1—figure supplement 4
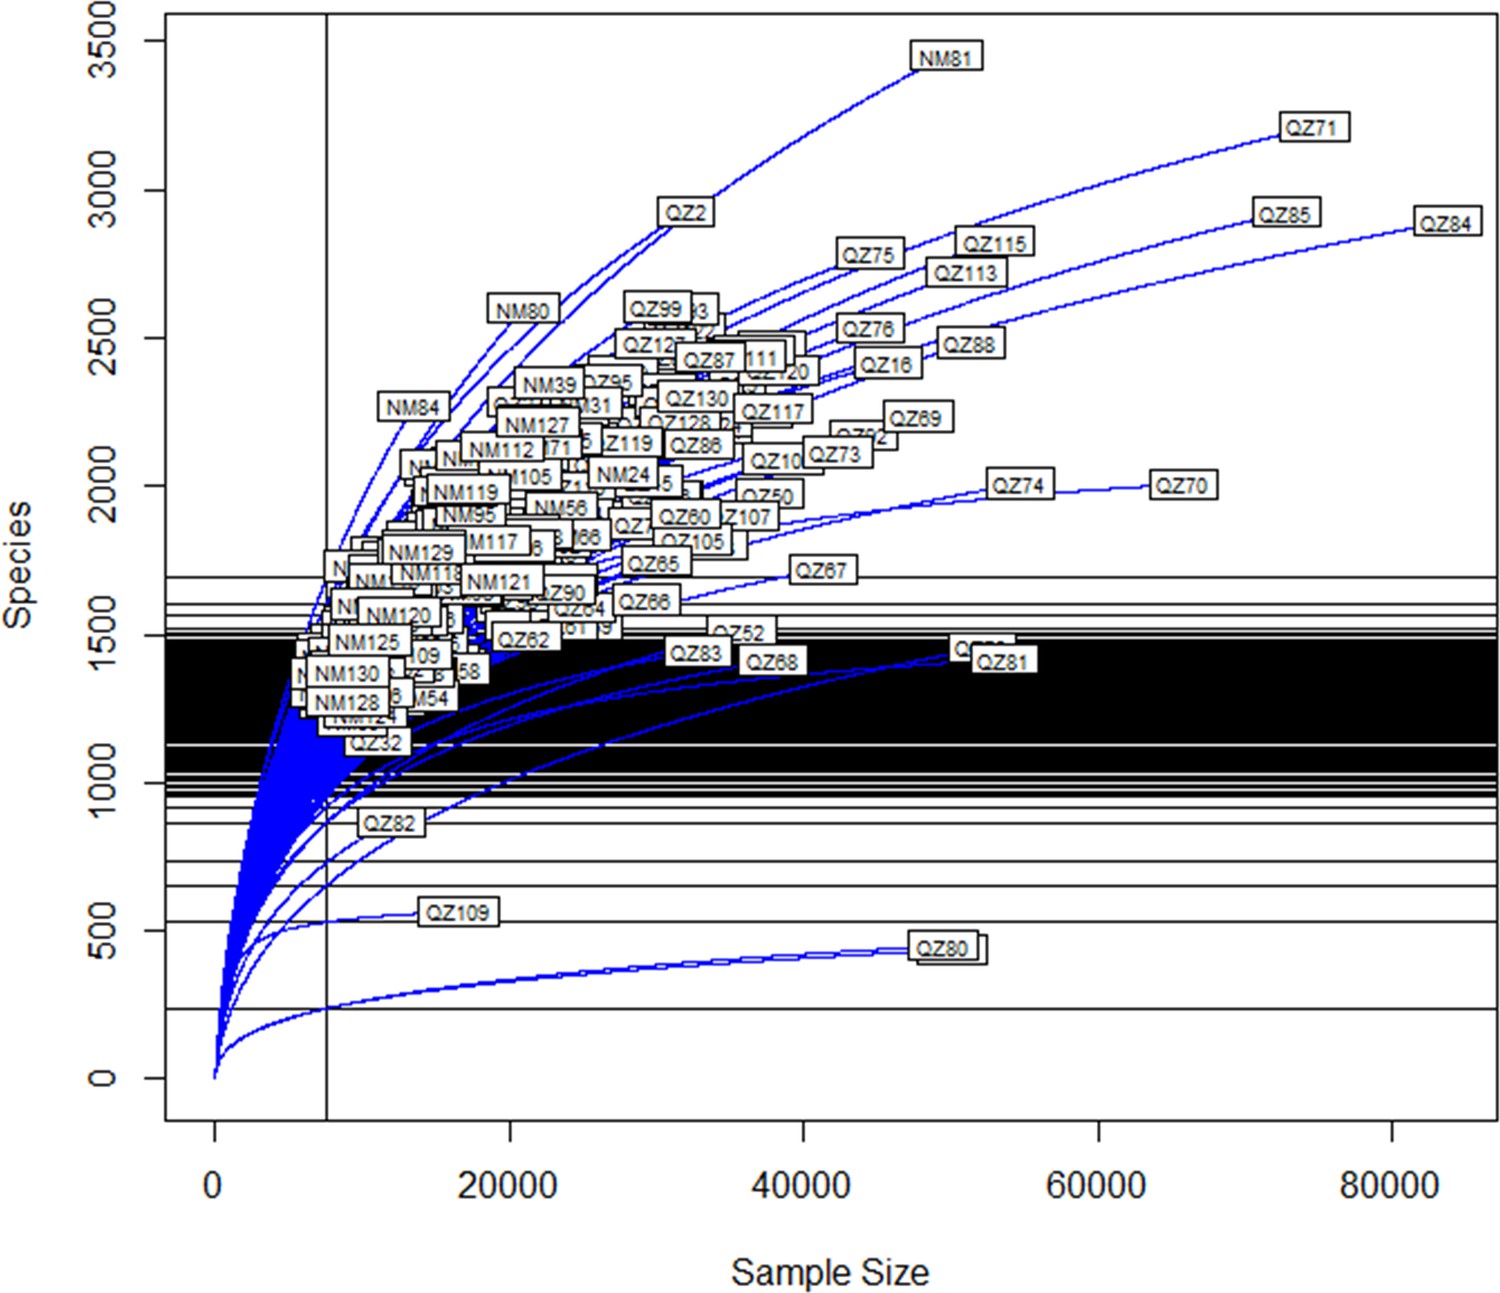
Rarefaction curve.
QZ stands for the sampling sites in the alpine grassland, and NM stands for the sampling sites in the temperate grassland.
Figure 2 with 1 supplement
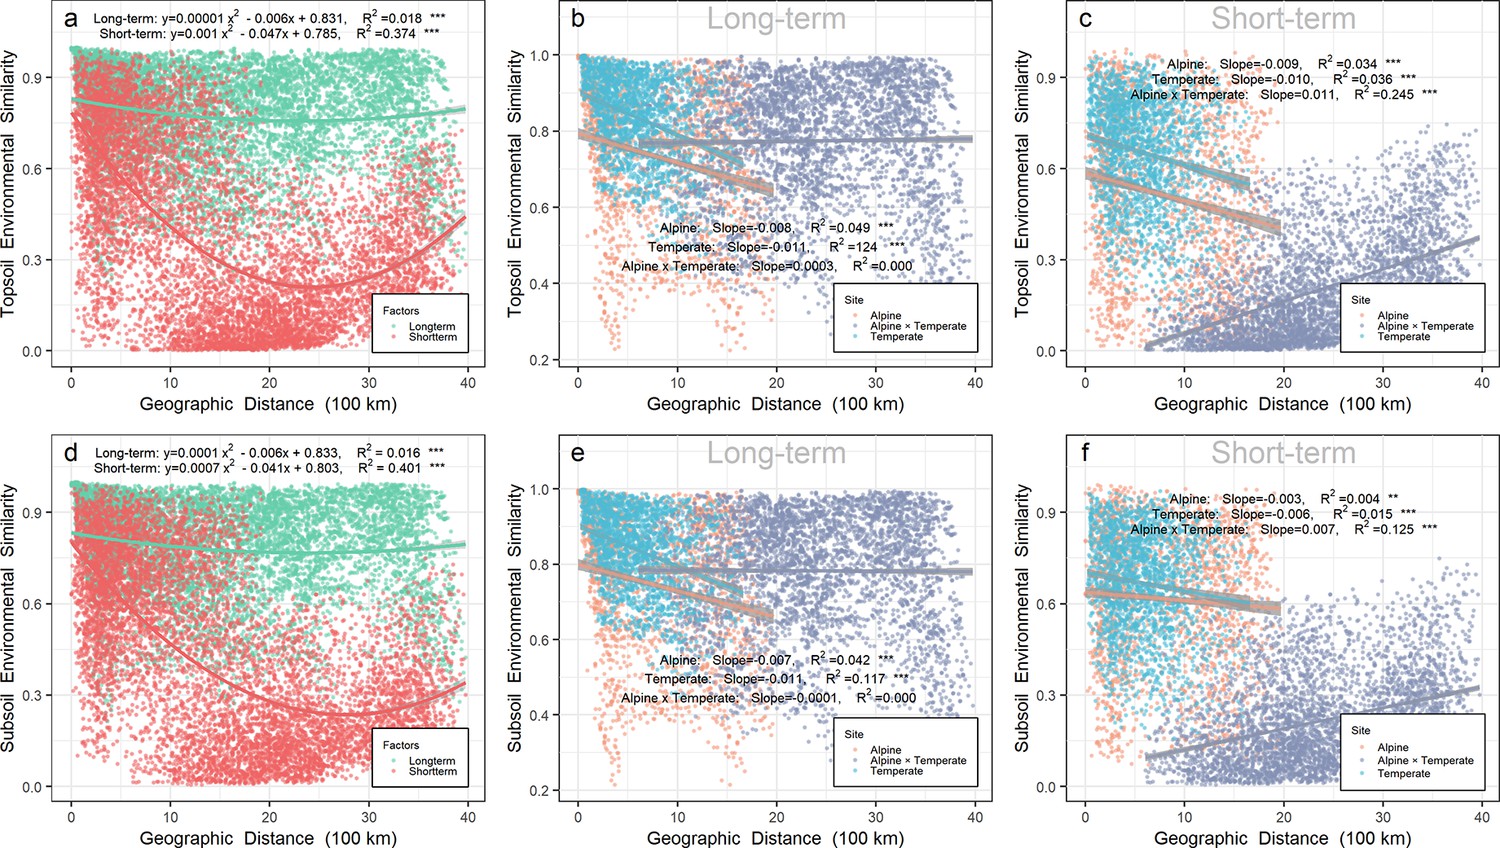
Relationship between environmental similarity over geographic distance in Chinese northern grassland.
Panels a, b, and c represent the environmental similarity in topsoil, while panels d, e, and f represent the environmental similarity in subsoil. The environmental similarity was calculated by Bray-Curtis index based on relatively long-term (b, e, and green points in a and d) or short-term variables (c, f, and red points in a and d). Relatively long-term environmental variables included mean annual precipitation (MAP), mean annual temperature (MAT), pH, soil organic carbon (SOC), soil total nitrogen (TN) and soil total phosphorus (TP). Relatively short-term environmental variables included soil water content (SWC), soil available phosphorus (AP), dissolved organic carbon (DOC), dissolved organic nitrogen (DON), NH4+, and NO3-. Orange, gray, and light blue points represent pairwise sites within the alpine biota, within temperate biota, and alpine biota cross temperate biota, respectively. Gray shades stand for 95% confidence interval.
Figure 2—figure supplement 1
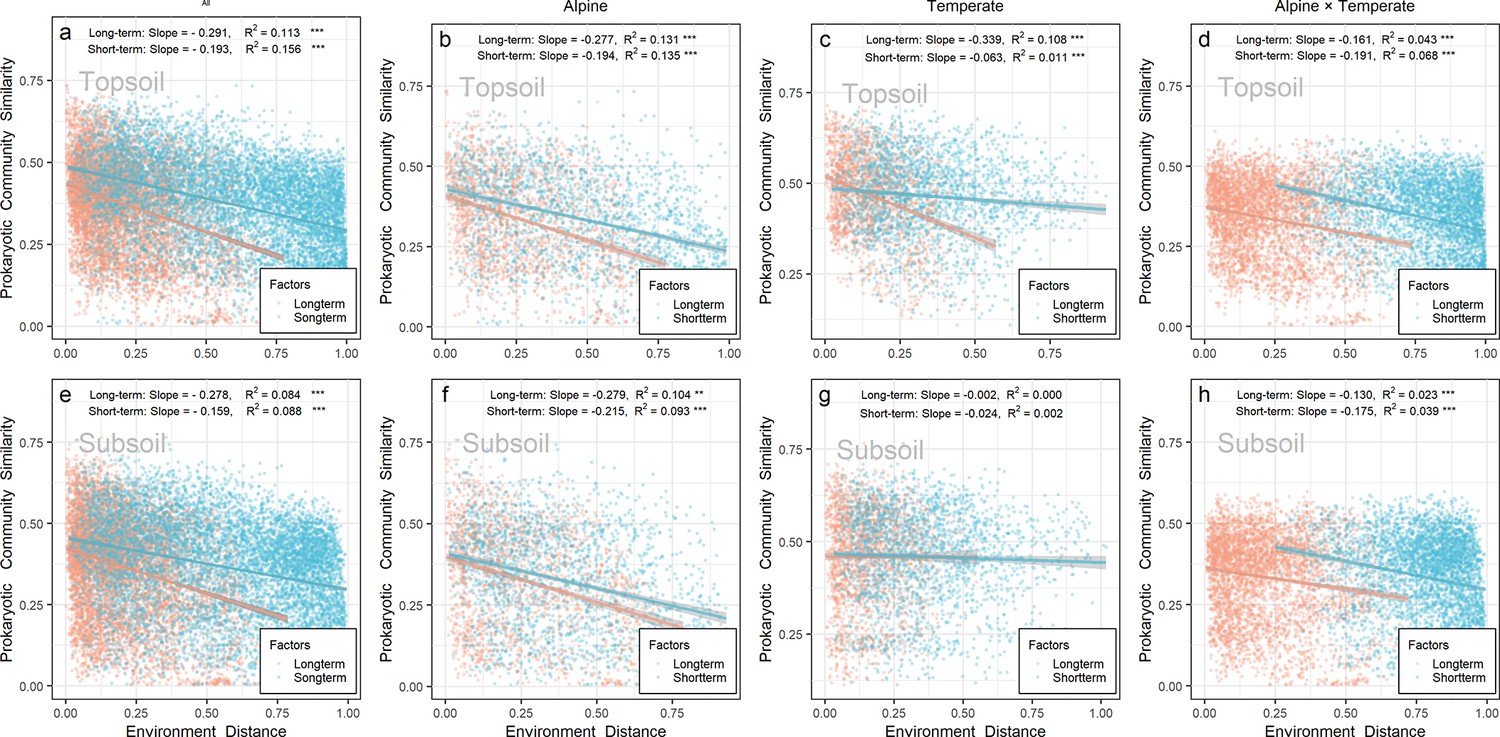
Distance-decay relationship for prokaryotic community similarity over relative long-term (orange points) and short-term (light blue points) environmental factors.
(a–d) Topsoil; (e–h) subsoil. Shades stand for 95% confidence interval.
Figure 3 with 2 supplements
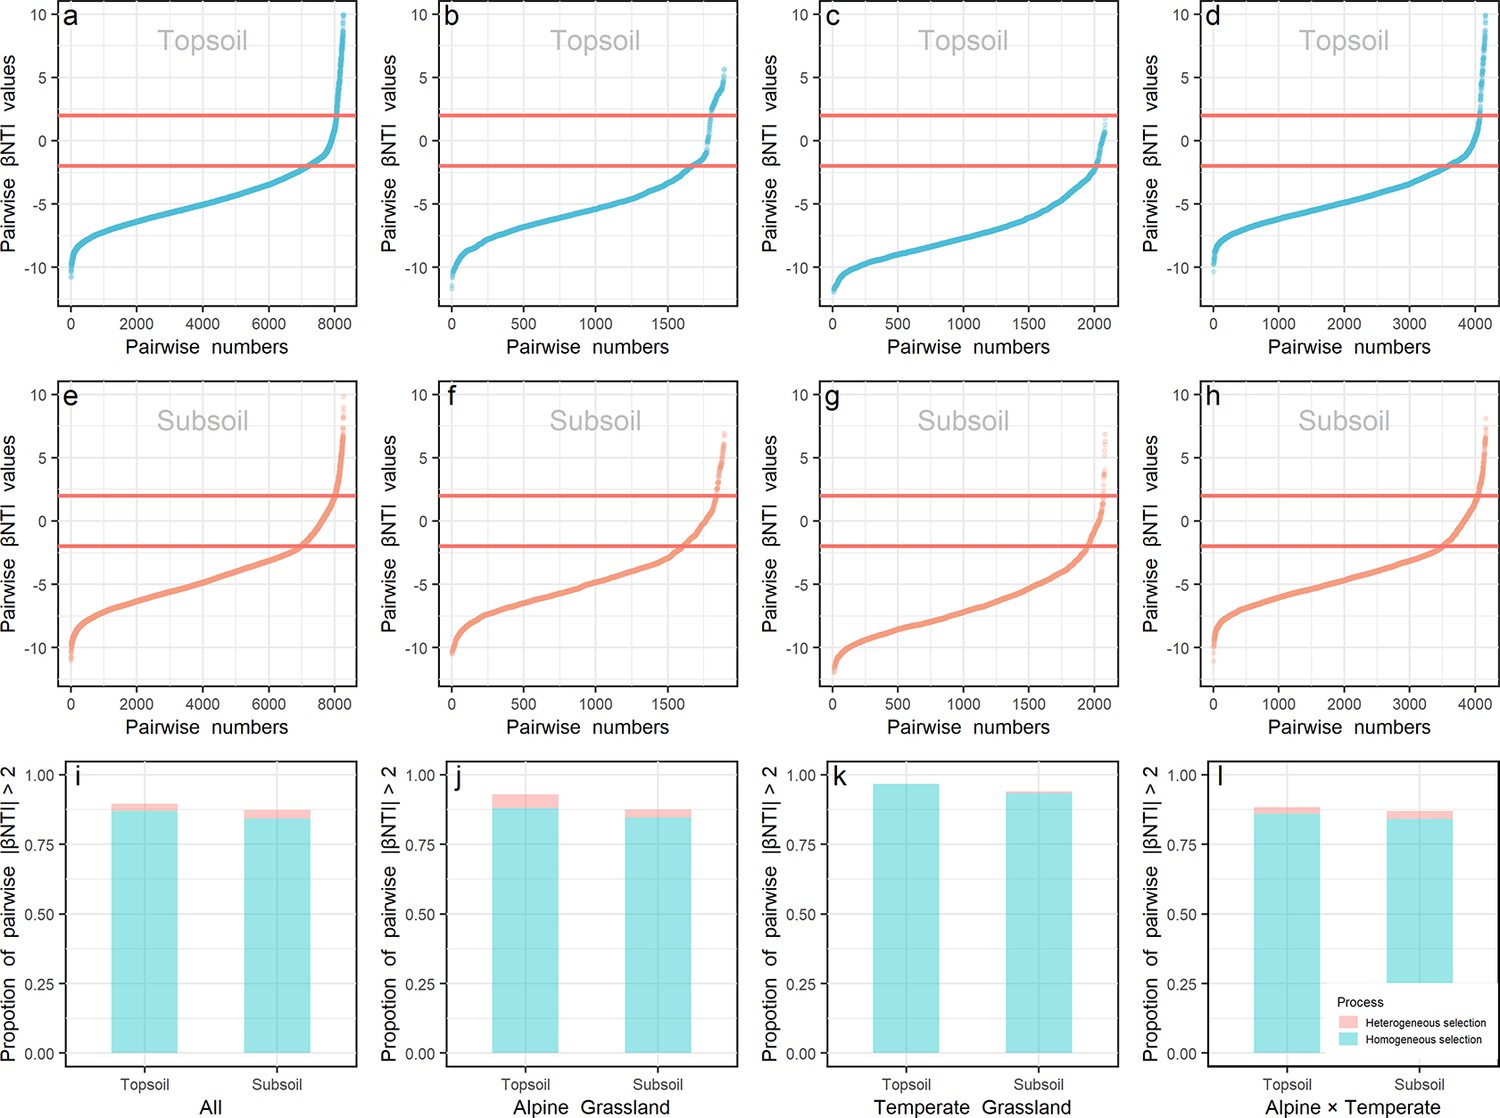
βNTI values.
βNTI values of prokaryote in the top- (a, b, c, and d) and subsoil (e, f, g, and h) from all sites (a and e), within alpine (b and f) or temperate biota (c and g), and pairwise sites in the alpine cross temperate biotas (d and h) were presented. The proportion of |βNTI| > 2 (deterministic processes) in the top- and subsoils from all sites (i), within alpine biota (j), within temperate biota (k) and pairwise sites in the alpine cross temperate biotas (l) were presented. Light blue and orange colors stand for βNTI values and their proportions in the top- and subsoils, respectively.
Figure 3—figure supplement 1
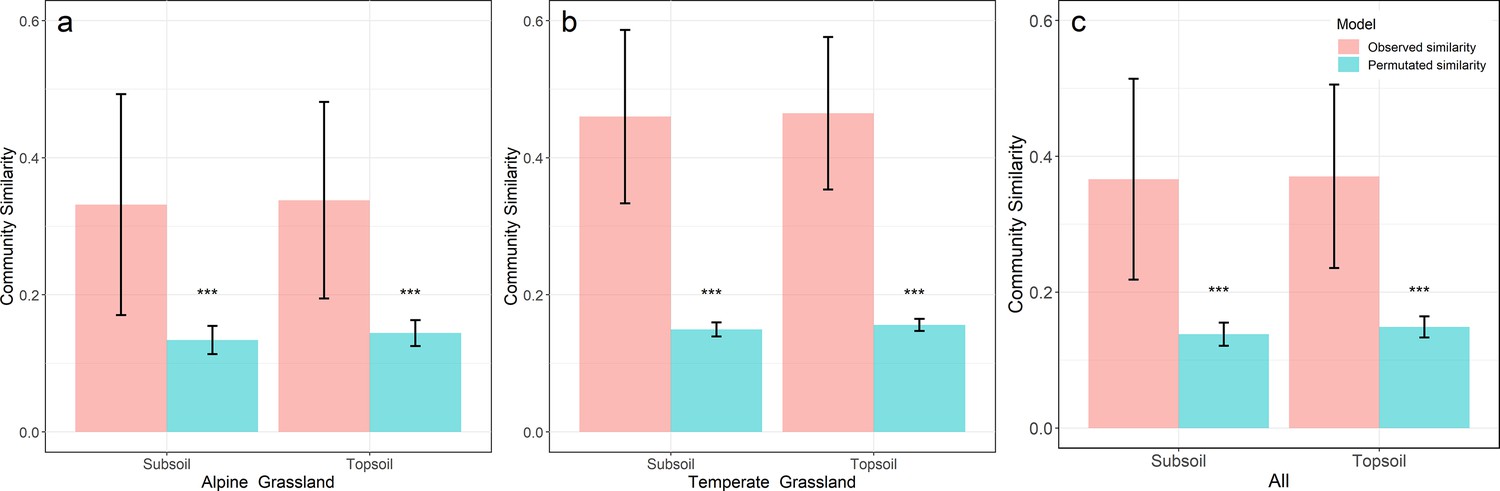
Null model analysis for community similarity.
The null model for soil prokaryotic community similarity from the alpine grassland (a), temperate grassland (b) and all sites (c). The pink and blue stand for observed similarity and permutated similarity by null model, respectively. ‘***’ stand for the significance at 0.001 level.
Figure 3—figure supplement 2
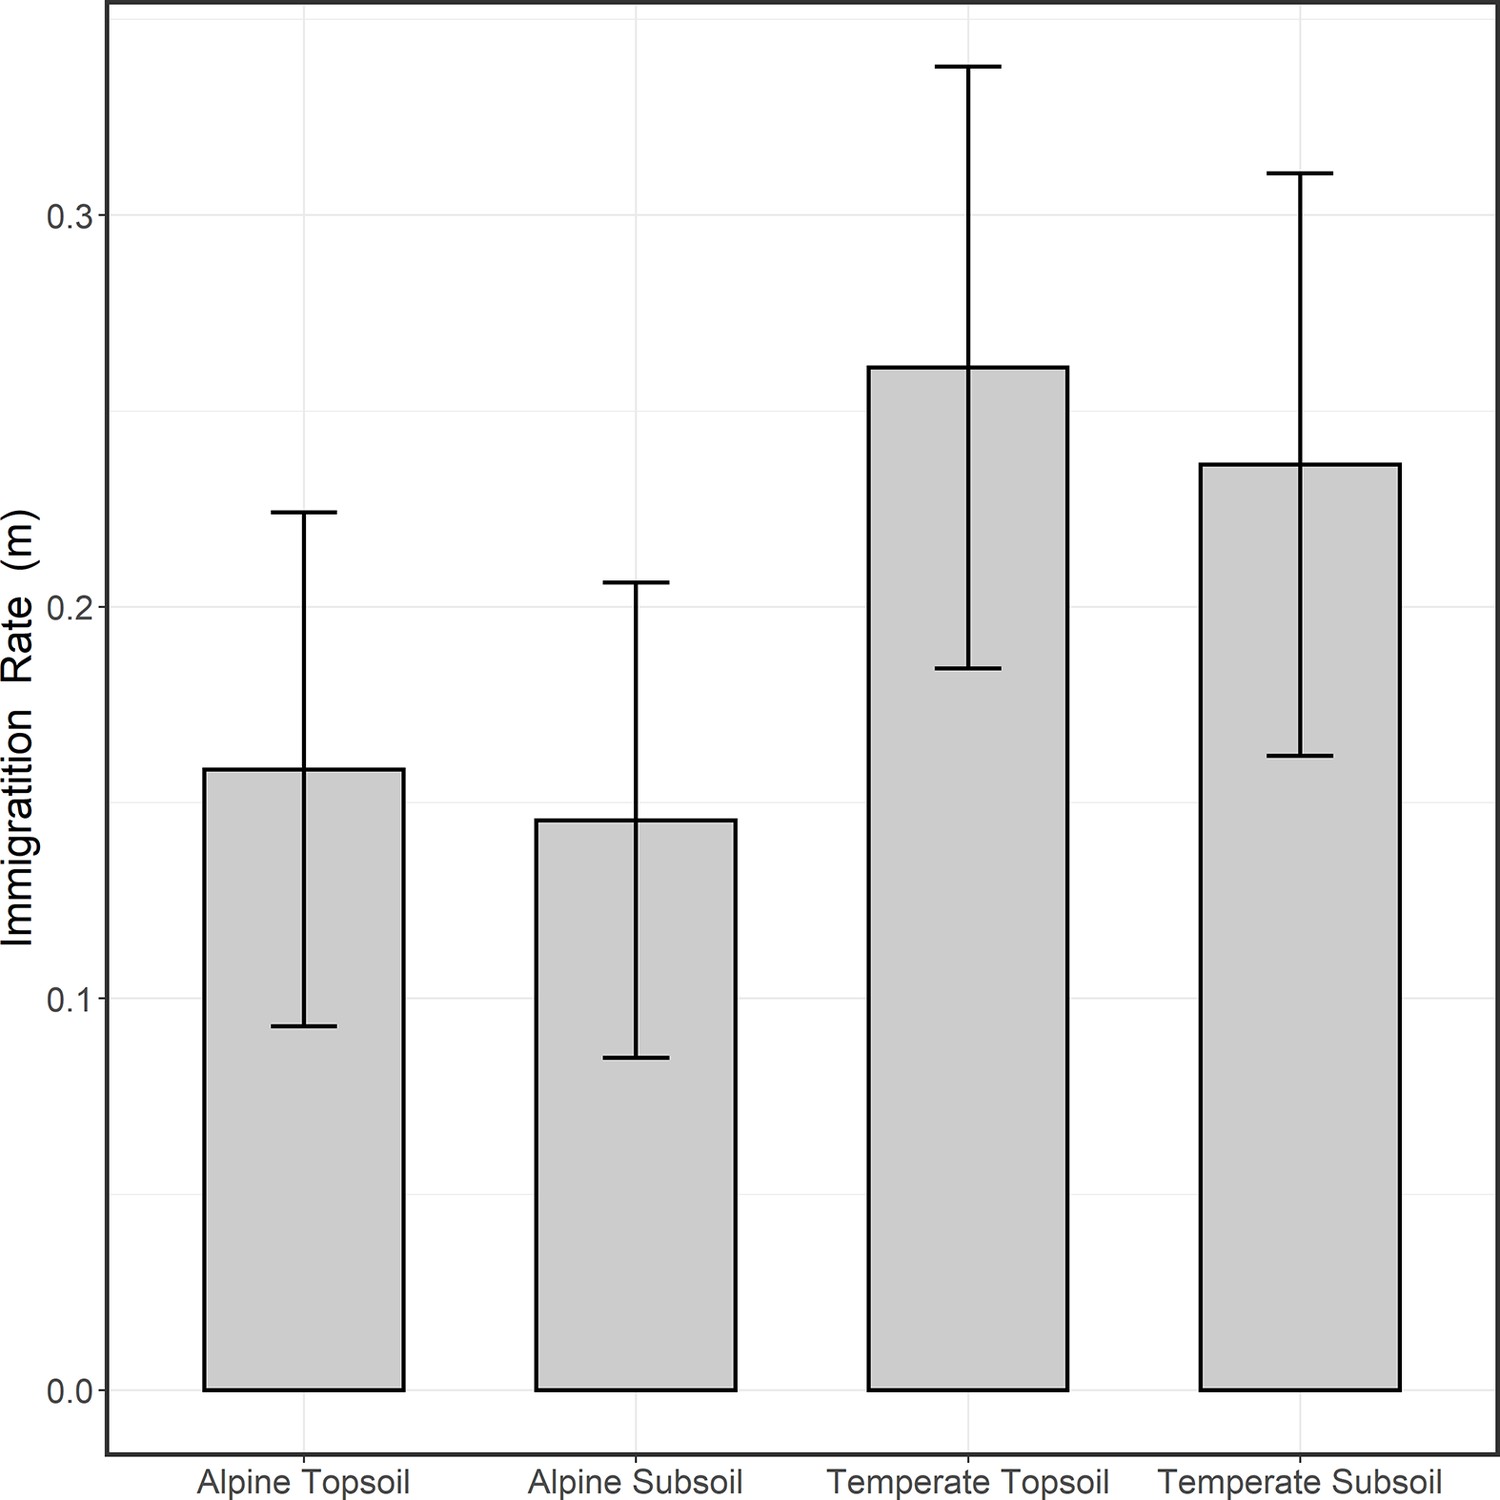
The immigration rate (m) of soil prokaryote community in topsoil and subsoil of the alpine and temperate grassland biomes.
Figure 4 with 1 supplement
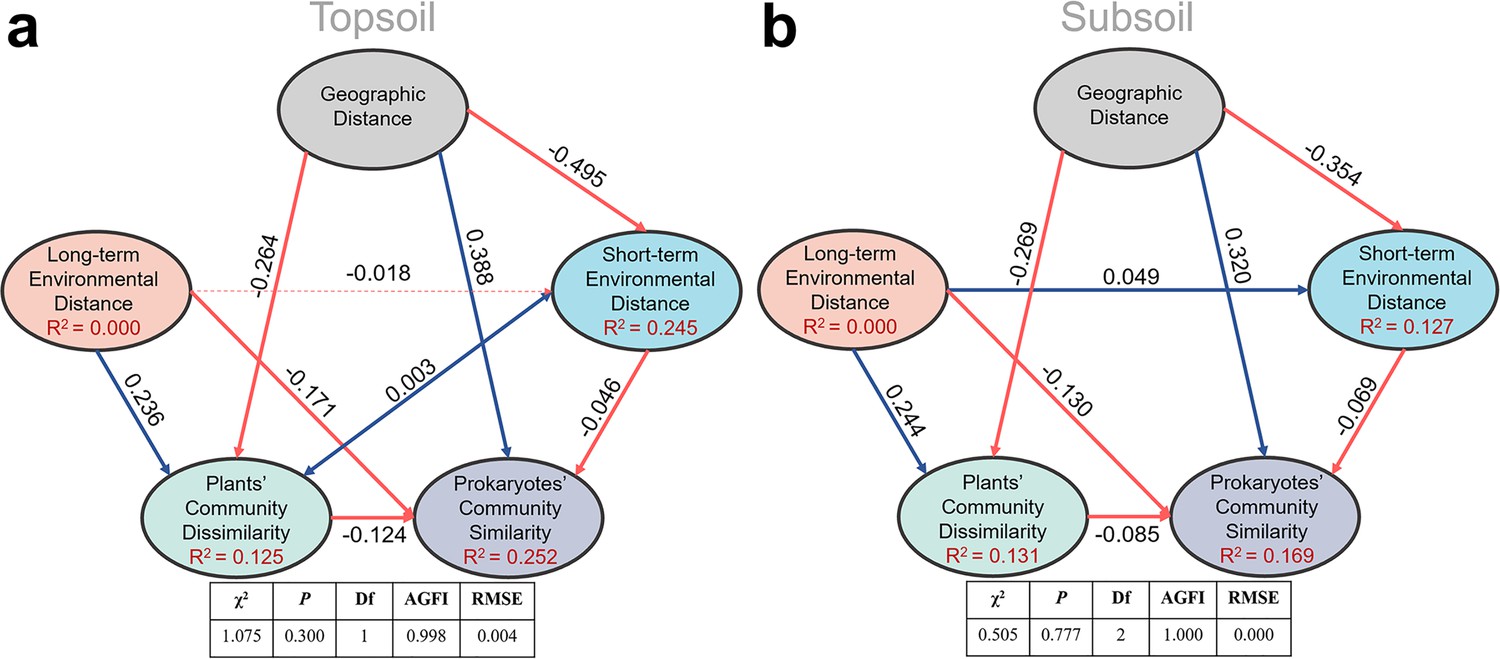
Structure equation model to quantify effects of geographic distance, relatively long-term and short-term environmental distance, and plant community dissimilarity on soil prokaryotic community similarity in the pairwise sites between alpine cross temperate biotas, either in top- (a) or subsoil (b).
Red and blue lines stand for negative and positive correlations, respectively; bold lines stand for significance at p = 0.05 level.
Figure 4—figure supplement 1
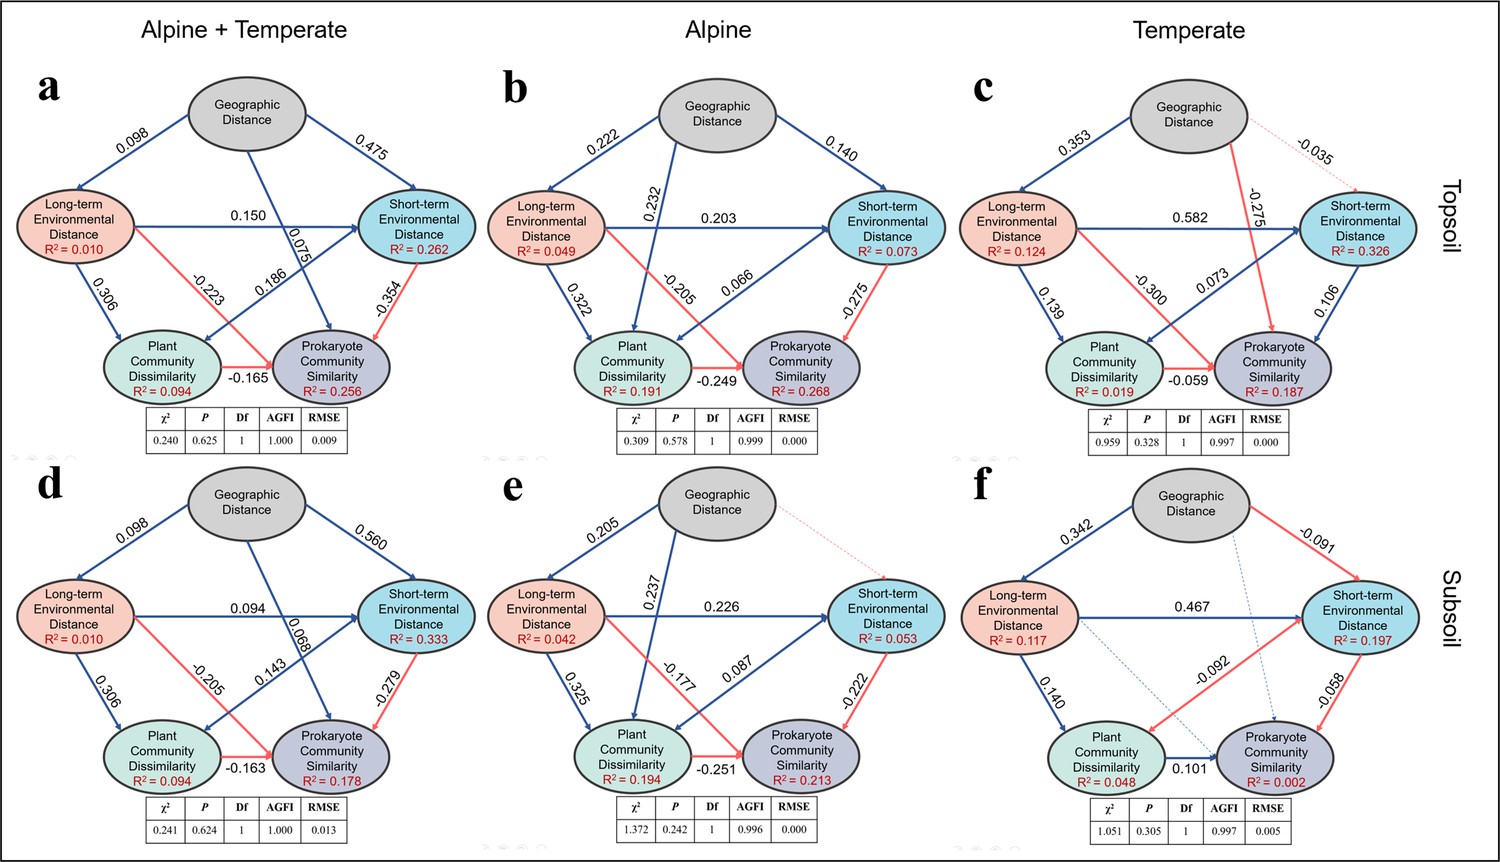
Structure equation model for geographic distance, long-term environmental distance, short-term environmental distance, and plant community dissimilarity based on Bray-Curtis distance in affecting soil prokaryote community similarity.
(a) Topsoil of the northern grassland; (b) topsoil of the alpine grassland; (c) topsoil of the temperate grassland; (d) subsoil of the northern grassland; (e) subsoil of the alpine grassland; (f) subsoil of the temperate grassland. Red lines stand for negative correlation and blue lines stand for positive correlation; Bold lines stand for significance at 0.05 level.
Tables
Table 1
Partial Mantel test for relationship between prokaryotic community similarity and relatively long-term environmental variables, relatively short-term environmental variables, and geographic variables across biotas.
| Alpine× temperate | ||||
|---|---|---|---|---|
| Topsoil | Subsoil | |||
| r | p | r | p | |
| MAP | 0.060 | 0.101 | 0.047 | 0.165 |
| MAT | 0.000 | 0.498 | –0.021 | 0.625 |
| pH | –0.001 | 0.516 | –0.004 | 0.542 |
| SOC | 0.231 | 0.001 | 0.120 | 0.010 |
| TN | 0.151 | 0.003 | 0.046 | 0.146 |
| TP | –0.143 | 0.999 | –0.072 | 0.908 |
| Long-term environment variables | 0.121 | 0.010 | 0.049 | 0.174 |
| SWC | 0.112 | 0.015 | 0.094 | 0.032 |
| AP | 0.003 | 0.387 | 0.064 | 0.124 |
| DOC | 0.307 | 0.001 | 0.206 | 0.001 |
| DON | 0.398 | 0.001 | 0.401 | 0.001 |
| NH4+ | 0.223 | 0.001 | 0.023 | 0.350 |
| NO3- | –0.135 | 0.990 | 0.040 | 0.234 |
| Short-term environment variables | 0.523 | 0.001 | 0.465 | 0.001 |
| Latitude | –0.541 | 1.000 | –0.433 | 1.000 |
| Longitude | –0.525 | 1.000 | –0.430 | 1.000 |
| Distance* | –0.544 | 1.000 | –0.438 | 1.000 |
| Altitude | –0.672 | 1.000 | –0.588 | 1.000 |
| Geographic variables | –0.5664 | 1.000 | –0.462 | 1.000 |
-
*
Calculated by the geographic distance for paired samples based on the longitude and latitude of each sample.
Additional files
-
Supplementary file 1
Mantel test between the prokaryotic community similarity based on Bray-Curtis index and environment variables.
- https://cdn.elifesciences.org/articles/70164/elife-70164-supp1-v2.docx
-
Supplementary file 2
Partial Mantel test between prokaryotic community similarity based on Bray-Curtis index and environmental variables.
- https://cdn.elifesciences.org/articles/70164/elife-70164-supp2-v2.docx
-
Transparent reporting form
- https://cdn.elifesciences.org/articles/70164/elife-70164-transrepform1-v2.docx
Download links
A two-part list of links to download the article, or parts of the article, in various formats.
Downloads (link to download the article as PDF)
Open citations (links to open the citations from this article in various online reference manager services)
Cite this article (links to download the citations from this article in formats compatible with various reference manager tools)
Environmental selection overturns the decay relationship of soil prokaryotic community over geographic distance across grassland biotas
eLife 11:e70164.
https://doi.org/10.7554/eLife.70164


