NBI-921352, a first-in-class, NaV1.6 selective, sodium channel inhibitor that prevents seizures in Scn8a gain-of-function mice, and wild-type mice and rats
- In Vitro Biology, Xenon Pharmaceuticals Inc, Canada
- Chemistry, Xenon Pharmaceuticals Inc, Canada
- In Vivo Biology, Xenon Pharmaceuticals Inc, Canada
- Compound Properties, Xenon Pharmaceuticals Inc, Canada
- Translational Drug Development, Xenon Pharmaceuticals Inc, Canada
- Scientific Affairs, Xenon Pharmaceuticals, Inc, Canada
- Executive Team, Xenon Pharmaceuticals Inc, Canada
Figures
Figure 1 with 2 supplements
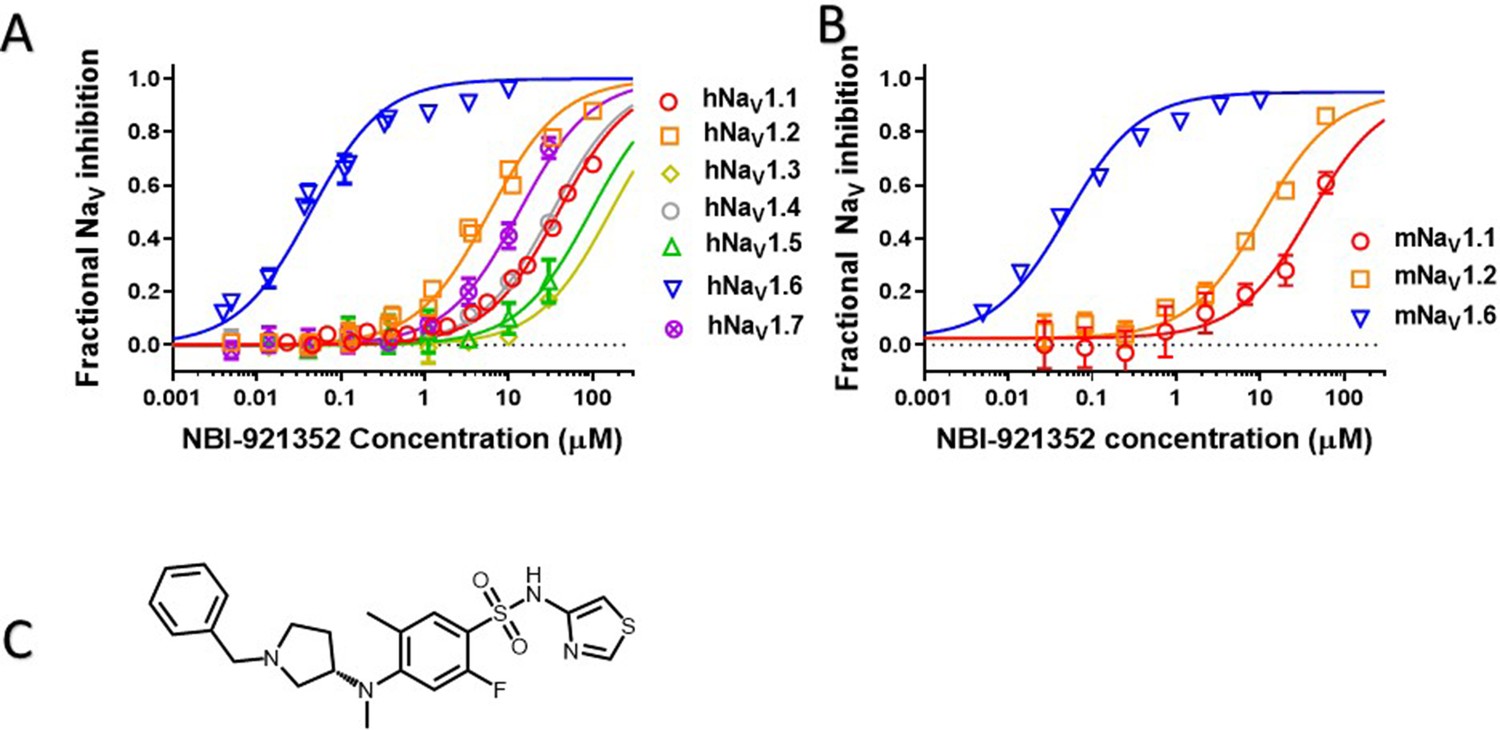
Potency and isoform selectivity of NBI-921352 for human and mouse NaV channels.
Concentration-response curves were generated by automated patch-clamp electrophysiology using the SophionQube. Concentration-response curves were generated for human (A) or mouse (B) NaV channel isoforms heterologously expressed in HEK293 cells. The analysis included only those cells that met pre-specified acceptance criteria for seal quality, current amplitude, and series resistance. Normalized data from all cell recordings at a concentration were grouped together and plotted with GraphPad Prism 8. Details regarding the number of cells analyzed for each NaV channel and concentration can be found in the source data sheet. Error bars indicating the standard error of the mean fraction were plotted for all points, but, in some cases, they were smaller than the data point symbols and, therefore, not visible. The chemical structure of NBI-921352 is shown (C).
-
Figure 1—source data 1
Quantification of potency and isoform selectivity of NBI-921352.
- https://cdn.elifesciences.org/articles/72468/elife-72468-fig1-data1-v2.xlsx
Figure 1—figure supplement 1
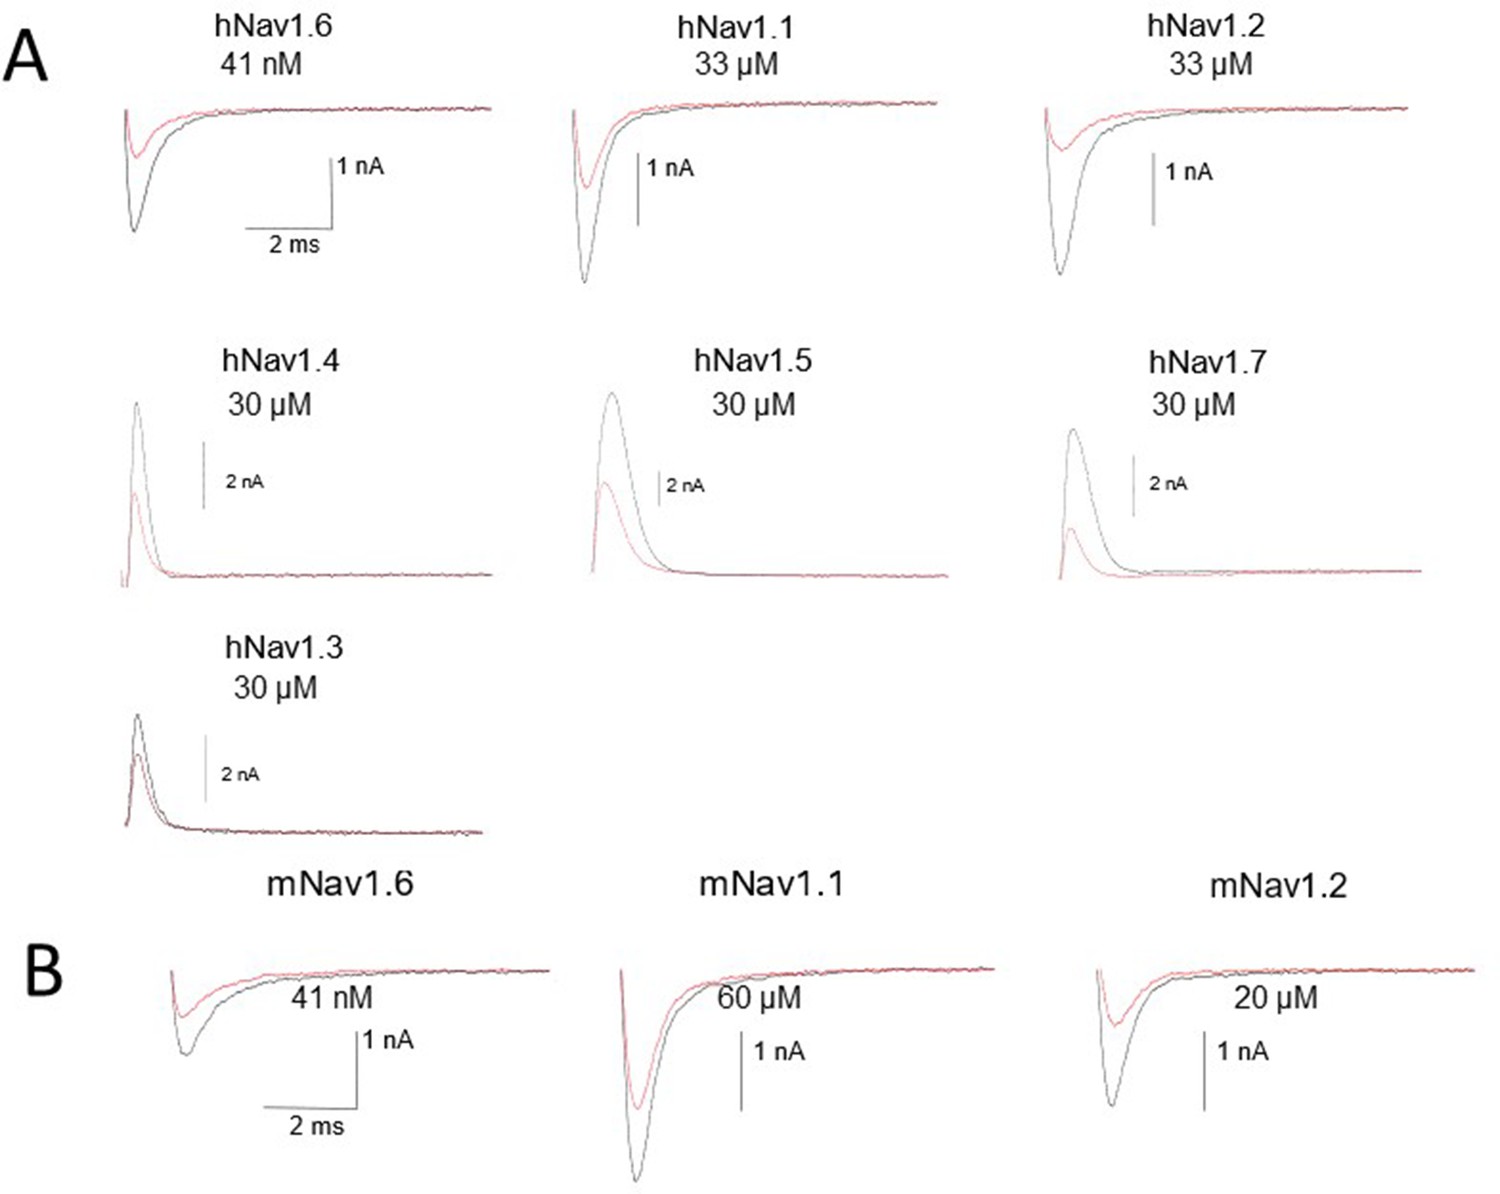
Representative raw traces of voltage-clamp recordings of control and the concentrations close to the NBI-921352 IC50 for all tested sodium channel isoforms in Figure 1.
Note that in some cases currents are outward because the sodium gradients were reversed. This was done to improve assay robustness and reproducibility. See methods for details. We have found that current direction does not impact pharmacology for inhibitors, like NBI-921352, that bind the VSD4 site (not shown).
Figure 1—figure supplement 2
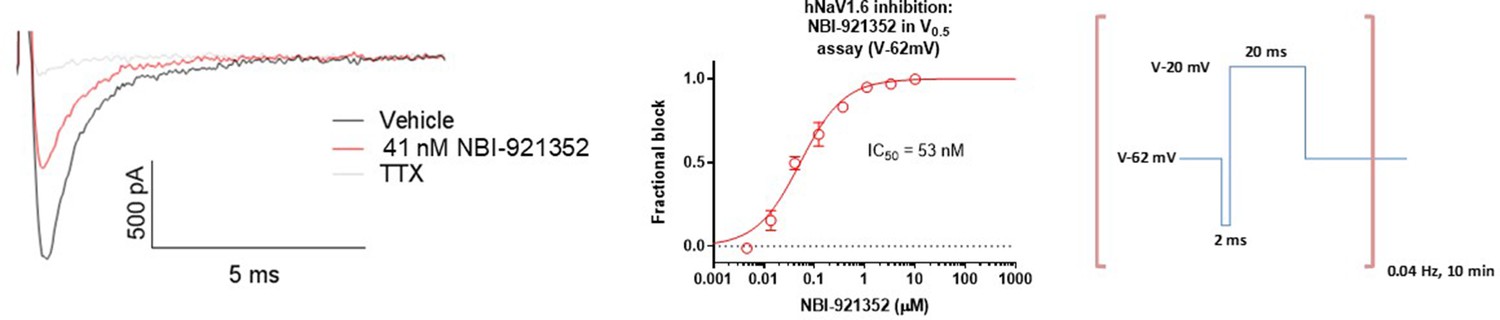
Potency of NBI-921352 measured form a holding potential approximating the V0.5 of inactivation for NaV1.
6. For the “V0.5” assay the membrane was held at –62 mV for Nav1.6 and the protocol shown above was applied. The solutions used were the same as for hNav1.6 in the standard assay. The protocol consisted of a 0.04 Hz repeating test pulse to –20 mV for 20ms to assess current inhibition preceded by a brief 2ms recovery pulse to –120 mV that was included to increase stability of the currents over time and boost the current size. The protocol was run in vehicle conditions at 0.1 Hz for 150 seconds compound to establish the baseline for each cell prior to the addition of compound for 10 min at a pulse frequency of 0.04 Hz. Full inhibition was defined by the addition of 300 nM TTX and data were processed in the same way as for the V-45 standard assay described in Figure 1.
-
Figure 1—figure supplement 2—source data 1
Quantification of potency with alternate voltage protocol.
- https://cdn.elifesciences.org/articles/72468/elife-72468-fig1-figsupp2-data1-v2.xlsx
Figure 2
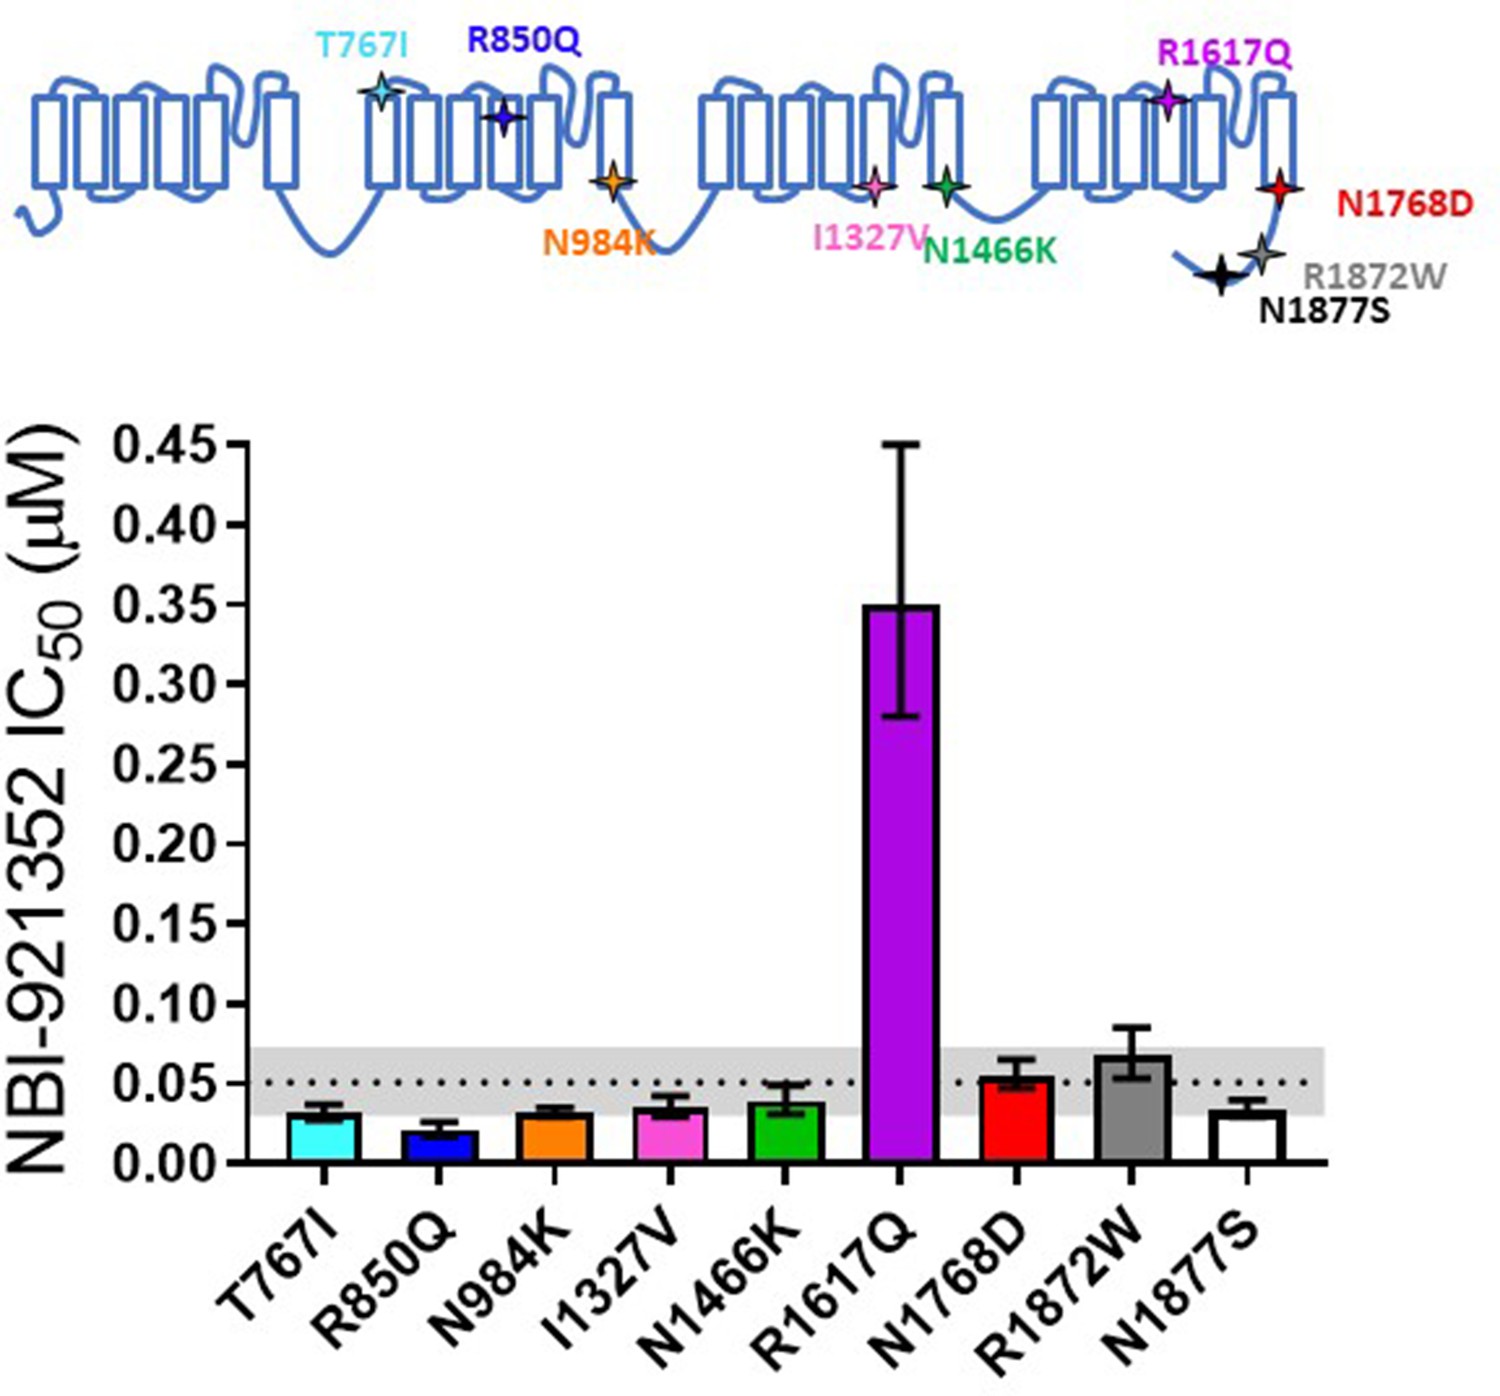
Comparison of NBI-921352 potency on human wild-type NaV1.6 and patient-identified variants of NaV1.6.
All constructs were transiently transfected into Expi293F cells and evaluated by automated patch-clamp electrophysiology using the SophionQube. The voltage-clamp methods were identical to those used for evaluation of the wild-type channels. The error bars indicate the 95% confidence interval of the fitted IC50 generated in Prism. The horizontal dotted line is at the IC50 for wild type NaV1.6 (51 nM, see Figure 1). The gray shaded band indicates the 95% confidence range for the IC50 for wild-type NaV1.6. Only two variants have fitted IC50’s outside of the 95% confidence interval for the wild-type channel IC50. R850Q was slightly more potently inhibited and R1617Q was less potently inhibited than the wild-type channel. R1617Q is near the proposed binding site for NBI-921352.
-
Figure 2—source data 1
Quantification inhibition of patient variants.
- https://cdn.elifesciences.org/articles/72468/elife-72468-fig2-data1-v2.xlsx
Figure 3 with 1 supplement
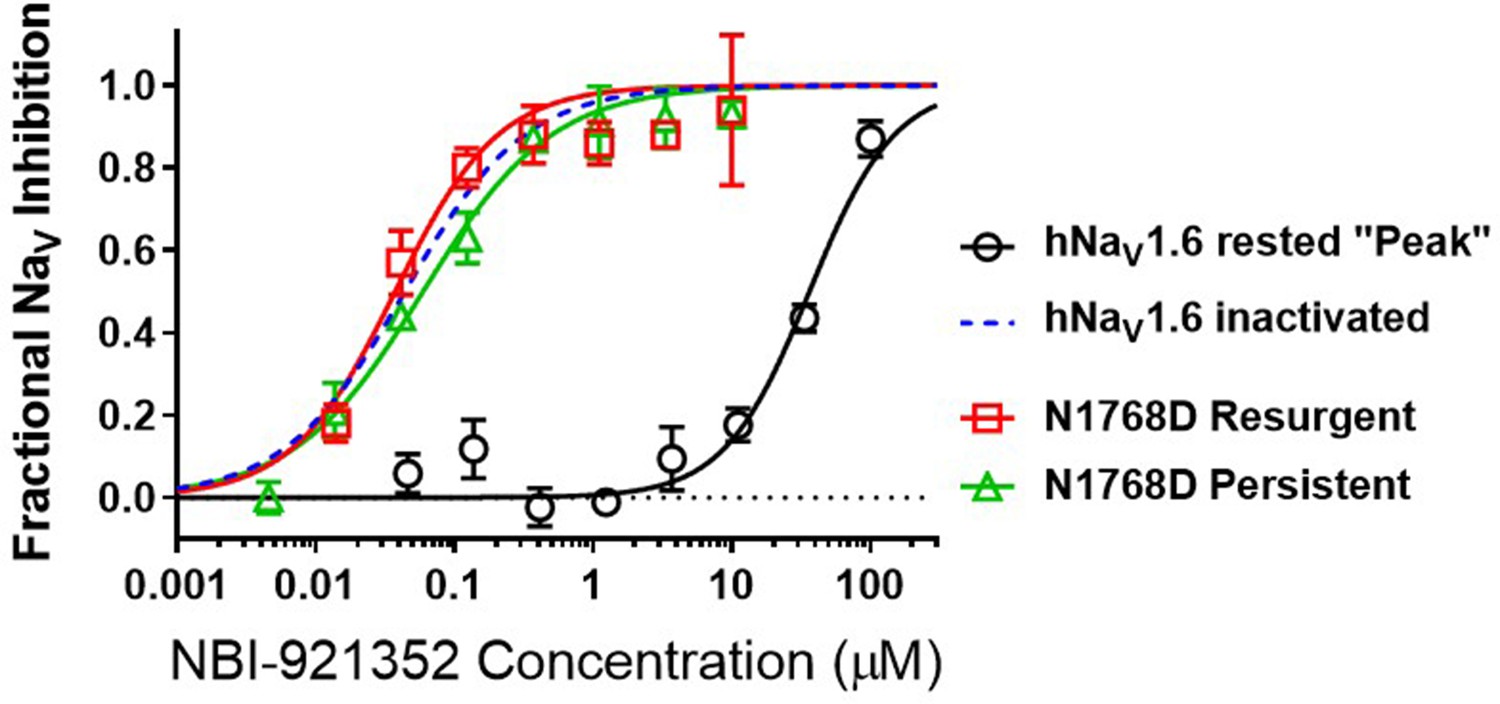
NBI-921352 is a state-dependent inhibitor of NaV1.6 and preferentially targets inactivated channels.
Concentration-response curves were generated for human WT and N1788D channel isoforms heterologously expressed in HEK293 cells. The analysis included only those cells that met pre-specified acceptance criteria for seal quality, current amplitude, and series resistance. Normalized data from all cell recordings at a concentration were grouped together and plotted with GraphPad Prism 8. Details regarding the number of cells analyzed for each NaV channel isoform and concentration can be found in the source data sheet. Error bars indicating the standard error of the mean fraction were plotted for all points. The blue dotted line indicates the concentration-response curve for wild-type NaV1.6 from Figure 1. When NaV1.6 channels were equilibrated with NBI-921352 at voltages that allow equilibration with inactivated states (–45 mV), the compound provided potent inhibition, as seen in Figure 1. NBI-921352 also exhibited potent block of NaV1.6 when measuring persistent or resurgent sodium current using distinct voltage protocols (see Materials and methods and text). Forcing channels to the rested, closed state by hyperpolarizing to –120 mV resulted in very weak inhibition. Current evoked from very negative potentials is sometimes referred to as ‘peak current’. The 95% confidence intervals for the IC50’s reported in the results are those provided for the error of the fit by Prism.
-
Figure 3—source data 1
Quantification of state dependence of NBI-921352.
- https://cdn.elifesciences.org/articles/72468/elife-72468-fig3-data1-v2.xlsx
Figure 3—figure supplement 1
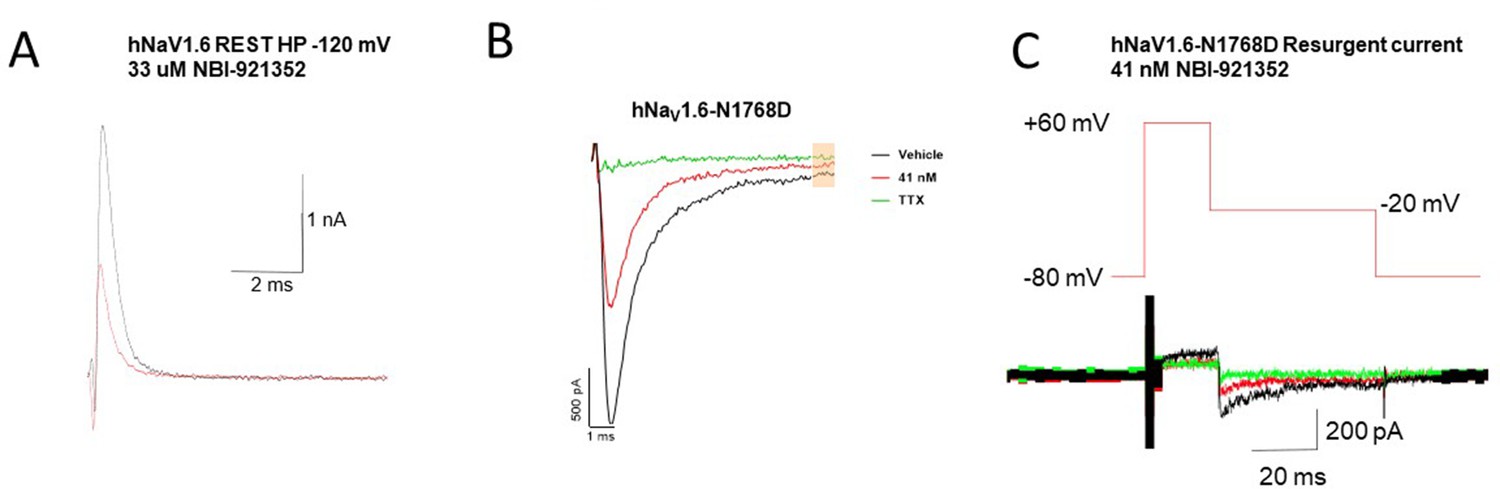
Representative raw traces of the NaV1.6 currents used to generate the summary data in Figure 3.
(A) Currents from WT hNaV1.6 channels holding at resting state (voltage = –120 mV) before and after ~IC50 concentration of 33 uM NBI-921352 (B) The persistent currents of NaV1.6-N1768D before and after ~IC50 concentration of 41 nM followed by 300 nM of TTX (C) Resurgent currents of NaV1.6-N1768D before and after ~IC50 concentration of 41 nM followed by 300 nM of TTX. Note data archiving/compression led to low resolution of the of trace outside of central region where the peak resurgent currents were measured. Note that in (A) currents are outward because the sodium gradients were reversed. This was done to improve assay robustness and reproducibility. See Materials and methods for details.
Figure 4 with 1 supplement
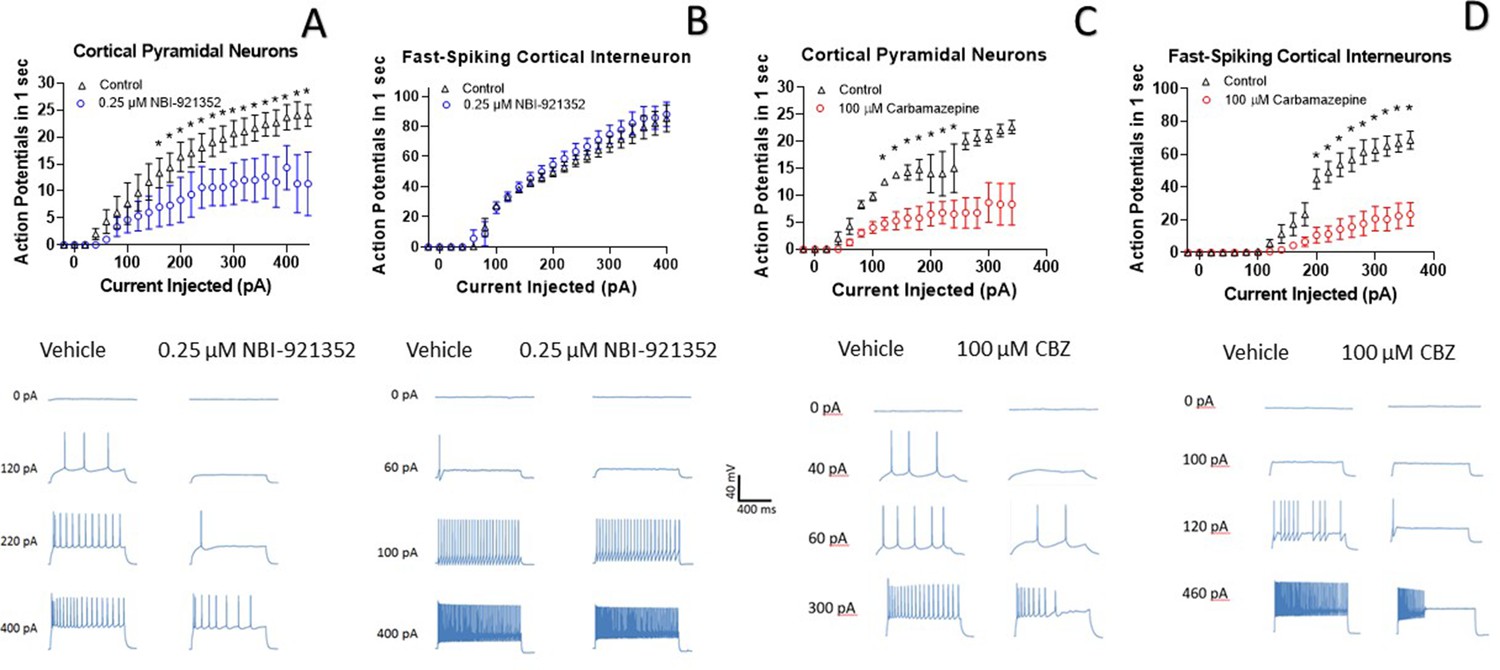
NBI-921352 inhibits firing in pyramidal neurons but spares fast-spiking interneurons.
Current input versus action-potential output evaluations in wild-type mouse brain slices treated with vehicle or 0.25 µM NBI-921352 (A & B), or 100 µM carbamazepine (C & D) was plotted. In cortical pyramidal neurons, both NBI-921352 (A) and carbamazepine (C) reduced action-potential spiking. In fast-spiking cortical interneurons, treatment with NBI-921352 resulted in a trend toward slightly increased firing frequency (B), while carbamazepine markedly reduced firing (D). The main upper panels compare average action-potential count of 3–4 neurons in each condition±the standard error of the mean. The lower panels show recordings for individual representative neurons for each condition. No inhibitors of synaptic inputs were used for these experiments. The difference in the cumulative area under the curves (AUC) for control versus NBI-921352 treated conditions was evaluated by a paired two tailed t-test (N = 3 or 4 cells for each point). *Indicates a p < 0.05 relative to the control condition. Specific p values are shown in the data transparency Excel file. See Figure 4—figure supplement 1 for more individual neuron comparisons.
-
Figure 4—source data 1
Quantification of cortical neuron current clamp input output.
- https://cdn.elifesciences.org/articles/72468/elife-72468-fig4-data1-v2.xlsx
Figure 4—figure supplement 1
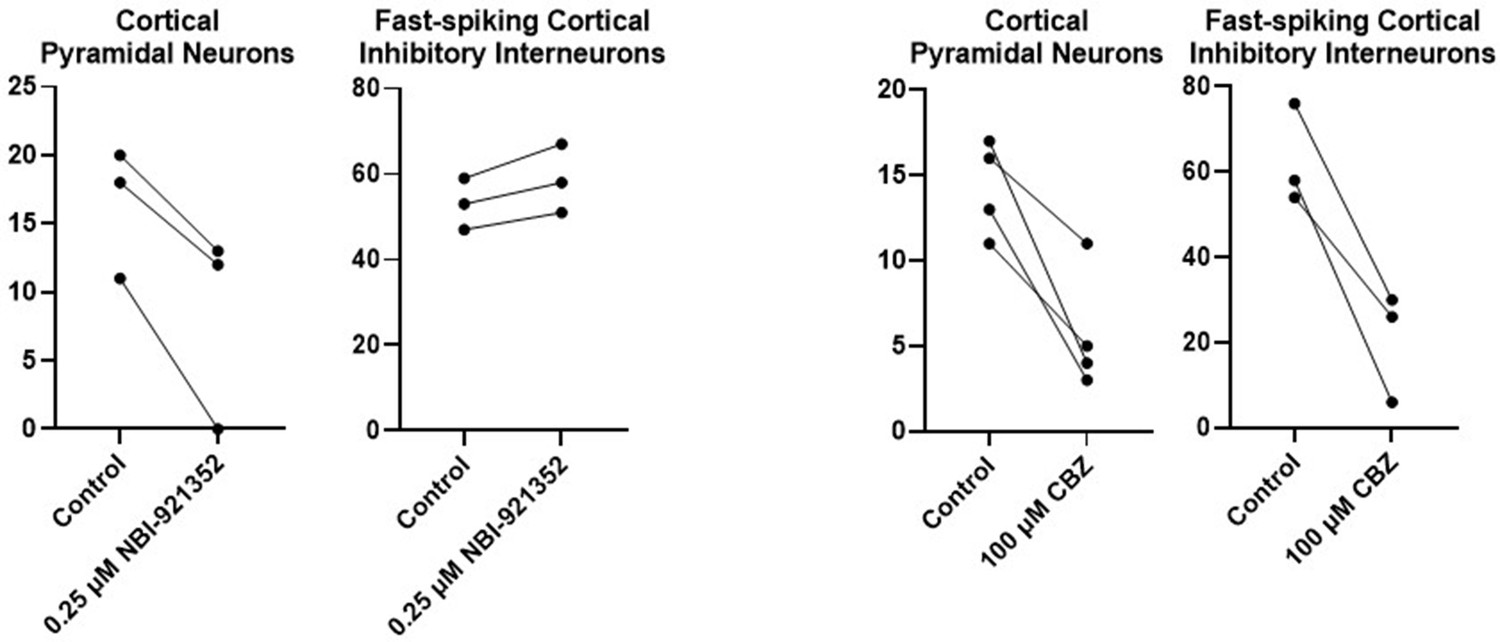
Results for each tested neuron for the neurons summarized in Figure 4.
For each neuron, the number of action potentials are shown in response to a current injection level of approximately 3 X the rheobase (determined for each neuron individually) before and after addition of the test compound (NBI-921352 or Carbamazepine).
-
Figure 4—figure supplement 1—source data 1
Quantification of individual neurons.
- https://cdn.elifesciences.org/articles/72468/elife-72468-fig4-figsupp1-data1-v2.xlsx
Figure 5 with 2 supplements
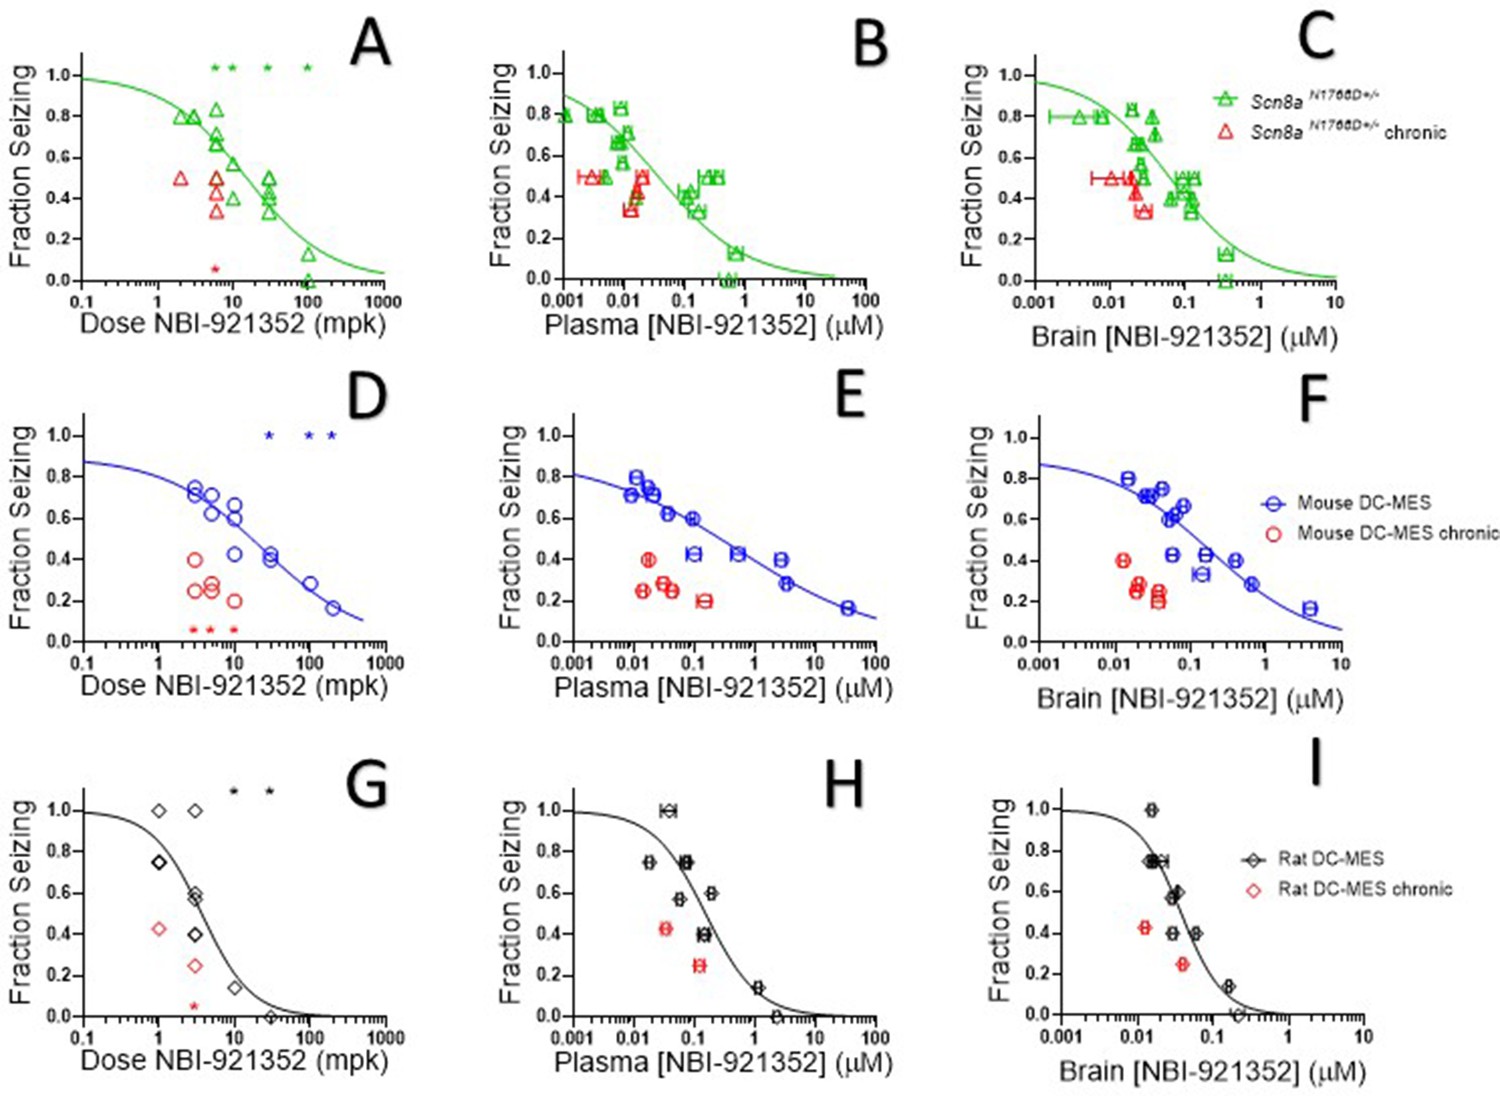
NBI-921352 inhibited electrically induced seizures in rodents.
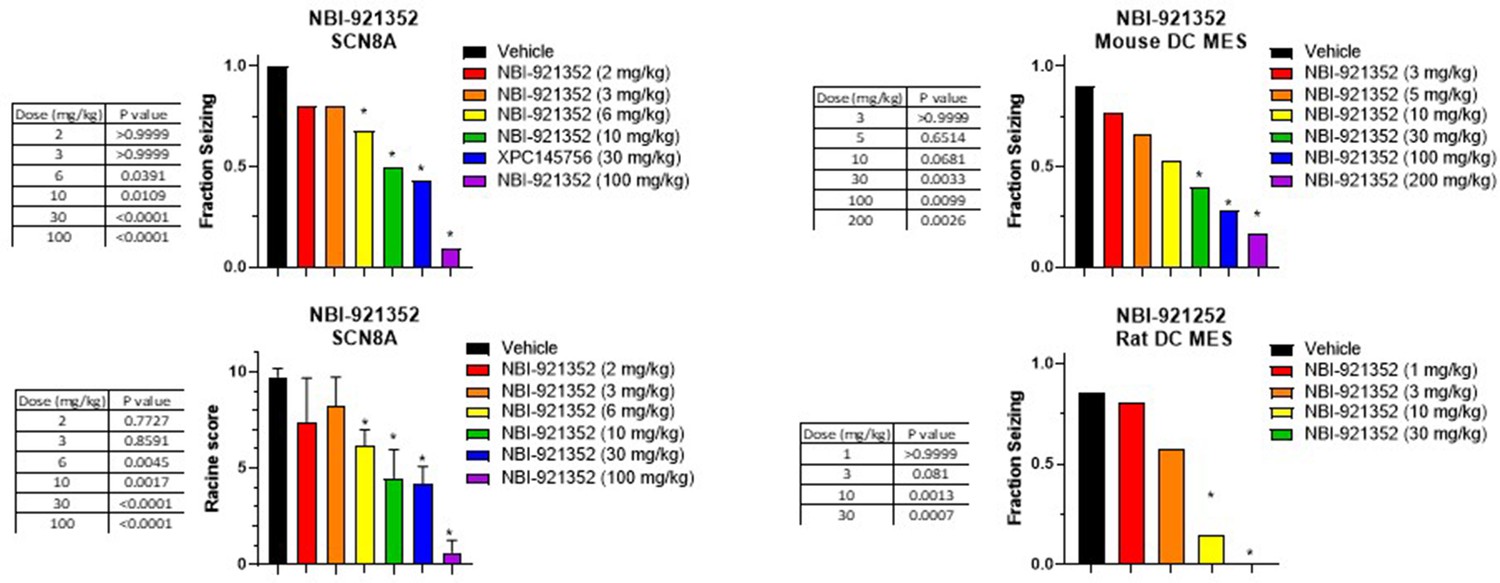
Dose of NBI-921352 is plotted versus efficacy in Scn8aN1768D+/- mice in the modified 6 Hz psychomotor seizure assay in A. Plasma concentration of NBI-921352 is plotted versus efficacy in Scn8aN1768D+/- mice in the modified 6 Hz psychomotor seizure assay in B. Brain concentration of NBI-921352 is plotted versus efficacy in Scn8aN1768D+/- mice in the modified 6 Hz psychomotor seizure assay in C.Green open triangles represent data from animals that received a single dose 2 hr before testing in the seizure assay. Red open triangles represent data from animals that received two daily doses (once every 12 hr) for 6 days. On day 7, these animals were given a final dose (the 13th dosing) 2 hr before testing in the seizure assay. Dose of NBI-921352 is plotted versus efficacy in wild-type mice in the DC-MES assay in D. Plasma concentration of NBI-921352 is plotted versus efficacy inwild-type mice in the DC-MES assay in E. Brain concentration of NBI-921352 is plotted versus efficacy inwild-type mice in the DC-MES assay in F. Blue open circles represent data from animals that received a single dose 2 hr before testing in the seizure assay. Red open circles represent data from animals that received two daily doses (once every 12 hr) for 6 days. On day seven these animals were given a final dose (the 13th dosing) 2 hr before testing in the seizure assay. Dose of NBI-921352 is plotted versus efficacy inwild-type rats in the DC-MES assay in G. Plasma concentration of NBI-921352 is plotted versus efficacy inwild-type rats in the DC-MES assay in H. Brain concentration of NBI-921352 is plotted versus efficacy inwild-type rats in the DC-MES assay in I. Black open diamonds represent data from animals that received a single dose 2 hr before testing in the seizure assay. Red open diamonds represent data from animals that received two daily doses (once every 12 hr) for 6 days. On day 7, these animals were given a final dose (the 13th dose) 2 hr before testing in the seizure assay. Each point represents the fraction of animals exhibiting a GTC with hindlimb extension after stimulus from a dosing group of six to eight animals. Horizontal error bars show the standard error of the mean plasma (B, E, H) or brain (C, F, I) concentrations measured from the animals in that dosing group immediately after assay. Where error bars are not visible, they are smaller than the symbols. No error bars are shown for the dose levels (A, D, G), since those were dictated by the experimenter. Groups receiving the same dose level were combined for statistical analysis. Between-group differences were compared to vehicle response and were analyzed using a Kruskal-Wallis test followed by Dunn’s multiple comparisons test. Statistical significance was reached at values of p < 0.05 and is indicated by the stars at the top of A, D, and G. For specific p values and more details see Figure 5—figure supplement 1 Symbols in red represent animals tested after twice daily dosing for 6.5 days (see description above). Statistical analysis was completed as above for comparison between NBI-921352 treated and vehicle treated groups, and significance is indicated by a red star above the x-axis. In some cases, dose levels that were not statistically significant after a single dose became significant after repeat dosing when compared to vehicle controls. However, in no case were the groups treated with repeatedly with NBI-921352 statistically significant relative to their single dose comparison groups from the same experiment. For more data and p-values see Figure 5—figure supplement 2.
-
Figure 5—source data 1
Quantification of impact of NBI-921352 on rodent seizures.
- https://cdn.elifesciences.org/articles/72468/elife-72468-fig5-data1-v2.xlsx
Figure 5—figure supplement 1
Dose response and statistical analysis of the NBI-921352 dose groups for which brain and plasma concentration response curves are shown in Figure 5.
In some cases, multiple experimental groups at the same test dose were assessed. In such cases groups at the same dose level were combined here for comparison to vehicle treated animals. Fraction seizing data is expressed as a mean of the binary seizure score for all tested animals, where animals that seized received a score of 1 and animals that did not seize received a score of 0. In the SCN8A 6 Hz assay two endpoints were noted cumulative Racine score, and presence of a tonic clonic seizure with hind-limb extension. Both scores are presented. Racine score data (bottom left) is expressed as a mean ± SEM. The cumulative racine score evaluation was performed at the same time and in the same animals as the fraction seizing evaluation and provided qualitatively similar results. The Racine score data is not reported in the results section, but we show those values here for comparison. For details see Focken et al., 2019. Between-group differences were analyzed using a Kruskal-Wallis test followed by Dunn’s multiple comparisons test (fraction seizing data) or ordinary one-way ANOVA followed by Dunnett’s multiple comparison test (Racine score data). A statistically significant difference relative to vehicle treated groups is indicated by a star and was reached at values of p < 0.05 (compared to vehicle treated animals). p Values for each comparison to vehicle are shown in the figure.
Figure 5—figure supplement 2
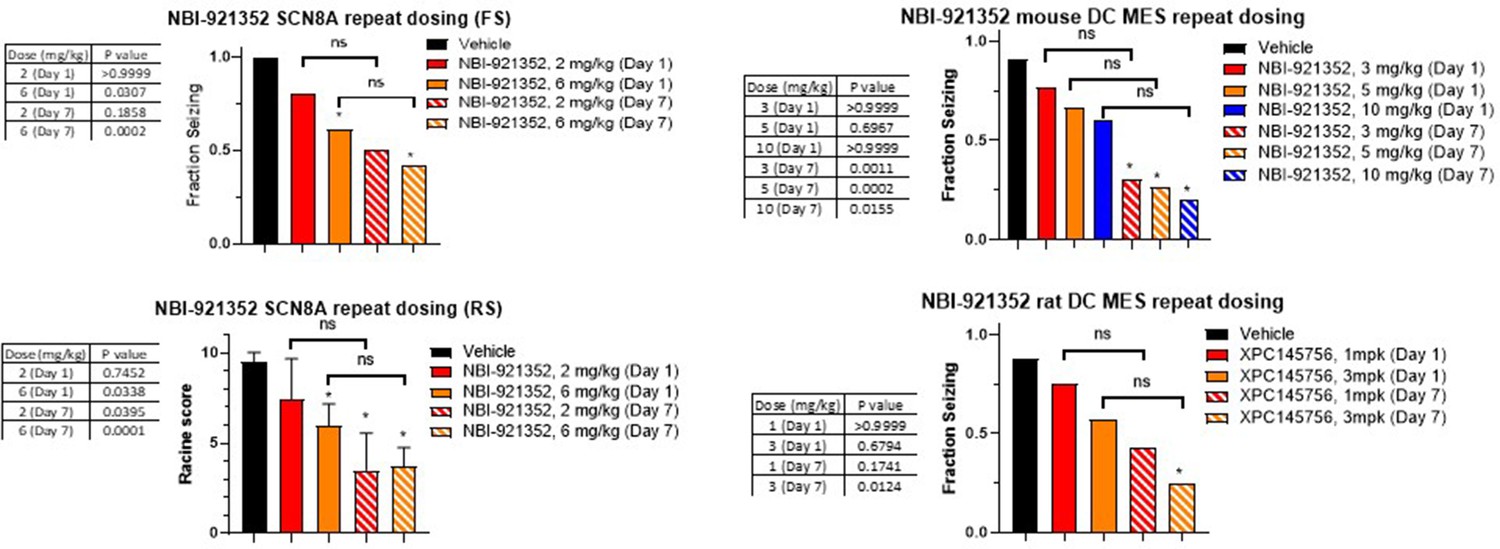
Comparison of single dose versus sub-chronic dosing for NBI-921352.
Vehicle, day 1 and day 7 (13 doses BID) were run in parallel with Vehicle animals receiving vehicle every day twice a day. Day 1 animals received 12 doses of vehicle BID before a final dosing with NBI-921352 prior to assay. In some cases, multiple experimental groups at the same test dose were assessed. In such cases groups at the same dose level were combined here for comparison to vehicle treated animals. Fraction seizing data is expressed as a mean of the binary seizure score for all tested animals, where animals that seized received a score of 1 and animals that did not seize received a score of 0. In the SCN8A 6 Hz assay two endpoints were noted cumulative Racine score, and presence of a tonic clonic seizure with hind-limb extension. Both scores are presented. Racine score data (bottom left) is expressed as a mean ± SEM. The cumulative Racine score evaluation was performed at the same time as the fraction seizing evaluation and provided qualitatively similar results. While not reported in the results section we show those values here for comparison. For assay details see Focken et al., 2019. Identification of CNS-Penetrant Aryl Sulfonamides as Isoform-Selective NaV1.6 Inhibitors with Efficacy in Mouse Models of Epilepsy. (J) Med Chem, 62(21), 9618–9641. Between-group differences were analyzed using a Kruskal-Wallis test followed by Dunn’s multiple comparisons test (fraction seizing data), or ordinary one-way ANOVA followed by Dunnett’s multiple comparison test (Racine score data). A statistically significant difference relative to vehicle treated groups is indicated by a star and was reached at values of p < 0.05 (compared to vehicle treated animals). p Values for each comparison to vehicle are shown in the figure. In some cases, repeat dosing led to statistically significant protection (relative to vehicle) while its single dose comparator did not. In no case did repeat dosing lead to statistically different efficacy when compared to its same experiment single dose control group (indicated by the comparator bars labeled ‘ns’). For example, in the mouse DC MES assay a single dose of 3, 5, or 10 mg/kg NBI-921352 did not provide statistically significant protection when compared to vehicle (top right panel), but repeated dosing for all three dose levels did protect better than vehicle. However, comparison of repeated doses of 3, 5, or 10 mg/kg were not significantly more protective (p > 0.05) than single doses of the same drug level in the same experiment.
Figure 6 with 3 supplements
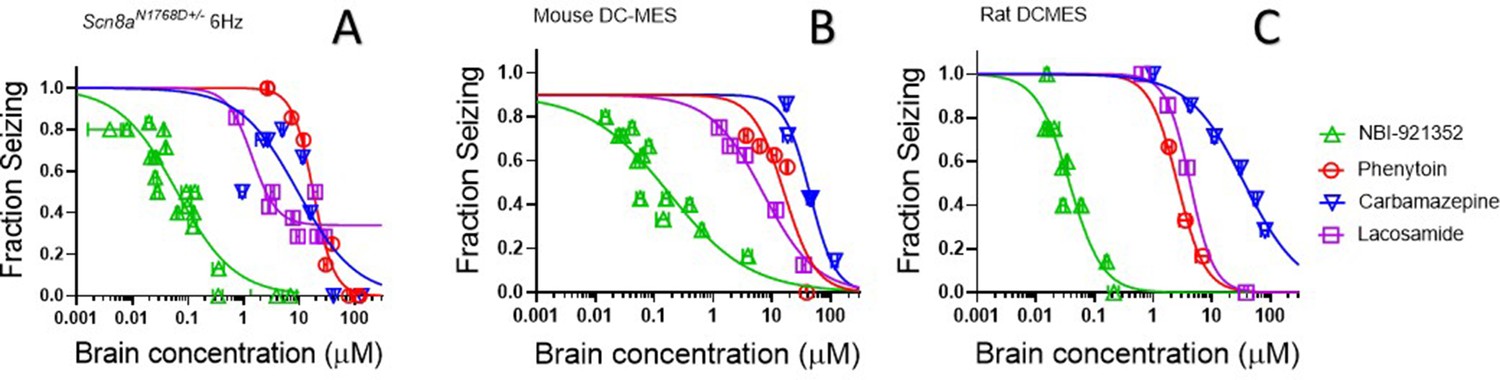
NBI-921352 is more potent than three commonly prescribed NaV inhibitor ASMs.
Brain concentration versus fraction of animals exhibiting is plotted for NBI-921352 versus that for phenytoin, carbamazepine, and lacosamide in the Scn8aN1768D+/- modified 6 Hz model (A), the wild-type mouse DC-MES model (B), and the wild-type rat DC-MES model (C). Each point represents the fraction of animals exhibiting a GTC with hindlimb extension after stimulus from a dosing group of six to eight animals. Horizontal error bars show the standard error of the mean brain concentrations measured from the animals in that dosing group immediately after assay. Where error bars are not visible, they are smaller than the symbols. Statistical analysis of significance of the dose groups for the concentrations shown were performed as in Figure 5 and can be found in Figure 5—figure supplement 1 (NBI-921352), Figure 6—figure supplement 1 (Carbamazepine), Figure 6—figure supplement 2 (Phenytoin), and Figure 6—figure supplement 3 (Lacosamide).
-
Figure 6—source data 1
Quantification of effective brain concentrations of NBI-921352 versus common AEDs.
- https://cdn.elifesciences.org/articles/72468/elife-72468-fig6-data1-v2.xlsx
Figure 6—figure supplement 1
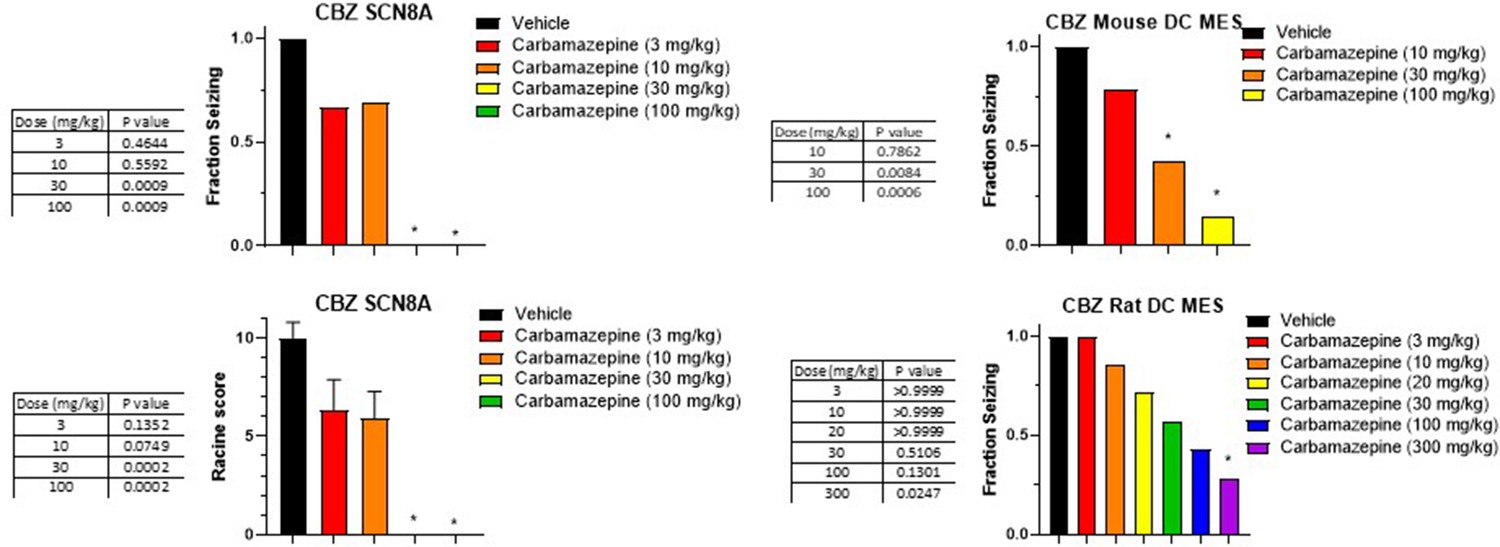
Dose response and statistical analysis of the Carbamazepine dose groups for which brain and plasma concentration response curves are shown in Figures 6 and 7 respectively.
In some cases, multiple experimental groups at the same test dose were assessed. In such cases, groups at the same dose level were combined here for comparison to vehicle treated animals. Fraction seizing data is expressed as a mean of the binary seizure score for all tested animals, where animals that seized received a score of 1 and animals that did not seize received a score of 0. In the SCN8A 6 Hz assay two endpoints were noted cumulative Racine score, and presence of a tonic clonic seizure with hind-limb extension. Both scores are presented. Racine score data (bottom left) is expressed as a mean ± SEM. A cumulative Racine score evaluation was performed at the same time as the fraction seizing evaluation and provided qualitatively similar results. While not reported in the results section we show those values here for comparison. For details, see Focken et al., 2019. Identification of CNS-Penetrant Aryl Sulfonamides as Isoform-Selective NaV1.6 Inhibitors with Efficacy in Mouse Models of Epilepsy. (J) Med Chem, 62(21), 9618–9641. Between-group differences were analyzed using a Kruskal-Wallis test followed by Dunn’s multiple comparisons test (fraction seizing data) or ordinary one-way ANOVA followed by Dunnett’s multiple comparison test (Racine score data). A statistically significant difference relative to vehicle treated groups is indicated by a star and was reached at values of p < 0.05 (compared to vehicle treated animals). p Values for each comparison to vehicle are shown in the figure.
Figure 6—figure supplement 2
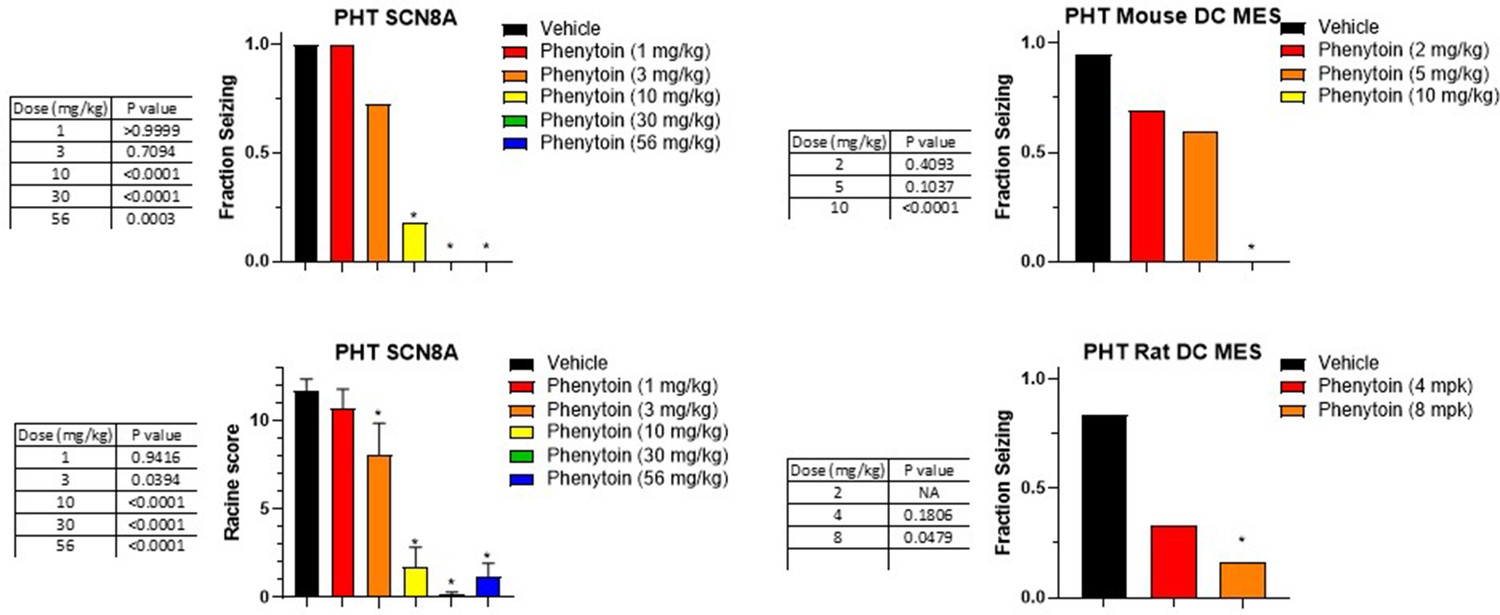
Dose response and statistical analysis of the Phenytoin dose groups for which brain and plasma concentration response curves are shown in Figures 6 and 7 respectively.
In some cases, multiple experimental groups at the same test dose were assessed. In such cases groups at the same dose level were combined here for comparison to vehicle treated animals. Fraction seizing data is expressed as a mean of the binary seizure score for all tested animals, where animals that seized received a score of 1 and animals that did not seize received a score of 0. In the SCN8A 6 Hz assay two endpoints were noted cumulative Racine score, and presence of a tonic clonic seizure with hind-limb extension. Both scores are presented. Racine score data (bottom left) is expressed as a mean ± SEM. A cumulative racine score evaluation was performed at the same time as the fraction seizing evaluation and provided qualitatively similar results. While not reported in the results section we show those values here for comparison. For details see Focken et al., 2019. Identification of CNS-Penetrant Aryl Sulfonamides as Isoform-Selective NaV1.6 Inhibitors with Efficacy in Mouse Models of Epilepsy. (J) Med Chem, 62(21), 9618–9641. Between-group differences were analyzed using a Kruskal-Wallis test followed by Dunn’s multiple comparisons test (fraction seizing data) or ordinary one-way ANOVA followed by Dunnett’s multiple comparison test (Racine score data). A statistically significant difference relative to vehicle-treated groups is indicated by a star and was reached at values of p < 0.05 (compared to vehicle treated animals). p Values for each comparison to vehicle are shown in the figure.
Figure 6—figure supplement 3
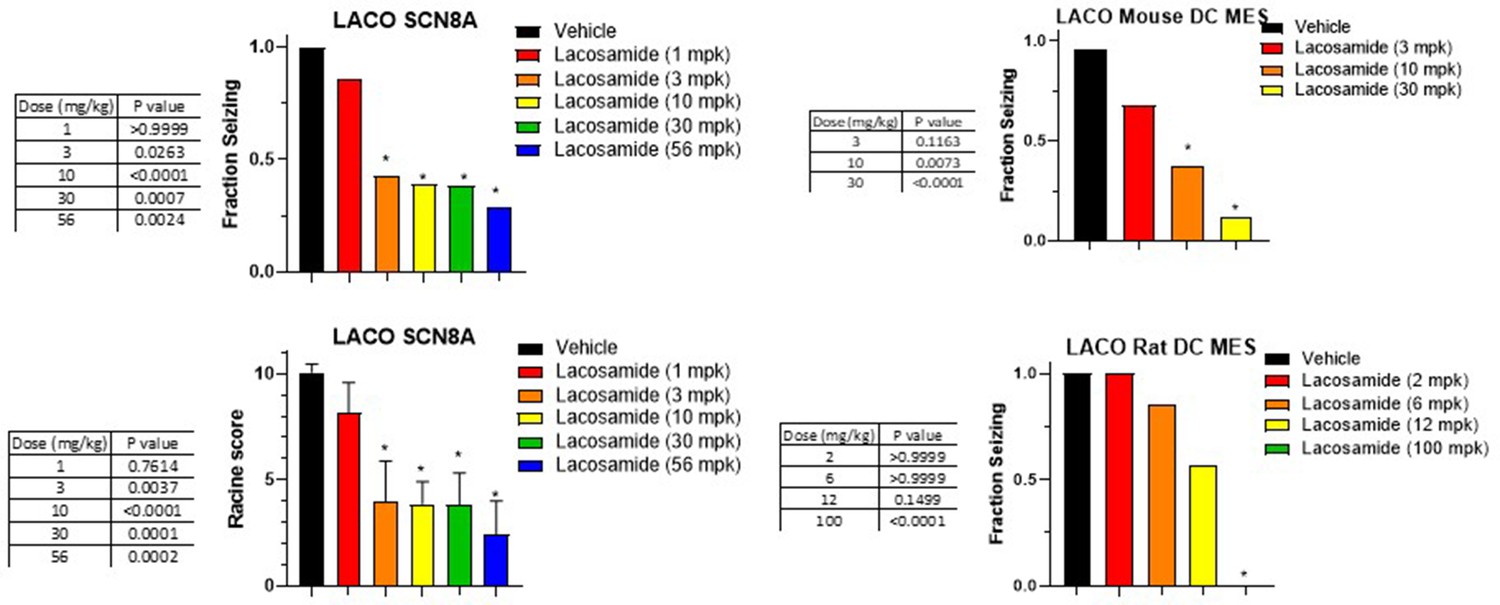
Dose response and statistical analysis of the Lacosamide dose groups for which brain and plasma concentration response curves are shown in Figures 6 and 7 respectively.
In some cases, multiple experimental groups at the same test dose were assessed. In such cases groups at the same dose level were combined here for comparison to vehicle-treated animals. Fraction seizing data is expressed as a mean of the binary seizure score for all tested animals, where animals that seized received a score of 1 and animals that did not seize received a score of 0. In the SCN8A 6 Hz assay two endpoints were noted cumulative Racine score, and presence of a tonic clonic seizure with hind-limb extension. Both scores are presented. Racine score data (bottom left) is expressed as a mean ± SEM. A cumulative racine score evaluation was performed at the same time as the fraction seizing evaluation and provided qualitatively similar results. While not reported in the results section we show those values here for comparison. For details see Focken et al., 2019. Identification of CNS-Penetrant Aryl Sulfonamides as Isoform-Selective NaV1.6 Inhibitors with Efficacy in Mouse Models of Epilepsy. (J) Med Chem, 62(21), 9618–9641. Between-group differences were analyzed using a Kruskal-Wallis test followed by Dunn’s multiple comparisons test (fraction seizing data) or ordinary one-way ANOVA followed by Dunnett’s multiple comparison test (Racine score data). A statistically significant difference relative to vehicle treated groups is indicated by a star and was reached at values of p < 0.05 (compared to vehicle-treated animals). p Values for each comparison to vehicle are shown in the figure.
Figure 7
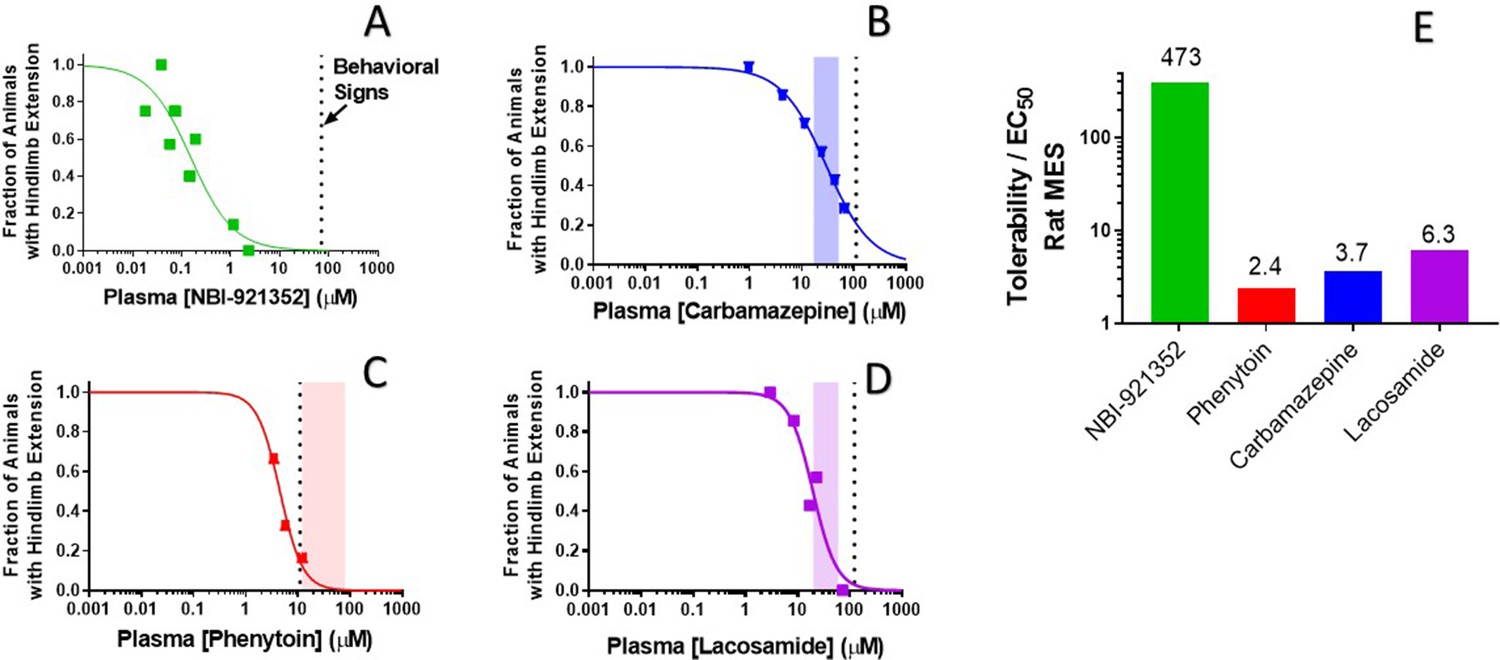
Rat efficacy compared to acute tolerability for NBI-921352 relative to NaV inhibitor ASMs.
Plasma concentration versus efficacy data is shown for the rat DC-MES assay for NBI-921352 (A), carbamazepine (B), phenytoin (C), and lacosamide (D). The vertical dotted lines indicate the lowest plasma concentration at which a rat was observed to exhibit atypical behavioral signs indicative of an adverse reaction to drug in the assay format. Animals exhibiting such signs were excluded from efficacy evaluation. The shaded bars in B, C, and D indicate the approximate human plasma concentrations observed in clinical practice. Panel E shows the ratio of the (rat plasma EC50/ the plasma concentration where behavioral signs were noted for each compound). Statistical analysis of significance of the dose groups for the concentrations shown can be found in Figure 5—figure supplement 1 (NBI-921352), Figure 6—figure supplement 1 (Carbamazepine), Figure 6—figure supplement 2 (Phenytoin), and Figure 6—figure supplement 3 (Lacosamide).
-
Figure 7—source data 1
Quantification of effective and tolerated plasma concentrations of NBI-921352 versus common AEDs.
- https://cdn.elifesciences.org/articles/72468/elife-72468-fig7-data1-v2.xlsx
Tables
Table 1
Potency and isoform selectivity of NBI-921352 for human and mouse NaV channels.
Note that IC50s for the neuronal sodium channels, NaV 1.1, NaV 1.2, and NaV1.6, have been more accurately defined than those for non-neuronal sodium channels. Explicit IC50’s for NaV1.3, NaV1.4, and NaV1.5 were not determined since the inhibition at the highest concentration tested (30 µM) was <50%. IC50’s are the mean of 3 separate biological replicates of the IC50 determinations for each channel. The error is shown as the 95% confidence interval of the mean IC50. None of the other tested isoforms displayed IC50’s within the 95% confidence interval of the NaV1.6 IC50 and the confidence intervals were well separated as well.
| NaV1.6 | NaV1.1 | NaV1.2 | NaV1.3 | NaV1.4 | NaV1.5 | NaV1.7 | |
|---|---|---|---|---|---|---|---|
| Human IC50 (µM) | 0.051 | 39 | 6.9 | > 30 | > 30 | > 30 | 14 |
| 95% CI | 0.030–0.073 | 31–47 | 1.6–12 | - | - | - | 6.4–22 |
| Human Selectivity hNaV1.X / hNaV1.6 | 1 | 756 | 134 | > 583 | > 583 | > 583 | 276 |
| Mouse IC50 (µM) | 0.058 | 41 | 11 | ||||
| Mouse Selectivity mNaV1.X / mNaV1.6 | 1 | 709 | 191 |
Table 2
Comparison of NBI-921352 potency on human wild-type NaV1.6 and patient-identified gain-of-function variants of NaV1.6.
| WT | T767I | R850Q | N984K | I1327V | N1466K | R1617Q | N1768D | R1872W | N1877S | |
|---|---|---|---|---|---|---|---|---|---|---|
| hNaV1.6 IC50 (µM) | 0.051 | 0.031 | 0.021 | 0.032 | 0.035 | 0.039 | 0.349 | 0.054 | 0.067 | 0.034 |
| 95% CI | 0.030–0.073 | 0.027–0.037 | 0.017–0.026 | 0.029–0.035 | 0.029–0.042 | 0.031–0.049 | 0.28 to0.40 | 0.047–0.065 | 0.053–0.085 | 0.029–0.040 |
| Fold changeWT / Variant | - | 0.6 | 0.4 | 0.6 | 0.7 | 0.8 | 6.8 | 1.1 | 1.3 | 0.7 |
Key resources table
| Reagent type (species) or resource | Designation | Source or reference | Identifiers | Additional information |
|---|---|---|---|---|
| Cell line (H. sapiens) | Expi293F | Thermo Fischer | cat# A14527 | SCN8A mutant transient transfections |
| Cell line (H. sapiens) | FreeStyle 293 F | Thermo Fischer | cat# R710-07 | Stable transfections |
| Strain, strain background (M. musculus) | C57BL/6 J male Scn8aN1768D/+ (stock#400690)x C3HeB/FeJ female (strain#000658).Both Male and Female heterozygous Scn8aN1768D/+ micewere tested | Licensed from Miriam Meisler, Univ. of Michigan.Wagnon et al., 2015 | Colony maintained at The Jackson Laboratory | |
| Strain, strain background (M. musculus) | CF-1, male | Charles River | Code: 023 | |
| Strain, strain background(R. norvegicus) | Sprague Dawley, male | Envigo | Code: 002 | |
| Chemical compound, drug | NBI-921352 | US Patent #10246453 B2 | Compound ID #101 | Synthesized at Xenon Pharmaceuticals |
| Chemical compound, drug | Carbamazepine | Sigma-Aldrich | C4024 | |
| Chemical compound, drug | Phenytoin | Sigma-Aldrich | D4505 | |
| Chemical compound, drug | Lacosamide | Toronto Research Chemicals | L098500 | |
| Gene (H. sapiens) | SCN1A | GenBank | NM_006920 | |
| Gene (H. sapiens) | SCN2A | GenBank | NM_021007 | |
| Gene (H. sapiens) | SCN3A | GenBank | NM_0069220 | |
| Gene (H. sapiens) | SCN4A | GenBank | NM_000334 | |
| Gene (H. sapiens) | SCN5A | GenBank | NM_198056 | |
| Gene (H. sapiens) | SCN8A | GenBank | NM_014191 | |
| Gene (H. sapiens) | SCN9A | GenBank | NM_002977 | |
| Gene (M. musculus) | SCN1A | GenBank | NM_018733.2 | |
| Gene (M. musculus) | SCN2A | GenBank | NP_001092768.1 | |
| Gene (M. musculus) | SCN8A | GenBank | NM_001077499 | |
| Gene (H. sapiens) | SCN1B | GenBank | NM_199037 | |
| Gene (H. sapiens) | FGF13 | GenBank | NM_033642 | |
| Gene (H. sapiens) | CNTN1 | GenBank | NM_001843 | |
| Recombinant DNA reagent | pcDNA4/TO (vector) | Thermo Fischer | cat #V102020 | Vector for SCNxA genes |
| Recombinant DNA reagent | pcDNA6/TR(regulatory vector for tetracycline repressor protein) | Thermo Fischer | cat#V102520 | Vector to generate inducible FreeStyle 293 F and Expi293F |
| Recombinant DNA reagent | pcDNA3.1 (+)(vector) | Thermo Fischer | cat#V79020 | Vector for SCN1B gene |
| Recombinant DNA reagent | pcDNA3.1/Hygro(+) | Thermo Fischer | cat# V87020 | Vector for FGF13 and CNTN1 genes |
Additional files
Download links
A two-part list of links to download the article, or parts of the article, in various formats.
Downloads (link to download the article as PDF)
Open citations (links to open the citations from this article in various online reference manager services)
Cite this article (links to download the citations from this article in formats compatible with various reference manager tools)
NBI-921352, a first-in-class, NaV1.6 selective, sodium channel inhibitor that prevents seizures in Scn8a gain-of-function mice, and wild-type mice and rats
eLife 11:e72468.
https://doi.org/10.7554/eLife.72468


